Estimulación eléctrica neuromuscular para la prevención de la tromboembolia venosa
Referencias
References to studies included in this review
References to studies excluded from this review
References to studies awaiting assessment
References to ongoing studies
Additional references
References to other published versions of this review
Characteristics of studies
Characteristics of included studies [ordered by study ID]
| Methods | Quasi‐randomised case‐controlled trial | |
| Participants | Number of participants: 104 (NMES: 46; low‐dose heparin: 58) Inclusion criteria: neurosurgical patients aged 40 years or older with normal laboratory coagulation values and operated on under general anaesthesia | |
| Interventions | NMES group: preoperative calf muscle stimulation with groups of impulses, followed by Dextran 70 administered postoperatively. Stimulation characteristics included stimulus strength 40 to 50 mA; impulse duration 50 ms; number of impulses per group 6; impulse frequency within groups 8 per second; group frequency 8 per minute. Low‐dose heparin group: Heparin (sodium heparin, Heparin, Lrvens, 5000 IU × 2 subcutaneously) was administered 2 hours preoperatively and was continued daily for 1 week postoperatively. | |
| Outcomes | DVT (Participants were screened by fibrinogen uptake test; whenever possible, a phlebography was performed.) | |
| Notes | Of 122 participants who entered the study, 18 were excluded during the course of the study. The most common reason for not completing the prophylaxis for the intended full week was early discharge from the hospital. One participant died 5 days after clipping of a ruptured intracranial aneurysm. | |
| Risk of bias | ||
| Bias | Authors' judgement | Support for judgement |
| Random sequence generation (selection bias) | High risk | The participant's year of birth was chosen as a method for randomisation. |
| Allocation concealment (selection bias) | High risk | The study was quasi‐randomised, and allocation was not adequately concealed. |
| Blinding of participants and personnel (performance bias) | High risk | No blinding of participants and personnel was reported. |
| Blinding of outcome assessment (detection bias) | High risk | US or CT operator/radiologist was not blinded to patient allocation. |
| Incomplete outcome data (attrition bias) | Low risk | Of 122 participants who entered the study, 18 were excluded during the course of the study. However, the missing outcome data were balanced in numbers across intervention groups, and reasons for missing data were similar across groups. |
| Selective reporting (reporting bias) | Low risk | The study protocol was not available, but it is clear that published reports include all expected outcomes. |
| Other bias | Low risk | None was identified. |
| Methods | Quasi‐randomised case‐controlled trial | |
| Participants | Number of participants: 200 (NMES: 100; no prophylaxis: 100) Inclusion criteria: patients > 25 years of age requiring surgery around the hip joint who underwent surgery within 2 weeks of sustaining trauma and were operated on under spinal anaesthesia Exclusion criteria: established cases of DVT; taking antithrombotic medication; open fractures; pacemakers; other serious life‐threatening conditions, pathological fractures, and associated vascular injuries | |
| Interventions | NMES group: VeinoPlus (Ad Rem Technology, Paris, France) stimulator device for electrostimulation of the calf muscles during surgery. The stimulator device delivered low‐voltage (peak value usually around 15 to 25 V) and small‐energy impulses (below 25 μC per impulse) to calf muscles. Control group: no prophylaxis | |
| Outcomes | DVT (diagnosed by Doppler ultrasound 7 days after surgery) | |
| Notes | ||
| Risk of bias | ||
| Bias | Authors' judgement | Support for judgement |
| Random sequence generation (selection bias) | High risk | Participants were randomised into 2 groups of 100 participants each by odd–even number. |
| Allocation concealment (selection bias) | High risk | The study was quasi‐randomised, and allocation was not adequately concealed. |
| Blinding of participants and personnel (performance bias) | High risk | No blinding was reported. |
| Blinding of outcome assessment (detection bias) | Low risk | The radiologist was blinded about the study and groups of participants. |
| Incomplete outcome data (attrition bias) | Low risk | No outcome data were missing. |
| Selective reporting (reporting bias) | Low risk | The study protocol was not available, but it is clear that published reports include all expected outcomes. |
| Other bias | Low risk | None was identified. |
| Methods | Four‐arm randomised controlled trial | |
| Participants | Number of participants: 160 (conventional care group 40; invigorating and promoting Qi group 40; blood‐activating and damp‐eliminating group 40; acupoint‐combination stimulation group 40) Inclusion criteria: age > 60 years; patients who underwent major surgery, including general surgeries, major gynaecological surgeries, limb fracture repairs, etc.; operative duration > 2 hours; patients on postoperative bed rest who could not get out of bed; and patients who signed the informed consent form Exclusion criteria: inability to implement care measures in non‐compliant patients; patients who dropped out halfway for various reasons; inability to implement interventions in patients with lower limb infection; and inability to implement interventions among patients in critical condition | |
| Interventions | Invigorating and promoting Qi group: postoperative routine care plus bilateral transcutaneous electrical stimulation at Taichong (LR 3) and Zusanli (ST 36) in two 20‐minute sessions per day (morning and afternoon) for 1 week Blood‐activating and damp‐eliminating group: postoperative routine care plus bilateral transcutaneous electrical stimulation at Yinlingquan (SP 9) and Sanyinjiao (SP 6) in two 20‐minute sessions per day (morning and afternoon) for 1 week Acupoint‐combination stimulation group: postoperative routine care plus bilateral transcutaneous electrical stimulation at a combination of 4 acupoints: Taichong (LR 3), Zusanli (ST 36), Yinlingquan (SP 9), and Sanyinjiao (SP 6), in two 20‐minute sessions per day (morning and afternoon) for 1 week Conventional care group: postoperative routine care, including observation, basic care, catheter care, prevention and care of complications, and health education. In addition, participants received help with raising the lower extremities and were given postoperative symptomatic care. | |
| Outcomes | DVT (diagnosed by Doppler ultrasound 7 days after surgery) D‐dimer levels Changes in haemorheology: blood viscosity (including whole blood viscosity and plasma viscosity) | |
| Notes | Data for the 3 NMES groups were combined in analyses. | |
| Risk of bias | ||
| Bias | Authors' judgement | Support for judgement |
| Random sequence generation (selection bias) | Low risk | A random numbers table was used. |
| Allocation concealment (selection bias) | Unclear risk | This was not reported. |
| Blinding of participants and personnel (performance bias) | High risk | No blinding was reported. |
| Blinding of outcome assessment (detection bias) | Unclear risk | This was not reported. |
| Incomplete outcome data (attrition bias) | Low risk | No outcome data were missing. |
| Selective reporting (reporting bias) | Low risk | The study protocol was not available, but it is clear that published reports include all expected outcomes. |
| Other bias | High risk | The study was Industry sponsored. |
| Methods | Three‐arm randomised controlled trial | |
| Participants | Number of participants: 54 (NMES group 18; GCS group 18; IPCD group 18) Inclusion criteria: adult patients undergoing elective laparoscopic fundoplication Exclusion criteria: not reported | |
| Interventions | NMES group: intermittent electrical calf muscle stimulation during operation GCS group: GCS during operation IPCD group: IPCD during operation | |
| Outcomes | Lower extremity venous blood velocity (measured by Doppler ultrasonography during operation) DVT (1 day after operation using venous occlusion plethysmography) PE (1 day after operation using lung perfusion scintigraphy) | |
| Notes | ||
| Risk of bias | ||
| Bias | Authors' judgement | Support for judgement |
| Random sequence generation (selection bias) | Unclear risk | This was not reported. |
| Allocation concealment (selection bias) | Unclear risk | This was not reported. |
| Blinding of participants and personnel (performance bias) | High risk | No blinding was reported. |
| Blinding of outcome assessment (detection bias) | Unclear risk | This was not reported. |
| Incomplete outcome data (attrition bias) | Low risk | No outcome data were missing. |
| Selective reporting (reporting bias) | Low risk | The study protocol was not available, but it is clear that published reports include all expected outcomes. |
| Other bias | Low risk | None was identified. |
| Methods | Three‐arm randomised controlled trial | |
| Participants | Number of participants: 112 (stimulation group 37; control group 40; Dextran 40 group 35) Inclusion criteria: patients who underwent major abdominal surgery | |
| Interventions | Stimulation group: optimised bilateral calf muscle stimulation with groups of impulses during the entire operation.(strength 40 to 50 mA, impulse duration 50 ms; number of impulses per group 6; impulse frequency within group 8 amp/s; group frequency 8 groups/min) Control group: standard routine of the ward. Plasma and whole blood were given to replace blood lost. Dextran 40 group: 500 mL Dextran 40 was given perioperatively and during the first and third postoperative days. | |
| Outcomes | DVT (Participants were screened by fibrinogen uptake test; whenever possible, a phlebography was performed.) PE (diagnosed by pulmonary perfusion scintigraphy) Total VTE PE with DVT | |
| Notes | ||
| Risk of bias | ||
| Bias | Authors' judgement | Support for judgement |
| Random sequence generation (selection bias) | Unclear risk | This was not reported. |
| Allocation concealment (selection bias) | Unclear risk | This was not reported. |
| Blinding of participants and personnel (performance bias) | High risk | No blinding was reported. |
| Blinding of outcome assessment (detection bias) | Unclear risk | This was not reported. |
| Incomplete outcome data (attrition bias) | Low risk | No outcome data were missing. |
| Selective reporting (reporting bias) | Low risk | The study protocol was not available, but it is clear that published reports include all expected outcomes. |
| Other bias | Low risk | None was identified. |
| Methods | Three‐arm randomised controlled trial | |
| Participants | Number of participants: 48 (NMES + low‐dose heparin group 15; low‐dose heparin group 16; saline placebo group 17) Inclusion criteria: patients with C2 to T11 motor complete and incomplete, preserved motor, non‐functional spinal cord injuries | |
| Interventions | NMES + low‐dose heparin group: Tibialis anterior and gastrocnemius‐soleus muscle groups were stimulated bilaterally via 50‐microsecond pulses given at 10 Hz with a 4‐second "on" and 8‐second "off" cycle for 23 hours daily over a 28‐day period + 5000 IU heparin, given subcutaneously every 8 hours. Low‐dose heparin group: 5000 IU heparin, given subcutaneously every 8 hours Placebo: saline | |
| Outcomes | DVT (Venography was performed to confirm positive impedance plethysmography and/or fibrinogen uptake tests.) | |
| Notes | ||
| Risk of bias | ||
| Bias | Authors' judgement | Support for judgement |
| Random sequence generation (selection bias) | Unclear risk | Data about randomisation were not reported. |
| Allocation concealment (selection bias) | Unclear risk | This was not reported. |
| Blinding of participants and personnel (performance bias) | Low risk | Participants in control group received placebo saline. |
| Blinding of outcome assessment (detection bias) | Unclear risk | This was not reported. |
| Incomplete outcome data (attrition bias) | Low risk | All outcomes were reported. |
| Selective reporting (reporting bias) | Low risk | The study protocol was not available, but it is clear that published reports include all expected outcomes. |
| Other bias | Low risk | None was identified. |
| Methods | Quasi‐randomised case‐controlled trial | |
| Participants | Number of participants: 194 (NMES group 50; no prophylaxis group 89; low‐dose heparin group 55) Inclusion criteria: Patients older than 40 years undergoing a major general surgical operation for which they were expected to be in hospital for at least a week were eligible to enter the trial. Exclusion criteria: No exclusions were made on the grounds of pre‐existing cardiorespiratory disease, peripheral vascular disease, or varicose veins; or previous history of thrombosis; but for technical reasons patients undergoing thyroidectomy, left mastectomy, and peripheral arterial reconstruction were not studied. | |
| Interventions | NMES group: intermittent electrical calf muscle stimulation during surgery, use of Thrombophylactor (Rank Precision Industries Ltd., Maidenhead, Berkshire, UK), which delivers an interrupted direct current of 50 milliseconds duration every 5 seconds Low‐dose heparin group: heparin calcium administered subcutaneously 5000 IU, the first dose 2 hours before operation, then every 8 hours until the end of the sixth postoperative day, or until the participant was fully mobile, whichever was longer No prophylaxis group: leg exercises only | |
| Outcomes | DVT (The fibrinogen uptake test was performed on all participants for diagnosis.) | |
| Notes | ||
| Risk of bias | ||
| Bias | Authors' judgement | Support for judgement |
| Random sequence generation (selection bias) | High risk | Randomisation into 3 groups was by month of birth. |
| Allocation concealment (selection bias) | High risk | The study was a quasi‐randomised trial, and allocation was not adequately concealed. |
| Blinding of participants and personnel (performance bias) | High risk | No blinding was reported. |
| Blinding of outcome assessment (detection bias) | Unclear risk | This was not reported. |
| Incomplete outcome data (attrition bias) | Low risk | No outcome data were missing. |
| Selective reporting (reporting bias) | Low risk | The study protocol was not available, but it is clear that published reports include all expected outcomes. |
| Other bias | High risk | This study was industry sponsored. |
| Methods | Two‐arm randomised controlled trial | |
| Participants | Number of participants: 47 (NMES group 26; non‐NMES group 21) Inclusion criteria: trauma patients with Injury Severity Score > 9 who were admitted to the intensive care unit and had a contraindication for prophylactic heparin; significant head injury; operation for extensive organ injury; major retroperitoneal haematoma; liver, spleen, or kidney injury higher than Grade II, managed non‐operatively; other injuries that at the discretion of the trauma surgeon were deemed to be associated with a high likelihood for bleeding; anticipated survival for longer than 7 days; anticipated hospital stay longer than 7 days; and randomisation within 24 hours of injury Exclusion criteria: younger than 18 years; known allergy to contrast material, precluding use of venography, cardiac demand pacemakers, or other implanted stimulators or implants containing metal parts within the area of treatment; spastic paralysis; local infection at the site of application; and history or present evidence of venous thrombosis. Trauma to the extremity was not an exclusion criterion. | |
| Interventions | NMES group: two 30‐minute sessions daily, 1 in the morning and 1 in the evening, using the Lymphavision stimulator (Physiomed Elektromedizin AG, Schnaittach, Germany). Voltage was applied gradually (0 to 120 V) to obtain a slightly visible twitch of the muscles. Stimuli 3 milliseconds long were used at a frequency of 1.75 Hz (105/min) with inversion of polarity every 5 seconds. Non‐NMES group: managed according to standard of care with no thromboprophylaxis for as long as contraindications existed Participants in both groups were allowed to have standard prophylaxis with subcutaneous unfractionated or LMWH when the contraindication for its use was no longer present. | |
| Outcomes | DVT (diagnosed by venography or Doppler ultrasound) Venous blood flow velocity | |
| Notes | ||
| Risk of bias | ||
| Bias | Authors' judgement | Support for judgement |
| Random sequence generation (selection bias) | Unclear risk | Type and method of randomisation are not clearly described. |
| Allocation concealment (selection bias) | Unclear risk | Type and method of randomisation are not clearly described, and allocation concealment cannot be judged confidently. |
| Blinding of participants and personnel (performance bias) | High risk | No blinding was reported. |
| Blinding of outcome assessment (detection bias) | Unclear risk | This was not reported. |
| Incomplete outcome data (attrition bias) | High risk | Missing outcome data were not balanced in numbers across intervention groups: 4 NMES and 9 control participants were excluded from analysis because of lack of outcome evaluation (2 control participants died, 7 control participants and 1 NMES participant were transferred to another hospital, and 2 NMES participants refused to continue the study despite initial consent). |
| Selective reporting (reporting bias) | Low risk | The study protocol was not available, but it is clear that published reports include all expected outcomes. |
| Other bias | High risk | The study was industry sponsored. |
CT: computed tomography.
DVT: deep vein thrombosis.
GCS: graduated compression stockings.
IPCD: intermittent pneumatic compression devices.
LMWH: low molecular weight heparin.
ms: milliseconds.
NMES: neuromuscular electrical stimulation.
PE: pulmonary embolism.
US: ultrasound.
VTE: venous thromboembolism.
Characteristics of excluded studies [ordered by study ID]
| Study | Reason for exclusion |
| Randomised legs instead of participants | |
| Included healthy individuals | |
| Randomised legs instead of participants | |
| Randomised legs instead of participants | |
| Non‐randomised, non‐clinical study | |
| Study did not report outcomes defined in our review paper. Study authors were contacted to clarify if any of our review outcomes had been measured, but no reply was received. | |
| Only 1 leg received NMES; the other leg received other methods of thromboprophylaxis. | |
| Investigated non‐mechanical methods of prophylaxis | |
| Included healthy individuals | |
| Non‐randomised study | |
| Included healthy individuals | |
| Trial was withdrawn before enrolment. | |
| Randomised legs instead of participants | |
| Investigated haemodynamic outcomes and was powered for these outcomes only | |
| NMES arm was terminated early in the pilot phase. | |
| Investigated non‐mechanical methods of prophylaxis | |
| Investigated haemodynamic outcomes only |
NMES: neuromuscular electrical stimulation.
Characteristics of studies awaiting assessment [ordered by study ID]
| Methods | Two‐arm randomised controlled trial |
| Participants | Inclusion criteria: diagnosis of trauma; age 18 years or older; contraindication to anticoagulation expected to last longer than 3 days; projected hospitalisation longer than 3 days; and informed consent Exclusion criteria: inability to wear either IPCs or geko™ (Sky Medical Technology Ltd, Newport, Vermont, USA) on both legs; diagnosis of DVT within 1 month before assessment for enrolment; use of anticoagulant medication within 24 hours of enrolment; leg circumference greater than 24 inches at the location where the geko™ device would be secured to the leg; or presence of cardiac demand pacemaker |
| Interventions | Intervention group: geko™ Comparator group: IPCs |
| Outcomes | Incidence of DVT Compliance VTE Tolerability Venous and arterial physiological flow |
| Notes | Study has been completed. Results of this study are not yet available. |
DVT: deep vein thrombosis.
IPC: intermittent pneumatic compression device.
VTE: venous thromboembolism.
Characteristics of ongoing studies [ordered by study ID]
| Trial name or title | Does the Geko™ nerve stimulator reduce deep vein thrombosis (DVT) and improve healing in ankle fractures? |
| Methods | Randomised controlled trial |
| Participants | Adults aged 18 years or older, either sex, with closed ankle fractures that have required open reduction and internal fixation; able to consent for themselves |
| Interventions | Each participant randomised into 1 of 2 groups, i.e. those who receive the stimulator for a 2‐week period postoperatively and those who do not |
| Outcomes | DVT rate; time to union |
| Starting date | 01/11/2012 |
| Contact information | Wirral University Teaching Hospital |
| Notes | The study has been completed, but results have not yet been published. Study authors contacted, but no reply |
| Trial name or title | Geko™ neuromuscular stimulator vs thromboembolism deterrent stockings (TEDS): DVT prevention study |
| Methods | Open‐label randomised controlled trial |
| Participants | Inclusion criteria: aged 18 years or older; free of significant abnormal findings as determined by medical history (specifically, absence of DVT or haematological disorders); no reported use of medications (prescribed or over‐the‐counter, including herbal remedies) judged to be significant by the principal investigator during the ten (10) days preceding enrolment; able to understand the patient information sheet and willing to sign the written informed consent form; and able and willing to follow the protocol requirements |
| Interventions | Intervention: continual Geko™ use post surgery for 48 hours, then for a minimum of 4 hours/d until discharge Control: continual use of TEDS stockings post surgery for 48 hours, then for a minimum of 4 hours/d until discharge |
| Outcomes | Presence of asymptomatic DVT assessed by duplex ultrasound |
| Starting date | August 2013 |
| Contact information | |
| Notes |
DVT: deep vein thrombosis.
NMES: neuromuscular electrical stimulation.
TEDS: thromboembolism deterrent stockings.
Data and analyses
| Outcome or subgroup title | No. of studies | No. of participants | Statistical method | Effect size |
| 1 Total DVT Show forest plot | 6 | 415 | Odds Ratio (M‐H, Fixed, 95% CI) | 1.01 [0.60, 1.70] |
| Analysis 1.1  Comparison 1 NMES versus alternative prophylaxis, Outcome 1 Total DVT. | ||||
| 2 Asymptomatic DVT Show forest plot | 1 | Odds Ratio (M‐H, Fixed, 95% CI) | Totals not selected | |
| Analysis 1.2  Comparison 1 NMES versus alternative prophylaxis, Outcome 2 Asymptomatic DVT. | ||||
| 3 Symptomatic DVT Show forest plot | 1 | Odds Ratio (M‐H, Fixed, 95% CI) | Totals not selected | |
| Analysis 1.3  Comparison 1 NMES versus alternative prophylaxis, Outcome 3 Symptomatic DVT. | ||||
| 4 PE Show forest plot | 2 | 126 | Odds Ratio (M‐H, Fixed, 95% CI) | 1.31 [0.38, 4.48] |
| Analysis 1.4  Comparison 1 NMES versus alternative prophylaxis, Outcome 4 PE. | ||||
| 5 Total VTE Show forest plot | 1 | Odds Ratio (M‐H, Fixed, 95% CI) | Totals not selected | |
| Analysis 1.5  Comparison 1 NMES versus alternative prophylaxis, Outcome 5 Total VTE. | ||||
| Outcome or subgroup title | No. of studies | No. of participants | Statistical method | Effect size |
| 1 Total DVT Show forest plot | 4 | 576 | Odds Ratio (M‐H, Fixed, 95% CI) | 0.40 [0.23, 0.70] |
| Analysis 2.1  Comparison 2 NMES versus no prophylaxis, Outcome 1 Total DVT. | ||||
| 2 Asymptomatic DVT Show forest plot | 1 | Odds Ratio (M‐H, Fixed, 95% CI) | Totals not selected | |
| Analysis 2.2  Comparison 2 NMES versus no prophylaxis, Outcome 2 Asymptomatic DVT. | ||||
| 3 Symptomatic DVT Show forest plot | 1 | Odds Ratio (M‐H, Fixed, 95% CI) | Totals not selected | |
| Analysis 2.3  Comparison 2 NMES versus no prophylaxis, Outcome 3 Symptomatic DVT. | ||||
| 4 PE Show forest plot | 1 | Odds Ratio (M‐H, Fixed, 95% CI) | Totals not selected | |
| Analysis 2.4 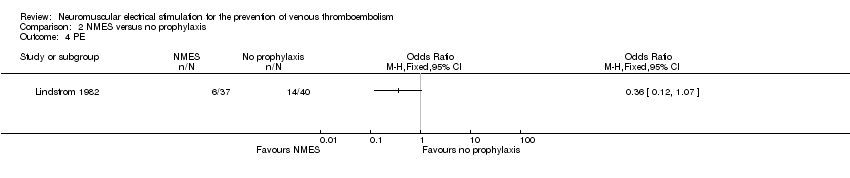 Comparison 2 NMES versus no prophylaxis, Outcome 4 PE. | ||||
| 5 Total VTE Show forest plot | 1 | Odds Ratio (M‐H, Fixed, 95% CI) | Totals not selected | |
| Analysis 2.5  Comparison 2 NMES versus no prophylaxis, Outcome 5 Total VTE. | ||||
| Outcome or subgroup title | No. of studies | No. of participants | Statistical method | Effect size |
| 1 Total DVT Show forest plot | 2 | 194 | Odds Ratio (M‐H, Fixed, 95% CI) | 2.78 [1.19, 6.48] |
| Analysis 3.1  Comparison 3 NMES versus low‐dose heparin, Outcome 1 Total DVT. | ||||
| 2 Asymptomatic DVT Show forest plot | 1 | Odds Ratio (M‐H, Fixed, 95% CI) | Totals not selected | |
| Analysis 3.2  Comparison 3 NMES versus low‐dose heparin, Outcome 2 Asymptomatic DVT. | ||||
| 3 Symptomatic DVT Show forest plot | 1 | Odds Ratio (M‐H, Fixed, 95% CI) | Totals not selected | |
| Analysis 3.3  Comparison 3 NMES versus low‐dose heparin, Outcome 3 Symptomatic DVT. | ||||
| Outcome or subgroup title | No. of studies | No. of participants | Statistical method | Effect size |
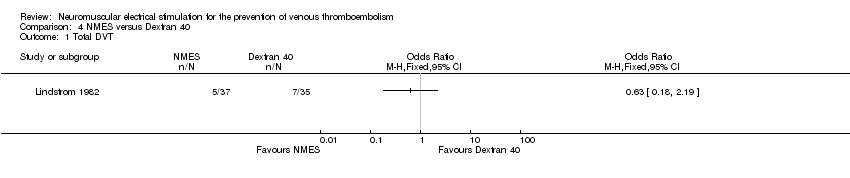
| 1 Total DVT Show forest plot | 1 | Odds Ratio (M‐H, Fixed, 95% CI) | Totals not selected | |
| Analysis 4.1  Comparison 4 NMES versus Dextran 40, Outcome 1 Total DVT. | ||||
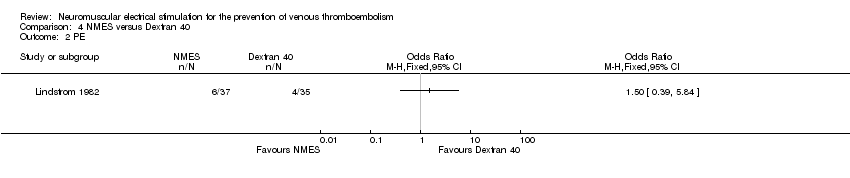
| 2 PE Show forest plot | 1 | Odds Ratio (M‐H, Fixed, 95% CI) | Totals not selected | |
| Analysis 4.2  Comparison 4 NMES versus Dextran 40, Outcome 2 PE. | ||||
| 3 Total VTE Show forest plot | 1 | Odds Ratio (M‐H, Fixed, 95% CI) | Totals not selected | |
| Analysis 4.3 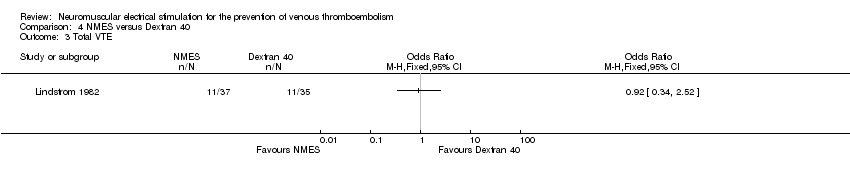 Comparison 4 NMES versus Dextran 40, Outcome 3 Total VTE. | ||||
| Outcome or subgroup title | No. of studies | No. of participants | Statistical method | Effect size |
| 1 Total DVT Show forest plot | 1 | Odds Ratio (M‐H, Fixed, 95% CI) | Totals not selected | |
| Analysis 5.1  Comparison 5 Combined NMES and low‐dose heparin versus no prophylaxis, Outcome 1 Total DVT. | ||||
| Outcome or subgroup title | No. of studies | No. of participants | Statistical method | Effect size |
| 1 Total DVT Show forest plot | 1 | Odds Ratio (M‐H, Fixed, 95% CI) | Totals not selected | |
| Analysis 6.1  Comparison 6 Combined NMES and low‐dose heparin versus low‐dose heparin, Outcome 1 Total DVT. | ||||
| Outcome or subgroup title | No. of studies | No. of participants | Statistical method | Effect size |
| 1 Total DVT Show forest plot | 1 | Odds Ratio (M‐H, Fixed, 95% CI) | Totals not selected | |
| Analysis 7.1  Comparison 7 NMES versus GCS, Outcome 1 Total DVT. | ||||
| 2 PE Show forest plot | 1 | Odds Ratio (M‐H, Fixed, 95% CI) | Totals not selected | |
| Analysis 7.2  Comparison 7 NMES versus GCS, Outcome 2 PE. | ||||
| Outcome or subgroup title | No. of studies | No. of participants | Statistical method | Effect size |
| 1 Total DVT Show forest plot | 1 | Odds Ratio (M‐H, Fixed, 95% CI) | Totals not selected | |
| Analysis 8.1  Comparison 8 NMES versus IPCD, Outcome 1 Total DVT. | ||||
| 2 PE Show forest plot | 1 | Odds Ratio (M‐H, Fixed, 95% CI) | Totals not selected | |
| Analysis 8.2  Comparison 8 NMES versus IPCD, Outcome 2 PE. | ||||

Study flow diagram.

Risk of bias graph: review authors' judgements about each risk of bias item presented as percentages across all included studies.

Risk of bias summary: review authors' judgements about each risk of bias item for each included study.
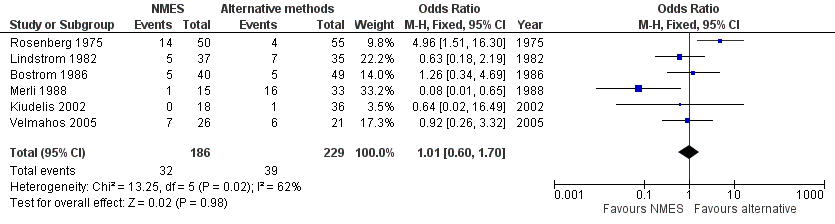
Forest plot of comparison: 1 NMES versus alternative prophylaxis, outcome: 1.1 Total DVT.

Forest plot of comparison: 2 NMES versus no prophylaxis, outcome: 2.1 Total DVT.
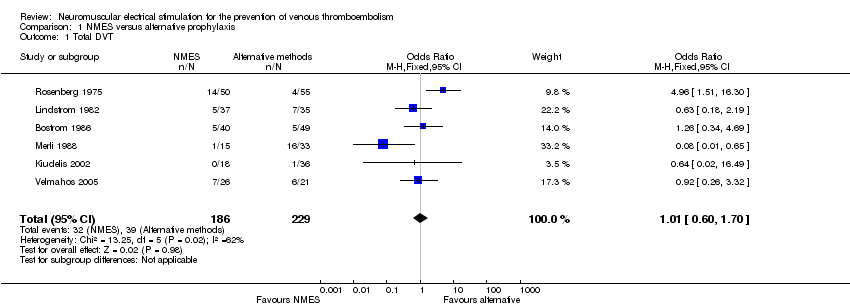
Comparison 1 NMES versus alternative prophylaxis, Outcome 1 Total DVT.

Comparison 1 NMES versus alternative prophylaxis, Outcome 2 Asymptomatic DVT.

Comparison 1 NMES versus alternative prophylaxis, Outcome 3 Symptomatic DVT.
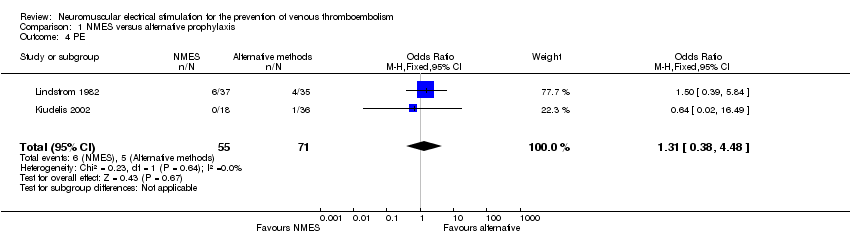
Comparison 1 NMES versus alternative prophylaxis, Outcome 4 PE.
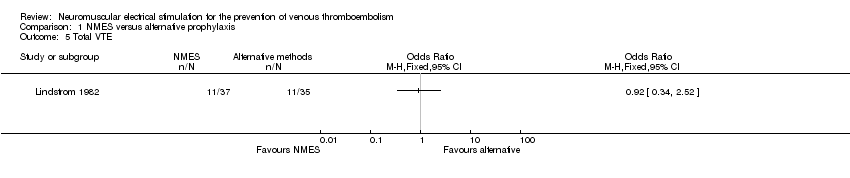
Comparison 1 NMES versus alternative prophylaxis, Outcome 5 Total VTE.

Comparison 2 NMES versus no prophylaxis, Outcome 1 Total DVT.

Comparison 2 NMES versus no prophylaxis, Outcome 2 Asymptomatic DVT.

Comparison 2 NMES versus no prophylaxis, Outcome 3 Symptomatic DVT.

Comparison 2 NMES versus no prophylaxis, Outcome 4 PE.

Comparison 2 NMES versus no prophylaxis, Outcome 5 Total VTE.

Comparison 3 NMES versus low‐dose heparin, Outcome 1 Total DVT.

Comparison 3 NMES versus low‐dose heparin, Outcome 2 Asymptomatic DVT.

Comparison 3 NMES versus low‐dose heparin, Outcome 3 Symptomatic DVT.
Comparison 4 NMES versus Dextran 40, Outcome 1 Total DVT.
Comparison 4 NMES versus Dextran 40, Outcome 2 PE.

Comparison 4 NMES versus Dextran 40, Outcome 3 Total VTE.

Comparison 5 Combined NMES and low‐dose heparin versus no prophylaxis, Outcome 1 Total DVT.
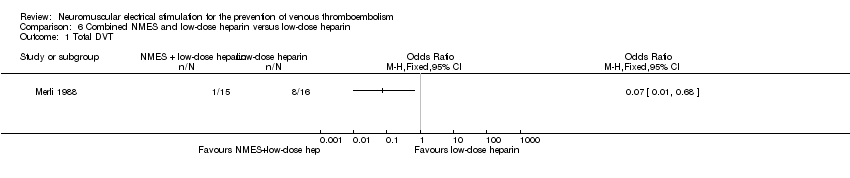
Comparison 6 Combined NMES and low‐dose heparin versus low‐dose heparin, Outcome 1 Total DVT.
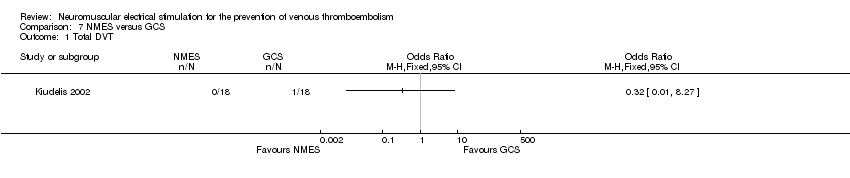
Comparison 7 NMES versus GCS, Outcome 1 Total DVT.

Comparison 7 NMES versus GCS, Outcome 2 PE.
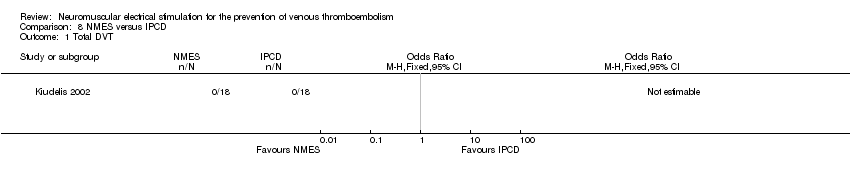
Comparison 8 NMES versus IPCD, Outcome 1 Total DVT.

Comparison 8 NMES versus IPCD, Outcome 2 PE.
| NMES compared to alternative prophylaxis for the prevention of venous thromboembolism | ||||||
| Patient or population: participants at risk of venous thromboembolism | ||||||
| Outcomes | Anticipated absolute effects* (95% CI) | Relative effect | No. of participants | Quality of the evidence | Comments | |
| Risk with alternative prophylaxis | Risk with NMES | |||||
| Total DVT | Study population | OR 1.01 | 415 | ⊕⊕⊝⊝ | ||
| 170 per 1000 | 172 per 1000 | |||||
| Asymptomatic DVT | Study population | OR 1.61 | 89 | ⊕⊕⊝⊝ | ||
| 82 per 1000 | 125 per 1000 | |||||
| Symptomatic DVT | Study population | OR 0.40 | 89 | ⊕⊕⊝⊝ | ||
| 20 per 1000 | 8 per 1000 | |||||
| PE | Study population | OR 1.31 | 126 | ⊕⊕⊝⊝ | ||
| 70 per 1000 | 90 per 1000 | |||||
| Total VTE | Study population | OR 0.92 | 72 | ⊕⊕⊝⊝ | ||
| 314 per 1000 | 297 per 1000 | |||||
| Bleeding (major and minor) | see comment | see comment | not estimable | 415 | ‐ | None of the studies in this comparison reported this outcome. |
| *Assumed control intervention risks were calculated by the mean number of events in control groups of selected studies for each outcome. The risk in the intervention group (and its 95% confidence interval) is based on the assumed risk in the comparison group and the relative effect of the intervention (and its 95% CI). | ||||||
| GRADE Working Group grades of evidence. | ||||||
| aHigh or unclear risk of selection bias, performance bias, and detection bias ‐ downgraded by one level. | ||||||
| NMES compared to no prophylaxis for prevention of venous thromboembolism | ||||||
| Patient or population: participants at risk of venous thromboembolism | ||||||
| Outcomes | Anticipated absolute effects* (95% CI) | Relative effect | No. of participants | Quality of the evidence | Comments | |
| Risk with no prophylaxis | Risk with NMES | |||||
| Total DVT | Study population | OR 0.40 | 576 | ⊕⊕⊕⊝ | ||
| 219 per 1000 | 101 per 1000 | |||||
| Asymptomatic DVT Follow‐up: 7 days | Study population | OR 0.32 | 200 | ⊕⊕⊝⊝ | ||
| 60 per 1000 | 20 per 1000 | |||||
| Symptomatic DVT Follow‐up: 7 days | Study population | OR 0.06 | 160 | ⊕⊕⊝⊝ | ||
| 50 per 1000 | 3 per 1000 | |||||
| PE Follow‐up: 6 days | Study population | OR 0.36 | 77 | ⊕⊕⊝⊝ | ||
| 350 per 1000 | 162 per 1000 | |||||
| Total VTE Follow‐up: 6 days | Study population | OR 0.23 | 77 | ⊕⊕⊝⊝ | ||
| 650 per 1000 | 299 per 1000 | |||||
| Bleeding (major and minor) | see comment | see comment | not estimable | 576 (4 RCTs) | ‐ | None of the studies in this comparison reported this outcome. |
| *Assumed control intervention risks were calculated by the mean number of events in control groups of selected studies for each outcome. The risk in the intervention group (and its 95% confidence interval) is based on the assumed risk in the comparison group and the relative effect of the intervention (and its 95% CI). | ||||||
| GRADE Working Group grades of evidence. | ||||||
| aHigh or unclear risk of selection bias, performance bias, and detection bias ‐ downgraded by one level. | ||||||
| NMES compared to low‐dose heparin for the prevention of venous thromboembolism | ||||||
| Patient or population: participants at risk of venous thromboembolism | ||||||
| Outcomes | Anticipated absolute effects* (95% CI) | Relative effect | No. of participants | Quality of the evidence | Comments | |
| Risk with low‐dose heparin | Risk with NMES | |||||
| Total DVT | Study population | OR 2.78 | 194 | ⊕⊕⊝⊝ | ||
| 87 per 1000 | 208 per 1000 | |||||
| Asymptomatic DVT Follow‐up: 8 days | Study population | OR 1.61 | 89 | ⊕⊕⊝⊝ | ||
| 82 per 1000 | 125 per 1000 | |||||
| Symptomatic DVT Follow‐up: 8 days | Study population | OR 0.40 | 89 | ⊕⊕⊝⊝ | ||
| 20 per 1000 | 8 per 1000 | |||||
| PE | see comment | see comment | not estimable | 194 (2 RCTs) | ‐ | None of the studies in this comparison reported this outcome. |
| Total VTE | see comment | see comment | not estimable | 194 (2 RCTs) | ‐ | None of the studies in this comparison reported this outcome. |
| Bleeding (major and minor) | see comment | see comment | not estimable | 194 (2 RCTs) | ‐ | None of the studies in this comparison reported this outcome. |
| *Assumed control intervention risks were calculated by the mean number of events in control groups of selected studies for each outcome. The risk in the intervention group (and its 95% confidence interval) is based on the assumed risk in the comparison group and the relative effect of the intervention (and its 95% CI). | ||||||
| GRADE Working Group grades of evidence. | ||||||
| aHigh or unclear risk of selection bias, performance bias, and detection bias ‐ downgraded by one level. | ||||||
| NMES compared to Dextran 40 for the prevention of venous thromboembolism | ||||||
| Patient or population: participants at risk of venous thromboembolism | ||||||
| Outcomes | Anticipated absolute effects* (95% CI) | Relative effect | No. of participants | Quality of the evidence | Comments | |
| Risk with Dextran 40 | Risk with NMES | |||||
| Total DVT | Study population | OR 0.63 | 72 | ⊕⊕⊝⊝ | ||
| 200 per 1000 | 136 per 1000 | |||||
| Asymptomatic DVT | see comment | see comment | not estimable | 72 (1 RCT) | ‐ | The single study in this comparison did not report this outcome. |
| Symptomatic DVT | see comment | see comment | not estimable | 72 (1 RCT) | ‐ | The single study in this comparison did not report this outcome. |
| PE Follow‐up: 6 days | Study population | OR 1.50 | 72 | ⊕⊕⊝⊝ | ||
| 114 per 1000 | 162 per 1000 | |||||
| Total VTE Follow‐up: 6 days | Study population | OR 0.92 | 72 | ⊕⊕⊝⊝ | ||
| 314 per 1000 | 297 per 1000 | |||||
| Bleeding (major and minor) | see comment | see comment | not estimable | 72 (1 RCT) | ‐ | The single study in this comparison did not report this outcome. |
| Assumed control intervention risks were calculated by the mean number of events in control groups of selected studies for each outcome. *The risk in the intervention group (and its 95% confidence interval) is based on the assumed risk in the comparison group and the relative effect of the intervention (and its 95% CI). | ||||||
| GRADE Working Group grades of evidence. | ||||||
| aHigh or unclear risk of selection bias, performance bias, and detection bias ‐ downgraded by one level. | ||||||
| Combined NMES and low‐dose heparin compared to no prophylaxis for the prevention of venous thromboembolism | ||||||
| Patient or population: participants at risk of venous thromboembolism | ||||||
| Outcomes | Anticipated absolute effects* (95% CI) | Relative effect | No. of participants | Quality of the evidence | Comments | |
| Risk with no prophylaxis | Risk with combined NMES and low‐dose heparin | |||||
| Total DVT | Study population | OR 0.08 | 32 | ⊕⊕⊝⊝ | ||
| 471 per 1000 | 66 per 1000 | |||||
| Asymptomatic DVT | see comment | see comment | not estimable | 32 (1 RCT) | ‐ | The single study in this comparison did not report this outcome. |
| Symptomatic DVT | see comment | see comment | not estimable | 32 (1 RCT) | ‐ | The single study in this comparison did not report this outcome. |
| PE | see comment | see comment | not estimable | 32 (1 RCT) | ‐ | The single study in this comparison did not report this outcome. |
| Total VTE | see comment | see comment | not estimable | 32 (1 RCT) | ‐ | The single study in this comparison did not report this outcome. |
| Bleeding (major and minor) | see comment | see comment | not estimable | 32 (1 RCT) | ‐ | The single study in this comparison did not report this outcome. |
| *Assumed control intervention risks were calculated by the mean number of events in control groups of selected studies for each outcome. The risk in the intervention group (and its 95% confidence interval) is based on the assumed risk in the comparison group and the relative effect of the intervention (and its 95% CI). | ||||||
| GRADE Working Group grades of evidence. | ||||||
| aHigh or unclear risk of selection bias and detection bias ‐ downgraded by one level. | ||||||
| Combined NMES and low‐dose heparin compared to low‐dose heparin for the prevention of venous thromboembolism | ||||||
| Patient or population: participants at risk of venous thromboembolism | ||||||
| Outcomes | Anticipated absolute effects* (95% CI) | Relative effect | No. of participants | Quality of the evidence | Comments | |
| Risk with low‐dose heparin | Risk with combined NMES and low‐dose heparin | |||||
| Total DVT | Study population | OR 0.07 | 31 | ⊕⊕⊝⊝ | ||
| 500 per 1000 | 65 per 1000 | |||||
| Asymptomatic DVT | see comment | see comment | not estimable | 31 (1 RCT) | ‐ | The single study in this comparison did not report this outcome. |
| Symptomatic DVT | see comment | see comment | not estimable | 31 (1 RCT) | ‐ | The single study in this comparison did not report this outcome. |
| PE | see comment | see comment | not estimable | 31 (1 RCT) | ‐ | The single study in this comparison did not report this outcome. |
| Total VTE | see comment | see comment | not estimable | 31 (1 RCT) | ‐ | The single study in this comparison did not report this outcome. |
| Bleeding (major and minor) | see comment | see comment | not estimable | 31 (1 RCT) | ‐ | The single study in this comparison did not report this outcome. |
| *Assumed control intervention risks were calculated by the mean number of events in control groups of selected studies for each outcome. The risk in the intervention group (and its 95% confidence interval) is based on the assumed risk in the comparison group and the relative effect of the intervention (and its 95% CI). | ||||||
| GRADE Working Group grades of evidence. | ||||||
| aHigh or unclear risk of selection bias and detection bias ‐ downgraded by one level. | ||||||
| NMES compared to GCS for the prevention of venous thromboembolism | ||||||
| Patient or population: participants at risk of venous thromboembolism | ||||||
| Outcomes | Anticipated absolute effects* (95% CI) | Relative effect | No. of participants | Quality of the evidence | Comments | |
| Risk with GCS | Risk with NMES | |||||
| Total DVT | Study population | OR 0.32 | 36 | ⊕⊕⊝⊝ | ||
| 56 per 1000 | 18 per 1000 (1 to 327) | |||||
| Asymptomatic DVT | see comment | see comment | not estimable | 36 (1 RCT) | ‐ | None of the studies in this comparison reported this outcome. |
| Symptomatic DVT | see comment | see comment | not estimable | 36 (1 RCT) | ‐ | None of the studies in this comparison reported this outcome. |
| PE Follow‐up: 1 day | Study population | OR 0.32 | 36 | ⊕⊕⊝⊝ | ||
| 56 per 1000 | 18 per 1000 | |||||
| Total VTE | see comment | see comment | not estimable | 36 (1 RCT) | ‐ | None of the studies in this comparison reported this outcome. |
| Bleeding (major and minor) | see comment | see comment | not estimable | 36 (1 RCT) | ‐ | None of the studies in this comparison reported this outcome. |
| *Assumed control intervention risks were calculated by the mean number of events in control groups of selected studies for each outcome. The risk in the intervention group (and its 95% confidence interval) is based on the assumed risk in the comparison group and the relative effect of the intervention (and its 95% CI). | ||||||
| GRADE Working Group grades of evidence. | ||||||
| aHigh or unclear risk of selection bias, performance bias, and detection bias ‐ downgraded by one level. | ||||||
| NMES compared to IPCD for the prevention of venous thromboembolism | ||||||
| Patient or population: participants at risk of venous thromboembolism | ||||||
| Outcomes | Anticipated absolute effects* (95% CI) | Relative effect | No. of participants | Quality of the evidence | Comments | |
| Risk with IPCD | Risk with NMES | |||||
| Total DVT Follow‐up: 1 day | Study population | not estimable | 36 | ⊕⊕⊝⊝ | No DVT events were recorded. | |
| see comment | see comment | |||||
| Asymptomatic DVT | see comment | see comment | not estimable | 36 (1 RCT) | ‐ | None of the studies in this comparison reported this outcome. |
| Symptomatic DVT | see comment | see comment | not estimable | 36 (1 RCT) | ‐ | None of the studies in this comparison reported this outcome. |
| PE Follow‐up: 1 day | Study population | not estimable | 36 | ⊕⊕⊝⊝ | No PE events were recorded. | |
| see comment | see comment | |||||
| Total VTE | see comment | see comment | not estimable | 36 (1 RCT) | ‐ | None of the studies in this comparison reported this outcome. |
| Bleeding (major and minor) | see comment | see comment | not estimable | 36 (1 RCT) | ‐ | None of the studies in this comparison reported this outcome. |
| *Assumed control intervention risks were calculated by the mean number of events in control groups of selected studies for each outcome. The risk in the intervention group (and its 95% confidence interval) is based on the assumed risk in the comparison group and the relative effect of the intervention (and its 95% CI). | ||||||
| GRADE Working Group grades of evidence. | ||||||
| aHigh or unclear risk of selection bias, performance bias, and detection bias ‐ downgraded by one level. | ||||||
| Study | Device | Frequency (Hz) | Pulse width | Charge (mA) | Voltage (V) | Duration |
| G6805‐II | 30‐100 | NR | NR | 6‐15 | 7 days (20 minutes twice/d) | |
| VEINOPLUS | NR | NR | NR | 15–25 | Only during surgery | |
| Lymphavision | 1.75 | 3 ms | NR | 0‐120 | 7‐14 days (30 minutes twice/d) | |
| Mioritm 021 | NR | NR | 50‐100 | NR | Only during surgery | |
| NR | 10 | 50 μs | NR | NR | 28 days (23 hours/d) | |
| NR | 8 | 50 ms | 40‐50 | NR | 7 days | |
| NR | 8 | 50 ms | 40‐50 | NR | Only during surgery | |
| Thrombophylactor | NR | 50 ms | NR | Adjustable | Only during surgery | |
| NR: rot reported. | ||||||
| Outcome or subgroup title | No. of studies | No. of participants | Statistical method | Effect size |
| 1 Total DVT Show forest plot | 6 | 415 | Odds Ratio (M‐H, Fixed, 95% CI) | 1.01 [0.60, 1.70] |
| 2 Asymptomatic DVT Show forest plot | 1 | Odds Ratio (M‐H, Fixed, 95% CI) | Totals not selected | |
| 3 Symptomatic DVT Show forest plot | 1 | Odds Ratio (M‐H, Fixed, 95% CI) | Totals not selected | |
| 4 PE Show forest plot | 2 | 126 | Odds Ratio (M‐H, Fixed, 95% CI) | 1.31 [0.38, 4.48] |
| 5 Total VTE Show forest plot | 1 | Odds Ratio (M‐H, Fixed, 95% CI) | Totals not selected | |
| Outcome or subgroup title | No. of studies | No. of participants | Statistical method | Effect size |
| 1 Total DVT Show forest plot | 4 | 576 | Odds Ratio (M‐H, Fixed, 95% CI) | 0.40 [0.23, 0.70] |
| 2 Asymptomatic DVT Show forest plot | 1 | Odds Ratio (M‐H, Fixed, 95% CI) | Totals not selected | |
| 3 Symptomatic DVT Show forest plot | 1 | Odds Ratio (M‐H, Fixed, 95% CI) | Totals not selected | |
| 4 PE Show forest plot | 1 | Odds Ratio (M‐H, Fixed, 95% CI) | Totals not selected | |
| 5 Total VTE Show forest plot | 1 | Odds Ratio (M‐H, Fixed, 95% CI) | Totals not selected | |
| Outcome or subgroup title | No. of studies | No. of participants | Statistical method | Effect size |
| 1 Total DVT Show forest plot | 2 | 194 | Odds Ratio (M‐H, Fixed, 95% CI) | 2.78 [1.19, 6.48] |
| 2 Asymptomatic DVT Show forest plot | 1 | Odds Ratio (M‐H, Fixed, 95% CI) | Totals not selected | |
| 3 Symptomatic DVT Show forest plot | 1 | Odds Ratio (M‐H, Fixed, 95% CI) | Totals not selected | |
| Outcome or subgroup title | No. of studies | No. of participants | Statistical method | Effect size |
| 1 Total DVT Show forest plot | 1 | Odds Ratio (M‐H, Fixed, 95% CI) | Totals not selected | |
| 2 PE Show forest plot | 1 | Odds Ratio (M‐H, Fixed, 95% CI) | Totals not selected | |
| 3 Total VTE Show forest plot | 1 | Odds Ratio (M‐H, Fixed, 95% CI) | Totals not selected | |
| Outcome or subgroup title | No. of studies | No. of participants | Statistical method | Effect size |
| 1 Total DVT Show forest plot | 1 | Odds Ratio (M‐H, Fixed, 95% CI) | Totals not selected | |
| Outcome or subgroup title | No. of studies | No. of participants | Statistical method | Effect size |
| 1 Total DVT Show forest plot | 1 | Odds Ratio (M‐H, Fixed, 95% CI) | Totals not selected | |
| Outcome or subgroup title | No. of studies | No. of participants | Statistical method | Effect size |
| 1 Total DVT Show forest plot | 1 | Odds Ratio (M‐H, Fixed, 95% CI) | Totals not selected | |
| 2 PE Show forest plot | 1 | Odds Ratio (M‐H, Fixed, 95% CI) | Totals not selected | |
| Outcome or subgroup title | No. of studies | No. of participants | Statistical method | Effect size |
| 1 Total DVT Show forest plot | 1 | Odds Ratio (M‐H, Fixed, 95% CI) | Totals not selected | |
| 2 PE Show forest plot | 1 | Odds Ratio (M‐H, Fixed, 95% CI) | Totals not selected | |