静脈血栓塞栓症予防に対する神経筋電気刺激
Appendices
Appendix 1. Glossary of terms for lay readers
| Terms | Meaning |
| Anticoagulant | Having the effect of retarding or inhibiting the coagulation or clotting of blood. Anticoagulants are a class of drugs that work to prevent coagulation of blood. |
| Compliance | The action or fact of complying with treatment |
| Deep vein thrombosis (DVT) | Formation of a blood clot in a deep vein ‐ usually in the leg or pelvic veins |
| Endothelium | The tissue that forms a single layer of cells lining various organs and cavities of the body, especially the blood vessels, heart, and lymphatic vessels |
| Factor V Leiden | A mutation of one of the clotting factors in the blood called factor V. This mutation can increase the chance of developing abnormal blood clots (thrombophilia), usually in the veins. |
| Graduated compression stockings (GCS) | Elastic garments worn around the leg, compressing the limb. They help to prevent the occurrence or further progression of venous disorders such as oedema, phlebitis, and thrombosis. |
| Hypercoagulable state | An abnormality of blood coagulation that increases the risk of thrombosis |
| Incidence | The occurrence, rate, or frequency of a disease |
| Intermittent pneumatic compression devices (IPCD) | A therapeutic technique used in medical devices that include an air pump and inflatable auxiliary sleeves, gloves, or boots in a system designed to improve venous circulation in the limbs of patients who suffer oedema or risk of DVT or PE |
| Malignancy | The state or presence of a malignant tumour; cancer |
| Morbidity | The frequency of complications resulting from treatment or disease |
| Mortality | The frequency of death resulting from treatment or disease |
| Neuromuscular electrical stimulation (NMES) | Delivery of electrical impulses via electrodes to the skin over selected muscle groups or nerves to induce an involuntary muscle contraction |
| Oedema | Fluid retention in the body |
| Paraplagia | Paralysis of the legs and lower body, typically caused by spinal injury or disease |
| Pathogenesis | The manner of development of a disease |
| Pharmacology | The science of drugs including their origin, composition, pharmacokinetics, therapeutic use, and toxicology |
| Prophylaxis | Treatment given or action taken to prevent disease |
| Pulmonary embolism (PE) | A sudden blockage in a lung artery that is caused by a blood clot that travels to the lung from a vein in the leg |
| Subcutaneous | Situated or applied under the skin |
| Thrombophilia | An abnormal tendency to develop blood clots |
| Thrombosis | Blood clots in blood vessels |
| Venous thromboembolism | The occurrence DVT or PE or both |
Appendix 2. CENTRAL search strategy
| #1 | MESH DESCRIPTOR Electric Stimulation EXPLODE ALL TREES | 1788 |
| #2 | (neuromusc* near3 stimul*):TI,AB,KY | 495 |
| #3 | (electr* near3 stimul*):TI,AB,KY | 7108 |
| #4 | (musc* near3 stimul*):TI,AB,KY | 711 |
| #5 | (calf* near3 stimul*):TI,AB,KY | 18 |
| #6 | (foot* near3 stimul*):TI,AB,KY | 47 |
| #7 | (lower near3 stimul*):TI,AB,KY | 168 |
| #8 | (limb near3 stimul*):TI,AB,KY | 52 |
| #9 | (peroneal near3 stimul*):TI,AB,KY | 37 |
| #10 | electromyostimul*:TI,AB,KY | 66 |
| #11 | NMES:TI,AB,KY | 242 |
| #12 | geko*:TI,AB,KY | 8 |
| #13 | #1 OR #2 OR #3 OR #4 OR #5 OR #6 OR #7 OR #8 OR #9 OR #10 OR #11 OR #12 | 7873 |
| #14 | MESH DESCRIPTOR Thrombosis | 1267 |
| #15 | MESH DESCRIPTOR Thromboembolism | 921 |
| #16 | MESH DESCRIPTOR Venous Thromboembolism | 258 |
| #17 | MESH DESCRIPTOR Venous Thrombosis EXPLODE ALL TREES | 2041 |
| #18 | (thrombus* or thrombopro* or thrombotic* or thrombolic* or thromboemboli* or thrombos* or embol*):TI,AB,KY | 18996 |
| #19 | MESH DESCRIPTOR Pulmonary Embolism EXPLODE ALL TREES | 748 |
| #20 | (PE or DVT or VTE):TI,AB,KY | 4988 |
| #21 | ((vein* or ven*) near thromb*):TI,AB,KY | 6717 |
| #22 | (blood near3 clot*):TI,AB,KY | 2966 |
| #23 | (pulmonary near3 clot*):TI,AB,KY | 5 |
| #24 | (lung near3 clot*):TI,AB,KY | 4 |
| #25 | (venous near3 stasis):TI,AB,KY | 128 |
| #26 | (venous near3 empty*):TI,AB,KY | 10 |
| #27 | (blood near3 stasis):TI,AB,KY | 453 |
| #28 | (blood near3 supply):TI,AB,KY | 7412 |
| #29 | MESH DESCRIPTOR Hemodynamics EXPLODE ALL TREES | 46548 |
| #30 | MESH DESCRIPTOR Lower Extremity EXPLODE ALL TREES WITH QUALIFIERS BS | 1521 |
| #31 | (blood near3 flow):TI,AB,KY | 12698 |
| #32 | hemodynamic*:TI,AB,KY | 21594 |
| #33 | haemodynamic*:TI,AB,KY | 5411 |
| #34 | fibrinoly*:TI,AB,KY | 4822 |
| #35 | #14 OR #15 OR #16 OR #17 OR #18 OR #19 OR #20 OR #21 OR #22 OR #23 OR #24 OR #25 OR #26 OR #27 OR #28 OR #29 OR #30 OR #31 OR #32 OR #33 OR #34 | 93374 |
| #36 | #13 AND #35 | 709 |

Study flow diagram.

Risk of bias graph: review authors' judgements about each risk of bias item presented as percentages across all included studies.

Risk of bias summary: review authors' judgements about each risk of bias item for each included study.
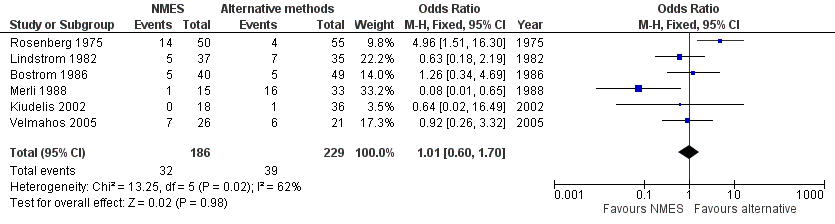
Forest plot of comparison: 1 NMES versus alternative prophylaxis, outcome: 1.1 Total DVT.

Forest plot of comparison: 2 NMES versus no prophylaxis, outcome: 2.1 Total DVT.
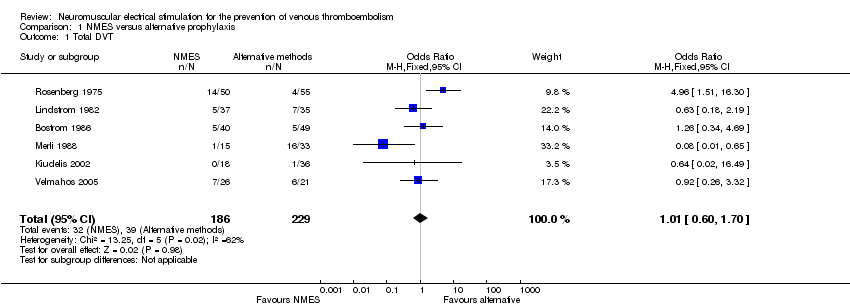
Comparison 1 NMES versus alternative prophylaxis, Outcome 1 Total DVT.

Comparison 1 NMES versus alternative prophylaxis, Outcome 2 Asymptomatic DVT.

Comparison 1 NMES versus alternative prophylaxis, Outcome 3 Symptomatic DVT.
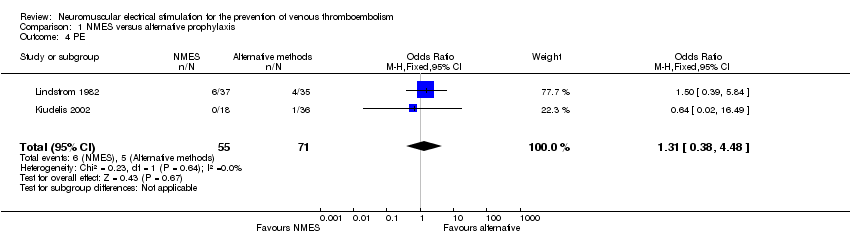
Comparison 1 NMES versus alternative prophylaxis, Outcome 4 PE.
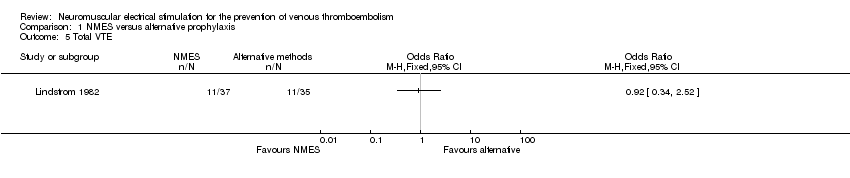
Comparison 1 NMES versus alternative prophylaxis, Outcome 5 Total VTE.

Comparison 2 NMES versus no prophylaxis, Outcome 1 Total DVT.

Comparison 2 NMES versus no prophylaxis, Outcome 2 Asymptomatic DVT.

Comparison 2 NMES versus no prophylaxis, Outcome 3 Symptomatic DVT.
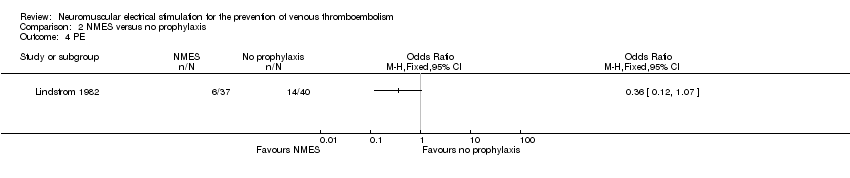
Comparison 2 NMES versus no prophylaxis, Outcome 4 PE.

Comparison 2 NMES versus no prophylaxis, Outcome 5 Total VTE.

Comparison 3 NMES versus low‐dose heparin, Outcome 1 Total DVT.

Comparison 3 NMES versus low‐dose heparin, Outcome 2 Asymptomatic DVT.

Comparison 3 NMES versus low‐dose heparin, Outcome 3 Symptomatic DVT.
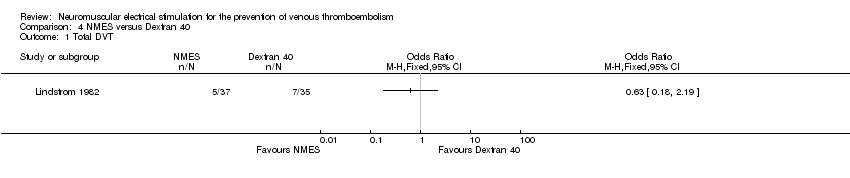
Comparison 4 NMES versus Dextran 40, Outcome 1 Total DVT.
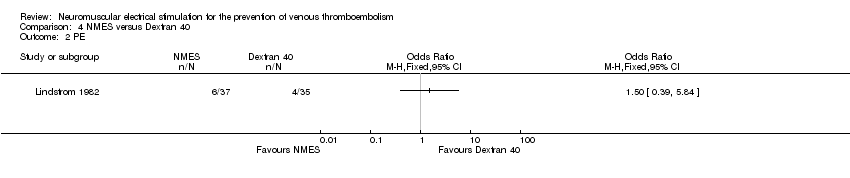
Comparison 4 NMES versus Dextran 40, Outcome 2 PE.
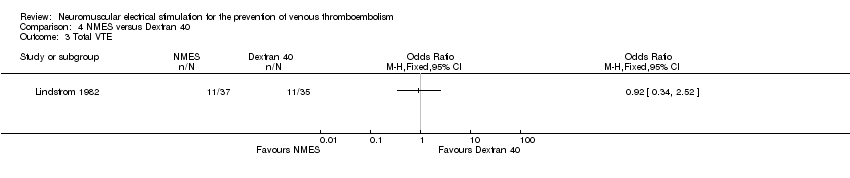
Comparison 4 NMES versus Dextran 40, Outcome 3 Total VTE.

Comparison 5 Combined NMES and low‐dose heparin versus no prophylaxis, Outcome 1 Total DVT.
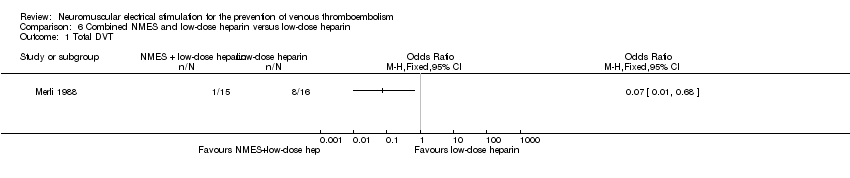
Comparison 6 Combined NMES and low‐dose heparin versus low‐dose heparin, Outcome 1 Total DVT.
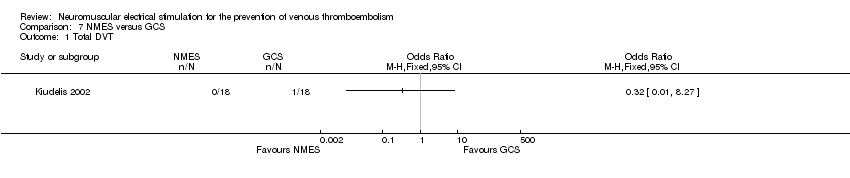
Comparison 7 NMES versus GCS, Outcome 1 Total DVT.

Comparison 7 NMES versus GCS, Outcome 2 PE.
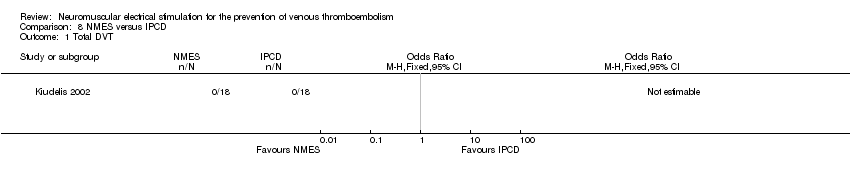
Comparison 8 NMES versus IPCD, Outcome 1 Total DVT.

Comparison 8 NMES versus IPCD, Outcome 2 PE.
| NMES compared to alternative prophylaxis for the prevention of venous thromboembolism | ||||||
| Patient or population: participants at risk of venous thromboembolism | ||||||
| Outcomes | Anticipated absolute effects* (95% CI) | Relative effect | No. of participants | Quality of the evidence | Comments | |
| Risk with alternative prophylaxis | Risk with NMES | |||||
| Total DVT | Study population | OR 1.01 | 415 | ⊕⊕⊝⊝ | ||
| 170 per 1000 | 172 per 1000 | |||||
| Asymptomatic DVT | Study population | OR 1.61 | 89 | ⊕⊕⊝⊝ | ||
| 82 per 1000 | 125 per 1000 | |||||
| Symptomatic DVT | Study population | OR 0.40 | 89 | ⊕⊕⊝⊝ | ||
| 20 per 1000 | 8 per 1000 | |||||
| PE | Study population | OR 1.31 | 126 | ⊕⊕⊝⊝ | ||
| 70 per 1000 | 90 per 1000 | |||||
| Total VTE | Study population | OR 0.92 | 72 | ⊕⊕⊝⊝ | ||
| 314 per 1000 | 297 per 1000 | |||||
| Bleeding (major and minor) | see comment | see comment | not estimable | 415 | ‐ | None of the studies in this comparison reported this outcome. |
| *Assumed control intervention risks were calculated by the mean number of events in control groups of selected studies for each outcome. The risk in the intervention group (and its 95% confidence interval) is based on the assumed risk in the comparison group and the relative effect of the intervention (and its 95% CI). | ||||||
| GRADE Working Group grades of evidence. | ||||||
| aHigh or unclear risk of selection bias, performance bias, and detection bias ‐ downgraded by one level. | ||||||
| NMES compared to no prophylaxis for prevention of venous thromboembolism | ||||||
| Patient or population: participants at risk of venous thromboembolism | ||||||
| Outcomes | Anticipated absolute effects* (95% CI) | Relative effect | No. of participants | Quality of the evidence | Comments | |
| Risk with no prophylaxis | Risk with NMES | |||||
| Total DVT | Study population | OR 0.40 | 576 | ⊕⊕⊕⊝ | ||
| 219 per 1000 | 101 per 1000 | |||||
| Asymptomatic DVT Follow‐up: 7 days | Study population | OR 0.32 | 200 | ⊕⊕⊝⊝ | ||
| 60 per 1000 | 20 per 1000 | |||||
| Symptomatic DVT Follow‐up: 7 days | Study population | OR 0.06 | 160 | ⊕⊕⊝⊝ | ||
| 50 per 1000 | 3 per 1000 | |||||
| PE Follow‐up: 6 days | Study population | OR 0.36 | 77 | ⊕⊕⊝⊝ | ||
| 350 per 1000 | 162 per 1000 | |||||
| Total VTE Follow‐up: 6 days | Study population | OR 0.23 | 77 | ⊕⊕⊝⊝ | ||
| 650 per 1000 | 299 per 1000 | |||||
| Bleeding (major and minor) | see comment | see comment | not estimable | 576 (4 RCTs) | ‐ | None of the studies in this comparison reported this outcome. |
| *Assumed control intervention risks were calculated by the mean number of events in control groups of selected studies for each outcome. The risk in the intervention group (and its 95% confidence interval) is based on the assumed risk in the comparison group and the relative effect of the intervention (and its 95% CI). | ||||||
| GRADE Working Group grades of evidence. | ||||||
| aHigh or unclear risk of selection bias, performance bias, and detection bias ‐ downgraded by one level. | ||||||
| NMES compared to low‐dose heparin for the prevention of venous thromboembolism | ||||||
| Patient or population: participants at risk of venous thromboembolism | ||||||
| Outcomes | Anticipated absolute effects* (95% CI) | Relative effect | No. of participants | Quality of the evidence | Comments | |
| Risk with low‐dose heparin | Risk with NMES | |||||
| Total DVT | Study population | OR 2.78 | 194 | ⊕⊕⊝⊝ | ||
| 87 per 1000 | 208 per 1000 | |||||
| Asymptomatic DVT Follow‐up: 8 days | Study population | OR 1.61 | 89 | ⊕⊕⊝⊝ | ||
| 82 per 1000 | 125 per 1000 | |||||
| Symptomatic DVT Follow‐up: 8 days | Study population | OR 0.40 | 89 | ⊕⊕⊝⊝ | ||
| 20 per 1000 | 8 per 1000 | |||||
| PE | see comment | see comment | not estimable | 194 (2 RCTs) | ‐ | None of the studies in this comparison reported this outcome. |
| Total VTE | see comment | see comment | not estimable | 194 (2 RCTs) | ‐ | None of the studies in this comparison reported this outcome. |
| Bleeding (major and minor) | see comment | see comment | not estimable | 194 (2 RCTs) | ‐ | None of the studies in this comparison reported this outcome. |
| *Assumed control intervention risks were calculated by the mean number of events in control groups of selected studies for each outcome. The risk in the intervention group (and its 95% confidence interval) is based on the assumed risk in the comparison group and the relative effect of the intervention (and its 95% CI). | ||||||
| GRADE Working Group grades of evidence. | ||||||
| aHigh or unclear risk of selection bias, performance bias, and detection bias ‐ downgraded by one level. | ||||||
| NMES compared to Dextran 40 for the prevention of venous thromboembolism | ||||||
| Patient or population: participants at risk of venous thromboembolism | ||||||
| Outcomes | Anticipated absolute effects* (95% CI) | Relative effect | No. of participants | Quality of the evidence | Comments | |
| Risk with Dextran 40 | Risk with NMES | |||||
| Total DVT | Study population | OR 0.63 | 72 | ⊕⊕⊝⊝ | ||
| 200 per 1000 | 136 per 1000 | |||||
| Asymptomatic DVT | see comment | see comment | not estimable | 72 (1 RCT) | ‐ | The single study in this comparison did not report this outcome. |
| Symptomatic DVT | see comment | see comment | not estimable | 72 (1 RCT) | ‐ | The single study in this comparison did not report this outcome. |
| PE Follow‐up: 6 days | Study population | OR 1.50 | 72 | ⊕⊕⊝⊝ | ||
| 114 per 1000 | 162 per 1000 | |||||
| Total VTE Follow‐up: 6 days | Study population | OR 0.92 | 72 | ⊕⊕⊝⊝ | ||
| 314 per 1000 | 297 per 1000 | |||||
| Bleeding (major and minor) | see comment | see comment | not estimable | 72 (1 RCT) | ‐ | The single study in this comparison did not report this outcome. |
| Assumed control intervention risks were calculated by the mean number of events in control groups of selected studies for each outcome. *The risk in the intervention group (and its 95% confidence interval) is based on the assumed risk in the comparison group and the relative effect of the intervention (and its 95% CI). | ||||||
| GRADE Working Group grades of evidence. | ||||||
| aHigh or unclear risk of selection bias, performance bias, and detection bias ‐ downgraded by one level. | ||||||
| Combined NMES and low‐dose heparin compared to no prophylaxis for the prevention of venous thromboembolism | ||||||
| Patient or population: participants at risk of venous thromboembolism | ||||||
| Outcomes | Anticipated absolute effects* (95% CI) | Relative effect | No. of participants | Quality of the evidence | Comments | |
| Risk with no prophylaxis | Risk with combined NMES and low‐dose heparin | |||||
| Total DVT | Study population | OR 0.08 | 32 | ⊕⊕⊝⊝ | ||
| 471 per 1000 | 66 per 1000 | |||||
| Asymptomatic DVT | see comment | see comment | not estimable | 32 (1 RCT) | ‐ | The single study in this comparison did not report this outcome. |
| Symptomatic DVT | see comment | see comment | not estimable | 32 (1 RCT) | ‐ | The single study in this comparison did not report this outcome. |
| PE | see comment | see comment | not estimable | 32 (1 RCT) | ‐ | The single study in this comparison did not report this outcome. |
| Total VTE | see comment | see comment | not estimable | 32 (1 RCT) | ‐ | The single study in this comparison did not report this outcome. |
| Bleeding (major and minor) | see comment | see comment | not estimable | 32 (1 RCT) | ‐ | The single study in this comparison did not report this outcome. |
| *Assumed control intervention risks were calculated by the mean number of events in control groups of selected studies for each outcome. The risk in the intervention group (and its 95% confidence interval) is based on the assumed risk in the comparison group and the relative effect of the intervention (and its 95% CI). | ||||||
| GRADE Working Group grades of evidence. | ||||||
| aHigh or unclear risk of selection bias and detection bias ‐ downgraded by one level. | ||||||
| Combined NMES and low‐dose heparin compared to low‐dose heparin for the prevention of venous thromboembolism | ||||||
| Patient or population: participants at risk of venous thromboembolism | ||||||
| Outcomes | Anticipated absolute effects* (95% CI) | Relative effect | No. of participants | Quality of the evidence | Comments | |
| Risk with low‐dose heparin | Risk with combined NMES and low‐dose heparin | |||||
| Total DVT | Study population | OR 0.07 | 31 | ⊕⊕⊝⊝ | ||
| 500 per 1000 | 65 per 1000 | |||||
| Asymptomatic DVT | see comment | see comment | not estimable | 31 (1 RCT) | ‐ | The single study in this comparison did not report this outcome. |
| Symptomatic DVT | see comment | see comment | not estimable | 31 (1 RCT) | ‐ | The single study in this comparison did not report this outcome. |
| PE | see comment | see comment | not estimable | 31 (1 RCT) | ‐ | The single study in this comparison did not report this outcome. |
| Total VTE | see comment | see comment | not estimable | 31 (1 RCT) | ‐ | The single study in this comparison did not report this outcome. |
| Bleeding (major and minor) | see comment | see comment | not estimable | 31 (1 RCT) | ‐ | The single study in this comparison did not report this outcome. |
| *Assumed control intervention risks were calculated by the mean number of events in control groups of selected studies for each outcome. The risk in the intervention group (and its 95% confidence interval) is based on the assumed risk in the comparison group and the relative effect of the intervention (and its 95% CI). | ||||||
| GRADE Working Group grades of evidence. | ||||||
| aHigh or unclear risk of selection bias and detection bias ‐ downgraded by one level. | ||||||
| NMES compared to GCS for the prevention of venous thromboembolism | ||||||
| Patient or population: participants at risk of venous thromboembolism | ||||||
| Outcomes | Anticipated absolute effects* (95% CI) | Relative effect | No. of participants | Quality of the evidence | Comments | |
| Risk with GCS | Risk with NMES | |||||
| Total DVT | Study population | OR 0.32 | 36 | ⊕⊕⊝⊝ | ||
| 56 per 1000 | 18 per 1000 (1 to 327) | |||||
| Asymptomatic DVT | see comment | see comment | not estimable | 36 (1 RCT) | ‐ | None of the studies in this comparison reported this outcome. |
| Symptomatic DVT | see comment | see comment | not estimable | 36 (1 RCT) | ‐ | None of the studies in this comparison reported this outcome. |
| PE Follow‐up: 1 day | Study population | OR 0.32 | 36 | ⊕⊕⊝⊝ | ||
| 56 per 1000 | 18 per 1000 | |||||
| Total VTE | see comment | see comment | not estimable | 36 (1 RCT) | ‐ | None of the studies in this comparison reported this outcome. |
| Bleeding (major and minor) | see comment | see comment | not estimable | 36 (1 RCT) | ‐ | None of the studies in this comparison reported this outcome. |
| *Assumed control intervention risks were calculated by the mean number of events in control groups of selected studies for each outcome. The risk in the intervention group (and its 95% confidence interval) is based on the assumed risk in the comparison group and the relative effect of the intervention (and its 95% CI). | ||||||
| GRADE Working Group grades of evidence. | ||||||
| aHigh or unclear risk of selection bias, performance bias, and detection bias ‐ downgraded by one level. | ||||||
| NMES compared to IPCD for the prevention of venous thromboembolism | ||||||
| Patient or population: participants at risk of venous thromboembolism | ||||||
| Outcomes | Anticipated absolute effects* (95% CI) | Relative effect | No. of participants | Quality of the evidence | Comments | |
| Risk with IPCD | Risk with NMES | |||||
| Total DVT Follow‐up: 1 day | Study population | not estimable | 36 | ⊕⊕⊝⊝ | No DVT events were recorded. | |
| see comment | see comment | |||||
| Asymptomatic DVT | see comment | see comment | not estimable | 36 (1 RCT) | ‐ | None of the studies in this comparison reported this outcome. |
| Symptomatic DVT | see comment | see comment | not estimable | 36 (1 RCT) | ‐ | None of the studies in this comparison reported this outcome. |
| PE Follow‐up: 1 day | Study population | not estimable | 36 | ⊕⊕⊝⊝ | No PE events were recorded. | |
| see comment | see comment | |||||
| Total VTE | see comment | see comment | not estimable | 36 (1 RCT) | ‐ | None of the studies in this comparison reported this outcome. |
| Bleeding (major and minor) | see comment | see comment | not estimable | 36 (1 RCT) | ‐ | None of the studies in this comparison reported this outcome. |
| *Assumed control intervention risks were calculated by the mean number of events in control groups of selected studies for each outcome. The risk in the intervention group (and its 95% confidence interval) is based on the assumed risk in the comparison group and the relative effect of the intervention (and its 95% CI). | ||||||
| GRADE Working Group grades of evidence. | ||||||
| aHigh or unclear risk of selection bias, performance bias, and detection bias ‐ downgraded by one level. | ||||||
| Study | Device | Frequency (Hz) | Pulse width | Charge (mA) | Voltage (V) | Duration |
| G6805‐II | 30‐100 | NR | NR | 6‐15 | 7 days (20 minutes twice/d) | |
| VEINOPLUS | NR | NR | NR | 15–25 | Only during surgery | |
| Lymphavision | 1.75 | 3 ms | NR | 0‐120 | 7‐14 days (30 minutes twice/d) | |
| Mioritm 021 | NR | NR | 50‐100 | NR | Only during surgery | |
| NR | 10 | 50 μs | NR | NR | 28 days (23 hours/d) | |
| NR | 8 | 50 ms | 40‐50 | NR | 7 days | |
| NR | 8 | 50 ms | 40‐50 | NR | Only during surgery | |
| Thrombophylactor | NR | 50 ms | NR | Adjustable | Only during surgery | |
| NR: rot reported. | ||||||
| Outcome or subgroup title | No. of studies | No. of participants | Statistical method | Effect size |
| 1 Total DVT Show forest plot | 6 | 415 | Odds Ratio (M‐H, Fixed, 95% CI) | 1.01 [0.60, 1.70] |
| 2 Asymptomatic DVT Show forest plot | 1 | Odds Ratio (M‐H, Fixed, 95% CI) | Totals not selected | |
| 3 Symptomatic DVT Show forest plot | 1 | Odds Ratio (M‐H, Fixed, 95% CI) | Totals not selected | |
| 4 PE Show forest plot | 2 | 126 | Odds Ratio (M‐H, Fixed, 95% CI) | 1.31 [0.38, 4.48] |
| 5 Total VTE Show forest plot | 1 | Odds Ratio (M‐H, Fixed, 95% CI) | Totals not selected | |
| Outcome or subgroup title | No. of studies | No. of participants | Statistical method | Effect size |
| 1 Total DVT Show forest plot | 4 | 576 | Odds Ratio (M‐H, Fixed, 95% CI) | 0.40 [0.23, 0.70] |
| 2 Asymptomatic DVT Show forest plot | 1 | Odds Ratio (M‐H, Fixed, 95% CI) | Totals not selected | |
| 3 Symptomatic DVT Show forest plot | 1 | Odds Ratio (M‐H, Fixed, 95% CI) | Totals not selected | |
| 4 PE Show forest plot | 1 | Odds Ratio (M‐H, Fixed, 95% CI) | Totals not selected | |
| 5 Total VTE Show forest plot | 1 | Odds Ratio (M‐H, Fixed, 95% CI) | Totals not selected | |
| Outcome or subgroup title | No. of studies | No. of participants | Statistical method | Effect size |
| 1 Total DVT Show forest plot | 2 | 194 | Odds Ratio (M‐H, Fixed, 95% CI) | 2.78 [1.19, 6.48] |
| 2 Asymptomatic DVT Show forest plot | 1 | Odds Ratio (M‐H, Fixed, 95% CI) | Totals not selected | |
| 3 Symptomatic DVT Show forest plot | 1 | Odds Ratio (M‐H, Fixed, 95% CI) | Totals not selected | |
| Outcome or subgroup title | No. of studies | No. of participants | Statistical method | Effect size |
| 1 Total DVT Show forest plot | 1 | Odds Ratio (M‐H, Fixed, 95% CI) | Totals not selected | |
| 2 PE Show forest plot | 1 | Odds Ratio (M‐H, Fixed, 95% CI) | Totals not selected | |
| 3 Total VTE Show forest plot | 1 | Odds Ratio (M‐H, Fixed, 95% CI) | Totals not selected | |
| Outcome or subgroup title | No. of studies | No. of participants | Statistical method | Effect size |
| 1 Total DVT Show forest plot | 1 | Odds Ratio (M‐H, Fixed, 95% CI) | Totals not selected | |
| Outcome or subgroup title | No. of studies | No. of participants | Statistical method | Effect size |
| 1 Total DVT Show forest plot | 1 | Odds Ratio (M‐H, Fixed, 95% CI) | Totals not selected | |
| Outcome or subgroup title | No. of studies | No. of participants | Statistical method | Effect size |
| 1 Total DVT Show forest plot | 1 | Odds Ratio (M‐H, Fixed, 95% CI) | Totals not selected | |
| 2 PE Show forest plot | 1 | Odds Ratio (M‐H, Fixed, 95% CI) | Totals not selected | |
| Outcome or subgroup title | No. of studies | No. of participants | Statistical method | Effect size |
| 1 Total DVT Show forest plot | 1 | Odds Ratio (M‐H, Fixed, 95% CI) | Totals not selected | |
| 2 PE Show forest plot | 1 | Odds Ratio (M‐H, Fixed, 95% CI) | Totals not selected | |