| Whole body vibration plus mixed exercise versus control |
| Patient or population: individuals with fibromyalgia
Setting: unspecified
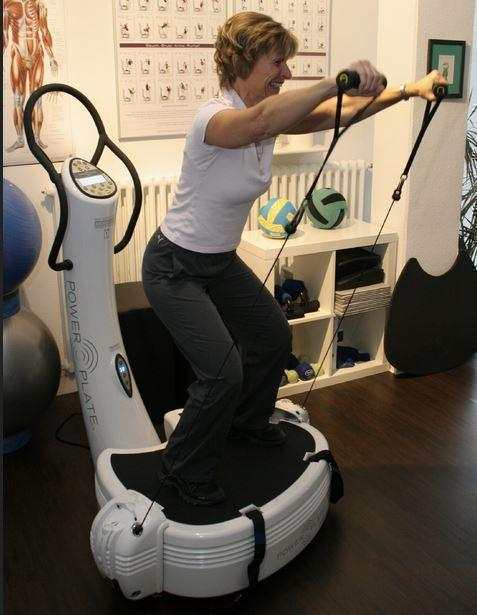
Intervention: WBV + MX
Comparison: control |
| Health‐related quality of life
assessed by FIQ total scale, 0‐100, 0 is best | Mean health‐related quality of life was 59.64 points at the end of the study | Mean health‐related quality of life in the intervention group was 16.02 points lower (31.57 lower to 0.47 lower) at post‐test than in the control group | ‐ | 21
(1 RCT) | ♁◯◯◯
VERY LOWa,b | Absolute difference: 16% improvement (95% CI 32% to 0.5% improvement). Relative change: 24% (47% to 0.7%)c NNTBd: 3 (2 to 237) |
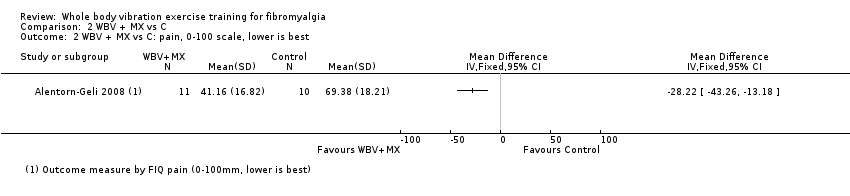
| Pain Intensity
assessed by FIQ scale, 0 to 100 mm, 0 is no pain | Mean pain intensity was 69.38 mm in the control group at the end of the study | Mean pain Intensity in the intervention group was 28.22 mm lower (43.26 lower to 13.18 lower) at post‐test than in the control group | ‐ | 21
(1 RCT) | ♁◯◯◯
VERY LOWa,b | Absolute difference: 28% (95% CI 43% to 13%). Relative difference: 39% (95% CI 18% to 60%) NNTBd: 2 (1 to 4) |
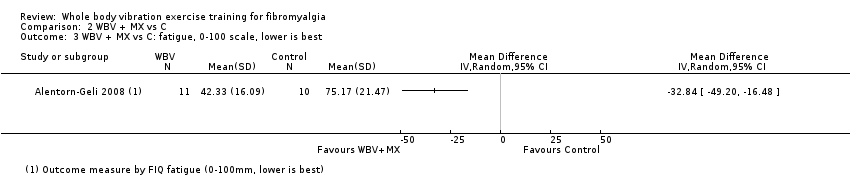
| Fatigue
assessed by FIQ scale, 0 to 100 mm, 0 is best | Mean fatigue was 75.17 mm at the end of the study | Mean fatigue in the intervention group was 32.84 mm lower (49.2 lower to 16.48 lower) at post‐test than in the control group | ‐ | 21
(1 RCT) | ♁◯◯◯
VERY LOWa,b | Absolute difference: 33% (95% CI 49% to 16%). Relative difference: 47% (95% CI 23% to 70%) NNTBd: 2 (1 to 4) |
| Stiffness
assessed by FIQ scale, 0 to 100 mm scale, 0 is best | Mean stiffness was 68.71 mm at the end of the study | Mean stiffness in the intervention group was 26.27 mm lower (42.96 lower to 9.58 lower) at post‐test than in the control group | ‐ | 21
(1 RCT) | ♁◯◯◯
VERY LOWa,b | Absolute difference 26% (95% CI 43% to 10%). Relative difference: 36.5% (95% CI 60% to 23%) NNTBd: 2 (1 to 6) |
| Physical function | Not measured | Not measured | ‐ | Not measured | Not measured | Not measured |
| Adverse events (narrative) | Alentorn‐Geli 2008: "This program neither exacerbated FM‐related symptoms nor resulted in musculoskeletal injuries; however, 1 patient exhibited a mild anxiety attack on the first session of WBV" (page 978) Sañudo 2013: "This study, however, demonstrated that WBV training is safe (no adverse events)..." (page 683) |
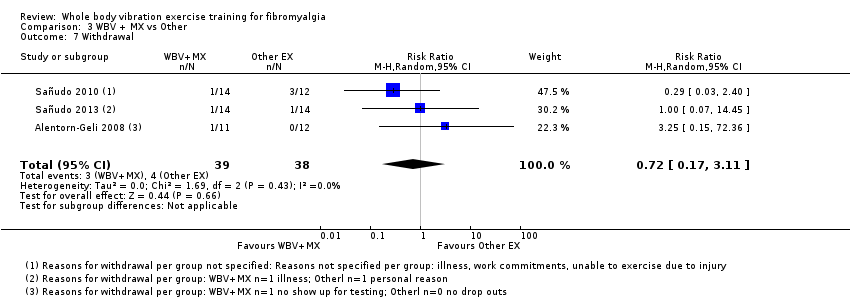
| All‐cause withdrawal
assessed by number of people who dropped out | 33 per 100 (7 of 21) | 8 per 100
(2 of 25) | RR 0.25, 95% CI 0.06 to 1.12 | 46
(2 RCTs) | ♁◯◯◯
VERY LOWa,b | Absolute risk difference: 24% (95% CI 3 to 51) NNTHd: n/a |
| *Risk in the intervention group (and its 95% confidence interval) is based on assumed risk in the comparison group and relative effect of the intervention (and its 95% CI)
CI: confidence interval; NNTB: number needed to treat for an additional beneficial outcome; NNTH: number needed to treat for an additional harmful outcome; OR: odds ratio; RR: risk ratio |
| GRADE Working Group grades of evidence
High quality: We are very confident that the true effect lies close to that of the estimate of the effect
Moderate quality: We are moderately confident in the effect estimate: The true effect is likely to be close to the estimate of the effect, but there is a possibility that it is substantially different
Low quality: Our confidence in the effect estimate is limited: The true effect may be substantially different from the estimate of the effect
Very low quality: We have very little confidence in the effect estimate: The true effect is likely to be substantially different from the estimate of effect |