Scolaris Content Display Scolaris Content Display

Study flow diagram.
Figuras y tablas -
Figure 1

Study flow diagram.

Risk of bias summary: review authors' judgments about each risk of bias item for each included study.
Figuras y tablas -
Figure 2

Risk of bias summary: review authors' judgments about each risk of bias item for each included study.

Risk of bias graph: review authors' judgments about each risk of bias item presented as percentages across all included studies.
Figuras y tablas -
Figure 3

Risk of bias graph: review authors' judgments about each risk of bias item presented as percentages across all included studies.

Comparison 1 NBAS or NBO versus control, Outcome 1 Quality of caregiver‐infant interaction: postintervention.
Figuras y tablas -
Analysis 1.1

Comparison 1 NBAS or NBO versus control, Outcome 1 Quality of caregiver‐infant interaction: postintervention.

Comparison 1 NBAS or NBO versus control, Outcome 2 Caregiver mental health (maternal depression): EPDS postintervention score.
Figuras y tablas -
Analysis 1.2

Comparison 1 NBAS or NBO versus control, Outcome 2 Caregiver mental health (maternal depression): EPDS postintervention score.

Comparison 1 NBAS or NBO versus control, Outcome 3 Caregiver mental health (maternal depression): EPDS postintervention score (dichotomous data).
Figuras y tablas -
Analysis 1.3

Comparison 1 NBAS or NBO versus control, Outcome 3 Caregiver mental health (maternal depression): EPDS postintervention score (dichotomous data).

Comparison 1 NBAS or NBO versus control, Outcome 4 Infant social, emotional, cognitive and motor development.
Figuras y tablas -
Analysis 1.4

Comparison 1 NBAS or NBO versus control, Outcome 4 Infant social, emotional, cognitive and motor development.

Comparison 1 NBAS or NBO versus control, Outcome 5 Caregiver perception of infant.
Figuras y tablas -
Analysis 1.5

Comparison 1 NBAS or NBO versus control, Outcome 5 Caregiver perception of infant.

Comparison 1 NBAS or NBO versus control, Outcome 6 Caregiver knowledge of infant behaviour (multiple choice factual questions).
Figuras y tablas -
Analysis 1.6

Comparison 1 NBAS or NBO versus control, Outcome 6 Caregiver knowledge of infant behaviour (multiple choice factual questions).

Comparison 1 NBAS or NBO versus control, Outcome 7 Caregiver stress.
Figuras y tablas -
Analysis 1.7

Comparison 1 NBAS or NBO versus control, Outcome 7 Caregiver stress.

Comparison 2 NBAS or NBO versus control: subgroup analysis, Outcome 1 Quality of caregiver‐infant interaction.
Figuras y tablas -
Analysis 2.1

Comparison 2 NBAS or NBO versus control: subgroup analysis, Outcome 1 Quality of caregiver‐infant interaction.

Summary of findings for the main comparison. Summary of findings: NBAS or NBO versus control for caregiver‐infant interaction, caregiver mental health, and caregiver functioning

NBAS or NBO versus control for caregiver‐infant interaction, caregiver mental health, and caregiver functioning

Patient or population: caregiver‐infant dyads

Settings: hospitals, clinics, home

Intervention: NBAS or NBO

Comparison: NBAS or NBO administered with no interaction

Outcomes

Illustrative comparative risks* (95% CI)

Relative effect
(95% CI)

Number of participants
(studies)

Quality of the evidence
(GRADE)

Assumed risk

Corresponding risk

Control group

NBAS or NBO

Quality of caregiver‐infant interaction (parental sensitivity, attunement, etc.); continuous data

Assessed at postintervention using validated assessment scales for caregiver‐infant interaction: higher scores indicate better outcome

The mean score for quality of caregiver‐infant interaction ranged across control groups from 3.72 to 51.90

The mean caregiver‐infant interaction score in the intervention groups was 0.53 lower (0.90 lower to 0.17 lower)

304
(7 studies)

⊕⊕⊝⊝
Very low1

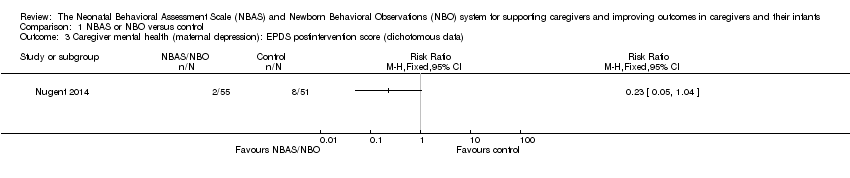
Caregiver mental health (depression), dichotomous data

Assessed at postintervention using the EPDS; lower scores indicate less depression

Low‐risk population

RR 0.23 (0.05 to 1.04)

106

(1 study)

⊕⊕⊝⊝
Low2

157 per 1000

36 per 1000

(8 to 163)

Medium‐risk population

NA

NA

High‐risk population

NA

NA

Infant social, emotional, cognitive and motor development

Assessed when infant aged 4 months, using the BSID; higher scores indicate better development

The mean score for infant mental development in the control group was 107.83

The mean score for infant mental development in the intervention groups was0.13 lower (0.48 lower to 0.22 higher)

125

(1 study)

⊕⊕⊝⊝
Low2

Caregiver perception of infant (parents' perception of the degree of difficult temperament of the infant)

Assessed at postintervention, 8 weeks after delivery; higher score indicates better outcome

The mean score for caregiver perception of infant in the control group was 18.90

The mean score for caregiver perception of the infant in the intervention group was 0.36 lower (0.95 lower to 0.24 higher)

44

(1 study)

⊕⊕⊝⊝
Low2

Caregiver stress (maternal perceptions of her adjustment to the parenting role)

Assessed when infant aged 4 months, using the PSI

The mean score for parent‐related caregiver stress in the control group was 2.19

The mean score for parent‐related caregiver stress in the intervention groups was0.00 (0.35 lower to 0.35 higher)

125

(1 study)

⊕⊕⊝⊝
Low2

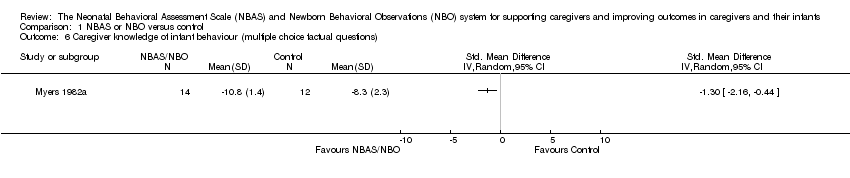
Caregiver knowledge (related to infants' physical capacities, including reflexes and senses)

Assessed at postintervention, using multiple choice factual questions; higher scores indicate better outcome

The mean score for caregiver knowledge in the control groups was8.30

The mean score for caregiver knowledge in the intervention groups was 1.30 higher (0.44 to 2.16 higher)

26

(1 study)

⊕⊕⊝⊝
Very low1

*The basis for the assumed risk (e.g. the median control group risk across studies) is provided in footnotes. The corresponding risk (and its 95% CI) is based on the assumed risk in the comparison group and the relative effect of the intervention (and its 95% CI).
BSID: Bayley Scales of Infant Development; CI: confidence interval; EPDS: Edinburgh Postnatal Depression Scale; NA: not applicable; NBAS: Neonatal Behavioural Assessment Scale; NBO: Newborn Behavioural Observations system; PSI: Parenting Stress Index; RR: risk ratio; SMD: standardised mean difference.

GRADE Working Group grades of evidence
High quality: further research is very unlikely to change our confidence in the estimate of effect.
Moderate quality: further research is likely to have an important impact on our confidence in the estimate of effect and may change the estimate.
Low quality: further research is very likely to have an important impact on our confidence in the estimate of effect and is likely to change the estimate.
Very low quality: we are very uncertain about the estimate.

1Downgraded due to risk of bias due to poor quality research (e.g. limitations in design, including inadequate randomisation or allocation procedures, together with attrition, which ranged from 4% to 20% in seven studies – none of which conducted an intention‐to‐treat analysis), inconsistency for the main outcome due to high levels of heterogeneity for the NBAS; and indirectness in terms of the low levels of generalisability to wider risk groups within the population.

2Downgraded due to risk of bias due to poor quality research (e.g. limitations in design, including inadequate randomisation or allocation procedures, together with attrition, which ranged from 4% to 20% in seven studies – none of which conducted an intention‐to‐treat analysis), and indirectness in terms of the low levels of generalisability to wider risk groups within the population.

Figuras y tablas -
Summary of findings for the main comparison. Summary of findings: NBAS or NBO versus control for caregiver‐infant interaction, caregiver mental health, and caregiver functioning
Table 1. Unused methods table

Unit of analysis issues

Cluster‐randomised trials

The randomisation of clusters can result in an overestimate of the precision of the results (with a higher risk of a type I error) when their use has not been compensated for in the analysis. Had we included a cluster‐RCT, we planned to explore whether the authors had adequately controlled for the effects of clustering in the study. When they had, and when there was little difference between the study designs, and when there was unlikely to be an interaction between the effect of the intervention and the choice of randomisation method, we planned to combine the data from the cluster‐RCT with data from individual RCTs. When the effects of clustering had not been controlled for properly, we planned to derive an estimate of the intracluster correlation coefficient (ICC) from the study or that of a similar population, and to report whether an ICC had been used and conduct sensitivity analyses to determine the effect of using an ICC. We also planned to assess the impact of including data from a cluster‐RCT on the inclusion of the study in the meta‐analyses using a sensitivity analysis to explore the effects of the randomisation method. However, no cluster RCTs were identified or included.

Trials with multiple treatments groups

In the event that we had identified a multi‐arm study in which the NBAS and NBO had been compared with an alternative treatment and a control group, we planned to only extract data from two arms (e.g. NBAS and control group). In the event that we had identified a multi‐arm study in which the NBAS had been compared with the NBO and involved only one control group, we planned to combine the data from the NBAS and NBO arms for primary analyses and to conduct secondary, subgroup analyses and split the control group data. However, we identified no multiple treatment groups.

Cross‐over trials

Cross‐over trials are not possible with this type of intervention, and none were identified.

Assessment of reporting bias

We planned to draw funnel plots (estimated differences in treatment effects against their standard error) if there was a sufficient number of included studies (e.g. more than 10), to identify asymmetry due to publication bias and other small study effects. We also planned to assess whether there had been selective reporting of outcomes and to assess the impact of this using a sensitivity analysis. However, there were insufficient studies to undertake this analysis.

Subgroup analysis and investigation of heterogeneity

We planned to explore possible reasons for heterogeneity by undertaking the following, additional subgroup analyses, scrutinising studies to determine the extent of between‐trial differences.

  1. Level of vulnerability of infant and caregiver (e.g. caregiver age, family socioeconomic status, infant health, etc.).

  2. Caregiver parity (whether first‐time or experienced caregivers).

  3. Whether mothers only, fathers only, or both caregivers are present at the session.

  4. Whether single or multiple sessions were conducted.

  5. Setting in which the sessions were held.

However, it was only possible to undertake subgroup analysis for NBAS versus NBO, due to the small number of studies.

Sensitivity analysis

We planned to conduct sensitivity analyses on the basis of method of sequence generation only, to assess the robustness of the results, but this was not possible due to the small number of studies.

NBAS: Neonatal Behavioral Assessment Scale; NBO: Newborn Behavioral Observations system; RCT: randomised controlled trial.

Figuras y tablas -
Table 1. Unused methods table
Comparison 1. NBAS or NBO versus control

Outcome or subgroup title

No. of studies

No. of participants

Statistical method

Effect size

1 Quality of caregiver‐infant interaction: postintervention Show forest plot

7

304

Std. Mean Difference (IV, Random, 95% CI)

‐0.53 [‐0.90, ‐0.17]

2 Caregiver mental health (maternal depression): EPDS postintervention score Show forest plot

1

Std. Mean Difference (IV, Random, 95% CI)

Subtotals only

3 Caregiver mental health (maternal depression): EPDS postintervention score (dichotomous data) Show forest plot

1

Risk Ratio (M‐H, Fixed, 95% CI)

Totals not selected

4 Infant social, emotional, cognitive and motor development Show forest plot

1

Std. Mean Difference (IV, Random, 95% CI)

Totals not selected

4.1 BSID: mental development

1

Std. Mean Difference (IV, Random, 95% CI)

0.0 [0.0, 0.0]

4.2 BSID: psychomotor development

1

Std. Mean Difference (IV, Random, 95% CI)

0.0 [0.0, 0.0]

5 Caregiver perception of infant Show forest plot

1

Std. Mean Difference (IV, Random, 95% CI)

Subtotals only

6 Caregiver knowledge of infant behaviour (multiple choice factual questions) Show forest plot

1

Std. Mean Difference (IV, Random, 95% CI)

Totals not selected

7 Caregiver stress Show forest plot

1

Std. Mean Difference (IV, Random, 95% CI)

Totals not selected

7.1 PSI: parent‐related sources of stress

1

Std. Mean Difference (IV, Random, 95% CI)

0.0 [0.0, 0.0]

7.2 PSI: child‐related sources of stress

1

Std. Mean Difference (IV, Random, 95% CI)

0.0 [0.0, 0.0]

Figuras y tablas -
Comparison 1. NBAS or NBO versus control
Comparison 2. NBAS or NBO versus control: subgroup analysis

Outcome or subgroup title

No. of studies

No. of participants

Statistical method

Effect size

1 Quality of caregiver‐infant interaction Show forest plot

7

304

Std. Mean Difference (IV, Random, 95% CI)

‐0.53 [‐0.90, ‐0.17]

1.1 NBAS

5

231

Std. Mean Difference (IV, Random, 95% CI)

‐0.49 [‐0.99, ‐0.00]

1.2 NBO

2

73

Std. Mean Difference (IV, Random, 95% CI)

‐0.69 [‐1.18, ‐0.20]

Figuras y tablas -
Comparison 2. NBAS or NBO versus control: subgroup analysis