雷诺嗪治疗稳定型心绞痛
摘要
研究背景
稳定型心绞痛是一种慢性疾病,对死亡率和生活质量有显著影响;它起源于大血管或微血管。雷诺嗪是一种二线抗心绞痛药物,被批准用于稳定型心绞痛患者。然而,雷诺嗪对心绞痛患者的影响被认为是适度的,临床相关性不确定。
研究目的
评价与安慰剂或任何其他抗心绞痛药物相比,雷诺嗪用作单一疗法或附加疗法对稳定型心绞痛患者的心血管和非心血管死亡率、全因死亡率、生活质量、急性心肌梗死发生率、心绞痛发作频率和不良事件发生率的影响。
检索策略
我们在2016年2月检索了Cochrane对照试验中心注册库(Cochrane Central Register of Controlled Trials, CENTRAL)、MEDLINE、Embase和会议记录引文索引‐科学(Conference Proceedings Citation Index ‐ Science),以及区域数据库和试验注册库。我们还筛选了参考文献列表。
纳入排除标准
直接比较雷诺嗪与安慰剂或其他抗心绞痛药物治疗稳定型心绞痛患者的疗效的随机对照试验(Randomised Controlled Trials, RCT)符合纳入条件。
资料收集与分析
两位作者独立筛选研究、提取资料并评价偏倚风险。使用固定效应模型,采用风险比(Risk Ratios, RR)、均差(Mean Differences, MD)和标准化均差(Standardised Mean Differences, SMD)以及95%置信区间(confidence intervals, CI)计算治疗效果的估计值。在我们发现存在统计学上显著的异质性(Chi²P<0.10)的地方,我们使用随机效应模型来合并估计值。在我们发现存在相当大的异质性(I²≥75%)的地方,未进行meta分析。我们使用GRADE标准评价证据质量,并将Review Manager 5.3的资料导入GRADE profiler软件(GRADEpro GDT)以生成“结果概要”表格。
主要结果
我们纳入了17项RCTs(9975名受试者,平均年龄为63.3岁)。我们发现非常有限的(或没有)资料说明大多数计划的比较。合并数据用于说明雷诺嗪与安慰剂的比较。总体而言,偏倚风险被评价为不明确。
对于附加的雷诺嗪与安慰剂相比,没有资料可用于估计心血管和非心血管死亡率。我们发现雷诺嗪对以下方面的影响存在不确定性:全因死亡率(每日两次1000mg, RR=0.83, 95% CI [0.26, 2.71];3项研究,2053名受试者;低质量证据);生活质量(任何剂量,SMD=0.25, 95% CI [‐0.01, 0.52];4项研究,1563名受试者;I²=73%;中等质量证据);和非致死性急性心肌梗死(Acute Myocardial Infarction, AMI)发生率(每日两次1000mg, RR=0.40,95% CI [0.08, 2.07];2项研究,1509名受试者;低质量证据)。每日两次服用添加的1000mg雷诺嗪可降低心绞痛发作的频率(MD=‐0.66, 95% CI [‐0.97, ‐0.35];3项研究,2004名受试者;I²=39%;中等质量证据),但增加了发生非严重不良事件的风险(RR=1.22, 95% CI [1.06, 1.40];3项研究,2053名受试者;中等质量证据)。
雷诺嗪作为单一疗法与安慰剂相比,我们发现它对心血管死亡率的影响不确定(每日两次1000mg, RR=1.03, 95% CI [0.56, 1.88];1项研究,2604名受试者;低质量证据)。没有资料可用于估计非心血管死亡率。我们还发现雷诺嗪对全因死亡率(每日两次1000mg, RR=1.00, 95% CI [0.81, 1.25];3项研究,6249名受试者;低质量证据)、生活质量(每日两次1000mg, MD=0.28, 95% CI [‐1.57, 2.13];3项研究,2254名受试者;中等质量证据),非致死性AMI发病率(任何剂量,RR=0.88, 95% CI [0.69, 1.12];3项研究,2983名受试者;I²=50%;低质量证据)和心绞痛发作频率(任何剂量,MD=0.08, 95% CI [‐0.85, 1.01];2项研究,402名受试者;低质量证据)的影响不确定。我们发现与雷诺嗪相关的非严重不良事件的发生风险增加(任何剂量,RR=1.50; 95% CI [1.12, 2.00];3项研究,947名受试者;极低质量证据)。
作者结论
我们发现质量极低的证据表明,接受雷诺嗪作为单一疗法的稳定型心绞痛患者与被给予安慰剂的患者相比发生非严重不良事件的风险增加。我们发现低质量证据表明,接受雷诺嗪治疗的稳定型心绞痛患者与被给予安慰剂的患者相比,其发生心血管死亡率(雷诺嗪作为单一疗法)、全因死亡和非致死性AMI以及心绞痛发作频率(雷诺嗪作为单一疗法)风险的影响不确定。中等质量证据表明,稳定型心绞痛患者接受雷诺嗪与接受安慰剂的患者相比,其生活质量受到的影响不确定。中等质量的证据还表明,接受雷诺嗪作为附加治疗的稳定型心绞痛患者与被给予安慰剂的患者相比,心绞痛发作较少,但出现非严重不良事件的风险增加。
PICO
简语概要
雷诺嗪治疗稳定型心绞痛患者
系统综述问题
我们想知道雷诺嗪(一种预防心绞痛的药物)是否比假药(安慰剂)或其他药物能更有效地治疗稳定型心絞痛。
系统综述背景
心绞痛是指心脏不能获得足够的氧气或因其他压力所引起的突发胸痛。稳定型心绞痛患者对何时发生心绞痛症状有一个可以预测的模式。心绞痛会因体力劳动恶化,并能通过休息或一些药物缓解。雷诺嗪对于已经服用其他药物治疗心绞痛的心绞痛患者是一种相对较新的药物。
文献检索日期
证据检索截至2016年2月。
研究经费来源
大多数研究要么全部(9/17)要么部分(3/17)由制药公司资助,两项研究没有获得外部资金,三项研究没有申报资金来源。
研究特征
我们纳入了17项研究,共涉及9975名成年受试者,研究持续时间为1至92周。
主要研究结果
我们只比较了雷诺嗪和安慰剂,因为其他比较的资料很少。证据尚无法表明稳定性心绞痛患者每日两次单独服用1000mg雷诺嗪其对死于心脏相关疾病的几率的影响。没有证据表明雷诺嗪是否会改变患者死于非心脏相关原因的风险。
虽然证据不确定每日两次服用1000mg雷诺嗪对因任何原因死亡的几率、生活质量、心脏病发作的可能性或心绞痛发作频率的影响(单独服用雷诺嗪),但是当雷诺嗪与其他抗心绞痛药物一起服用时确实适度降低了每周心绞痛发作的次数。每日两次服用1000mg雷诺嗪会增加出现头晕、恶心和便秘的风险(轻度不良事件)。
证据质量
总体而言,证据质量因发生轻度不良事件的可能被评价为极低质量(对于单独服用雷诺嗪的人)。提示死于心脏相关(当单独服用雷诺嗪时)或任何原因的疾病、心脏病发作以及心绞痛发作的频率(当单独服用雷诺嗪时)的证据也很少。我们发现了关于生活质量、心绞痛发作频率和发生轻度不良事件的几率的中等质量证据(对于同时服用雷诺嗪和其他抗心绞痛药物的人)。
证据质量低与研究方法的问题和报告方式、以及资料太少有关,以至于无法精确计算估计值。
Authors' conclusions
Summary of findings
| Ranolazine (add‐on therapy) versus placebo for stable angina pectoris* | ||||||
| Patient or population: patients with stable angina pectoris | ||||||
| Outcomes | Illustrative comparative risks** (95% CI) | Relative effect | No of Participants | Quality of the evidence | Comments | |
| Assumed risk | Corresponding risk | |||||
| Placebo | Ranolazine | |||||
| Cardiovascular mortality ‐ not reported | See comment | See comment | Not estimable | ‐ | See comment | No data were available for this outcome |
| Non‐cardiovascular mortality ‐ not reported | See comment | See comment | Not estimable | ‐ | See comment | No data were available for this outcome |
| All‐cause mortality | 6 per 1000 | 5 per 1000 | RR 0.83 | 2053 | ⊕⊕⊝⊝ | Ranolazine 1000 mg twice daily |
| Quality of life | Mean quality of life in control group participants was | Mean quality of life in intervention group participants was | 1563 | ⊕⊕⊕⊝ | Ranolazine any dose (SMD 0.25, 95% CI ‐0.01 to 0.52) | |
| AMI incidence | 7 per 1000 | 3 per 1000 | RR 0.40 | 1509 | ⊕⊕⊝⊝ | Ranolazine 1000 mg twice daily |
| Angina episodes frequency | Mean angina episode frequency in control group participants was | Mean angina episodes frequency in intervention group participants was | 2004 | ⊕⊕⊕⊝ | Ranolazine 1000 mg twice daily (MD ‐0.66, 95% CI ‐0.97 to ‐0.35) | |
| Adverse events incidence | 241 per 1000 | 294 per 1000 | RR 1.22 | 2123 | ⊕⊕⊕⊝ | Ranolazine 1000 mg twice daily |
| *Add‐on therapy: refers to the addition of ranolazine to an antianginal regimen already in course. The results reported correspond to the comparisons (data and analyses) 3 and 4 of the review (involving ranolazine given at 1000mg twice daily or any dosage); this is specified in the Comments column. **The assumed risk is based on the median control group risk across studies. The corresponding risk (and its 95% confidence interval) is based on the assumed risk in the comparison group and the relative effect of the intervention (and its 95% CI). | ||||||
| GRADE Working Group grades of evidence | ||||||
| ¹ Quality of evidence was downgraded one level due to unclear risk of bias regarding blinding of outcome assessment and incomplete outcome data | ||||||
| Ranolazine (monotherapy) versus placebo for stable angina pectoris* | ||||||
| Patient or population: patients with stable angina pectoris | ||||||
| Outcomes | Illustrative comparative risks** (95% CI) | Relative effect | No of Participants | Quality of the evidence | Comments | |
| Assumed risk | Corresponding risk | |||||
| Placebo | Ranolazine | |||||
| Cardiovascular mortality | 16 per 1000 | 16 per 1000 | RR 1.03 | 2604 | ⊕⊕⊝⊝ | Ranolazine 1000 mg twice daily |
| Non‐cardiovascular mortality ‐ not reported | See comment | See comment | Not estimable | ‐ | See comment | No data were available for this outcome |
| All‐cause mortality | 49 per 1000 | 49 per 1000 | RR 1.00 | 6249 | ⊕⊕⊝⊝ | Ranolazine 1000 mg twice daily |
| Quality of life | Mean quality of life in control group participants was | Mean quality of life in intervention group participants was | 2256 | ⊕⊕⊕⊝ | Ranolazine 1000 mg twice daily (MD 0.28. 95% CI ‐1.57 to 2.13) | |
| AMI incidence | 85 per 1000 | 75 per 1000 | RR 0.88 | 2983 | ⊕⊕⊝⊝ | Ranolazine any dose |
| Angina episodes frequency | Mean angina episode frequency in control group participants was | Mean angina episode frequency in intervention group participants was | 402 | ⊕⊕⊝⊝ | Ranolazine any dose (MD 0.08, 95% CI ‐0.85 to 1.01) | |
| Adverse events incidence | 131 per 1000 | 197 per 1000 | RR 1.50 | 947 | ⊕⊝⊝⊝ | Ranolazine any dose |
| *Monotherapy: refers to the administration of ranolazine as the only antianginal drug. The results reported correspond to the comparisons (data and analyses) 1 and 2 of the review (involving ranolazine given at 1000mg twice daily or any dosage); this is specified in the Comments column. **The assumed risk is based on the median control group risk across studies. The corresponding risk (and its 95% confidence interval) is based on the assumed risk in the comparison group and the relative effect of the intervention (and its 95% CI). | ||||||
| GRADE Working Group grades of evidence | ||||||
| ¹ Quality of evidence was downgraded one level due to unclear risk of bias regarding allocation concealment and high risk of bias regarding selective reporting | ||||||
Background
Description of the condition
Stable angina pectoris is a chronic medical condition which is generally regarded as the main symptomatic manifestation of coronary artery disease (CAD) (NICE 2011). It has been estimated that stable angina affects 58% of people with CAD (Ohman 2016), with an annual mortality rate ranging between 1.2% and 2.4% (ESC 2013). Apart from its associated risk of cardiovascular death and recurrent myocardial infarction, stable angina pectoris has a significant impact on functional capacity and quality of life (Scirica 2009). Mortality is higher among people with angina than those with no history of CAD at baseline (O'Toole 2008). Factors associated with a poorer prognosis include more severe symptoms, male sex, abnormal resting electrocardiogram (ECG) and previous myocardial infarction (O'Toole 2008).
A universal definition for stable angina has not been agreed internationally, but it is usually recognised clinically by its character, location and relationship to provocative stimuli (NICE 2010). Angina pain is identified by: constricting discomfort in the chest or neck, shoulders, jaw or arms; precipitated by physical exertion; and relieved by rest or nitrates within about 5 to 10 minutes. Typical angina is defined by the presence of all of these features (NICE 2010). The underlying cause is of angina pectoris is usually macrovascular CAD, but may be microvascular in some people (ESC 2013). Importantly, other (non CAD) cardiac conditions may be responsible for typical anginal pain, including aortic valve disease and hypertrophic cardiomyopathy (NICE 2010). Macrovascular CAD refers to dysfunction of the coronary arteries and their main branches, as opposed to microvascular CAD in which dysfunction involves the small coronary arterioles (< 500 μm) (Jones 2012).
Diagnosis of stable angina due to CAD can be established based solely on clinical assessment or with the aid of additional diagnostic testing (NICE 2010). Basic tests usually involve biochemical tests, resting ECG, echocardiography, etc. Non‐invasive diagnostic tests include exercise ECG, stress imaging testing and coronary computed‐tomography angiography (CTA). The only invasive test is invasive coronary angiography (ESC 2013). The choice of diagnostic test (functional or structural, invasive or non‐invasive) is guided by the estimated likelihood of CAD (from clinical assessment) and consideration of coronary revascularisation (NICE 2010). Although current NICE guidelines do not recommend exercise ECG to evaluate people with suspected stable angina, it remains a useful option because of its simplicity and widespread availability (ESC 2013). Furthermore, according to American (ACC/AHA 2012) and European (SIGN 2007; ESC 2013) guidelines, exercise ECG is recommended as an option to impose stress during imaging for people with intermediate pre‐test probability of CAD. Some people with stable angina have microvascular coronary disorders, which can be detected on normal coronary angiography only (Di Fiore 2013). Since evaluation of a person with stable angina does not always include coronary angiography (either invasive or non‐invasive), people with microvascular coronary dysfunction would remain unidentified using this approach.
Description of the intervention
Management options for people with stable angina include lifestyle modifications, pharmacological therapy, and revascularisation interventions. Treatment is aimed at improving prognosis (by preventing myocardial infarction and death) and minimising or abolishing symptoms. All management options have potential to meet both treatment aims (ESC 2013). However, the main aim of anti‐anginal drug treatment is to prevent episodes of angina; the secondary aim is to prevent cardiovascular events such as heart attack and stroke (NICE 2011). Anti‐anginal drugs are classified as first‐line (adrenergic beta antagonists, calcium channel blockers) or second‐line (long‐acting nitrates, ivabradine, nicorandil, ranolazine, trimetazidine) (Tarkin 2012). Anti‐angina treatment is recommended to begin using one of the first‐line drugs as monotherapy. If symptoms are not controlled satisfactorily, a combination of two first‐line drugs is recommended. Second‐line drugs are recommended as add‐on therapy when a combination of two first‐line drugs cannot be accomplished, or as monotherapy when none of the first‐line drugs can be used (ESC 2013; NICE 2011). Adding a third anti‐angina drug can be considered only when revascularisation is not an option or as a temporary measure while the patient awaits revascularisation (NICE 2011). However, since ranolazine is the only second‐line drug approved by the US Food and Drug Administration (FDA) (Hawwa 2013), American guidelines (ACC/AHA 2012) recommend use of ranolazine in a similar way to second‐line drugs in European guidelines (ESC 2013).
Ranolazine was approved by the US FDA in 2007 for use in a maximum dose (extended release) of 1000 mg twice daily (FDA 2016), and by the European Medicines Agency (EMA) in 2008 for use in a maximum dose (prolonged release) of 750 mg twice daily (EMA 2008). The immediate release presentation shows peak plasma concentrations within one hour, with an estimated half‐life of 1.4 hours to 1.9 hours (Jerling 2006); for the extended release presentation, values are 2 hours to 6 hours and 7 hours, respectively (Cattaneo 2015; Jerling 2006). The ranolazine extended release preparation reduces the frequency of angina episodes, improves exercise performance, and delays the development of exercise‐induced angina and ST‐segment depression (ACC/AHA 2012). Although these effects are considered to be dose‐related (Chaitman 2011), they have been observed to be modest (EMA 2008) and of uncertain clinical significance (NICE 2011). Furthermore, there is no evidence about the effects of ranolazine on long‐term outcomes in people with stable angina, or for the addition of ranolazine to a calcium channel blocker (NICE 2011). Conversely, an advantage of ranolazine is that it does not cause significant haemodynamic changes, with an average of less than 2 beats per minute reduction in heart rate and less than 3 mm Hg decrease in systolic blood pressure (ACC/AHA 2012). However, ranolazine is associated with a dose‐dependant increase in QT‐interval, with a mean increase of 6 ms at the maximum recommended dosing (ACC/AHA 2012). More recently, an anti‐arrhythmic (antifibrillatory) effect of ranolazine has been proposed, but current evidence is based on small, non‐controlled trials (Hawwa 2013). Contra‐indications to ranolazine are prolonged QT‐interval and co‐administration with other QT‐prolonging drugs, previous history of ventricular tachycardia and moderate to severe kidney impairment or severe liver failure (Tarkin 2012). The most common adverse events related to use of ranolazine are headache (5.5%), dizziness (1% to 6%), constipation (5%) and nausea (≤ 4%; dose related). Although there is concern about QT prolongation on ECG, its prevalence has been estimated to be less than 1% (Ranexa PI 2013).
How the intervention might work
Ranolazine is a selective inhibitor of the late sodium current (INaL) in cardiomyocytes, which is thought to be an important contributor to the pathogenesis of angina through calcium overload and increase in oxygen consumption in the cardiomyocytes (Codolosa 2014). Although most studies have focused on its role in macrovascular angina, some findings suggest that ranolazine also has anti‐inflammatory or antioxidant effects which may improve glycometabolic homeostasis, which are more important in microvascular angina (Cattaneo 2015).
Early studies on the effects of ranolazine in people with stable angina have been undertaken using the drug's immediate release formulation. However, given that its action was deemed significant only in the peak measurements, an extended release formulation was developed, which was approved for use in people with stable angina (Keating 2008). Overall, ranolazine has been shown to improve exercise tolerance test (ETT) parameters and angina frequency in people with stable angina without substantial haemodynamic effect (Savarese 2013). However, ranolazine has also been related to prolongation of the QTc interval, although not pro‐arrhythmic at therapeutic doses (Thadani 2012). Moreover, ranolazine has been shown to have anti‐arrhythmic effects by reducing atrial and ventricular arrhythmias (Hawwa 2013).
A number of subgroup analyses have been performed for ranolazine in people with stable angina. The effects of ranolazine on ETT parameters have been found to be greater among women. However, the effects of ranolazine on decreased angina frequency and nitroglycerin consumption were comparable among the gender groups (Wenger 2007). Differences among age groups have been evaluated. Although ranolazine efficacy is similar among people aged 70 years or older and patients younger than 70 years, its safety profile was better in the younger age group (Rich 2007). Differences between diabetic and non‐diabetic patients have also been sought. Although ranolazine has not been found to have a different effect for people with diabetes regarding ETT parameters, angina frequency and nitroglycerin consumption, it was related to a significant reduction in HbA1c levels (Patel 2008).
Why it is important to do this review
Although ranolazine reduces angina episodes and improves ETT parameters, its impact on the long‐term prognosis in people with stable angina remains unclear. Moreover, the clinical significance of those effects is a matter of debate (NICE 2011). Even though the main indication for ranolazine in people with stable angina is as add‐on therapy, the evidence regarding its use in combination with some first‐line drugs is lacking (NICE 2011). More evidence is needed on the use of ranolazine as monotherapy, given that it may provide an option for people who cannot use any of the first‐line drugs (ESC 2013; NICE 2011) or recommended as a first‐line drug given its apparently better side effects profile compared with classical anti‐anginal agents (ACC/AHA 2012). In view of these gaps in the knowledge of the role of ranolazine for the management of people with stable angina, a systematic analysis of relevant, high quality, and up‐to‐date evidence was needed.
Objectives
To assess the effects of ranolazine on cardiovascular and non‐cardiovascular mortality, all‐cause mortality, quality of life, acute myocardial infarction incidence, angina episodes frequency and adverse events incidence in stable angina patients, used either as monotherapy or as add‐on therapy, and compared to placebo or any other anti‐anginal agent.
Methods
Criteria for considering studies for this review
Types of studies
We included randomised, controlled, parallel‐group and cross‐over trials, with double blinding (of participants and trial personnel) that assessed the effects of ranolazine in the management of stable angina pectoris, irrespective of the number of groups and the length of follow‐up. However, for safety outcomes, we also included trials regardless of blinding so long as other criteria were met. We included studies reported as full‐text, those published only as abstracts, and unpublished data.
Types of participants
We included adults (aged 18 years or over) diagnosed with stable angina pectoris, irrespective of gender, country of enrolment, setting, previous treatment status, comorbidities and symptom severity. The diagnosis of stable angina pectoris could be established based on clinical history, myocardial ischaemia demonstrated by functional tests or significant obstructive coronary artery disease (CAD) demonstrated by angiography. We considered studies which included a subset of relevant participants if results were reported separately for people with stable angina.
Types of interventions
We included trials comparing ranolazine (given orally for at least one week as either monotherapy or add‐on therapy, irrespective of dose, presentation (immediate or extended release) and daily frequency) with placebo or other anti‐anginal agent. We included the following co‐interventions provided they were not part of the randomised treatment: other anti‐anginal agents (long‐acting nitrates, adrenergic beta antagonists and/or calcium channel blockers), statins, antiplatelet agents, antihypertensive agents and surgical interventions for CAD. We included trials that applied the following designs.
Monotherapy
-
Ranolazine versus placebo.
-
Ranolazine versus first‐line anti‐anginal drugs, grouped by class: 1) adrenergic beta antagonists and 2) calcium channel blockers.
-
Ranolazine versus other second‐line anti‐anginal drugs, grouped as: 1) long‐acting nitrates, 2) ivabradine, 3) nicorandil and 4) trimetazidine.
Add‐on therapy
-
Ranolazine added to first‐line anti‐anginal drugs (grouped by class as for monotherapy) versus placebo added to first‐line anti‐anginal drugs (grouped by class).
-
Ranolazine added to other second‐line anti‐anginal drugs (grouped as for monotherapy) versus placebo added to other second‐line anti‐anginal drug (grouped).
-
Ranolazine added to first‐line anti‐anginal drugs (grouped as for monotherapy) versus other second‐line anti‐anginal drugs (grouped as mentioned before) added to first‐line anti‐anginal drugs (grouped).
-
Ranolazine added to other second‐line anti‐anginal drugs (grouped as for monotherapy) versus first‐line anti‐anginal drugs (grouped) added to other second‐line anti‐anginal drugs (grouped).
Types of outcome measures
We considered effectiveness and safety outcome measures, and only measures taken at the longest follow‐up within each study. For the outcomes considered, we included only results measured with a follow‐up of at least one week. Studies were included irrespective of whether or not they assessed the outcomes listed below.
Primary outcomes
Effectiveness
-
Cardiovascular mortality, expressed as a proportion of the total study population.
Safety
-
Non‐cardiovascular mortality, expressed as a proportion of the total study population.
Secondary outcomes
Effectiveness
-
All‐cause mortality, expressed as a proportion of the total study population.
-
Quality of life, measured using general scales: Medical Outcomes Study Short Form‐36 (SF‐36), World Health Organization Quality of Life tool (WHOQOL), Illness Perception Questionnaire (IPQ) and Nottingham Health Profile (NHP) (Silva 2011); or specific scales: Seattle Angina Questionnaire (SAQ), MacNew Heart Disease Health‐Related QoL Questionnaire, Ferrans and Powers QoL Index and Speak from the Heart Chronic Angina Checklist (Young 2013); all were expressed as mean differences (MDs).
-
Acute myocardial infarction (AMI) incidence (fatal and non‐fatal), defined as the proportion of participants who experienced one or more AMI episodes, expressed separately for fatal and non‐fatal AMI.
-
Need for revascularisation procedure, expressed as a proportion of the total study population.
-
Angina episodes frequency, measured as a weekly average, expressed as MDs.
-
Costs of health care. We considered any information regarding costs of study interventions and related medical care (hospitalisations, additional interventions and outpatient health care).
-
Time to 1‐mm ST‐segment depression on exercise electrocardiogram (ECG) at peak, measured in seconds, expressed as MDs.
Safety
-
Adverse events incidence, defined as the proportion of participants who experienced one or more serious (non‐cardiac life‐threatening) or non‐serious events, expressed as a whole but separately for each category. Serious adverse events were defined as those that threaten life, require or prolong hospitalisation, result in permanent disability, or cause birth defects (Cochrane Glossary).
Search methods for identification of studies
Electronic searches
We searched the following databases:
-
Cochrane Central Register of Controlled Trials (CENTRAL) in the Cochrane Library (Issue 1, 2016, searched 9 February 2016);
-
MEDLINE In‐Process and Other Non‐Indexed Citations and MEDLINE (Ovid, 1946 to 9 February 2016);
-
Embase (Ovid, 1980 to 2016 week 6, searched 9 February 2016); and
-
Conference Proceedings Citation Index ‐ Science (CPCI‐S Web of Science, 1990 to 9 February 2016).
The detailed MEDLINE search strategy is presented in Appendix 1. We adapted the MEDLINE search strategy for other databases (Appendix 1). The Cochrane highly sensitive search strategy for identifying randomised trials, sensitivity‐maximising version, was applied to MEDLINE and adapted for Embase and CPCI‐S (Lefebvre 2011). We searched these databases from dates of inception to 9 February 2016 and did not apply language restrictions.
Searching other resources
In an effort to identify further ongoing, unpublished and published trials (Van Enst 2012) we also searched the following resources (Higgins 2011):
-
National and regional databases:
-
African Index Medicus (AIM, Africa) (http://indexmedicus.afro.who.int/) (1966 to 24 April 2016);
-
Informit Health Collection (Australasia) (http://www.informit.com.au/health.html) (1846 to 24 April 2016);
-
VIP Information/Chinese Scientific Journals Database (CSJD‐VIP, China) (http://www.cqvip.com/) (from inception to 24 April 2016);
-
Index Medicus for the Eastern Mediterranean Region (IMEMR, Eastern Mediterranean); (http://www.emro.who.int/information‐resources/imemr‐database/) (1966 to 24 April 2016);
-
IndMED (India) (http://indmed.nic.in/indmed.html) (1980 to 24 April 2016);
-
KoreaMed (Korea) (http://www.koreamed.org/SearchBasic.php) (1959 to 24 April 2016);
-
LILACS (Latin America and the Caribbean) (http://lilacs.bvsalud.org/es/) (1980 to 24 April 2016);
-
Index Medicus for South‐East Asia Region (IMSEAR, DSpace, South‐East Asia) (http://imsear.hellis.org/) (1871 to 24 April 2016); and
-
Western Pacific Region Index Medicus (WPRIM, Western Pacific) (http://www.wprim.org/) (1950 to 24 April 2016).
-
-
Grey literature databases:
-
OpenGrey (Europe, formerly OpenSIGLE (Stock 2011)) (http://www.opengrey.eu/) (1973 to 24 April 2016); and
-
National Technical Information Service (NTIS, U.S.) (http://www.ntis.gov/) (1851 to 24 April 2016).
-
-
Prospective trial registers search portals:
-
WHO International Clinical Trials Registry Platform (WHO ICTRP) (http://www.who.int/ictrp/en/) (1 January 1990 to 24 April 2016);
-
MetaRegister of Current Controlled Trials (mRCT) (http://www.controlled‐trials.com/mrct/) (6 April 2000 to 24 April 2016); and
-
ClinicalTrials.gov (http://www.clinicaltrials.gov/) (3 November 1999 to 24 April 2016).
-
-
Conference abstracts:
-
American Heart Association Scientific Sessions from 2009 to February 2016 (http://my.americanheart.org/professional/Sessions/ScientificSessions/Archive/Archive‐Scientific‐Sessions_UCM_316935_SubHomePage.jsp); and
-
European Society of Cardiology Congresses from 2007 to February 2016 (http://www.escardio.org/congresses/past_congresses/Pages/Past‐Congresses.aspx).
-
-
Other reviews: checking studies included in other relevant reviews retrieved from searches of:
-
Database of Abstracts of Reviews of Effects (DARE) through the Centre for Reviews and Dissemination (CRD) (http://www.crd.york.ac.uk/CRDWeb/) (1975 to 24 April 2016);
-
NHS Economic Evaluation Database (NHS EED) through the CRD (http://www.crd.york.ac.uk/CRDWeb/) (1975 to 24 April 2016); and
-
Health Technology Assessment Database (HTA Database) through the CRD (http://www.crd.york.ac.uk/CRDWeb/) (1975 to 24 April 2016).
-
-
Approval documents from the US Food and Drrug Administration (FDA) (http://www.fda.gov/) and the European Medcines Agency (EMA) (http://www.ema.europa.eu/), checked on 24 April 2016.
-
Checking reference lists of included studies and other relevant papers identified through the search process.
-
The website of Gilead Sciences (http://www.gilead.com/), the company which discovered, developed and commercialised ranolazine, checked on 24 April 2016.
Data collection and analysis
Selection of studies
Two review authors (LV, JM) independently screened titles and abstracts for inclusion identified from searches, and coded them as 'retrieve' (eligible or potentially eligible/unclear) or 'do not retrieve'. Disagreements were resolved by arbitration involving a third review author (JB). We retrieved full‐text study reports and publications; two review authors (LV, JM) then independently screened the studies for inclusion, and recorded reasons for exclusion of ineligible studies. Disagreements were resolved through discussion, or if required, the participation of a third review author (JB or CS). We identified and excluded duplicates and collated multiple reports of the same study so that each study, rather than each report, was the unit of interest in this Cochrane review. We recorded the selection process in sufficient detail to complete a PRISMA flow diagram (Figure 1) and Characteristics of excluded studies table.

Study flow diagram
†Two included articles report data from the RIVER‐PCI trial
Data extraction and management
We used a data collection form for study characteristics and outcome data which had been piloted on one study included in the review. Four review authors (JB, LV, JM, DR) were involved in both processes so that two review authors independently analysed each included study. We resolved disagreements by consensus or by involving a fifth review author (CS). One review author (JB) entered data into RevMan 2014. We double‐checked that study characteristics and outcome data were entered correctly by comparing the data presented in the systematic review with the study reports. We extracted the following study characteristics:
-
Methods: date of study, study design, method of randomisation, method of concealment of allocation, blinding, power calculation, duration of follow‐up, number of patients randomised, exclusions post‐randomisation, withdrawals (and reasons).
-
Participants: N, countries of enrolment, setting/location, mean age/age range, gender (male %), severity of condition, diagnostic criteria, comorbidities, inclusion and exclusion criteria.
-
Interventions: intervention (including type of formulation), comparison, concomitant medications, excluded medications and duration of treatment.
-
Outcomes: primary and secondary outcomes (efficacy and safety) specified and collected, and time points reported. For each outcome: outcome definition, method of measurement and unit of measurement. Results: number of patients analysed (according to type of analysis) and main results.
-
Notes: source of funding and notable conflicts of interest of trial authors.
Assessment of risk of bias in included studies
Two review authors (JB, LV) independently assessed risk of bias for each study using the criteria outlined in the Cochrane Handbook for Systematic Reviews of Interventions (Higgins 2011). We resolved any disagreement by discussion or by involving a third review author (CS). We assessed the risk of bias according to the following domains:
-
Random sequence generation (selection bias).
-
Allocation concealment (selection bias).
-
Blinding of participants and personnel (performance bias).
-
Blinding of outcome assessment (detection bias).
-
Incomplete outcome data (attrition bias).
-
Selective outcome reporting (reporting bias).
-
Other bias: source of funding.
We graded each potential source of bias as high, low or unclear and provided a quote from the study report together with a justification for our judgment in 'Risk of bias' tables. We took into account the recommendations of the Cochrane Handbook for Systematic Reviews of Interventions (Higgins 2011) regarding 'Risk of bias' assessment of cross‐over studies. We summarised the risk of bias judgements across different studies for each domain. We did not obtain information on risk of bias related to unpublished data or correspondence with trial authors. We performed an additional handsearch to identify published study protocols to check for selective reporting bias. When considering treatment effects, we took into account the risk of bias for the studies that contributed to that outcome.
Assessment of bias in conducting the systematic review
We conducted this Cochrane Review according to the published protocol and reported deviations in Differences between protocol and review.
Measures of treatment effect
We analysed dichotomous data as risk ratios (RRs) with 95% confidence intervals (CIs) and continuous data as mean differences (MDs) with 95% CIs. We used standardised mean differences (SMD) for quality of life meta‐analyses if included data were measured using different tools. We entered data presented as a scale with a consistent direction of effect (with higher scores indicating better quality of life). We did not use skewed data for the quantitative analysis.
Unit of analysis issues
We included randomised controlled trials (RCTs) with either parallel‐group or cross‐over designs. Cross‐over studies were suitable for this Cochrane review because stable angina pectoris is a relatively stable chronic manifestation of disease and the interventions we assessed have only a temporal effect. We took into account the recommendations of the Cochrane Handbook for Systematic Reviews of Interventions (Higgins 2011) regarding statistical analysis of cross‐over studies.
Dealing with missing data
We contacted trial authors to obtain missing numerical outcome data where possible. Where this was not possible, we performed analyses only with the available data.
Assessment of heterogeneity
We statistically assessed the presence of heterogeneity among study results by means of the Chi² test with a P value < 0.10 as cut‐off point. We further assessed the degree of heterogeneity by using the I² statistic (McNamara 2015), considering the following thresholds for interpretation: 0% to 40%: not important heterogeneity; 30% to 60%: moderate heterogeneity; 50% to 90%: substantial heterogeneity; and 75% to 100%: considerable heterogeneity (in which case meta‐analyses were not performed) (Higgins 2011).
Assessment of reporting biases
We planned to perform statistical tests for funnel plot asymmetry only for those meta‐analyses which included 10 or more studies (Sterne 2011). Since none of the meta‐analyses performed met this criterion, we used only visual inspection of funnel plots to assess for publication bias.
Data synthesis
We used Review Manager software, version 5.3 (RevMan 2014) for data synthesis and analysis. We undertook meta‐analyses only where this was meaningful, that is, if the treatments, participants and underlying clinical question were sufficiently similar for pooling to make sense. We used fixed‐effect meta‐analyses to calculate effect estimates if there was no statistically significant heterogeneity (Chi² P < 0.10). For results with statistically significant but not considerable heterogeneity (I² ≥ 75%), we used random‐effects meta‐analyses to calculate effect estimates.
Subgroup analysis and investigation of heterogeneity
We planned to carry out subgroup analyses based on the following variables:
-
age;
-
gender;
-
previous AMI status;
-
patients undergoing percutaneous coronary intervention (PCI); and
-
number of revascularisation procedures.
Subgroup analyses for these variables could be carried out because we found insufficient data. However, we decided to add another variable: type of stable angina diagnosis (macrovascular versus microvascular). This subgroup analysis was performed for incidence of non‐serious adverse events for ranolazine given as monotherapy compared to placebo, and for quality of life for add‐on ranolazine compared to placebo.
Sensitivity analysis
We undertook sensitivity analyses to explore the effects of decisions we made throughout the review process, including:
-
Restriction to trials with low risk of bias (those which had at least three domains graded as low risk of bias).
-
Exchanging the statistical approach for data synthesis (random‐effects versus fixed‐effect models).
-
Changing the measures of treatment effects for dichotomous (RRs to ORs) and continuous data (SMDs to MDs and vice versa).
-
Changing the method of dealing with missing data (ignoring versus imputing with replacement values for poor outcomes). This sensitivity analysis was not performed because we decided not to impute any missing data; however, we calculated some data included in the quantitative synthesis from the available information published in reports of the included studies.
-
Those relevant issues identified during the analyses of studies: we decided to pool the available data irrespective of the duration of follow‐up and perform an additional sensitivity analysis based on this variable (< 6 weeks versus ≥ 6 weeks).
Summary of Findings table and quality of evidence (GRADE)
We created 'Summary of findings' tables for the following outcomes: cardiovascular mortality, non‐cardiovascular mortality, all‐cause mortality, quality of life, AMI incidence, angina episodes frequency and adverse events incidence. We used the five GRADE considerations (study limitations, consistency of effect, imprecision, indirectness and publication bias) to assess the quality of the body of evidence as it relates to the studies which contributed data to the meta‐analyses for the prespecified outcomes. We used the methods and recommendations described in Section 8.5 and Chapter 12 of the Cochrane Handbook for Systematic Reviews of Interventions (Higgins 2011) using GRADEpro software (GRADEpro GDT 2015). We provided justifications for all decisions to downgrade the quality of evidence in footnotes and included comments to aid readers' understanding of the review where necessary.
Reaching conclusions
We based our conclusions only on findings from the quantitative or narrative synthesis of included studies for this Cochrane review. The Implications for research sections suggests priorities for future research and outlines remaining uncertainties in the area.
Results
Description of studies
See the Characteristics of included studies; Characteristics of excluded studies; Characteristics of ongoing studies and Characteristics of studies awaiting classification tables for detailed descriptions.
Results of the search
We identified 515 records through searching electronic databases and 315 additional records from other sources. After removing duplicates, 639 records remained for screening of titles and abstracts. We deemed 611 to be irrelevant and the remaining 28 records were obtained in full‐text for eligibility assessment. We excluded 10 reports. We included 17 RCTs (18 records) in the qualitative analysis; of these, 14 studies (15 reports) were also included in the quantitative synthesis (CARISA 2004; ERICA 2006; MARISA 2004; Mehta 2011; MERLIN‐TIMI 36 2007; Pelliccia 2012; Pepine 1999; RAN080 2005; RIVER‐PCI 2016; RWISE 2016; Shammas 2015; TERISA 2013; Thadani 1994; Villano 2013) (see Figure 1).
The MERLIN‐TIMI 36 2007 trial included patients with non ST‐elevation acute coronary syndrome; a subgroup of those patients had also a history of stable angina, and the results regarding these patients were reported in the sub study included in this review. The RIVER‐PCI 2016 trial considered three sub studies in its protocol, all of which were of interest for this review; however, only the results of two have been published in separate reports included in this review.
Included studies
We included 17 randomised controlled trials (RCTs) that enrolled a total of 9975 participants. Two RCTs (MERLIN‐TIMI 36 2007; RIVER‐PCI 2016) provided data for 61.8% of participants.
Of the 17 RCTs, 11 were parallel‐group and six were cross‐over design studies. Most studies were performed in high‐income regions such as North America, Europe and Australia; five studies included participants from Asia, Russia, Israel, India (CARISA 2004; MERLIN‐TIMI 36 2007; RIVER‐PCI 2016; Sandhiya 2015; TERISA 2013) and Africa (MERLIN‐TIMI 36 2007). All but three studies included mostly female participants; Mehta 2011, RWISE 2016 and Villano 2013 reported percentages of male participants as 0%, 4% and 19.6%, respectively. Most participants' ages ranged from 60 years to 80 years. Although all studies included people with angina, some considered additional inclusion criteria that enabled discrimination between people with macrovascular angina (Babalis 2015; CARISA 2004; ERICA 2006; MARISA 2004; RAN080 2005; Sandhiya 2015; Shammas 2015; TERISA 2013) and microvascular angina (Mehta 2011; RWISE 2016; Tagliamonte 2015; Villano 2013). Notably, three of four studies that included people with microvascular angina were also those that included mostly female participants. Only four studies enrolled participants with comorbidities such as acute coronary syndrome (ACS) (MERLIN‐TIMI 36 2007), incomplete revascularisation post‐percutaneous coronary intervention (PCI) (RIVER‐PCI 2016) and type 2 diabetes mellitus (Sandhiya 2015; TERISA 2013). Intervention durations ranged from 1 to 92 weeks.
Ranolazine was used as both extended and immediate release formulations; however, the formulation was not specified in nine studies (Babalis 2015; Mehta 2011; Pelliccia 2012; RIVER‐PCI 2016; Sandhiya 2015; Shammas 2015; Tagliamonte 2015; Thadani 1994; Villano 2013). Ranolazine was administered as add‐on therapy in seven studies. Co‐medications included adrenergic beta antagonists (Shammas 2015), calcium channel blockers (ERICA 2006) or both (Babalis 2015; CARISA 2004; Pepine 1999; TERISA 2013; Villano 2013). However, several other studies (Mehta 2011; MERLIN‐TIMI 36 2007; Pelliccia 2012; RAN080 2005; RIVER‐PCI 2016; RWISE 2016) permitted concomitant anti‐angina medications to be administered to some participants.
Most studies compared ranolazine only with placebo; other comparators included atenolol (RAN080 2005), ivabradine (Villano 2013) and trimetazidine (Sandhiya 2015).
Seven included studies evaluated mainly parameters related to exercise electrocardiogram (ECG) (Babalis 2015; CARISA 2004; MARISA 2004; MERLIN‐TIMI 36 2007; Pepine 1999; RAN080 2005; Thadani 1994), which were added (time to 1‐mm ST‐segment depression at peak) to the review outcomes. Three studies reported data relevant only for a secondary safety outcome (incidence of adverse events) (Babalis 2015; MARISA 2004; Pepine 1999). Only one study reported data for the primary outcomes of this review and collected data on the costs of health care (a secondary outcome). However, results are not yet published (RIVER‐PCI 2016).
Most included studies (n = 12) reported commercial sources of funding including: CV Therapeutics (CARISA 2004; ERICA 2006; MARISA 2004; MERLIN‐TIMI 36 2007; RAN080 2005; RWISE 2016); Syntex Research (Pepine 1999; Thadani 1994); Gilead Sciences (RIVER‐PCI 2016; Shammas 2015; TERISA 2013); and other (Mehta 2011). Two studies reported no external sources of funding (Sandhiya 2015; Pelliccia 2012) and three did not state sources of funding (Babalis 2015; Tagliamonte 2015; Villano 2013).
Excluded studies
We excluded 10 studies after retrieving and assessing full‐text reports. Six studies were excluded because their design did not correspond to a RCT. Four of these studies were economic analyses for which the health economics data provided did not come from studies conducted alongside a RCT (Coleman 2015; Hidalgo‐Vega 2014; Kohn 2014; Lucioni 2009). Another of these studies was a safety study on ranolazine without comparator (ROLE 2007). The remaing study was a one‐group cross‐over trial and it did not state if the treatment order was randomised (Jain 1990). Two studies were excluded because of corresponding to substudies of already included studies (Arnold 2014, Rich 2007). One study was excluded because the duration of the intervention was shorter than the 1‐week period established as a minimum for inclusion (Cocco 1992). Another study was excluded because its population did not match inclusion criteria for participants (Rehberger‐Likozar 2015).
Studies awaiting classification
Four studies await classification (Characteristics of studies awaiting classification). Available data were insufficient to determine if these studies met the inclusion criteria for this review. In three studies, population characteristics were not described in sufficient detail to determine if they were restricted to people with stable angina (NCT01304095; Tagarakis 2013; Tian 2012). The fourth study (Wang 2012) did not provide information about randomisation and blinding. The full‐text reports for three studies (Tagarakis 2013; Tian 2012; Wang 2012) could not be obtained.
Ongoing studies
We identified 17 ongoing trials which met the review eligibility criteria (Characteristics of ongoing studies). Of those, 15 studies are parallel‐group designs and two are cross‐over studies (NCT01754259, NCT01495520). Most studies are being performed in high‐income regions, such as North America and Europe, two studies in Asia (India) (CTRI/2014/01/004332; Gupta 2014); and six did not state locations (Calcagno 2014; Calcagno 2015; NCT02147067; NCT02252406; NCT02423265; Šebeštjen 2014). All but one study includes a mixed population regarding gender; Šebeštjen 2014 includes only males. Seven studies restricted the population to people with macrovascular angina (EUCTR 2011‐001278‐24; EUCTR 2012‐001584‐77; NCT01495520; NCT01754259; NCT01948310; NCT02252406; NCT02423265) and two restricted participants to people with microvascular angina (NCT02052011; NCT02147067). Some studies consider comorbidities or important antecedents such as PCI‐stent implantation (Calcagno 2014; Calcagno 2015; NCT02423265), sustained STEMI (CTRI/2014/01/004332), diabetes mellitus (Gupta 2014; NCT01754259), metabolic syndrome (NCT02252406) and other cardiac conditions (NCT01558830). Intervention durations range from 4 weeks to 12 months.
The evaluation of ranolazine as add‐on therapy is explicitly stated in two studies (Gupta 2014; NCT02423265); the remainder provide insufficient information to determine how ranolazine is being administered. Ranolazine doses range from 375 mg twice daily to 1000 mg twice daily. The comparator for most studies is placebo or no treatment, with only three studies comparing ranolazine with other second‐line anti‐angina treatments such as ivabradine (Calcagno 2015) and trimetazidine (CTRI/2014/01/004332; Šebeštjen 2014).
Five studies assess quality of life (NCT02052011; NCT02147067; NCT02147834; NCT02265796; NCT02423265); two assess frequency of angina episodes (EUCTR 2011‐001278‐24; Gupta 2014); two assess need for revascularisation procedure (NCT02147834; NCT02265796); five assess exercise ECG parameters (Calcagno 2014; Calcagno 2015; EUCTR 2011‐001278‐24; NCT02147067; NCT02423265). Eight studies do not assess any of the effectiveness outcomes of this review (CTRI/2014/01/004332; EUCTR 2012‐001584‐77; NCT01495520; NCT01558830; NCT01754259; NCT01948310; NCT02252406; Šebeštjen 2014). Eight studies state commercial sources of funding (at least partially) from pharmaceutical companies such as Gilead Sciences (NCT01558830; NCT01948310; NCT02052011; NCT02147067; NCT02147834; NCT02265796) and Menarini International Operations (EUCTR 2011‐001278‐24; EUCTR 2012‐001584‐77).
Risk of bias in included studies
Risk of bias is illustrated in Figure 2 and Figure 3. Also see Characteristics of included studies.

Risk of bias graph: review authors' judgements about each risk of bias item presented as percentages across all included studies
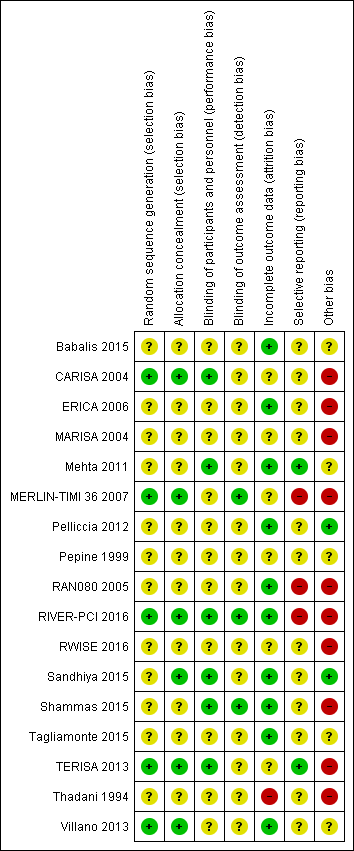
Risk of bias summary: review authors' judgements about each risk of bias item for each included study.
Other bias criteria: we considered the source of funding in this section, we scored high risk of bias if the source of funding was solely from private organisations, unclear risk of bias if it was mixed (private and public) and low risk of bias if it was solely not external or from public organisations.
Allocation
All included studies randomly assigned participants to treatment groups using either computer‐generated sequences (CARISA 2004; MERLIN‐TIMI 36 2007; RIVER‐PCI 2016; TERISA 2013; Villano 2013) or other methods that were described with insufficient detail to enable assessment (Babalis 2015; ERICA 2006; MARISA 2004; Mehta 2011; Pelliccia 2012; Pepine 1999; RAN080 2005; RWISE 2016; Sandhiya 2015; Shammas 2015; Tagliamonte 2015; Thadani 1994).
Adequate concealment of allocation methods were described in four studies (CARISA 2004; Sandhiya 2015; TERISA 2013; Villano 2013). Two additional studies (MERLIN‐TIMI 36 2007; RIVER‐PCI 2016) did not describe in detail their method for allocation concealment, but it was considered to be adequate given the use of a centralised randomization system. One study stated that investigators had been blinded to treatment allocation (Shammas 2015); this was not considered to be sufficiently detailed to inform assessment.
Blinding
Most studies reported using a double‐blind design for the treatment phase. However, only one study explicitly indicated who were blinded (Shammas 2015). This was established from information provided in five other studies (CARISA 2004; Mehta 2011; RIVER‐PCI 2016; Sandhiya 2015; TERISA 2013). Blinding was not stated in two study reports (Babalis 2015; Villano 2013).
Blinding of outcome assessment was reported in seven studies (CARISA 2004; MARISA 2004; Mehta 2011; MERLIN‐TIMI 36 2007; RIVER‐PCI 2016; Shammas 2015; Villano 2013). However, for outcomes considered in this review, only three studies reported blinding measures for outcome assessment (MERLIN‐TIMI 36 2007; RIVER‐PCI 2016; Shammas 2015).
Incomplete outcome data
Six studies did not report any withdrawals or exclusions of participants, but of these, only three explicitly stated that no participants withdrew or were excluded (Babalis 2015; Mehta 2011; Tagliamonte 2015). Five studies did not describe reasons for exclusions or withdrawal in sufficient detail to inform assessment (CARISA 2004; MERLIN‐TIMI 36 2007; Pepine 1999; RWISE 2016; TERISA 2013). One study did not report the allocated groups of excluded or withdrawn participants (MARISA 2004). The five studies in which numbers, reasons and allocated group of participants who withdrew or were excluded were reported, inconsistencies in data were identified for one or two participants in three studies (ERICA 2006; RAN080 2005; Shammas 2015). The number of exclusions and withdrawals approached 10% of the total study population in one study (Thadani 1994).
The type of analysis was not stated in eight studies (Babalis 2015; ERICA 2006; RWISE 2016; Sandhiya 2015; Shammas 2015; Tagliamonte 2015; TERISA 2013; Villano 2013). Seven studies reported performing intention‐to‐treat analyses (CARISA 2004; MARISA 2004, Mehta 2011; MERLIN‐TIMI 36 2007; Pelliccia 2012; RAN080 2005; RIVER‐PCI 2016); two studies reported performing intention‐to‐treat and per‐protocol analyses (Pepine 1999; Thadani 1994). Pepine 1999 and Thadani 1994 reported results from intention‐to‐treat analyses, and stated that no significant differences were found among intention‐to‐treat and per‐protocol analyses.
Selective reporting
We assessed selective reporting by cross‐checking study outcomes with published protocols. We found protocols for only five included studies (Mehta 2011; MERLIN‐TIMI 36 2007; RIVER‐PCI 2016; RWISE 2016; TERISA 2013). The protocol for the MERLIN‐TIMI 36 trial (Morrow 2006) did not consider the sub study (MERLIN‐TIMI 36 2007) we included in this review (post‐hoc analyses), and thus was considered to be at high risk of bias. Of note, the report of this sub study met our pre‐specified inclusion criteria, and it takes part of only one of our analyses (Analysis 1.2), whose result do not change if the MERLIN TIMI 36 sub study is not considered.
We used information presented in studies' Methods sections as a proxy for protocols. We found that three studies did not report data for some outcomes (Babalis 2015; MERLIN‐TIMI 36 2007; RIVER‐PCI 2016) and four studies reported data for additional outcomes (CARISA 2004; MERLIN‐TIMI 36 2007; RAN080 2005; RIVER‐PCI 2016). Selective reporting affected outcomes considered in this review in three studies (CARISA 2004; RAN080 2005; RIVER‐PCI 2016).
Other potential sources of bias
We considered the source of funding and conflicts of interest as potential sources of bias. Most studies reported funding from commercial pharmaceutical companies. Sources of funding were reported to be partially supported by commercial pharmaceutical companies in three studies, no conflicts of interest were reported in two of these (Mehta 2011, Pepine 1999) and conflicts of interest were reported for some of the authors in the other one (RWISE 2016). Three studies (Babalis 2015; Tagliamonte 2015; Villano 2013) reported neither funding source nor authors' conflicts of interest. Two studies reported no external source of funding and absence of conflicts of interest (Pelliccia 2012; Sandhiya 2015).
Effects of interventions
See: Summary of findings for the main comparison Ranolazine (add‐on therapy) versus placebo for stable angina pectoris; Summary of findings 2 Ranolazine (monotherapy) versus placebo for stable angina pectoris
summary of findings Table for the main comparison presents ranolazine compared to placebo (add‐on therapy) and summary of findings Table 2 presents ranolazine compared to placebo (monotherapy).
Primary outcomes
Cardiovascular mortality
Only RIVER‐PCI 2016 reported data on cardiovascular mortality for ranolazine 1000 mg twice daily administered as monotherapy compared to placebo. We observed uncertain effect on cardiovascular mortality from the 20/1287 cardiovascular deaths in the placebo group and 21/1317 cardiovascular deaths in the ranolazine group (RR 1.03, 95% CI 0.56 to 1.88; low quality evidence) (Analysis 1.1).
Non‐cardiovascular mortality
None of the included studies reported non‐cardiovascular mortality.
Secondary outcomes
Effectiveness
The main results are summarised in analyses for ranolazine as monotherapy compared to placebo (Analysis 1.2; Analysis 1.3; Analysis 1.4; Analysis 1.5; Analysis 2.1; Analysis 2.2) and as add‐on therapy compared to placebo (Analysis 3.1; Analysis 3.2; Analysis 3.3; Analysis 3.4; Analysis 3.5; Analysis 4.1; Analysis 4.2).
Data were reported for ranolazine as monotherapy compared to placebo for quality of life (Tagliamonte 2015) and frequency of angina episodes (RAN080 2005; Thadani 1994). These data could not be pooled in a meta‐analysis due to incompleteness.
Ranolazine was compared to other first‐ (RAN080 2005, atenolol 100 mg once daily) and second‐line anti‐anginals (Sandhiya 2015; Villano 2013; trimetazidine 35 mg twice daily and ivabradine 5 mg twice daily respectively), either as monotherapy (RAN080 2005; Sandhiya 2015) or add‐on therapy (Villano 2013). Data could not be meta‐analysed because, for any outcome, only one trial provided data. Study authors were contacted to obtain missing data. Additional data were provided by Dr Noel Bairey Merz (Mehta 2011) and Dr Nicolas W Shammas (Shammas 2015) and included in the quantitative synthesis.
All‐cause mortality
Three studies reported all‐cause mortality for ranolazine 1000 mg monotherapy administered twice daily compared to placebo (MERLIN‐TIMI 36 2007; Pelliccia 2012; RIVER‐PCI 2016). Low quality evidence showed that intervention and placebo group participants were at similar risk of death from all causes (RR 1.00, 95% CI 0.81 to 1.25; 3 studies, 6249 participants; Analysis 1.2). There was no heterogeneity (Chi² P = 0.64, I² = 0%).
Three studies reported all‐cause mortality for ranolazine 1000 mg as add‐on therapy administered twice daily (co‐medications: adrenergic beta antagonists and calcium channel blockers) compared to placebo (CARISA 2004; ERICA 2006; TERISA 2013). Low quality evidence showed that intervention and placebo group participants were at similar risk of death from all causes (RR 0.83, 95% CI 0.26 to 2.71; 3 studies, 2053 participants; Analysis 3.1). There was no heterogeneity (Chi² P = 0.57, I² = 0%).
Quality of life
Three studies evaluated quality of life for ranolazine 1000 mg monotherapy administered twice daily compared to placebo (Mehta 2011; RIVER‐PCI 2016, RWISE 2016). Moderate quality evidence showed that quality of life did not differ between intervention and placebo group participants (MD 0.28, 95% CI ‐1.57 to 2.13; 3 studies, 2254 participants; Analysis 1.3). There was no heterogeneity (Chi² P = 0.38, I² = 0%). Data were assessed using the quality of life dimension of the Seattle Angina Questionnaire (SAQ) in the three trials. The score for this dimension ranged between 0 and 100, with a higher score indicating a better quality of life.
Three studies evaluated quality of life for ranolazine 1000 mg as add‐on therapy administered twice daily (co‐medications: adrenergic beta antagonists and calcium channel blockers) compared to placebo (ERICA 2006; Shammas 2015; TERISA 2013). Moderate quality evidence showed that quality of life did not differ between intervention and control group participants (SMD 0.13, 95% CI ‐0.05 to 0.32; 3 studies, 1533 participants; Analysis 3.2). Since there was statistically significant, but not considerable, heterogeneity (Chi² P = 0.09, I² = 58%) we used a random‐effects model to calculate the pooled estimate. We observed that studies differed in risk of selection and detection bias and population size (fewer than 30 participants versus more than 400 participants), which may explain heterogeneity. Pooled data were reported for quality of life assessed using different scales: the angina frequency and quality of life dimensions of the SAQ, and the physical component of SF‐36. Scores range from 0 to 100, with higher scores indicating better quality of life.
One additional study evaluated quality of life for ranolazine given as add‐on therapy (to adrenergic beta antagonists and calcium channel blockers) compared to placebo (Villano 2013), making a total of four trials for the ranolazine any dose (375mg twice daily and 1000mg twice daily) comparison. Moderate quality evidence showed that quality of life did not differ between intervention and placebo group participants (ranolazine any dose, SMD 0.25, 95% CI ‐0.01 to 0.52; 4 studies, 1563 participants, Analysis 4.1). Since there was statistically significant, but not considerable, heterogeneity (Chi² P = 0.01, I² = 73%) we used a random‐effects model to calculate the pooled estimate. We observed that trials in this analysis differed in risk of selection and detection bias and population size (fewer than 40 versus more than 400) and type of stable angina diagnosis (macrovascular angina versus microvascular angina), which may explain heterogeneity.
Acute myocardial infarction (AMI) incidence
Fatal AMI incidence
We found no data on fatal AMI for ranolazine given as monotherapy compared to placebo. Two studies reported data on fatal AMI events for ranolazine 1000 mg twice daily given as add‐on therapy compared to placebo (ERICA 2006; TERISA 2013). Low quality evidence showed uncertain effect for the risk of fatal AMI between intervention and placebo group participants (RR 1.51, 95% CI 0.25 to 9.05; 2 studies, 1509 participants; Analysis 3.3). There was no statistically significant heterogeneity (Chi² P = 0.23, I² = 31%).
Non‐fatal AMI incidence
Two studies reported non‐fatal AMI incidence for ranolazine 1000 mg twice daily given as monotherapy compared to placebo (Pelliccia 2012; RIVER‐PCI 2016). Very low quality evidence showed that participants in both intervention and control groups were at similar risk of non‐fatal AMI (RR 0.55, 95% CI 0.14 to 2.15; 2 studies, 2674 participants; Analysis 1.4). Since there was statistically significant, but not considerable, heterogeneity (Chi² P = 0.06, I² = 73%) we used a random‐effects model to calculate the pooled estimate. We observed that studies in this analysis differed in risk of performance and detection bias and duration of follow‐up (30 days versus 643 days), which may explain heterogeneity.
One study reported non‐fatal AMI incidence for ranolazine given as monotherapy compared to placebo (RAN080 2005), making a total of three studies for ranolazine any dose (400 mg three times daily and 1000 mg twice daily) comparison. Low quality evidence showed that intervention and control group participants were at a similar risk of non‐fatal AMI (RR 0.88, 95% CI 0.69 to 1.12; 2983 participants, Analysis 2.1). There was no statistically significant heterogeneity (Chi² P = 0.13, I² = 50%).
Two other studies reported non‐fatal AMI incidence for ranolazine 1000 mg twice daily given as add‐on therapy compared to placebo (ERICA 2006; TERISA 2013). Low quality evidence showed that participants in both groups were at a similar risk of suffering a non‐fatal AMI (RR 0.40, 95% CI 0.08 to 2.07, 1509 participants, Analysis 3.4). There was no heterogeneity (Chi² P = 0.81, I² = 0%).
Need for revascularisation procedure
Two studies reported incidence of revascularisation procedures for ranolazine 1000 mg twice daily given as monotherapy compared to placebo (Pelliccia 2012; RIVER‐PCI 2016). Moderate quality evidence showed that ranolazine has no effect on the risk of undergoing a revascularisation procedure (RR 0.98, 95% CI 0.82 to 1.18, 2674 participants, Analysis 1.5). There was no heterogeneity (Chi² P = 0.99, I² = 0%).
Angina episodes frequency
Two studies evaluated angina episodes frequency for ranolazine any dose (120 mg 3 times daily and 1000 mg twice daily) given as monotherapy compared to placebo (RWISE 2016; Thadani 1994). Low quality evidence showed that the average number of angina episodes per week did not differ in the participants in both groups (MD 0.08, 95% CI ‐0.85 to 1.01, 402 participants, Analysis 2.2). There was no heterogeneity (Chi² P = 0.84, I² = 0%).
Three studies evaluated angina episodes frequency for ranolazine 1000 mg twice daily given as add‐on therapy (to adrenergic beta antagonists and calcium channel blockers) compared to placebo (CARISA 2004; ERICA 2006; TERISA 2013). Moderate quality evidence showed that the average number of angina episodes per week was lower in the participants who received ranolazine (MD ‐0.66, 95% CI ‐0.97 to ‐0.35, 2004 participants, Analysis 3.5). There was no statistically significant heterogeneity (Chi² P = 0.19, I² = 39%).
Costs of healthcare
None of the included trials reported data on costs and resource use of the management of stable angina participants. We found that only one trial (RIVER‐PCI 2016) reported a planned health economics sub‐study (Weisz 2013), but results have not yet been published.
Time to 1‐mm ST‐segment depression
Three studies evaluated time to 1‐mm ST‐segment depression in exercise ECG at peak for ranolazine any dose (375 mg twice daily, 400 mg three times daily and 1000 mg twice daily) given as add‐on therapy compared to placebo (CARISA 2004; Pepine 1999; Villano 2013). Moderate quality evidence showed that the average time to 1‐mm ST‐segment depression in seconds was higher in participants who received ranolazine (MD 34.62, 95% CI 33.08 to 36.16, 1198 participants, Analysis 4.2). There was no statistically significant heterogeneity (Chi² P = 0.23, I² = 31%).
Data were also available for ranolazine given as monotherapy compared to placebo; however, pooled estimates showed substantial heterogeneity (I² = 90% to 99%) which precluded us from including those results in the quantitative synthesis. We observed that studies included in this analysis differed notably in design (parallel‐group versus cross‐over), duration of follow‐up (< 1 month versus ˜12 months), number of participants (< 200 versus > 3000), and baseline 1‐mm ST‐segment depression (< 260 s versus > 430 s).
Safety
The main results are summarised in forest plots for ranolazine given as monotherapy compared to placebo (Analysis 1.6, Analysis 2.3) and as add‐on therapy compared to placebo (Analysis 3.6). Data from other trials are also reported for ranolazine given as monotherapy compared to placebo for adverse events incidence (Pepine 1999; Thadani 1994) which could not be pooled for meta‐analysis due to incompleteness. Similarly, data for ranolazine given as add‐on therapy compared to placebo for adverse events incidence (Shammas 2015, Villano 2013) could not be pooled for meta‐analysis due to incompleteness. Missing data have been requested from the study contact authors. Although no quantitative analysis could be performed for specific events, it was observed that the most frequently reported events were dizziness, nausea and constipation. 'Other' which included peripheral oedema, headache, asthenia, palpitations, dyspepsia, weakness and postural hypotension, was the most commonly re[ported category.
Adverse events incidence
Serious adverse events
We found insufficient data on serious adverse events to perform quantitative synthesis. Although the included studies reported types of serious adverse events inconsistently, we summarised data into three categories:
-
Cerebrovascular events: Two studies (RIVER‐PCI 2016; RWISE 2016) reported data for ranolazine 1000 mg twice daily given as monotherapy compared to placebo. RIVER‐PCI 2016 reported 22/1317 and 20/1287 events of stroke and 13/1317 and 3/1287 events of transitory ischaemic attack among participants who received ranolazine and placebo respectively. RWISE 2016 reported 2/128 and 0/128 events of pre‐syncope and 1/128 and 0/128 events of syncope among participants who received ranolazine and placebo respectively. Three other studies (ERICA 2006; Shammas 2015; TERISA 2013) reported data for ranolazine 1000 mg twice daily given as add‐on therapy compared to placebo. ERICA 2006 reported that there were no events of stroke in any treatment groups. Shammas 2015 reported 1/24 and 0/24 events of stroke among participants given ranolazine and placebo respectively. TERISA 2013 reported 1/470 and 4/474 events of stroke among participants given ranolazine and placebo respectively. Pooling data resulted in RR of 0.56 (95% CI 0.12 to 2.60, 3 studies, 1557 participants, Chi² P = 0.21, I² = 38%).
-
Heart failure: Only RIVER‐PCI 2016 reported data for ranolazine 1000 mg twice daily given as monotherapy compared to placebo. RIVER‐PCI 2016 reported heart failure events requiring hospitalisation (further classified as ischaemia and non‐ischemia‐related) in 38/1317 and 25/1287 of participants given ranolazine and placebo respectively.
-
Arrhythmias: None of the included studies reported arrhythmia‐related hospitalisations. However two trials reported symptomatic documented arrhythmias for ranolazine 1000 mg twice daily given as monotherapy (MERLIN‐TIMI 36 2007) and as add‐on therapy (ERICA 2006) compared to placebo. MERLIN‐TIMI 36 2007 (stable angina patients subgroup) reported 52/1785 and 52/1775 symptomatic documented arrhythmias among participants given ranolazine and placebo respectively. ERICA 2006 reported 8/281 and 10/284 arrhythmias (ventricular extrasystoles, sinus bradycardias, sinus tachycardias and atrioventricular blockages) among participants given ranolazine and placebo respectively. Of note, Shammas 2015 and MERLIN‐TIMI 36 2007 conducted separate recordings of arrhythmias over short periods of the total study duration, which we considered did not fit the purposes of this review.
Some other events were labelled as major or serious adverse events in some trials (RIVER‐PCI 2016; TERISA 2013) but these were not reported in sufficient detail to determine their suitability to meet the definition for this outcome.
Non‐serious adverse events
Two studies reported the incidence of non‐serious adverse events for ranolazine 1000 mg twice daily given as monotherapy compared to placebo (MARISA 2004; RWISE 2016). Very low quality evidence showed that participants in both groups were at similar risk of presenting non‐serious adverse events (RR 1.33, 95% CI 0.90 to 1.98, 638 participants, Analysis 1.6). There was no heterogeneity (Chi² P = 0.79, I² = 0%).
RAN080 2005 reported non‐fatal AMI incidence for ranolazine given as monotherapy compared to placebo. Very low quality evidence showed that the participants treated with ranolazine were at a higher risk of presenting non‐serious adverse events (RR 1.50, 95% CI 1.12 to 2.00, 947 participants, Analysis 2.3). There was no heterogeneity (Chi² P = 0.67, I² = 0%).
Three studies reported incidence of non‐serious adverse events for ranolazine 1000 mg twice daily given as add‐on therapy (to adrenergic beta antagonists and calcium channel blockers) compared to placebo (CARISA 2004; ERICA 2006; TERISA 2013). Moderate quality evidence showed that participants treated with ranolazine were at higher risk of presenting non‐serious adverse events (RR 1.22, 95% CI 1.06 to 1.40; 3 studies, 2053 participants, Analysis 3.6). There was no heterogeneity (Chi² P = 0.68, I² = 0%). Two studies reported incidence of non‐serious adverse events for ranolazine given as add‐on therapy (to adrenergic beta antagonists and calcium channel blockers) compared to placebo (Babalis 2015; Villano 2013). However, since these studies reported no events for each treatment group, individual RRs were not estimable, and could not be pooled with the other studies. Therefore, meta‐analysis for these five studies (Babalis 2015; CARISA 2004; ERICA 2006; TERISA 2013. Villano 2013) was not performed.
Subgroup analysis
We performed subgroup analysis for type of stable angina diagnosis. There were insufficient data to conduct other planned subgroup analyses. This subgroup analysis was performed for non‐serious adverse events incidence for ranolazine given as monotherapy compared to placebo (Analysis 2.3) and for quality of life for ranolazine given as add‐on therapy compared to placebo (Analysis 4.1). The direction and magnitude of the treatment effects for the macrovascular angina subgroups were similar to those of the overall pooled estimates. We observed difference (Chi² P = 0.01) in the pooled estimates between subgroups only for quality of life (Analysis 4.1).
Sensitivity analysis
We performed sensitivity analyses to assess the effects of including only studies at low risk of bias, by switching statistical models for data synthesis (fixed‐effect to random‐effects and vice versa) and changing measures of treatment effects (RRs to ORs, MDs to SMDs and vice versa).
We could not perform sensitivity analysis for change of the measure of treatment effect (MD to SMD) for time to 1‐mm ST‐segment depression because there were insufficient data to inform calculation. We were unable to conduct sensitivity analysis for restriction to trials with low risk of bias for some outcomes because none of the studies initially included was regarded as having low risk of bias. Such outcomes are: adverse events incidence (for ranolazine given as monotherapy at 1000mg twice daily or any dosage versus placebo) and quality of life (for any dose ranolazine given as monotherapy versus placebo).
Overall, we found no major differences in either the direction or magnitude of treatment effects except for the quality of life outcome for ranolazine 1000 mg twice daily given as add‐on therapy versus placebo (Analysis 6.10) or any dose ranolazine given as add‐on therapy versus placebo (Analysis 6.15). For these two analyses, the measure of treatment effect became statistically significant after changing the model (random‐effects to fixed‐effect).
We also performed a sensitivity analysis to assess the effect of including only studies with follow‐up duration of at least six weeks. We were unable to conduct this sensitivity analysis for some outcomes because none of the studies initially included reported results from follow‐up ≥ 6 weeks (leaving 0 trials for analysis). Such outcomes are: adverse events incidence (for ranolazine given as monotherapy at 1000mg twice daily or any dosage versus placebo), quality of life (for any dose ranolazine given as monotherapy versus placebo) and time to 1‐mm ST‐segment depression (Microvascular angina subgroup, for any dose ranolazine given as add‐on therapy versus placebo).
We found no major differences in either the direction or magnitude of treatment effects except for quality of life with ranolazine 1000 mg monotherapy administered twice daily versus placebo (Analysis 8.2). For this analysis, the measure of treatment effect changed direction from favouring ranolazine to favouring placebo, but remained not statistically significant. We observed that heterogeneity in Analysis 1.4 (2 studies) may be explained by differences in duration of follow‐up (1 week versus 643 days). Heterogeneity in Analysis 4.1 (4 studies) was not explained by differences in duration of follow‐up.
Discussion
Summary of main results
We included 17 randomised controlled trials (RCTs). We found evidence on the effects of ranolazine compared to placebo given as monotherapy and as add‐on therapy for people with stable angina pectoris from 14 RCTs. Three studies did not provide data for quantitative analysis.
For ranolazine given as add‐on therapy (summary of findings Table for the main comparison), we found no evidence for the effect on cardiovascular and non‐cardiovascular mortality. We also found low quality evidence of uncertain effect on all‐cause mortality (for ranolazine 1000mg twice daily), moderate quality evidence of uncertain effect on quality of life (for any dose ranolazine), and low quality evidence of uncertain effect on AMI incidence (for ranolazine 1000mg twice daily). We assessed moderate quality evidence for reduced frequency of angina episodes with the use of ranolazine 1000mg twice daily. There was moderate quality evidence for increased time to 1‐mm ST‐segment depression in exercise electrocardiogram (ECG) associated with the use of any dose ranolazine. There was moderate quality evidence of increased risk of non‐serious adverse events with the use of ranolazine 1000mg twice daily.
In relation to ranolazine as monotherapy (summary of findings Table 2), we found low quality evidence of uncertain effect on cardiovascular mortality (for ranolazine 1000mg twice daily) and no evidence of the effect on non‐cardiovascular mortality. We also found low quality evidence of uncertain effect on all‐cause mortality (for ranolazine 1000mg twice daily), moderate quality evidence of uncertain effect on quality of life (for ranolazine 1000mg twice daily), low quality evidence of uncertain effect on non‐fatal acute myocardial infarction (AMI) incidence (for any dose ranolazine), and frequency of angina episodes (for any dose ranolazine). We found moderate quality evidence of no effect on need for revascularisation procedures (for ranolazine 1000mg twice daily), and very low quality evidence for increased risk of non‐serious adverse events (for any dose ranolazine).
Overall, we found evidence of clinical benefit from the use of ranolazine as add‐on therapy by reducing the frequency of angina episodes and increasing the time to 1‐mm ST‐segment depression. However, we found also evidence of clinical harm from the use of ranolazine as either monotherapy or add‐on therapy by increasing the risk of non‐serious adverse events.
We found evidence on the effects of ranolazine compared to other anti‐angina agents (atenolol, ivabradine and trimetazidine) for people with stable angina from three RCTs, but these data were insufficient to perform quantitative synthesis.
We found evidence of differential effect on quality of life for any dose ranolazine given as add‐on therapy compared to placebo according to the type of stable angina (macrovascular versus microvascular).
The sensitivity analyses generally showed no major differences in the results we obtained. For any dose ranolazine given as monotherapy, no trials left after restricting to studies with low risk of bias or follow‐up ≥ 6 weeks for angina episodes frequency and adverse events incidence. For ranolazine given as add‐on therapy, a modest increase in quality of life was obtained with a fixed‐effect model (exchange of model for data synthesis).
Overall completeness and applicability of evidence
Several gaps in the evidence remain. Data were available for the primary effectiveness outcome (cardiovascular mortality) from only one study (RIVER‐PCI 2016). None of the included studies reported results on the primary safety outcome (non‐cardiovascular mortality). Similarly, no data were available for healthcare costs; RIVER‐PCI 2016 included a sub study on health economics but results have not yet been published. No data from head‐to‐head comparisons on ranolazine versus other anti‐anginals were available for quantitative synthesis. Only three trials reported data on these later comparisons (ranolazine versus other anti‐anginals); all had small population sizes (40 participants to 158 participants). Notably, we found no studies that compared ranolazine with a calcium channel blocker, long‐acting nitrate or nicorandil. We therefore present findings for ranolazine compared to placebo only.
Assessment of external validity of our results should consider the following.
-
The included studies varied in several important aspects: (a) ranolazine dosage and type of formulation, (b) the presence of comorbidity (type 2 diabetes mellitus, acute coronary syndrome, incomplete revascularisation); (c) concomitant medication (permitted), with some participant groups labelled as 'monotherapy' actually receiving concomitant anti‐anginal drugs at varying proportions; and (d) duration of follow‐up ranged from one week to more than two years.
-
The diagnostic criteria for stable angina varied among included studies. Three studies included in the quantitative analysis restricted study populations to people with microvascular angina. Diagnostic criteria roughly fell into either of two categories for the remaining studies: clinical diagnosis (history of exertional angina) and angiographic diagnosis (evidence of macrovascular coronary disease). Studies applying clinical diagnosis enabled enrolment of people with macrovascular and microvascular angina.
-
Taken together, the included studies enrolled participants from multiple sites mainly in North America, Europe and Australia, with less contribution from people in Asia and Africa, and no representation of Central and South American region peoples.
The marked heterogeneity among the included studies regarding the characteristics listed above, along with paucity of data for most planned comparisons and subgroup analyses meant that some components of review questions remain unresolved.
Quality of the evidence
We included data from 14 RCTs (9292 participants) to the 'Summary of findings' tables. Although studies were heterogeneous in individual quality assessments, most shared important characteristics such as a parallel‐group (8/14), double‐blind design (11/14), macrovascular angina population (6/14), 1000 mg twice daily dosage for ranolazine (10/14) and intention‐to‐treat analysis approach (9/14, explicitly stated). Fewer than 10% of participants randomised to all studies were lost to follow‐up. However, allocation concealment and blinding of study personnel were not described for most studies, rendering unclear risk of bias. Of note, an important part of the evidence in this review came from trials deemed at high risk of bias related to the source of funding and conflicts of interest, since every analysis we report includes at least one trial with that characteristic.
None of the results obtained were deemed to be high quality. Evidence quality was low for the primary outcomes (cardiovascular mortality). In relation to secondary outcomes, evidence quality was lower for ranolazine given as monotherapy than as add‐on therapy. This was due in part to the indirectness of the comparison for ranolazine given as monotherapy (a group of participants actually received ranolazine as add‐on therapy).
Overall, evidence quality was low for all‐cause mortality, moderate for quality of life, low for non‐fatal AMI incidence, low to moderate for frequency of angina episodes (low for ranolazine as monotherapy and moderate for ranolazine as add‐on therapy) and very low to moderate for non‐serious adverse events incidence (very low for ranolazine as monotherapy and moderate for ranolazine as add‐on therapy).
We downgraded quality of life evidence by one level due to indirectness concerns or substantial heterogeneity. We downgraded evidence quality for non‐fatal AMI incidence due to risk of bias concerns (by one level) or imprecision of the estimate (by one or two levels). We downgraded evidence quality for frequency of angina episodes due to risk of bias or indirectness concerns. We also downgraded evidence quality for non‐serious adverse events incidence due to risk of bias and indirectness concerns or small number of events.
Potential biases in the review process
The risk of having introduced bias throughout the review process was limited given that study selection, data extraction and assessment of risk of bias were performed by pairs of authors who worked independently to reach consensus. Comprehensive electronic and other resources searches were performed to identify all potentially relevant studies for this review. Nevertheless, there are a number of potential biases in the review process given the presence of some limitations: 1) few additional data were obtained apart from published data; 2) all available data were summarised irrespective of study quality; and 3) insufficient data to perform planned subgroup analyses. We also made some deviations from the published protocol during the review process (see Differences between protocol and review) which we considered to be appropriate and did not change the conclusions of the review.
Agreements and disagreements with other studies or reviews
The available evidence regarding the use of ranolazine in people with stable angina pectoris has been systematically analysed in some studies. Two systematic reviews (Banon 2014; Savarese 2013) studied the effects of ranolazine given as monotherapy or as add‐on therapy for people with stable angina. Another systematic review (Belsey 2015) focused on the effects of ranolazine given as add‐on therapy for people with stable angina. These reviews focused on exercise ECG parameters (duration, time to angina, time to ST‐segment depression). Of these, two also studied weekly frequency of angina attacks and nitroglycerin use (Banon 2014; Savarese 2013). Banon 2014 also assessed quality of life and incidence of adverse events. Although differing in numbers of included studies, these reviews arrived at similar conclusions about the effects of ranolazine compared to placebo for people with stable angina. Results from these reviews show beneficial effect for ranolazine (mainly given as add‐on therapy) on quality of life (data not pooled), frequency of angina attacks, exercise ECG parameters and a harmful effect on adverse events incidence.
Our results regarding quality of life showed that ranolazine (either as monotherapy or add‐on therapy) had uncertain effects for people with stable angina. In relation to other outcomes, our results show a similar direction and magnitude of treatment effect for ranolazine given as add‐on therapy. Notably, our results include data from a greater number of studies, especially for ranolazine given as monotherapy, and data on other relevant outcomes, such as all‐cause mortality, AMI incidence, and need for revascularisation procedure.
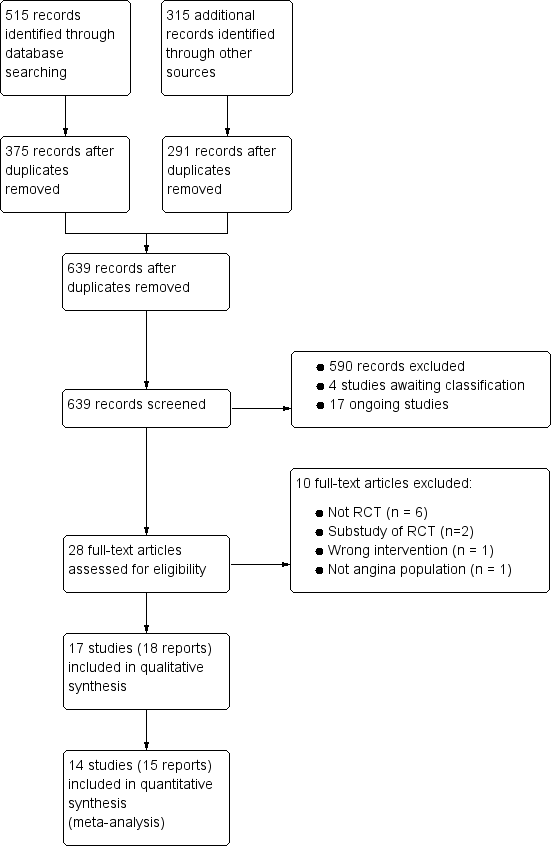
Study flow diagram
†Two included articles report data from the RIVER‐PCI trial
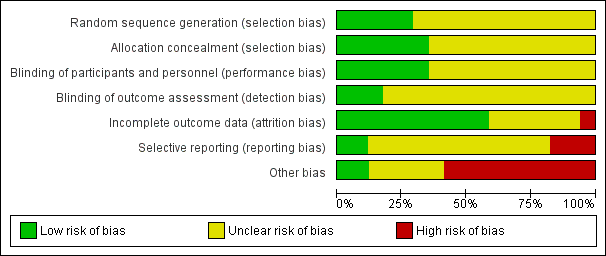
Risk of bias graph: review authors' judgements about each risk of bias item presented as percentages across all included studies

Risk of bias summary: review authors' judgements about each risk of bias item for each included study.
Other bias criteria: we considered the source of funding in this section, we scored high risk of bias if the source of funding was solely from private organisations, unclear risk of bias if it was mixed (private and public) and low risk of bias if it was solely not external or from public organisations.

Comparison 1 Ranolazine (monotherapy) 1000 mg twice daily versus placebo, Outcome 1 Cardiovascular mortality.

Comparison 1 Ranolazine (monotherapy) 1000 mg twice daily versus placebo, Outcome 2 All‐cause mortality.

Comparison 1 Ranolazine (monotherapy) 1000 mg twice daily versus placebo, Outcome 3 Quality of life.

Comparison 1 Ranolazine (monotherapy) 1000 mg twice daily versus placebo, Outcome 4 AMI incidence.
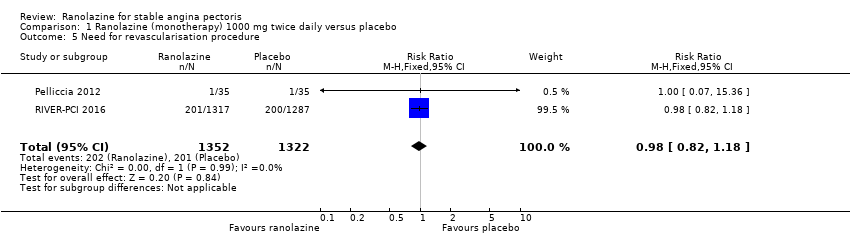
Comparison 1 Ranolazine (monotherapy) 1000 mg twice daily versus placebo, Outcome 5 Need for revascularisation procedure.
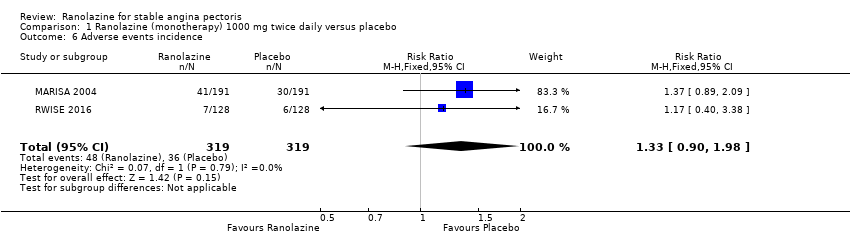
Comparison 1 Ranolazine (monotherapy) 1000 mg twice daily versus placebo, Outcome 6 Adverse events incidence.

Comparison 2 Ranolazine (monotherapy) any dose versus placebo, Outcome 1 AMI incidence.

Comparison 2 Ranolazine (monotherapy) any dose versus placebo, Outcome 2 Angina episodes frequency.

Comparison 2 Ranolazine (monotherapy) any dose versus placebo, Outcome 3 Adverse events incidence.

Comparison 3 Ranolazine (add‐on therapy) 1000 mg twice daily versus placebo, Outcome 1 All‐cause mortality.

Comparison 3 Ranolazine (add‐on therapy) 1000 mg twice daily versus placebo, Outcome 2 Quality of life.

Comparison 3 Ranolazine (add‐on therapy) 1000 mg twice daily versus placebo, Outcome 3 AMI incidence (fatal).

Comparison 3 Ranolazine (add‐on therapy) 1000 mg twice daily versus placebo, Outcome 4 AMI incidence (non‐fatal).
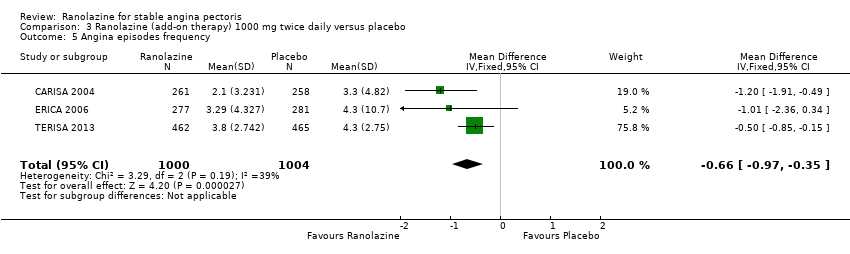
Comparison 3 Ranolazine (add‐on therapy) 1000 mg twice daily versus placebo, Outcome 5 Angina episodes frequency.
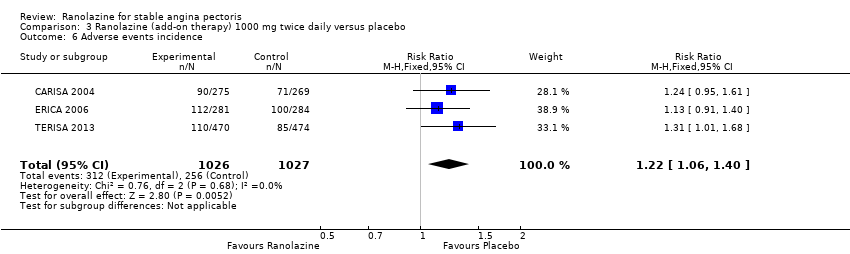
Comparison 3 Ranolazine (add‐on therapy) 1000 mg twice daily versus placebo, Outcome 6 Adverse events incidence.

Comparison 4 Ranolazine (add‐on therapy) any dose versus placebo, Outcome 1 Quality of life.
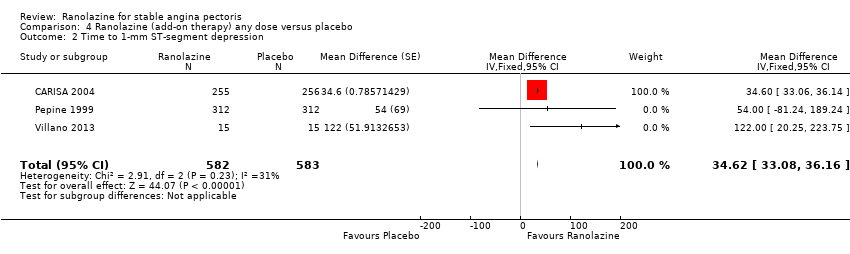
Comparison 4 Ranolazine (add‐on therapy) any dose versus placebo, Outcome 2 Time to 1‐mm ST‐segment depression.
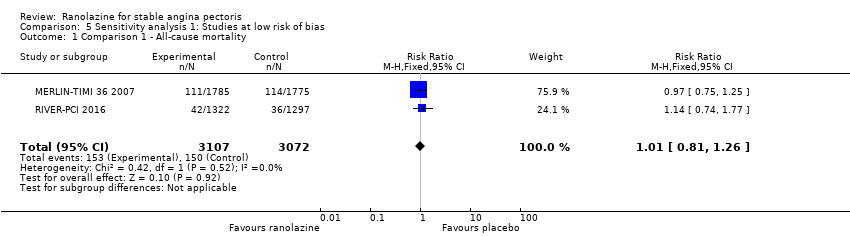
Comparison 5 Sensitivity analysis 1: Studies at low risk of bias, Outcome 1 Comparison 1 ‐ All‐cause mortality.
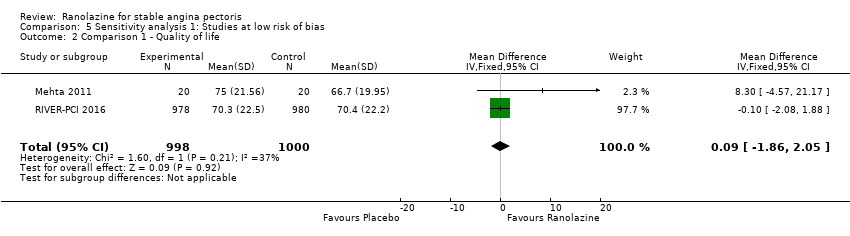
Comparison 5 Sensitivity analysis 1: Studies at low risk of bias, Outcome 2 Comparison 1 ‐ Quality of life.

Comparison 5 Sensitivity analysis 1: Studies at low risk of bias, Outcome 3 Comparison 1 ‐ AMI incidence.
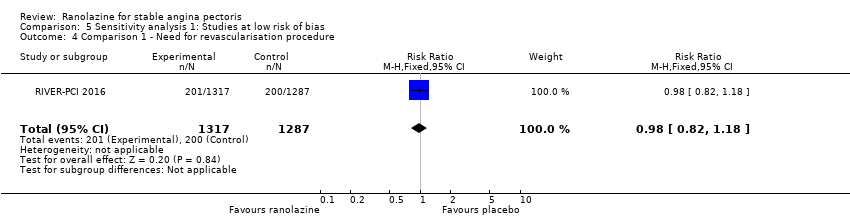
Comparison 5 Sensitivity analysis 1: Studies at low risk of bias, Outcome 4 Comparison 1 ‐ Need for revascularisation procedure.

Comparison 5 Sensitivity analysis 1: Studies at low risk of bias, Outcome 5 Comparison 2 ‐ AMI incidence.

Comparison 5 Sensitivity analysis 1: Studies at low risk of bias, Outcome 6 Comparison 3 ‐ All‐cause mortality.
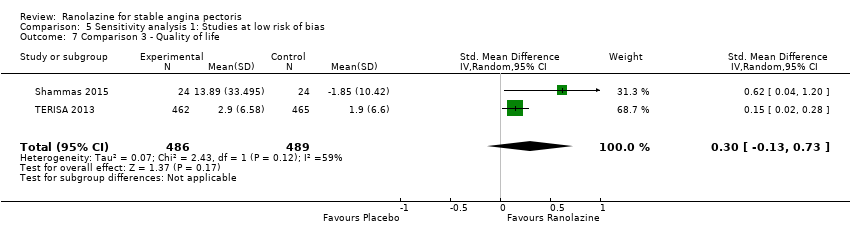
Comparison 5 Sensitivity analysis 1: Studies at low risk of bias, Outcome 7 Comparison 3 ‐ Quality of life.

Comparison 5 Sensitivity analysis 1: Studies at low risk of bias, Outcome 8 Comparison 3 ‐ AMI incidence (fatal).

Comparison 5 Sensitivity analysis 1: Studies at low risk of bias, Outcome 9 Comparison 3 ‐ AMI incidence (non‐fatal).

Comparison 5 Sensitivity analysis 1: Studies at low risk of bias, Outcome 10 Comparison 3 ‐ Angina episodes frequency.
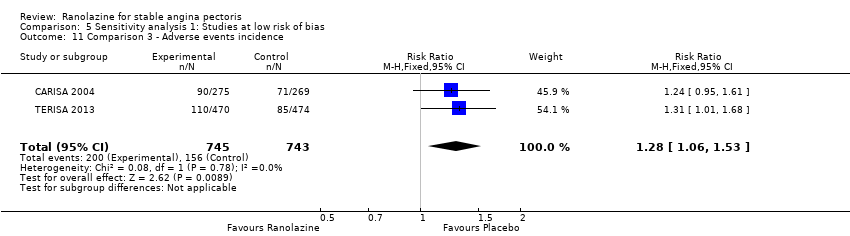
Comparison 5 Sensitivity analysis 1: Studies at low risk of bias, Outcome 11 Comparison 3 ‐ Adverse events incidence.

Comparison 5 Sensitivity analysis 1: Studies at low risk of bias, Outcome 12 Comparison 4 ‐ Quality of life.

Comparison 5 Sensitivity analysis 1: Studies at low risk of bias, Outcome 13 Comparison 4 ‐ Time to 1‐mm ST‐segment depression.
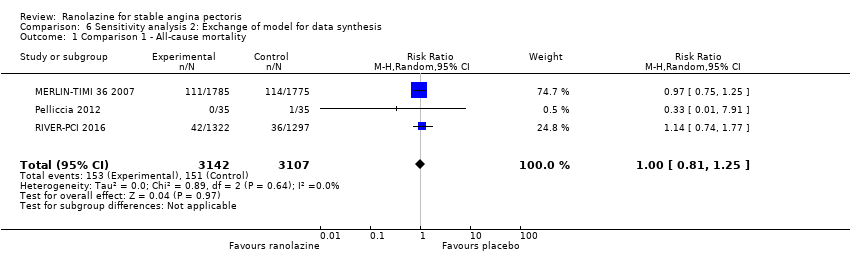
Comparison 6 Sensitivity analysis 2: Exchange of model for data synthesis, Outcome 1 Comparison 1 ‐ All‐cause mortality.

Comparison 6 Sensitivity analysis 2: Exchange of model for data synthesis, Outcome 2 Comparison 1 ‐ Quality of life.

Comparison 6 Sensitivity analysis 2: Exchange of model for data synthesis, Outcome 3 Comparison 1 ‐ AMI incidence.
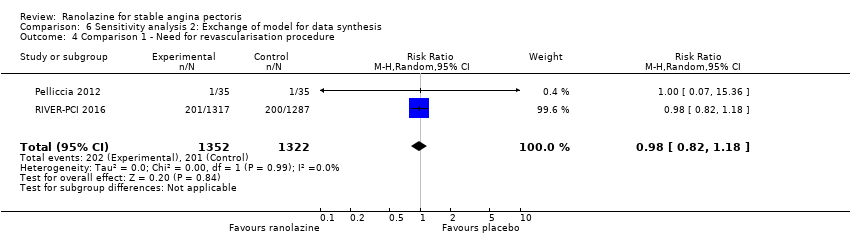
Comparison 6 Sensitivity analysis 2: Exchange of model for data synthesis, Outcome 4 Comparison 1 ‐ Need for revascularisation procedure.

Comparison 6 Sensitivity analysis 2: Exchange of model for data synthesis, Outcome 5 Comparison 1 ‐ Adverse events incidence.

Comparison 6 Sensitivity analysis 2: Exchange of model for data synthesis, Outcome 6 Comparison 2 ‐ AMI incidence.

Comparison 6 Sensitivity analysis 2: Exchange of model for data synthesis, Outcome 7 Comparison 2 ‐ Angina episodes frequency.
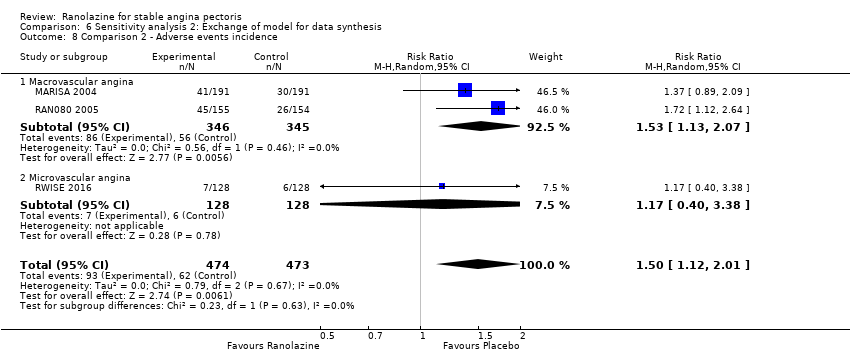
Comparison 6 Sensitivity analysis 2: Exchange of model for data synthesis, Outcome 8 Comparison 2 ‐ Adverse events incidence.

Comparison 6 Sensitivity analysis 2: Exchange of model for data synthesis, Outcome 9 Comparison 3 ‐ All‐cause mortality.

Comparison 6 Sensitivity analysis 2: Exchange of model for data synthesis, Outcome 10 Comparison 3 ‐ Quality of life.

Comparison 6 Sensitivity analysis 2: Exchange of model for data synthesis, Outcome 11 Comparison 3 ‐ AMI incidence (fatal).
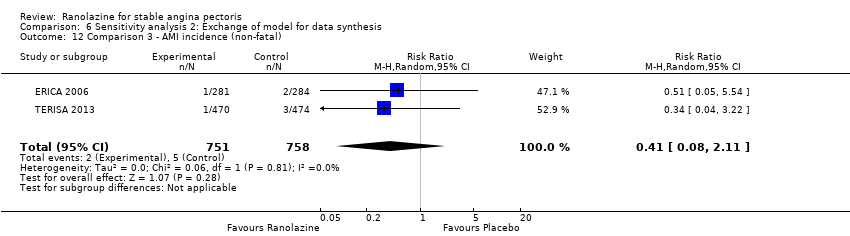
Comparison 6 Sensitivity analysis 2: Exchange of model for data synthesis, Outcome 12 Comparison 3 ‐ AMI incidence (non‐fatal).

Comparison 6 Sensitivity analysis 2: Exchange of model for data synthesis, Outcome 13 Comparison 3 ‐ Angina episodes frequency.
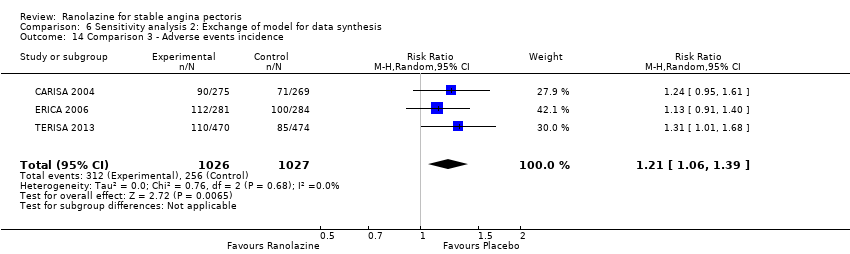
Comparison 6 Sensitivity analysis 2: Exchange of model for data synthesis, Outcome 14 Comparison 3 ‐ Adverse events incidence.
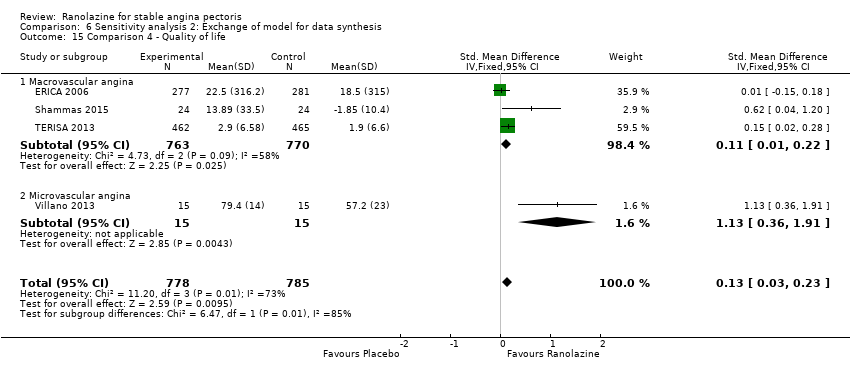
Comparison 6 Sensitivity analysis 2: Exchange of model for data synthesis, Outcome 15 Comparison 4 ‐ Quality of life.

Comparison 6 Sensitivity analysis 2: Exchange of model for data synthesis, Outcome 16 Comparison 4 ‐ Time to 1‐mm ST‐segment depression.

Comparison 7 Sensitivity analysis 3: Change of the measure of treatment effect, Outcome 1 Comparison 1 ‐ All‐cause mortality.

Comparison 7 Sensitivity analysis 3: Change of the measure of treatment effect, Outcome 2 Comparison 1 ‐ Quality of life.
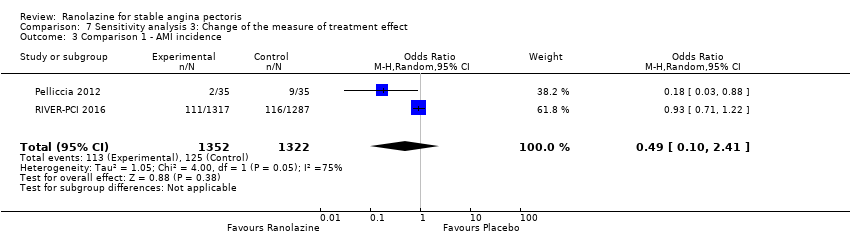
Comparison 7 Sensitivity analysis 3: Change of the measure of treatment effect, Outcome 3 Comparison 1 ‐ AMI incidence.

Comparison 7 Sensitivity analysis 3: Change of the measure of treatment effect, Outcome 4 Comparison 1 ‐ Need for revascularisation procedure.

Comparison 7 Sensitivity analysis 3: Change of the measure of treatment effect, Outcome 5 Comparison 1 ‐ Adverse events incidence.

Comparison 7 Sensitivity analysis 3: Change of the measure of treatment effect, Outcome 6 Comparison 2 ‐ AMI incidence.

Comparison 7 Sensitivity analysis 3: Change of the measure of treatment effect, Outcome 7 Comparison 2 ‐ Angina episodes frequency.
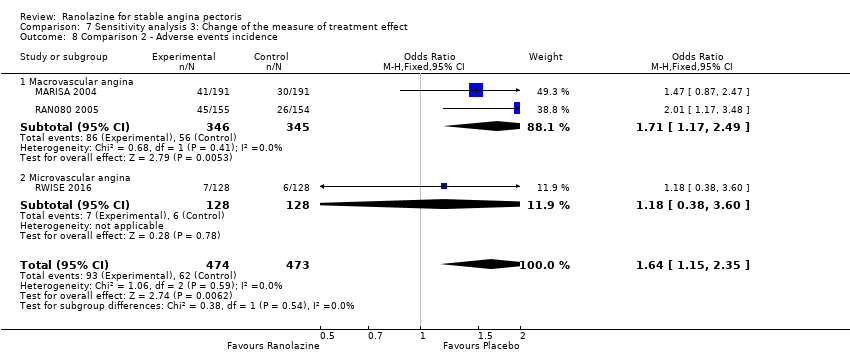
Comparison 7 Sensitivity analysis 3: Change of the measure of treatment effect, Outcome 8 Comparison 2 ‐ Adverse events incidence.
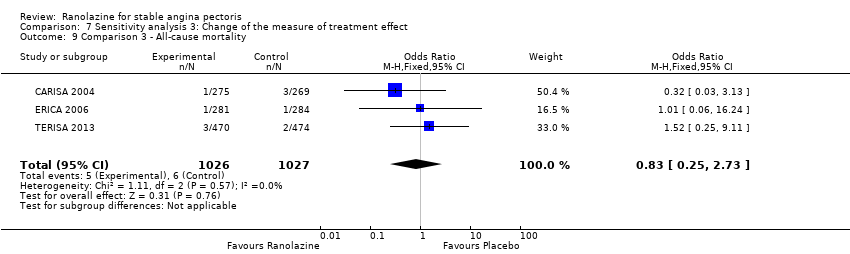
Comparison 7 Sensitivity analysis 3: Change of the measure of treatment effect, Outcome 9 Comparison 3 ‐ All‐cause mortality.

Comparison 7 Sensitivity analysis 3: Change of the measure of treatment effect, Outcome 10 Comparison 3 ‐ Quality of life.

Comparison 7 Sensitivity analysis 3: Change of the measure of treatment effect, Outcome 11 Comparison 3 ‐ AMI incidence (fatal).
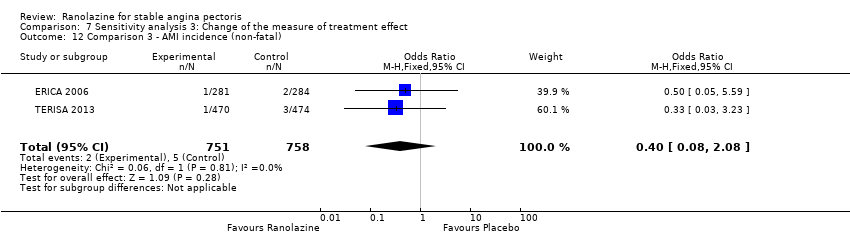
Comparison 7 Sensitivity analysis 3: Change of the measure of treatment effect, Outcome 12 Comparison 3 ‐ AMI incidence (non‐fatal).
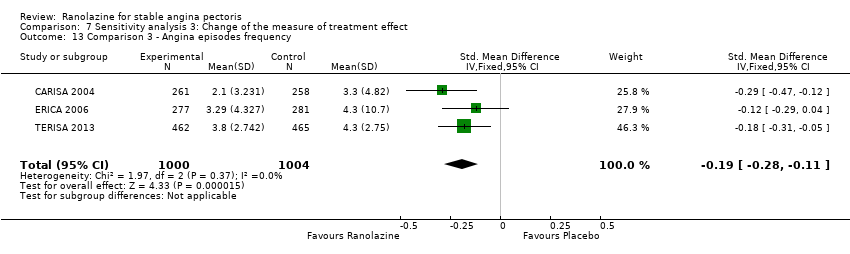
Comparison 7 Sensitivity analysis 3: Change of the measure of treatment effect, Outcome 13 Comparison 3 ‐ Angina episodes frequency.

Comparison 7 Sensitivity analysis 3: Change of the measure of treatment effect, Outcome 14 Comparison 3 ‐ Adverse events incidence.

Comparison 7 Sensitivity analysis 3: Change of the measure of treatment effect, Outcome 15 Comparison 4 ‐ Quality of life.

Comparison 8 Sensitivity analysis 4: follow‐up ≥ 6 weeks, Outcome 1 Comparison 1 ‐ All‐cause mortality.

Comparison 8 Sensitivity analysis 4: follow‐up ≥ 6 weeks, Outcome 2 Comparison 1 ‐ Quality of life.
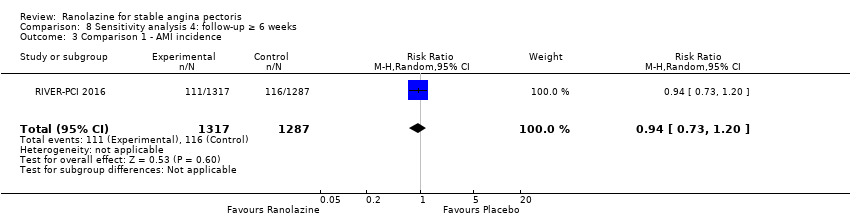
Comparison 8 Sensitivity analysis 4: follow‐up ≥ 6 weeks, Outcome 3 Comparison 1 ‐ AMI incidence.

Comparison 8 Sensitivity analysis 4: follow‐up ≥ 6 weeks, Outcome 4 Comparison 1 ‐ Need for revascularisation procedure.
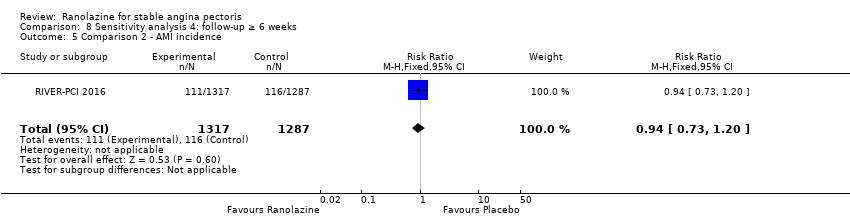
Comparison 8 Sensitivity analysis 4: follow‐up ≥ 6 weeks, Outcome 5 Comparison 2 ‐ AMI incidence.

Comparison 8 Sensitivity analysis 4: follow‐up ≥ 6 weeks, Outcome 6 Comparison 3 ‐ All‐cause mortality.
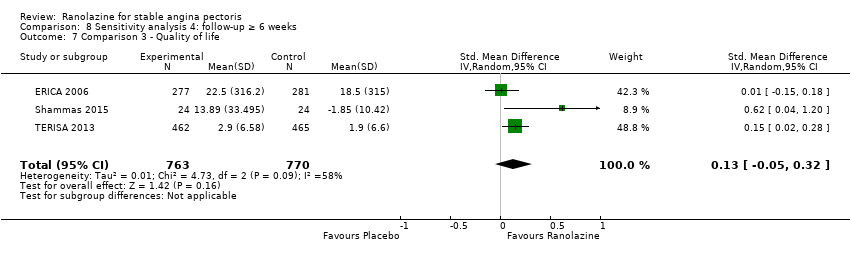
Comparison 8 Sensitivity analysis 4: follow‐up ≥ 6 weeks, Outcome 7 Comparison 3 ‐ Quality of life.

Comparison 8 Sensitivity analysis 4: follow‐up ≥ 6 weeks, Outcome 8 Comparison 3 ‐ AMI incidence (fatal).

Comparison 8 Sensitivity analysis 4: follow‐up ≥ 6 weeks, Outcome 9 Comparison 3 ‐ AMI incidence (non‐fatal).

Comparison 8 Sensitivity analysis 4: follow‐up ≥ 6 weeks, Outcome 10 Comparison 3 ‐ Angina episodes frequency.

Comparison 8 Sensitivity analysis 4: follow‐up ≥ 6 weeks, Outcome 11 Comparison 3 ‐ Adverse events incidence.
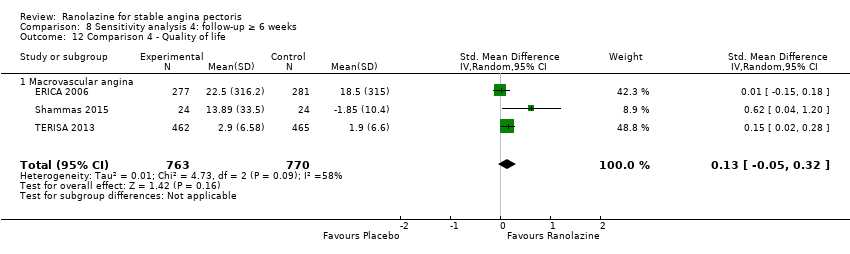
Comparison 8 Sensitivity analysis 4: follow‐up ≥ 6 weeks, Outcome 12 Comparison 4 ‐ Quality of life.

Comparison 8 Sensitivity analysis 4: follow‐up ≥ 6 weeks, Outcome 13 Comparison 4 ‐ Time to 1‐mm ST‐segment depression.
| Ranolazine (add‐on therapy) versus placebo for stable angina pectoris* | ||||||
| Patient or population: patients with stable angina pectoris | ||||||
| Outcomes | Illustrative comparative risks** (95% CI) | Relative effect | No of Participants | Quality of the evidence | Comments | |
| Assumed risk | Corresponding risk | |||||
| Placebo | Ranolazine | |||||
| Cardiovascular mortality ‐ not reported | See comment | See comment | Not estimable | ‐ | See comment | No data were available for this outcome |
| Non‐cardiovascular mortality ‐ not reported | See comment | See comment | Not estimable | ‐ | See comment | No data were available for this outcome |
| All‐cause mortality | 6 per 1000 | 5 per 1000 | RR 0.83 | 2053 | ⊕⊕⊝⊝ | Ranolazine 1000 mg twice daily |
| Quality of life | Mean quality of life in control group participants was | Mean quality of life in intervention group participants was | 1563 | ⊕⊕⊕⊝ | Ranolazine any dose (SMD 0.25, 95% CI ‐0.01 to 0.52) | |
| AMI incidence | 7 per 1000 | 3 per 1000 | RR 0.40 | 1509 | ⊕⊕⊝⊝ | Ranolazine 1000 mg twice daily |
| Angina episodes frequency | Mean angina episode frequency in control group participants was | Mean angina episodes frequency in intervention group participants was | 2004 | ⊕⊕⊕⊝ | Ranolazine 1000 mg twice daily (MD ‐0.66, 95% CI ‐0.97 to ‐0.35) | |
| Adverse events incidence | 241 per 1000 | 294 per 1000 | RR 1.22 | 2123 | ⊕⊕⊕⊝ | Ranolazine 1000 mg twice daily |
| *Add‐on therapy: refers to the addition of ranolazine to an antianginal regimen already in course. The results reported correspond to the comparisons (data and analyses) 3 and 4 of the review (involving ranolazine given at 1000mg twice daily or any dosage); this is specified in the Comments column. **The assumed risk is based on the median control group risk across studies. The corresponding risk (and its 95% confidence interval) is based on the assumed risk in the comparison group and the relative effect of the intervention (and its 95% CI). | ||||||
| GRADE Working Group grades of evidence | ||||||
| ¹ Quality of evidence was downgraded one level due to unclear risk of bias regarding blinding of outcome assessment and incomplete outcome data | ||||||
| Ranolazine (monotherapy) versus placebo for stable angina pectoris* | ||||||
| Patient or population: patients with stable angina pectoris | ||||||
| Outcomes | Illustrative comparative risks** (95% CI) | Relative effect | No of Participants | Quality of the evidence | Comments | |
| Assumed risk | Corresponding risk | |||||
| Placebo | Ranolazine | |||||
| Cardiovascular mortality | 16 per 1000 | 16 per 1000 | RR 1.03 | 2604 | ⊕⊕⊝⊝ | Ranolazine 1000 mg twice daily |
| Non‐cardiovascular mortality ‐ not reported | See comment | See comment | Not estimable | ‐ | See comment | No data were available for this outcome |
| All‐cause mortality | 49 per 1000 | 49 per 1000 | RR 1.00 | 6249 | ⊕⊕⊝⊝ | Ranolazine 1000 mg twice daily |
| Quality of life | Mean quality of life in control group participants was | Mean quality of life in intervention group participants was | 2256 | ⊕⊕⊕⊝ | Ranolazine 1000 mg twice daily (MD 0.28. 95% CI ‐1.57 to 2.13) | |
| AMI incidence | 85 per 1000 | 75 per 1000 | RR 0.88 | 2983 | ⊕⊕⊝⊝ | Ranolazine any dose |
| Angina episodes frequency | Mean angina episode frequency in control group participants was | Mean angina episode frequency in intervention group participants was | 402 | ⊕⊕⊝⊝ | Ranolazine any dose (MD 0.08, 95% CI ‐0.85 to 1.01) | |
| Adverse events incidence | 131 per 1000 | 197 per 1000 | RR 1.50 | 947 | ⊕⊝⊝⊝ | Ranolazine any dose |
| *Monotherapy: refers to the administration of ranolazine as the only antianginal drug. The results reported correspond to the comparisons (data and analyses) 1 and 2 of the review (involving ranolazine given at 1000mg twice daily or any dosage); this is specified in the Comments column. **The assumed risk is based on the median control group risk across studies. The corresponding risk (and its 95% confidence interval) is based on the assumed risk in the comparison group and the relative effect of the intervention (and its 95% CI). | ||||||
| GRADE Working Group grades of evidence | ||||||
| ¹ Quality of evidence was downgraded one level due to unclear risk of bias regarding allocation concealment and high risk of bias regarding selective reporting | ||||||
| Outcome or subgroup title | No. of studies | No. of participants | Statistical method | Effect size |
| 1 Cardiovascular mortality Show forest plot | 1 | 2604 | Risk Ratio (M‐H, Fixed, 95% CI) | 1.03 [0.56, 1.88] |
| 2 All‐cause mortality Show forest plot | 3 | 6249 | Risk Ratio (M‐H, Fixed, 95% CI) | 1.00 [0.81, 1.25] |
| 3 Quality of life Show forest plot | 3 | 2254 | Mean Difference (IV, Fixed, 95% CI) | 0.28 [‐1.57, 2.13] |
| 4 AMI incidence Show forest plot | 2 | 2674 | Risk Ratio (M‐H, Random, 95% CI) | 0.55 [0.14, 2.15] |
| 5 Need for revascularisation procedure Show forest plot | 2 | 2674 | Risk Ratio (M‐H, Fixed, 95% CI) | 0.98 [0.82, 1.18] |
| 6 Adverse events incidence Show forest plot | 2 | 638 | Risk Ratio (M‐H, Fixed, 95% CI) | 1.33 [0.90, 1.98] |
| Outcome or subgroup title | No. of studies | No. of participants | Statistical method | Effect size |
| 1 AMI incidence Show forest plot | 3 | 2983 | Risk Ratio (M‐H, Fixed, 95% CI) | 0.88 [0.69, 1.12] |
| 2 Angina episodes frequency Show forest plot | 2 | 402 | Mean Difference (IV, Fixed, 95% CI) | 0.08 [‐0.85, 1.01] |
| 3 Adverse events incidence Show forest plot | 3 | 947 | Risk Ratio (M‐H, Fixed, 95% CI) | 1.50 [1.12, 2.00] |
| 3.1 Macrovascular angina | 2 | 691 | Risk Ratio (M‐H, Fixed, 95% CI) | 1.53 [1.13, 2.07] |
| 3.2 Microvascular angina | 1 | 256 | Risk Ratio (M‐H, Fixed, 95% CI) | 1.17 [0.40, 3.38] |
| Outcome or subgroup title | No. of studies | No. of participants | Statistical method | Effect size |
| 1 All‐cause mortality Show forest plot | 3 | 2053 | Risk Ratio (M‐H, Fixed, 95% CI) | 0.83 [0.26, 2.71] |
| 2 Quality of life Show forest plot | 3 | 1533 | Std. Mean Difference (IV, Random, 95% CI) | 0.13 [‐0.05, 0.32] |
| 3 AMI incidence (fatal) Show forest plot | 2 | 1509 | Risk Ratio (M‐H, Fixed, 95% CI) | 1.51 [0.25, 9.05] |
| 4 AMI incidence (non‐fatal) Show forest plot | 2 | 1509 | Risk Ratio (M‐H, Fixed, 95% CI) | 0.40 [0.08, 2.07] |
| 5 Angina episodes frequency Show forest plot | 3 | 2004 | Mean Difference (IV, Fixed, 95% CI) | ‐0.66 [‐0.97, ‐0.35] |
| 6 Adverse events incidence Show forest plot | 3 | 2053 | Risk Ratio (M‐H, Fixed, 95% CI) | 1.22 [1.06, 1.40] |
| Outcome or subgroup title | No. of studies | No. of participants | Statistical method | Effect size |
| 1 Quality of life Show forest plot | 4 | 1563 | Std. Mean Difference (IV, Random, 95% CI) | 0.25 [‐0.01, 0.52] |
| 1.1 Macrovascular angina | 3 | 1533 | Std. Mean Difference (IV, Random, 95% CI) | 0.13 [‐0.05, 0.32] |
| 1.2 Microvascular angina | 1 | 30 | Std. Mean Difference (IV, Random, 95% CI) | 1.13 [0.36, 1.91] |
| 2 Time to 1‐mm ST‐segment depression Show forest plot | 3 | 1165 | Mean Difference (Fixed, 95% CI) | 34.62 [33.08, 36.16] |
| Outcome or subgroup title | No. of studies | No. of participants | Statistical method | Effect size |
| 1 Comparison 1 ‐ All‐cause mortality Show forest plot | 2 | 6179 | Risk Ratio (M‐H, Fixed, 95% CI) | 1.01 [0.81, 1.26] |
| 2 Comparison 1 ‐ Quality of life Show forest plot | 2 | 1998 | Mean Difference (IV, Fixed, 95% CI) | 0.09 [‐1.86, 2.05] |
| 3 Comparison 1 ‐ AMI incidence Show forest plot | 1 | 2604 | Risk Ratio (M‐H, Random, 95% CI) | 0.94 [0.73, 1.20] |
| 4 Comparison 1 ‐ Need for revascularisation procedure Show forest plot | 1 | 2604 | Risk Ratio (M‐H, Fixed, 95% CI) | 0.98 [0.82, 1.18] |
| 5 Comparison 2 ‐ AMI incidence Show forest plot | 1 | 2604 | Risk Ratio (M‐H, Fixed, 95% CI) | 0.94 [0.73, 1.20] |
| 6 Comparison 3 ‐ All‐cause mortality Show forest plot | 2 | 1488 | Risk Ratio (M‐H, Fixed, 95% CI) | 0.80 [0.22, 2.95] |
| 7 Comparison 3 ‐ Quality of life Show forest plot | 2 | 975 | Std. Mean Difference (IV, Random, 95% CI) | 0.30 [‐0.13, 0.73] |
| 8 Comparison 3 ‐ AMI incidence (fatal) Show forest plot | 1 | 944 | Risk Ratio (M‐H, Fixed, 95% CI) | 5.04 [0.24, 104.75] |
| 9 Comparison 3 ‐ AMI incidence (non‐fatal) Show forest plot | 1 | 944 | Risk Ratio (M‐H, Fixed, 95% CI) | 0.34 [0.04, 3.22] |
| 10 Comparison 3 ‐ Angina episodes frequency Show forest plot | 2 | 1446 | Mean Difference (IV, Fixed, 95% CI) | ‐0.64 [‐0.96, ‐0.32] |
| 11 Comparison 3 ‐ Adverse events incidence Show forest plot | 2 | 1488 | Risk Ratio (M‐H, Fixed, 95% CI) | 1.28 [1.06, 1.53] |
| 12 Comparison 4 ‐ Quality of life Show forest plot | 3 | 1005 | Std. Mean Difference (IV, Random, 95% CI) | 0.54 [‐0.03, 1.10] |
| 12.1 Macrovascular angina | 2 | 975 | Std. Mean Difference (IV, Random, 95% CI) | 0.30 [‐0.13, 0.73] |
| 12.2 Microvascular angina | 1 | 30 | Std. Mean Difference (IV, Random, 95% CI) | 1.13 [0.36, 1.91] |
| 13 Comparison 4 ‐ Time to 1‐mm ST‐segment depression Show forest plot | 2 | Mean Difference (Fixed, 95% CI) | 34.62 [33.08, 36.16] | |
| Outcome or subgroup title | No. of studies | No. of participants | Statistical method | Effect size |
| 1 Comparison 1 ‐ All‐cause mortality Show forest plot | 3 | 6249 | Risk Ratio (M‐H, Random, 95% CI) | 1.00 [0.81, 1.25] |
| 2 Comparison 1 ‐ Quality of life Show forest plot | 3 | 2254 | Mean Difference (IV, Random, 95% CI) | 0.28 [‐1.57, 2.13] |
| 3 Comparison 1 ‐ AMI incidence Show forest plot | 2 | 2674 | Risk Ratio (M‐H, Fixed, 95% CI) | 0.88 [0.69, 1.13] |
| 4 Comparison 1 ‐ Need for revascularisation procedure Show forest plot | 2 | 2674 | Risk Ratio (M‐H, Random, 95% CI) | 0.98 [0.82, 1.18] |
| 5 Comparison 1 ‐ Adverse events incidence Show forest plot | 2 | 638 | Risk Ratio (M‐H, Random, 95% CI) | 1.34 [0.90, 1.99] |
| 6 Comparison 2 ‐ AMI incidence Show forest plot | 3 | 2983 | Risk Ratio (M‐H, Random, 95% CI) | 0.56 [0.19, 1.63] |
| 7 Comparison 2 ‐ Angina episodes frequency Show forest plot | 2 | 402 | Mean Difference (IV, Random, 95% CI) | 0.08 [‐0.85, 1.01] |
| 8 Comparison 2 ‐ Adverse events incidence Show forest plot | 3 | 947 | Risk Ratio (M‐H, Random, 95% CI) | 1.50 [1.12, 2.01] |
| 8.1 Macrovascular angina | 2 | 691 | Risk Ratio (M‐H, Random, 95% CI) | 1.53 [1.13, 2.07] |
| 8.2 Microvascular angina | 1 | 256 | Risk Ratio (M‐H, Random, 95% CI) | 1.17 [0.40, 3.38] |
| 9 Comparison 3 ‐ All‐cause mortality Show forest plot | 3 | 2053 | Risk Ratio (M‐H, Random, 95% CI) | 0.87 [0.25, 3.04] |
| 10 Comparison 3 ‐ Quality of life Show forest plot | 3 | 1533 | Std. Mean Difference (IV, Fixed, 95% CI) | 0.11 [0.01, 0.22] |
| 11 Comparison 3 ‐ AMI incidence (fatal) Show forest plot | 2 | 1509 | Risk Ratio (M‐H, Random, 95% CI) | 1.37 [0.10, 19.46] |
| 12 Comparison 3 ‐ AMI incidence (non‐fatal) Show forest plot | 2 | 1509 | Risk Ratio (M‐H, Random, 95% CI) | 0.41 [0.08, 2.11] |
| 13 Comparison 3 ‐ Angina episodes frequency Show forest plot | 3 | 2004 | Mean Difference (IV, Random, 95% CI) | ‐0.78 [‐1.28, ‐0.27] |
| 14 Comparison 3 ‐ Adverse events incidence Show forest plot | 3 | 2053 | Risk Ratio (M‐H, Random, 95% CI) | 1.21 [1.06, 1.39] |
| 15 Comparison 4 ‐ Quality of life Show forest plot | 4 | 1563 | Std. Mean Difference (IV, Fixed, 95% CI) | 0.13 [0.03, 0.23] |
| 15.1 Macrovascular angina | 3 | 1533 | Std. Mean Difference (IV, Fixed, 95% CI) | 0.11 [0.01, 0.22] |
| 15.2 Microvascular angina | 1 | 30 | Std. Mean Difference (IV, Fixed, 95% CI) | 1.13 [0.36, 1.91] |
| 16 Comparison 4 ‐ Time to 1‐mm ST‐segment depression Show forest plot | 3 | Mean Difference (Random, 95% CI) | 51.05 [4.05, 98.04] | |
| Outcome or subgroup title | No. of studies | No. of participants | Statistical method | Effect size |
| 1 Comparison 1 ‐ All‐cause mortality Show forest plot | 3 | 6249 | Odds Ratio (M‐H, Fixed, 95% CI) | 1.00 [0.80, 1.27] |
| 2 Comparison 1 ‐ Quality of life Show forest plot | 3 | 2254 | Std. Mean Difference (IV, Fixed, 95% CI) | 0.01 [‐0.07, 0.09] |
| 3 Comparison 1 ‐ AMI incidence Show forest plot | 2 | 2674 | Odds Ratio (M‐H, Random, 95% CI) | 0.49 [0.10, 2.41] |
| 4 Comparison 1 ‐ Need for revascularisation procedure Show forest plot | 2 | 2674 | Odds Ratio (M‐H, Fixed, 95% CI) | 0.98 [0.79, 1.21] |
| 5 Comparison 1 ‐ Adverse events incidence Show forest plot | 2 | 638 | Odds Ratio (M‐H, Fixed, 95% CI) | 1.41 [0.88, 2.26] |
| 6 Comparison 2 ‐ AMI incidence Show forest plot | 3 | 2983 | Odds Ratio (M‐H, Fixed, 95% CI) | 0.87 [0.67, 1.13] |
| 7 Comparison 2 ‐ Angina episodes frequency Show forest plot | 2 | 402 | Std. Mean Difference (IV, Fixed, 95% CI) | 0.01 [‐0.19, 0.20] |
| 8 Comparison 2 ‐ Adverse events incidence Show forest plot | 3 | 947 | Odds Ratio (M‐H, Fixed, 95% CI) | 1.64 [1.15, 2.35] |
| 8.1 Macrovascular angina | 2 | 691 | Odds Ratio (M‐H, Fixed, 95% CI) | 1.71 [1.17, 2.49] |
| 8.2 Microvascular angina | 1 | 256 | Odds Ratio (M‐H, Fixed, 95% CI) | 1.18 [0.38, 3.60] |
| 9 Comparison 3 ‐ All‐cause mortality Show forest plot | 3 | 2053 | Odds Ratio (M‐H, Fixed, 95% CI) | 0.83 [0.25, 2.73] |
| 10 Comparison 3 ‐ Quality of life Show forest plot | 3 | 1533 | Mean Difference (IV, Random, 95% CI) | 5.91 [‐5.52, 17.34] |
| 11 Comparison 3 ‐ AMI incidence (fatal) Show forest plot | 2 | 1509 | Odds Ratio (M‐H, Fixed, 95% CI) | 1.52 [0.25, 9.09] |
| 12 Comparison 3 ‐ AMI incidence (non‐fatal) Show forest plot | 2 | 1509 | Odds Ratio (M‐H, Fixed, 95% CI) | 0.40 [0.08, 2.08] |
| 13 Comparison 3 ‐ Angina episodes frequency Show forest plot | 3 | 2004 | Std. Mean Difference (IV, Fixed, 95% CI) | ‐0.19 [‐0.28, ‐0.11] |
| 14 Comparison 3 ‐ Adverse events incidence Show forest plot | 3 | 2053 | Odds Ratio (M‐H, Fixed, 95% CI) | 1.32 [1.09, 1.61] |
| 15 Comparison 4 ‐ Quality of life Show forest plot | 4 | 1563 | Mean Difference (IV, Random, 95% CI) | 11.17 [‐2.54, 24.87] |
| 15.1 Macrovascular angina | 3 | 1533 | Mean Difference (IV, Random, 95% CI) | 5.91 [‐5.52, 17.34] |
| 15.2 Microvascular angina | 1 | 30 | Mean Difference (IV, Random, 95% CI) | 22.20 [8.57, 35.83] |
| Outcome or subgroup title | No. of studies | No. of participants | Statistical method | Effect size |
| 1 Comparison 1 ‐ All‐cause mortality Show forest plot | 2 | 6179 | Risk Ratio (M‐H, Fixed, 95% CI) | 1.01 [0.81, 1.26] |
| 2 Comparison 1 ‐ Quality of life Show forest plot | 1 | 1958 | Mean Difference (IV, Fixed, 95% CI) | ‐0.10 [‐2.08, 1.88] |
| 3 Comparison 1 ‐ AMI incidence Show forest plot | 1 | 2604 | Risk Ratio (M‐H, Random, 95% CI) | 0.94 [0.73, 1.20] |
| 4 Comparison 1 ‐ Need for revascularisation procedure Show forest plot | 1 | 2604 | Risk Ratio (M‐H, Fixed, 95% CI) | 0.98 [0.82, 1.18] |
| 5 Comparison 2 ‐ AMI incidence Show forest plot | 1 | 2604 | Risk Ratio (M‐H, Fixed, 95% CI) | 0.94 [0.73, 1.20] |
| 6 Comparison 3 ‐ All‐cause mortality Show forest plot | 3 | 2053 | Risk Ratio (M‐H, Fixed, 95% CI) | 0.83 [0.26, 2.71] |
| 7 Comparison 3 ‐ Quality of life Show forest plot | 3 | 1533 | Std. Mean Difference (IV, Random, 95% CI) | 0.13 [‐0.05, 0.32] |
| 8 Comparison 3 ‐ AMI incidence (fatal) Show forest plot | 2 | 1509 | Risk Ratio (M‐H, Fixed, 95% CI) | 1.51 [0.25, 9.05] |
| 9 Comparison 3 ‐ AMI incidence (non‐fatal) Show forest plot | 2 | 1509 | Risk Ratio (M‐H, Fixed, 95% CI) | 0.40 [0.08, 2.07] |
| 10 Comparison 3 ‐ Angina episodes frequency Show forest plot | 3 | 2004 | Mean Difference (IV, Fixed, 95% CI) | ‐0.66 [‐0.97, ‐0.35] |
| 11 Comparison 3 ‐ Adverse events incidence Show forest plot | 3 | 2053 | Risk Ratio (M‐H, Fixed, 95% CI) | 1.22 [1.06, 1.40] |
| 12 Comparison 4 ‐ Quality of life Show forest plot | 3 | 1533 | Std. Mean Difference (IV, Random, 95% CI) | 0.13 [‐0.05, 0.32] |
| 12.1 Macrovascular angina | 3 | 1533 | Std. Mean Difference (IV, Random, 95% CI) | 0.13 [‐0.05, 0.32] |
| 13 Comparison 4 ‐ Time to 1‐mm ST‐segment depression Show forest plot | 1 | Mean Difference (Fixed, 95% CI) | 34.6 [33.06, 36.14] | |