Chequeos presenciales versus a distancia para el asma
Información
- DOI:
- https://doi.org/10.1002/14651858.CD011715.pub2Copiar DOI

- Base de datos:
-
- Cochrane Database of Systematic Reviews
- Versión publicada:
-
- 18 abril 2016see what's new
- Tipo:
-
- Intervention
- Etapa:
-
- Review
- Grupo Editorial Cochrane:
-
Grupo Cochrane de Vías respiratorias
- Copyright:
-
- Copyright © 2016 The Cochrane Collaboration. Published by John Wiley & Sons, Ltd.
Cifras del artículo
Altmetric:
Citado por:
Autores
Contributions of authors
Kayleigh Kew (KK) wrote the text of the Background and Methods, with significant comments and clinical input from Christopher Cates (CJC). Both review authors extracted and checked the data. KK contacted study authors for additional data, entered data into the analyses and wrote up the results. Both review authors contributed to the results interpretation, grading of the evidence and preparation of the final manuscript.
Sources of support
Internal sources
-
Kayleigh Kew, UK.
Supported by St George's, University of London
External sources
-
National Institute for Health Research, UK.
Evidence to guide care in adults and children with asthma, 13/89/14
Declarations of interest
Kayleigh Kew has no known conflicts of interest.
Christopher Cates has no known conflicts of interest.
Acknowledgements
We are grateful to the Cochrane Airways Group (CAG) staff for comments and support. We thank Simone Hashimoto, Hilary Pinnock and Linda Makowska Rasmussen who provided additional data and clarified the methods for three of the included studies.
Rebecca Normansell was the Editor for this review and commented critically on this review.
The Background and Methods sections of this review are based on a standard template used by Cochrane Airways.
The Background section shares similarities with another Cochrane review we co‐developed (Kew 2015a).
The National Clinical Guideline Centre (NCGC) and the CAG undertook collaborative work pertaining to a systematic review of published evidence on tele‐healthcare for monitoring asthma control. The CAG reviews are restricted to interventions that involve a healthcare professional only. This is different from the larger question addressed by the NCGC (as part of the National Institute for Health and Care Excellence (NICE) asthma guideline commission). The NCGC review of evidence is published in the NICE clinical guideline on asthma diagnosis and monitoring and received funding from NICE.
Version history
| Published | Title | Stage | Authors | Version |
| 2016 Apr 18 | Remote versus face‐to‐face check‐ups for asthma | Review | Kayleigh M Kew, Christopher J Cates | |
| 2015 May 27 | Remote versus face‐to‐face asthma reviews | Protocol | Kayleigh M Kew, Christopher J Cates | |
Differences between protocol and review
We assessed participant and personnel blinding separately for the objective and subjective outcomes, which we had not planned in the protocol (Kew 2015b). We were unable to conduct the subgroup analyses for age and type of technology due to an insufficient number of included studies.
We included exacerbations that required hospital admission rather than adverse events in the 'Summary of findings' table. We could not include both as we had to keep to seven outcomes to adhere to guidelines, and we considered the hospital admission data to be more important than all adverse events which tended to be reported as part of the exacerbation and resource us data in the studies.
We removed a sentence about searching manufacturer websites from the methods as it came from a template and is irrelevant to this research question.
As discussed in the 'Unit of analysis issues' section, we did not anticipate the inclusion of a cluster randomised controlled trial (RCT) so we had not outlined how we would deal with Pinnock 2007a, a large two‐cluster implementation study that we identified. We included it because it met the other inclusion criteria, but we presented it separately from the other studies due to the differences in the study's design and analyses. For clarity in the analyses and write‐up, we referred to Pinnock 2007a as the 'cluster implementation study' and Chan 2007, Gruffydd‐Jones 2005, Pinnock 2003 and Rasmussen 2005 as the 'efficacy RCTs'. There were only two clusters so we included the data with participants as the unit of analysis.
Keywords
MeSH
Medical Subject Headings (MeSH) Keywords
Medical Subject Headings Check Words
Adult; Child; Humans;
PICO
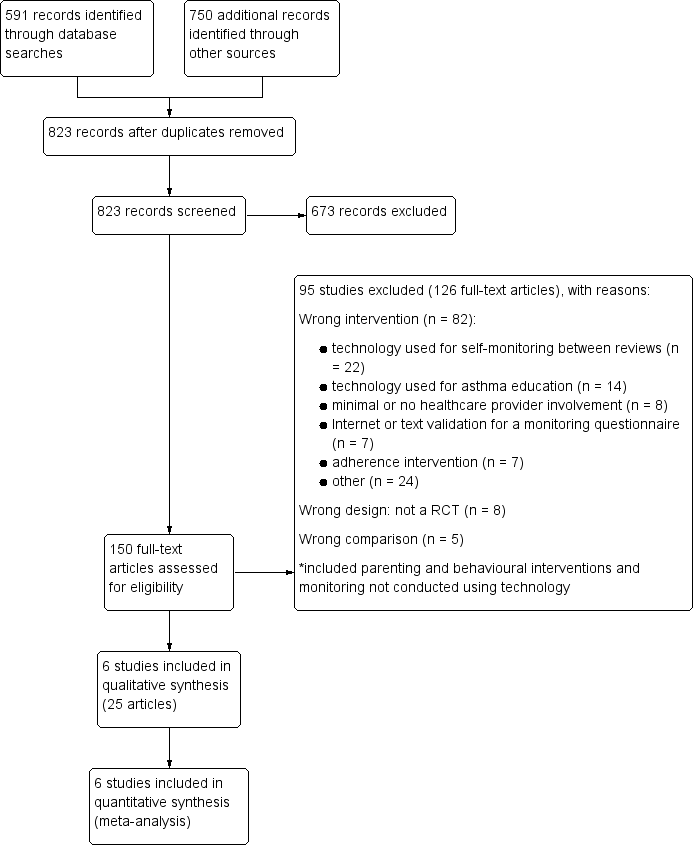
Study flow diagram

'Risk of bias' summary: review authors' judgements about each 'Risk of bias' item for each included study.
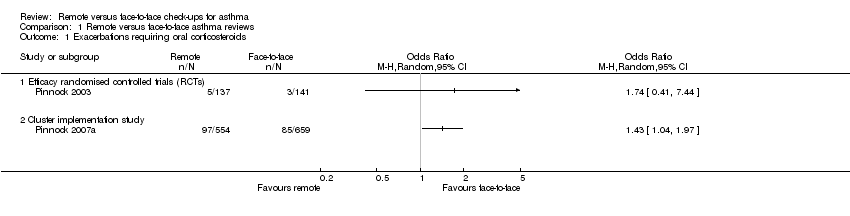
Comparison 1 Remote versus face‐to‐face asthma reviews, Outcome 1 Exacerbations requiring oral corticosteroids.
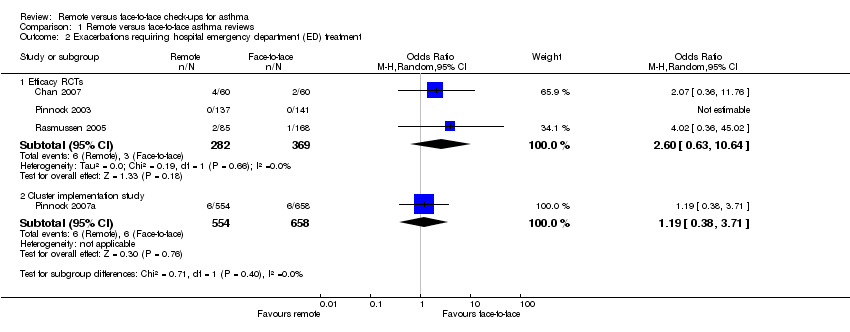
Comparison 1 Remote versus face‐to‐face asthma reviews, Outcome 2 Exacerbations requiring hospital emergency department (ED) treatment.

Comparison 1 Remote versus face‐to‐face asthma reviews, Outcome 3 Exacerbations requiring hospital admission.

Comparison 1 Remote versus face‐to‐face asthma reviews, Outcome 4 Asthma control (Asthma Control Questionnaire (ACQ)).
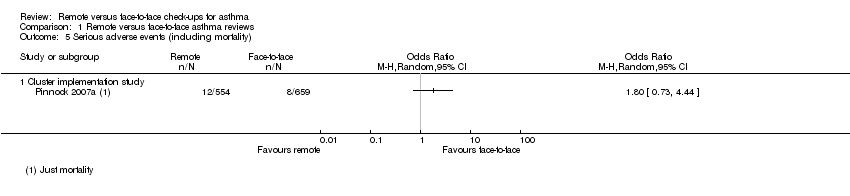
Comparison 1 Remote versus face‐to‐face asthma reviews, Outcome 5 Serious adverse events (including mortality).

Comparison 1 Remote versus face‐to‐face asthma reviews, Outcome 6 Asthma‐related quality of life (Asthma Quality of Life Questionnaire (AQLQ).
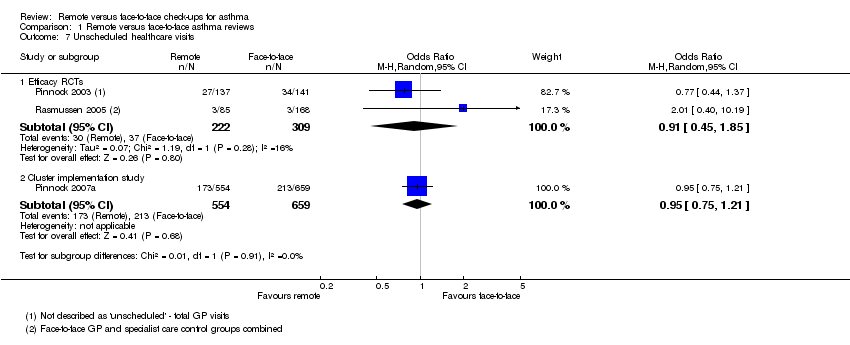
Comparison 1 Remote versus face‐to‐face asthma reviews, Outcome 7 Unscheduled healthcare visits.

Comparison 1 Remote versus face‐to‐face asthma reviews, Outcome 8 Change in lung function (trough FEV1).
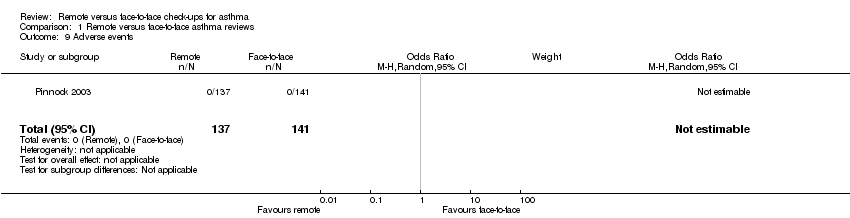
Comparison 1 Remote versus face‐to‐face asthma reviews, Outcome 9 Adverse events.

Comparison 2 Remote versus face‐to‐face for OCS tapering, Outcome 1 Exacerbations requiring hospital admission.

Comparison 2 Remote versus face‐to‐face for OCS tapering, Outcome 2 Asthma control (ACQ).

Comparison 2 Remote versus face‐to‐face for OCS tapering, Outcome 3 Asthma‐related quality of life (AQLQ).
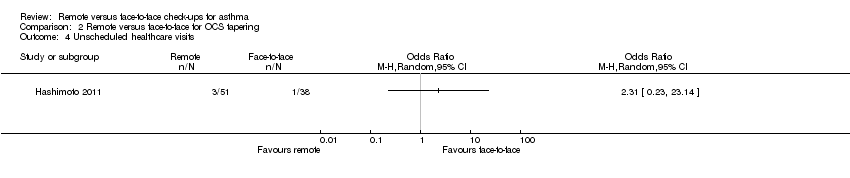
Comparison 2 Remote versus face‐to‐face for OCS tapering, Outcome 4 Unscheduled healthcare visits.

Comparison 2 Remote versus face‐to‐face for OCS tapering, Outcome 5 Adverse events.
| Remote versus face‐to‐face check‐ups for asthma | ||||||
| Patient or population: adults or children with asthma | ||||||
| Outcomes | Anticipated absolute effects* (95% CI) | Relative effect | Number of participants | Quality of the evidence | Comments | |
| Risk with face‐to‐face check‐ups | Risk with remote check‐ups | |||||
| Exacerbations requiring oral corticosteroids | 21 per 1000 | 36 per 1000 | OR 1.74 | 278 | ⊕⊕⊝⊝ | Very imprecise. Data from the implementation study** were consistent. |
| Exacerbations requiring hospital admission 6 months | 5 per 1000 | 3 per 1000 | Peto OR 0.63 | 651 | ⊕⊕⊝⊝ | Very few events ‐ no conclusion could be drawn. The implementation study was more in favour of face‐to‐face check‐ups. |
| Asthma control (ACQ) Scale 0 to 6; lower is better | The mean ACQ score with face‐to‐face check‐ups improved by 0.11 | The mean ACQ score with remote check‐ups improved by 0.07 more (0.35 more to 0.21 less) | ― | 146 | ⊕⊕⊕⊝ | No difference and CIs ruled out significant harm of remote check‐ups (MCID for the ACQ is 0.5). The implementation study results were consistent. |
| Serious adverse events (including mortality) | ― | ― | ― | 0 RCTs | ― | No efficacy studies reported all‐cause SAEs. The implementation study recorded 12/554 and 8/659 in the remote and face‐to‐face groups respectively (OR 1.80, 95% CI 0.73 to 4.44) |
| Asthma‐related quality of life (AQLQ) Scale 1 to 7; higher is better 8 months | The mean AQLQ score with face‐to‐face check‐ups was 5.49 | The mean AQLQ score with remote check‐ups was 0.08 better (0.14 worse to 0.30 better) | ― | 544 | ⊕⊕⊕⊝ | No difference and CIs ruled out significant harm of remote check‐ups (MCID for the AQLQ is 0.5). The implementation study results were consistent. |
| Unscheduled healthcare visits 5 months | 120 per 1000 | 110 per 1000 | OR 0.91 | 531 | ⊕⊕⊝⊝ | Very few events ‐ we could not draw any conclusions. The implementation study was more precise and did not show a difference. |
| Lung function (trough FEV1) 6 months | The mean trough FEV1 with face‐to‐face check‐ups was 20 mL | The mean trough FEV1 with remote check‐ups was 166.76 mL better (78.03 more to 255.5 more) | ― | 253 | ⊕⊕⊕⊝ | People having remote check‐ups had better lung function than those seen face‐to‐face in the one study that measured it. |
| *The risk in the intervention group (and its 95% CI) is based on the assumed risk in the comparison group and the relative effect of the intervention (and its 95% CI). The risk with face‐to‐face check‐ups for continuous outcomes was calculated as a weighted mean of the face‐to‐face values. **The 'Implementation study', Pinnock 2007a, had a two‐cluster pragmatic design and was not pooled with the rest of the included studies (efficacy studies). Durations were calculated as a weighted mean duration of the studies contributing data to the analysis. | ||||||
| GRADE Working Group grades of evidence | ||||||
| 1Studies were at high risk of bias for one or more blinding domains but it is unlikely that this had an effect on the objective outcomes (no downgrade). | ||||||
| Study ID | Total N | Country | Duration | Mean age | % male | % FEV1 | Intervention | Control |
| 120 | Hawaii, USA | 12 months | 9.6 | 62.5 | 100.5 | In‐home, website‐based case management and education. | In‐person education and case management. | |
| 194 | UK | 12 months | 50.2 | 45.4 | NR | 6‐monthly phone calls from trained asthma nurses. Formulation of individual AAP. | 6‐monthly usual face‐to‐face appointment with an asthma nurse. Symptoms, peak flow and inhaler technique checked, and participants were issued with an AAP. | |
| 95 | The Netherlands | 6 months | 50.1 | 45.3 | 73.9 | OCS dose adjustment guided by an internet‐based diary, decision support and monitoring with support from a study nurse. | OCS dose adjustment according to GINA by the specialist. | |
| 278 | UK | 3 months | 55.5 | 41.4 | NR | Telephone check‐up with the asthma nurse. | Face‐to‐face check‐ups in the surgery with the asthma nurse. | |
| 1728 | UK | 12 months | 42.6 | 44.6 | NR | Three invitations to book either a telephone or face‐to‐face check‐up. Non‐attenders were phoned and reviewed opportunistically. | Three invitations to book a face‐to‐face check‐up. Non‐attenders were not phoned opportunistically. | |
| 300 | Denmark | 6 months | 29 | 34.5 | 92.0 | Participants were given an AAP, online electronic diary and peak flow meter. Physicians gave participants instructions via e‐mail or telephone aided by computer decision support. | The specialists taught the participants how to adjust their medication on the basis of a peak flow meter and AAP. | |
| Total N: the total number of participants randomised in the study, included to groups not analysed in this Cochrane review | ||||||||
| Outcome or subgroup title | No. of studies | No. of participants | Statistical method | Effect size |
| 1 Exacerbations requiring oral corticosteroids Show forest plot | 2 | Odds Ratio (M‐H, Random, 95% CI) | Totals not selected | |
| 1.1 Efficacy randomised controlled trials (RCTs) | 1 | Odds Ratio (M‐H, Random, 95% CI) | 0.0 [0.0, 0.0] | |
| 1.2 Cluster implementation study | 1 | Odds Ratio (M‐H, Random, 95% CI) | 0.0 [0.0, 0.0] | |
| 2 Exacerbations requiring hospital emergency department (ED) treatment Show forest plot | 4 | Odds Ratio (M‐H, Random, 95% CI) | Subtotals only | |
| 2.1 Efficacy RCTs | 3 | 651 | Odds Ratio (M‐H, Random, 95% CI) | 2.60 [0.63, 10.64] |
| 2.2 Cluster implementation study | 1 | 1212 | Odds Ratio (M‐H, Random, 95% CI) | 1.19 [0.38, 3.71] |
| 3 Exacerbations requiring hospital admission Show forest plot | 4 | Peto Odds Ratio (Peto, Fixed, 95% CI) | Subtotals only | |
| 3.1 Efficacy RCTs | 3 | 651 | Peto Odds Ratio (Peto, Fixed, 95% CI) | 0.63 [0.06, 6.32] |
| 3.2 Cluster implementation study | 1 | 1213 | Peto Odds Ratio (Peto, Fixed, 95% CI) | 2.18 [0.83, 5.69] |
| 4 Asthma control (Asthma Control Questionnaire (ACQ)) Show forest plot | 2 | Mean Difference (IV, Random, 95% CI) | Totals not selected | |
| 4.1 Efficacy RCTs | 1 | Mean Difference (IV, Random, 95% CI) | 0.0 [0.0, 0.0] | |
| 4.2 Cluster implementation study | 1 | Mean Difference (IV, Random, 95% CI) | 0.0 [0.0, 0.0] | |
| 5 Serious adverse events (including mortality) Show forest plot | 1 | Odds Ratio (M‐H, Random, 95% CI) | Totals not selected | |
| 5.1 Cluster implementation study | 1 | Odds Ratio (M‐H, Random, 95% CI) | 0.0 [0.0, 0.0] | |
| 6 Asthma‐related quality of life (Asthma Quality of Life Questionnaire (AQLQ) Show forest plot | 4 | Mean Difference (IV, Random, 95% CI) | Subtotals only | |
| 6.1 Efficacy RCTs | 3 | 544 | Mean Difference (IV, Random, 95% CI) | 0.08 [‐0.14, 0.30] |
| 6.2 Cluster implementation study | 1 | 536 | Mean Difference (IV, Random, 95% CI) | ‐0.02 [‐0.23, 0.19] |
| 7 Unscheduled healthcare visits Show forest plot | 3 | Odds Ratio (M‐H, Random, 95% CI) | Subtotals only | |
| 7.1 Efficacy RCTs | 2 | 531 | Odds Ratio (M‐H, Random, 95% CI) | 0.91 [0.45, 1.85] |
| 7.2 Cluster implementation study | 1 | 1213 | Odds Ratio (M‐H, Random, 95% CI) | 0.95 [0.75, 1.21] |
| 8 Change in lung function (trough FEV1) Show forest plot | 1 | Mean Difference (IV, Random, 95% CI) | Totals not selected | |
| 9 Adverse events Show forest plot | 1 | 278 | Odds Ratio (M‐H, Random, 95% CI) | 0.0 [0.0, 0.0] |
| Outcome or subgroup title | No. of studies | No. of participants | Statistical method | Effect size |
| 1 Exacerbations requiring hospital admission Show forest plot | 1 | Odds Ratio (M‐H, Random, 95% CI) | Totals not selected | |
| 2 Asthma control (ACQ) Show forest plot | 1 | Mean Difference (IV, Random, 95% CI) | Totals not selected | |
| 3 Asthma‐related quality of life (AQLQ) Show forest plot | 1 | Mean Difference (IV, Random, 95% CI) | Totals not selected | |
| 4 Unscheduled healthcare visits Show forest plot | 1 | Odds Ratio (M‐H, Random, 95% CI) | Totals not selected | |
| 5 Adverse events Show forest plot | 1 | Odds Ratio (M‐H, Random, 95% CI) | Totals not selected | |