Антибактериальная терапия половых партнеров женщин с бактериальным вагинозом
Abstract
Background
Bacterial vaginosis (BV) is an infection that has a prevalence between 10% to 50% worlwide. BV results in an imbalance of the normal vaginal flora. Microorganisms associated with BV have been isolated from the normal flora of the male genital tract, and their presence could be related to the recurrence of BV after antibiotic treatment. Therefore, the treatment of sexual partners could decrease the recurrence of infection and possibly the burden of the disease.
Objectives
To assess the effectiveness in women and the safety in men of concurrent antibiotic treatment for the sexual partners of women treated for BV.
Search methods
We searched the Cochrane Sexually Transmitted Infections Group Specialized Register (23 July 2016), CENTRAL (1991 to 23 July 2016), MEDLINE (1946 to 23 July 2016), Embase (1974 to 23 July 2016), LILACS (1982 to 23 July 2016), the World Health Organization (WHO) International Clinical Trials Registry Platform (ICTRP) (23 July 2016), ClinicalTrials.gov (23 July 2016) and the Web of Science™ (2001 to 23 July 2016). We also handsearched conference proceedings, contacted trial authors and reviewed the reference lists of retrieved studies.
Selection criteria
Randomized controlled trials (RCTs) that compared the concurrent use of any antibiotic treatment with placebo, no intervention or any other intervention by the sexual partners of women treated for BV.
Data collection and analysis
Three review authors independently assessed trials for inclusion, extracted data and assessed the risk of bias in the included studies. We resolved any disagreements through consensus. We assessed the quality of the evidence using the GRADE approach.
Main results
Seven RCTs (1026 participants) met our inclusion criteria, and pharmaceutical industry funded four of these trials. Five trials (854 patients) compared any antibiotic treatment of sexual partners with placebo. Based on high quality evidence, antibiotic treatment does not increase the rate of clinical or symptomatic improvement in women during the first week (risk ratio (RR) 0.99, 95% confidence interval (CI) 0.96 to 1.03; 712 participants, four studies; RR 1.06, 95% CI 1.00 to 1.12; 577 patients, three studies, respectively), between the first and fourth week (RR 1.02, 95% CI 0.94 to 1.11; 590 participants, three studies; RR 0.93, 95% CI 0.84 to 1.03; 444 participants, two studies; respectively) or after the fourth week (RR 0.98, 95% CI 0.90 to 1.07; 572 participants, four studies; RR 1.03, 95% CI 0.90 to 1.17; 296 participants, two studies; respectively). Antibiotic treatment does not led to a lower recurrence during the first and fourth week (RR 1.28, 95% CI 0.68 to 2.43; 218 participants, one study; low quality evidence) or after the fourth week of treatment (RR 1.00, 95% CI 0.67 to 1.52; 372 participants, three studies; low quality evidence) in women, but increases the frequency of adverse events (most frequently gastrointestinal symptoms) reported by sexual partners (RR 2.55, 95% CI 1.55 to 4.18; 477 participants, three studies; low quality evidence).
Two trials (172 participants) compared any antibiotic treatment for sexual partners with no intervention. When we compared it with no intervention, the effects of antibiotic treatment on recurrence rate after the fourth week (RR 1.71, 95% CI 0.65 to 4.55; 51 participants, one study), clinical improvement between the first and fourth week (RR 0.93, 95% CI 0.70 to 1.25; 152 participants, two studies) and symptomatic improvement after the fourth week (RR 0.66, 95% CI 0.39 to 1.11; 70 participants, one study) were imprecise and there were no differences between groups. We downgraded the quality of the evidence to low or very low.
Authors' conclusions
High quality evidence shows that antibiotic treatment for sexual partners of women with BV, compared with placebo, does not increase the rate of clinical or symptomatic improvement during the first, between the first and fourth or after the fourth week into the women. Low quality evidence suggests that antibiotic treatment does not led to a lower recurrence rate during the first and fourth or after the fourth week of treatment into the women, but increases the frequency of adverse events reported by sexual partners. Finally, compared with no intervention, antibiotic treatment does not decrease the recurrence rate after the fourth week and does not increase the frequency of clinical or symptomatic improvement between the first and fourth or after the fourth week into the women, respectively.
PICO
Резюме на простом языке
Антибактериальная терапия половых партнеров женщин с бактериальным вагинозом
Вопрос обзора
Мы оценивали эффективность (у женщин) и безопасность (у мужчин) одновременного лечения антибиотиками половых партнеров женщин, получающих лечение по поводу бактериального вагиноза (БВ).
Актуальность
Бактериальный вагиноз (БВ) ‐ это инфекция, распространенность которой составляет от 10% до 50% во всем мире. БВ приводит к дисбалансу нормальной микрофлоры влагалища. Микроорганизмы, вызывающие БВ, были выделены из нормальной флоры мужских половых путей, и их присутствие может быть связано с рецидивом инфекции после лечения антибиотиками. Таким образом, лечение половых партнеров может иметь преимущества в снижении риска рецидива инфекции и, возможно, уменьшении заболеваемости.
Характеристика исследований
Исследователи Кокрейн провели поиск доступной литературы по состоянию на 23 июля 2016 года и включили в обзор семь испытаний с участием 1026 человек. Клинические испытания включали сексуально активных небеременных женщин в возрасте от 17 до 56 лет, состоящих или не состоящих в браке, с симптоматическим БВ. В четырех исследованиях участвовали только женщины, состоящие в моногамных гетеросексуальных отношениях, в остальных испытаниях такая информация отсутствовала. В шести испытаниях для лечения полового партнера использовали 5‐нитроимидазолы, в четырех испытаниях использовали метронидазол, и в двух испытаниях использовали тинидазол; только в одном исследовании проводили лечение линкозамидами. В пяти испытаниях сравнивали антибиотик с плацебо (854 участника), и в двух испытаниях сравнивали лечение антибиотиками с отсутствием вмешательства (172 участника). Фармацевтические компании финансировали четыре из проведенных испытаний.
Основные результаты
По сравнению с плацебо, антибактериальная терапия половых партнеров женщин, получавших лечение по поводу БВ, не оказала влияния на клиническое или симптоматическое улучшение у женщин, независимо от периода времени, в течение которого проводилась оценка исходов испытания (на протяжении первой недели, между первой и четвертой неделями, или после четвертой недели). Кроме того, антибактериальная терапия полового партнера, возможно, не влияет на риск рецидива БВ в течение 12 недель после лечения, но может увеличить частоту неблагоприятных событий, о которых сообщали половые партнеры. По сравнению с отсутствием вмешательства, лечение половых партнеров женщин с БВ, возможно, не влияет на снижение частоты рецидивов или частоту клинического или симптоматического улучшения при оценке между первой и четвертой неделями, или после четвертой недели, соответственно.
Качество доказательств
Качество доказательств в отношении исходов клинического или симптоматического улучшения было высоким. Качество доказательств в отношении рецидивов было очень низким из‐за некоторых ограничений, связанных с риском смещения и неточностью.
Authors' conclusions
Summary of findings
| Any antibiotic treatment versus placebo for the sexual partners of woman with bacterial vaginosis | |||||
| Patient or population: sexual partners of women with bacterial vaginosis | |||||
| Outcomes | Anticipated absolute effects* (95% CI) | Relative effect | Number of participants | Quality of the evidence | |
| Risk with placebo | Risk with any antibiotic treatment | ||||
| Recurrence follow‐up 4 to 12 weeks | Study population | RR 1.00 | 372 | ⊕⊝⊝⊝ | |
| 196 per 1000 | 196 per 1000 | ||||
| Clinical improvement follow‐up 1 to 4 weeks | Study population | RR 1.02 | 590 | ⊕⊕⊕⊕ | |
| 778 per 1000 | 794 per 1000 | ||||
| Clinical improvement follow‐up 4 to 12 weeks | Study population | RR 0.98 | 572 | ⊕⊕⊕⊕ | |
| 778 per 1000 | 762 per 1000 | ||||
| Symptomatic improvement during the first week | Study population | RR 1.06 | 577 | ⊕⊕⊕⊕ | |
| 863 per 1000 | 914 per 1000 | ||||
| Symptomatic improvement follow‐up 1 to 4 weeks | Study population | RR 0.93 | 444 | ⊕⊕⊕⊕ | |
| 801 per 1000 | 745 per 1000 | ||||
| Symptomatic improvement follow‐up 4 to 12 weeks | Study population | RR 1.03 | 296 | ⊕⊕⊕⊕ | |
| 743 per 1000 | 766 per 1000 | ||||
| Minor adverse events in sexual partner | Study population | RR 2.55 | 477 | ⊕⊕⊝⊝ | |
| 80 per 1000 | 204 per 1000 | ||||
| *The risk in the intervention group (and its 95% CI) is based on the assumed risk in the comparison group and the relative effect of the intervention (and its 95% CI). | |||||
| GRADE Working Group grades of evidence | |||||
| 1Downgraded by 1 level for significant imprecision as the 95% CI was below 0.75 and over 1.25. | |||||
| Any antibiotic treatment versus no intervention | |||||
| Patient or population: sexual partners of women with bacterial vaginosis | |||||
| Outcomes | Anticipated absolute effects* (95% CI) | Relative effect | Number of participants | Quality of the evidence | |
| Risk with no intervention | Risk with any antibiotic treatment | ||||
| Recurrence follow‐up 4 to 12 weeks | Study population | RR 1.71 | 51 | ⊕⊝⊝⊝ | |
| 194 per 1000 | 333 per 1000 | ||||
| Clinical improvement follow‐up 1 to 4 weeks | Study population | RR 0.93 | 152 | ⊕⊝⊝⊝ | |
| 851 per 1000 | 792 per 1000 | ||||
| Symptomatic improvement follow‐up 4 to 12 weeks | Study population | RR 0.66 | 70 | ⊕⊝⊝⊝ | |
| 630 per 1000 | 416 per 1000 | ||||
| *The risk in the intervention group (and its 95% CI) is based on the assumed risk in the comparison group and the relative effect of the intervention (and its 95% CI). | |||||
| GRADE Working Group grades of evidence | |||||
| 1Downgraded by 2 levels due to imprecision as OIS was not achieved and the 95% CI crosses through 0.75 and 1.25. | |||||
| Any antibiotic treatment versus placebo | |||||
| Patient or population: sexual partners of women with bacterial vaginosis | |||||
| Outcomes | Anticipated absolute effects* (95% CI) | Relative effect | Number of participants | Quality of the evidence | |
| Risk with placebo | Risk with any antibiotic treatment | ||||
| Recurrence | Study population | RR 1.28 | 218 | ⊕⊕⊝⊝ | |
| 132 per 1000 | 169 per 1000 | ||||
| Clinical improvement during the first week | Study population | RR 0.99 | 712 | ⊕⊕⊕⊕ | |
| 951 per 1000 | 942 per 1000 | ||||
| *The risk in the intervention group (and its 95% CI) is based on the assumed risk in the comparison group and the relative effect of the intervention (and its 95% CI). | |||||
| GRADE Working Group grades of evidence | |||||
| 1Downgraded by 2 levels for imprecision as the 95% CI crosses through 0.75 and 1.25 and OIS is not achieved. | |||||
Background
Description of the condition
Secretions from the vagina (known as vaginal discharge) are a normal occurrence and result from cervical secretion and other components derived from micro‐organisms that colonize the vaginal flora, mostly lactobacilli (Mylonas 2011). Lactobacilli play a predominant role in vaginal homeostasis through the production of lactic acid, hydrogen peroxide and bacteriocins, which are compounds that control the overgrowth of pathogenic micro‐organisms (Taylor 2013). An increase in the amount of vaginal discharge is usually associated with the presence of a genital tract infection (Mylonas 2011). Women with an abnormal vaginal discharge most commonly have bacterial vaginosis (BV) (39.6%) or, less frequently, vulvovaginal candidiasis (11%) or trichomoniasis (0.8%); however, the exact etiology of the vaginal discharge can change according to the population (Ángel‐Müller 2012). BV is thought to arise as a result of an imbalance in the normal vaginal flora when lactobacilli decrease in concentration and are replaced by anaerobic and facultative aerobic bacteria (Taylor 2013), such as Gardnerella vaginalis (40%) or, less frequently, by Mycoplasma hominis, Clostridia (Mirmonsef 2012), Peptostreptococcus or Mobiluncus (Mylonas 2011). Although the precise cause of this dysbacteriosis is not completely understood, some factors, such as high sexual activity, a new sexual partner and risky sexual behavior (Bradshaw 2005; Mirmonsef 2012; Mylonas 2011), could contribute to this condition (Mylonas 2011).
BV is found worldwide with a prevalence between 10% and 50%, and is usually higher among sex workers, the HIV‐positive population, black and Hispanic women (Kenyon 2013), and among women with a new or a high number of sexual partners (Marrazzo 2011). Having three or more male sexual partners in the past 12 months has been identified as a risk factor for BV (Marrazzo 2011). Also, having a female sexual partner has been reported to increase the risk of BV by 60% (Smart 2004). The burden of BV is related not only to the prevalence of the condition, but also to a reduction in quality of life, as well as to anxiety and self‐conscious feelings relating to the fear of exclusion due to the foul smell associated with the infection (Bilardi 2013). The bacteria associated with BV may be carried by male genitalia, but men are usually asymptomatic (Nelson 2012). The direct cost of BV care has been evaluated in pregnant women, and is particularly related to the complications of pregnancy that derive from it: in a study evaluating a population from the USA, the Netherlands and the UK it was estimated that the overall cost of BV was around one thousand million USD a year (Oleen‐Burkey 1995). BV has also been associated with a risk of acquiring a sexually transmitted infection (STI), such as pelvic inflammatory disease (Mirmonsef 2012; Taylor 2013), and infections caused by Neisseria gonorrhoeae, Chlamydiia trachomatis and HIV (Mirmonsef 2012), and with a higher risk of developing cervical cancer (Gillet 2012), and even subfertility (Taylor 2013). In addition, BV may increase the risk of adverse perinatal outcomes, such as low birth weight, preterm delivery and very low birth weight (Sangkomkamhang 2008), and may result in approximately 80,000 excess preterm births every year in the USA (Goldenberg 2005).
The Amsel criteria and Gram staining can be used to diagnose BV, and Gram staining is considered the gold standard for this purpose (Workowski 2015). The Nugent scoring system is applied to Gram stains of vaginal smears to visually estimate the numbers of lactobacilli and BV‐associated organisms; a Nugent score of zero to three is considered healthy, four to six is intermediate and a score of seven to ten implies the presence of BV (Brotman 2011). This method has a number of disadvantages: a trained professional is required for the interpretation of results and the Gram stain is unable to detect some micro‐organisms, such as Ureaplasma and Mycoplasma (Taylor 2013). When Gram staining is not possible, the Amsel criteria provide a good clinical tool for the diagnosis of BV, which requires the presence of at least three of the following four criteria (Taylor 2013).
-
Homogeneous, thin, white vaginal discharge.
-
Presence of clue cells on microscopic examination.
-
A pH greater than 4.5.
-
A positive ‘whiff test’ (a fishy odour after 10% potassium hydroxide is added).
In vitro cultures for G. vaginalis are of limited utility because although cultures in almost all women with a symptomatic infection are positive, 50% of the cultures from healthy asymptomatic women are also positive (Mylonas 2011). Finally, in some circumstances a diagnosis can be reached through combining the medical history with the clinical characterization of the discharge during a gynaecological examination (Ministerio de Salud y Protección Social 2013). This approach, the syndromic approach, is based on the assumption that genital tract infections share some common symptoms and signs thus making it possible to assign them a specific etiology without the need for a laboratory test (Ministerio de Salud y Protección Social 2013).
BV is not currently considered a STI but it is well‐recognized that both have many aspects in common (Morris 2001). Several studies have reported an association between BV and the coexistence of STIs, risky sexual behaviours, young age at first sexual intercourse, sharing sexual toys, and a new or multiple male or female partners (Chavez 2009; Fethers 2008; Fethers 2009; Marrazzo 2005; Morris 2001). Furthermore, BV is unusual in women without a history of sexual contact (Fethers 2009), and its prevalence is less frequent in women who report that they regularly use condoms or have a stable sexual partner (Chavez 2009; Fethers 2008); these findings are consistent with a strong association between BV and sexual activity (Fethers 2009).
Additionally, some studies have proposed that the bacteria associated with BV may be carried by the male genitalia (Nelson 2012), based on the microbiological isolation of the micro‐organisms associated with this infection in the flora of the penis and urethra in male partners of infected females (Mandar 2013; Nelson 2012). This is particularly notable in uncircumcized males in whom the presence of a major surface of contact could have a major role as a reservoir, and favour the occurrence of an infection after sexual intercourse (Bukusi 2011; Mehta 2012). Bacteria associated with BV have been isolated from the normal flora of the male coronal sulcus and urethra, and could be related to infection in female partners and to the recurrence of infection after treatment (seen in about 20% of individuals and defined as three or more proven episodes of BV in 12 months) (Colli 1997; Cook 1992). Another mechanism for infection could be the mechanical transfer of perineal enteric bacteria from the flora of the male genitalia through unprotected and protected intercourse (Mandar 2013).
Description of the intervention
As BV is considered to arise from an imbalance in the normal vaginal flora (Taylor 2013), treatment includes the administration of antibiotics, such as nitroimidazoles, lincosamides, macrolides (e.g. erythromycin) and, in some circumstances, penicillins (Oduyebo 2009; Workowski 2015), the objective being to eradicate the abnormal vaginal bacterial flora (Mylonas 2011). 5‐Nitroimidazole derivatives are available for oral and intravaginal administration (Workowski 2015). These medications are absorbed completely after oral intake and the volume of distribution of these agents approximates to that of total body water because they are associated with a low level of protein binding (Lamp 1999). 5‐Nitroimidazole derivatives penetrate well into body tissues and fluids, with the exception of the placenta, and are eliminated in the urine after being metabolized in the liver (Brunton 2011; Trevor 2012). The side effects of 5‐nitroimidazoles are usually mild and the most common are headache, nausea, dry mouth and a metallic taste (Brunton 2011; Trevor 2012). The regimens recommended for the treatment of BV include metronidazole 500 mg orally twice a day for seven days or metronidazole gel 0.75% one full applicator (5 g) intravaginally once a day for five days; tinidazole 2 g orally once daily for one or two days or 1 g orally once daily for five days; or secnidazole 1 g or 2 g orally in single doses (Oduyebo 2009; Workowski 2015).
Clindamycin, the most representative of the lincosamides, is almost completely absorbed following oral administration (Bouazza 2012), with a half‐life of about three hours, and is widely distributed into fluids and tissues (Bouazza 2012; Gatti 1993). More than 80% of this agent is bound to plasma proteins, primarily α1‐acid glycoprotein (Flaherty 1996); it is metabolized in the liver by cytochrome P450 3A4 and is excreted in the urine and bile (Trevor 2012; Wynalda 2003, Yasuda 2008). The most common side effects related to the administration of clindamycin include diarrhoea and, in a small number of individuals, pseudomembranous colitis (Gurwith 1977). Rash can occur in about 10% of individuals; other reactions, such as Stevens‐Johnson syndrome, the reversible elevation of transaminases, granulocytopenia, thrombocytopenia and anaphylactic reactions, are less frequent (Brunton 2011). Regimens suggested for the treatment of BV include clindamycin cream 2% one full applicator (5 mg) intravaginally at bedtime for seven days; clindamycin 300 mg orally twice daily for seven days; or clindamycin ovules 100 mg intravaginally once at bedtime for three days (Workowski 2015).
The serum half‐life of erythromycin is approximately two hours (Josefsson 1982; Zuckerman 2011). The drug is metabolized in the liver by cytochrome P450 3A4 and 2% to 5% is eliminated in an active form in the urine (Trevor 2012; Zuckerman 2011). Cholestatic hepatitis is the most notable side effect of macrolides and hepatotoxicity has also been observed (Derby 1993). Large doses have been associated with abdominal cramps, nausea, vomiting and diarrhoea (Zuckerman 2011). Among the recognized allergic reactions are fever, eosinophilia and skin eruptions, which may occur alone or in combination; all disappear shortly after therapy is suspended (Brunton 2011). Erythromycin for the treatment of BV is used at a dose of 333 mg oral three times daily for 14 days in combination with metronidazole (Brocklehurst 2013).
Some studies have used the aminopenicillin amoxicillin for the treatment of BV (Amit 2013; Brocklehurst 2013). This agent is a semi‐synthetic penicillin with a half‐life of almost 80 minutes, which binds to proteins in the plasma and is excreted renally (Brocklehurst 2013). The most important side effects associated with amoxicillin are nausea, vomiting, rash and antibiotic‐associated colitis. The use of ampicillin is now generally avoided due to the emergence of ampicillin‐resistant bacteria in individuals with BV (Amit 2013).
How the intervention might work
To date, the evidence regarding whether to treat or not the sexual partner of a woman with BV is inconclusive (Mehta 2013; Potter 1999). As frequently‐used antibiotics for treating BV are widely distributed into the fluids and tissues of the human body (Bouazza 2012; Brunton 2011; Gatti 1993; Trevor 2012), the treatment of sexual partners could eliminate the abnormal flora present in the male genital area that may promote relapse in, or reinfection of, women with BV (Bradshaw 2006).
The 5‐nitroimidazole derivatives are agents with antiprotozoal and antibacterial properties (Amit 2013). When a 5‐nitroimidazole enters the cellular environment, it is reduced by the pyruvate ferredoxin oxidoreductase system present in bacterial mitochondria, which modifies its chemical structure (Amit 2013). Pyruvate ferredoxin oxidoreductase generates adenosine triphosphate (ATP) via the oxidative decarboxylation of pyruvate; in the presence of a structurally modified 5‐nitroimidazole, the electrons that would be transferred to hydrogen ions during the generation of ATP are captured by the nitro group (Amit 2013). This disruption of ATP production promotes the formation of intermediate compounds and free radicals that are highly toxic to the bacteria (Brunton 2011). The lincosamides bind to the 50S subunit of bacterial ribosomes and consequentially suppress bacterial protein synthesis (Brunton 2011; Trevor 2012). The macrolides (e.g. erythromycin) are bacteriostatic agents that inhibit protein synthesis by binding reversibly to the 50S ribosomal subunits of sensitive micro‐organisms (Brunton 2011; Trevor 2012).
The administration of any effective and safe intervention to the sexual partner of a woman with BV could offer the advantages of decreasing the recurrence of infection, thus breaking the chain of infection and possibly decreasing the prevalence of STIs, reducing the burden associated with the condition and impacting positively on the sexual and reproductive health of the woman (Mehta 2013).
Why it is important to do this review
This systematic review is of paramount importance as some studies suggest that BV exhibits a behaviour similar to that of an STI (Potter 1999). However, there is still some uncertainty regarding whether recurrence of BV in women could be due to a failure to eradicate the causative organism(s) or a consequence of reinfection by the sexual partner (Bradshaw 2006). Currently, the treatment of sexual partners of women with BV is not recommended (Workowski 2015), but this is based on the critical appraisal of individual clinical trials (none of which provide conclusive evidence regarding the efficacy and safety of male sex partner treatment for women with BV (Mehta 2013)) rather than a synthesis of the available clinical evidence (Mehta 2012; Potter 1999). If the treatment of sexual partners were found to reduce the rate of recurrence of BV then this could reduce costs. However, it would need to be weighed against the possible risk of antibiotic resistance that could arise from the additional multiple treatments such a policy would involve. There is therefore a need for high‐quality systematic reviews to improve the clinical management of BV (Madhivanan 2013). This systematic review will facilitate the synthesis of the current evidence, and recognize its strengths and weakness, address the uncertainty of the current knowledge and make it possible to assess the effectiveness and safety of this intervention.
Objectives
To assess the effectiveness in women and the safety in men of concurrent antibiotic treatment for the sexual partners of women treated for BV.
Methods
Criteria for considering studies for this review
Types of studies
Randomized controlled clinical trials, published and unpublished, that compared the concurrent use of any antibiotic treatment (any concentration, frequency, duration and route) with placebo, no intervention or any other intervention (any concentration, frequency, duration and route) by the sexual partners of women treated for bacterial vaginosis (BV). We excluded quasi‐randomized trials because this approach produces effect estimates that indicate more extreme benefits compared with those generated by randomized controlled clinical trials (Higgins 2011). We also excluded cross‐over trials and cluster‐randomized trials because of the nature of the condition (Higgins 2011).
Types of participants
The sexual partners (either male or female) of women treated for non‐recurrent BV.
Types of interventions
Any antibiotic treatment (at any concentration, frequency, duration and route) versus one of the following.
-
Placebo.
-
No intervention.
-
Any other intervention different to antibiotic treatment (any concentration, frequency, duration and route).
Types of outcome measures
Primary outcomes
-
Recurrence of BV in women treated for BV (proportion of participants who were previously healthy following treatment for BV that developed a new episode of BV, according to Amsel's criteria or any other clinical criteria).
-
Clinical improvement (according to Amsel's criteria or any other clinical criteria) in women treated for BV.
-
Symptomatic improvement defined as the (self‐reported) improvement or disappearance of symptoms in women treated for BV.
-
Serious adverse events of the intervention (hypersensitivity, pseudomembranous colitis or Stevens‐Johnson syndrome) in sexual partners of women treated for BV.
Secondary outcomes
-
Minor adverse events of the intervention during therapy (metallic taste, nausea, vomiting, diarrhoea or headache) in sexual partners of women treated for BV.
-
Cost‐effectiveness of the intervention.
The primary outcomes (recurrence, clinical and symptomatic improvement) were assessed during the first week, between the first and fourth week and after the fourth week. We assessed adverse events of the intervention during therapy.
Search methods for identification of studies
We identified as many relevant randomized controlled trials (RCTs) of "antibiotic treatment" for the "sexual partner of the woman being treated for bacterial vaginosis" as possible, irrespective of language of publication, publication date and publication status (published, unpublished, in press or in progress). We used both the electronic searching of bibliographic databases and handsearching, as described in the Cochrane Handbook for Systematic Reviews of Interventions (Higgins 2011).
Electronic searches
We contacted the Information specialist of the Cochrane Sexually Transmitted Infections Group in order to implement a comprehensive search strategy to identify as many relevant RCTs as possible in the electronic databases. We used a combination of controlled vocabulary (MeSH, Emtree terms, Health Sciences Descriptors ‐DeCS for its acronym in Spanish‐, including exploded terms) and free‐text terms (considering spelling variants, synonyms, acronyms and truncation) for "sexual partner of the woman being treated for bacterial vaginosis" and "antibiotic treatment", with field labels, proximity operators and boolean operators. We have listed our search strategies in the 'Appendices' section (Appendix 1; Appendix 2; Appendix 3; Appendix 4; Appendix 5; Appendix 6; Appendix 7).
We searched the following electronic databases.
-
Cochrane Sexually Transmitted Infections Group Specialized Register (searched 23 July 2016).
-
Cochrane Central Register of Controlled Trials (CENTRAL), Ovid platform (searched from Cochrane Library Issue 1, 1991 to 23 July 2016).
-
MEDLINE, Ovid platform (searched from 1946 to 23 July 2016).
-
MEDLINE In‐Process & Other Non‐Indexed Citations, Ovid platform (searched from 1966 to 23 July 2016).
-
MEDLINE Daily Update, Ovid platform (searched from 1966 to 23 July 2016).
-
Embase (searched from 1974 to 23 July 2016).
-
LILACS (Latin American and Caribbean Health Sciences Literature, IAHx interface; searched from 1982 to 23 July 2016).
For MEDLINE, we used the Cochrane highly sensitive search strategy for identifying RCTs: sensitivity and precision maximizing version (2008 revision), Ovid format (Higgins 2011). We combined the LILACS search strategy with the RCT filter of the IAHx interface.
Searching other resources
We searched the following resources for additional trials.
-
Trial registers:
-
World Health Organization (WHO) International Clinical Trials Registry Platform (ICTRP) portal (apps.who.int/trialsearch/): searched 23 Jul 2016;
-
ClinicalTrials.gov (clinicaltrials.gov/): searched 23 July 2016.
-
-
Web of Science™: searched from 2001 to 23 July 2016.
We contacted the trial authors of all RCTs we identified by other methods and handsearched the conference proceeding abstracts of the following events.
-
International Society for Sexually Transmitted Diseases Research (ISSTDR) (www.isstdr.org/) scientific meetings: 2007, 2009 and 2011.
-
British Association for Sexual Health and HIV (BASHH) (www.bashh.org/) scientific meetings: 2004, 2006, 2007 and 2009.
-
The International Congress on Infectious Diseases (ICID) (www.isid.org/): 2010 and 2012.
-
International Union against Sexually Transmitted Infections (IUSTI) (www.iusti.org/) conferences and meetings: 2011 and 2012.
-
International Society for Infectious Diseases (ISID) (www.isid.org/): 2011.
-
International Meeting on Emerging Diseases and Surveillance (IMED) (www.isid.org/): 2007, 2009 and 2011.
-
Interscience Conference on Antimicrobial Agents and Chemotherapy (ICAAC) (www.icaac.org/): 2011 and 2012.
-
International Federation of Gynecology and Obstetrics (FIGO) (www.figo.org/) World Congress: 2012.
We also handsearched previous systematic reviews and other relevant publications on the same topic and the reference lists of all RCTs identified by other methods.
Data collection and analysis
Selection of studies
Three review authors (JA‐G, DAV‐C and EMS‐B) independently assessed the titles and abstracts of the records we retrieved from the search strategy for inclusion. Three review authors independently performed the final selection of trials for inclusion and we resolved any disagreements through discussion. We listed all excluded studies and the reasons for exclusion in a "Characteristics of excluded studies" table and we constructed a PRISMA diagram to illustrated the study selection process (Figure 1).

Study flow diagram.
Data extraction and management
We designed a data extraction form, which we pilot tested with one of the included studies. Three review authors (CFG‐A, DAV‐C and EMS‐B) independently extracted the data from the included studies using the finalized data extraction form. We resolved any disagreements regarding the extracted data through discussion until we reached a consensus.
We extracted data on the following items.
-
Location of the trial and setting.
-
Trial design.
-
Power calculation performed.
-
Inclusion and exclusion criteria.
-
Baseline information of the participants in order to have comparable intervention groups at entry (age, marital status, contraceptive habits, sexual intercourse during treatment, history of sexually transmitted infections (STIs), sexual behavioral history).
-
Total number of intervention groups.
-
Types of interventions: antibiotic type (any concentration, frequency, duration and route).
-
Types of comparison: placebo, no intervention or any other intervention (any concentration, frequency, duration and route).
-
Number of participants enrolled, randomized and excluded after randomization and analysed.
-
Number of participants lost to follow‐up in the groups.
-
Outcomes stated in the methods versus outcomes reported in the results.
-
How the trial authors defined the secondary outcomes.
-
Differences between groups for outcome assessment.
-
Time of follow‐up in participants for specific outcomes.
-
How the trial authors validated adverse event reports.
-
Funding sources reported.
-
Ethical issues: use of signed informed consent and ethics approval.
For eligible studies, two review authors (CFG‐A and MYM‐V) entered the data into Review Manager (RevMan) (RevMan 2014), and checked them for accuracy. When information regarding any of the above was unclear, we contacted authors of the original reports to ask for further details. For a single RCT report, we extracted data directly into a data collection form; in cases of multiple reports, we extracted data from each report separately and then combined information across data collection forms.
Assessment of risk of bias in included studies
Two review authors (CFG‐A and JA‐G) independently assessed the risk of bias for each included study using the criteria outlined in the Cochrane Handbook for Systematic Reviews of Interventions (Higgins 2011). We resolved any disagreement by consensus or we consulted a third review author (MYM‐V). The review authors that assessed the risk of bias in the included studies were theme and methodology experts. In order to collect missing information, we planned to contact the study investigators using open‐ended questions.
1. Random sequence generation (checking for possible selection bias)
We described, for each included study, the method used to generate the allocation sequence in sufficient detail to allow an assessment of whether it should produce comparable groups. We assessed the method as follows.
-
Low risk of bias (any truly random process, e.g. random number table; computer random number generator).
-
High risk of bias (any non‐random process, e.g. odd or even date of birth; hospital or clinic record number).
-
Unclear risk of bias.
2. Allocation concealment (checking for possible selection bias)
For each included study we reported the method used to conceal allocation to interventions prior to assignment and we assessed whether intervention allocation could have been foreseen in advance of, or during, recruitment or changed after assignment. We assessed the methods as follows.
-
Low risk of bias (e.g. telephone or central randomization; consecutively numbered sealed opaque envelopes).
-
High risk of bias (open random allocation; unsealed or non opaque envelopes, alternation; date of birth).
-
Unclear risk of bias.
3a. Blinding of participants and personnel (checking for possible performance bias)
We described, for each included study, the methods used, if any, to blind study participants and personnel from the knowledge of which intervention a participant received. We considered that studies were at low risk of bias if they were blinded, or if we judged that the lack of blinding would have been unlikely to affect results. We assessed blinding separately for different outcomes or classes of outcomes. We assessed the methods as follows.
-
Low, high or unclear risk of bias for participants.
-
Low, high or unclear risk of bias for personnel.
3b. Blinding of outcome assessment (checking for possible detection bias)
We described the methods used, if any, to blind outcome assessors from the knowledge of which intervention a participant received for each included study. We assessed blinding separately for different outcomes or classes of outcomes. We also assessed methods used to blind outcome assessment as at either low, high or unclear risk of bias.
4. Incomplete outcome data (checking for possible attrition bias due to the amount, nature and handling of incomplete outcome data)
We described, for each included study, and for each outcome or class of outcomes, the completeness of the data including attrition and exclusions from the analysis. We stated whether the trial authors reported attrition and exclusions and the number of participants included in the analysis at each stage (compared with the total number of randomized participants), reasons for attrition or exclusion where reported, and whether missing data were balanced across groups or were related to outcomes. Where an included study reported sufficient information, we re‐included missing data in the analyses we undertook. We assessed methods as follows.
-
Low risk of bias (e.g. no missing outcome data; missing outcome data balanced across groups).
-
High risk of bias (e.g. numbers or reasons for missing data imbalance across groups; ‘as treated’ analysis done with substantial departure of intervention received from that assigned at randomization).
-
Unclear risk of bias.
We used a cut‐off point of 20% to determine whether a study was at low or high risk of bias according to the level of missing data.
5. Selective reporting (checking for reporting bias)
For each included study, we described how we investigated the possibility of selective outcome reporting bias and what we found. We assessed the methods as follows.
-
Low risk of bias (where it was clear that the study authors reported all of the study's prespecified outcomes and all expected outcomes of interest).
-
High risk of bias (where the study authors did not report all of the study’s prespecified outcomes; the study authors did not prespecify one or more reported primary outcomes; the study authors incompletely reported the outcomes of interest and so we could not used them; the study failed to include the results of a key outcome that we would expected them to have reported).
-
Unclear risk of bias.
6. Other bias (checking for bias due to problems not covered by (1) to (5) above)
We described, for each included study, any important concerns we had about other possible sources of bias. We assessed whether each included study was free of other problems that could put it at risk of bias. We assessed methods as follows.
-
Low risk of other bias.
-
High risk of other bias.
-
Unclear risk of other bias.
Overall risk of bias
We made explicit judgments about whether studies were at high risk of bias, according to the criteria given in the Cochrane Handbook for Systematic Reviews of Interventions (Higgins 2011). With reference to (1) to (6) above, we assessed the likely magnitude and direction of the bias and whether we considered it was likely to impact on the findings. We explored the impact of the level of bias by undertaking sensitivity analyses (see the 'Sensitivity analysis' section).
Measures of treatment effect
Dichotomous data
For dichotomous data, we reported the results as risk ratios (RRs) with 95% confidence intervals (CIs). The RR is used as a relative effect measure, which works well with a low or high rate of events, and is easy to interpret and use in clinical practice.
Continuous data
For continuous data, we used the mean difference if outcomes were measured in the same way between trials. We used the standardized mean difference to combine trials that measured the same outcome but used different methods.
Unit of analysis issues
The units of analysis were individuals instead of couples. We assessed the effect of the intervention independently in the partner and the woman that constitute the couple. The sexual partner of the woman was randomized to the intervention or comparison group, but all the women included in the study received treatment for BV.
Where we identified a clinical trial that randomized participants to several intervention groups, we determined which intervention groups were relevant. To avoid confusion for the reader, we included all the intervention groups of the study in the 'Characteristics of included studies' table (in the notes cell), and provided a detailed description only of the intervention groups that were relevant to this review, and we only used these groups in our analyses. Finally, in order to overcome a unit‐of‐analysis error for a study that could contribute multiple correlated comparisons, we combined all relevant experimental intervention groups of the studies into a single group and also combined all relevant control intervention groups into a single control group, in order to create a single pairwise comparison (Higgins 2011).
Dealing with missing data
We identified the levels of attrition in the included trials and we performed analyses for all outcomes, as far as possible, on an intention‐to‐treat basis, i.e. we attempted to include all participants randomized to each group in the analyses, and we analysed all participants in the group to which they were allocated, regardless of whether or not they received the allocated intervention. The denominator for each outcome in each trial was the number randomized minus any participants whose outcomes were known to be missing. We explored the impact of including trials with high levels of missing data in the overall assessment of treatment effects by using sensitivity analysis (see the 'Sensitivity analysis' section).
Assessment of heterogeneity
We assessed statistical heterogeneity in each meta‐analysis using the Tau², I² statistic and Chi² test values (Higgins 2011). We regarded heterogeneity as substantial if the I² statistic value was greater than 40% and if either the Tau² value was greater than zero or there was a low P value (less than 0.10) in the Chi² test for heterogeneity.
Assessment of reporting biases
We planned to explored publication bias through assessment of funnel plot asymmetry and formal tests. For continuous outcomes, we planned to use the test proposed by Egger 1997, and for dichotomous outcomes we planned to use the test proposed by Harbord 2006. However, we included fewer than 10 trials in the meta‐analysis so we did not perform these analyses.
Data synthesis
We performed statistical analyses using RevMan (RevMan 2014). We used a fixed‐effect model to combine data when it was reasonable to assume that studies estimated the same underlying treatment effect i.e. where trials examined the same intervention, and we judged the trials’ populations and methods to be sufficiently similar. We used a random‐effects model if there were clinical heterogeneity sufficient to expect that the underlying treatment effects differed between trials or, if we detected substantial statistical heterogeneity, to produce an overall summary if an average treatment effect across trials was considered clinically meaningful. We treated the random‐effects summary as the average range of possible treatment effects and we discussed the clinical implications of treatment effects differing between trials. If the average treatment effect was not clinically meaningful, we did not combine trials.
'Summary of findings’ table
We used the GRADE approach in order to produce a 'Summary of findings' table for the outcomes recurrence after treatment, clinical and symptomatic improvement and minor or serious adverse events (Higgins 2011). We downgraded the quality of evidence depending on the presence of the following factors.
-
Study limitations.
-
Inconsistency of results.
-
Indirectness of evidence.
-
Imprecision.
-
Publication bias.
Subgroup analysis and investigation of heterogeneity
We planned explore the following potential sources of heterogeneity using subgroup analyses.
-
Comparison of different antibiotic types (5‐nitroimidazole, lincosamides or any other antibiotic type).
-
Comparison of different durations of antibiotic therapy (single versus multiple doses).
-
Comparison of women with monogamous relationships and women with multiple sexual partners.
We restricted subgroup analyses to the primary outcomes:
-
Recurrence after treatment into the women.
-
Clinical improvement.
-
Symptomatic improvement.
Given that the safety and effectiveness of health interventions can differ within and between populations, we proposed a subgroup analysis according to low‐ versus high‐income countries. For fixed‐effect inverse variance meta‐analyses we assessed differences between subgroups by interaction tests. For fixed‐effect meta‐analyses using methods other than inverse variance, we assessed differences between subgroups by inspection of the CIs of the subgroups: non‐overlapping CIs indicate a statistically significant difference in treatment effect between the subgroups.
Sensitivity analysis
We performed sensitivity analyses based on aspects of the review that may have affected the results; for example, the impact of including trials at high or unclear risk of bias for incomplete outcome data domain. We also carried out a sensitivity analysis to explore the inclusion of the effects of fixed‐effect or random‐effects analysis for outcomes with statistical heterogeneity.
Results
Description of studies
Results of the search
We searched the available literature up to 23 July 2016 and retrieved a total of 110 references, of which we screened 80 after we removed duplicates. Of these, we initially screened the full‐text articles of 20 references. Seven published trials met our inclusion criteria (Colli 1997; Heikkinen 1989; Mengel 1989; Moi 1989; Swedberg 1985; Vejtorp 1988; Vutyavanich 1993). We excluded 12 studies (see the 'Characteristics of excluded studies' table) and one trial is currently recruiting participants (see the 'Characteristics of ongoing studies' table). We have presented a PRISMA diagram in Figure 1 to illustrate the study selection process.
Included studies
The seven included trials had a total of 1026 participants and sample sizes ranged from 82 to 250 participants. These trials were from Denmark (Vejtorp 1988), Finland (Heikkinen 1989), Italy (Colli 1997), Thailand (Vutyavanich 1993), the USA (Mengel 1989; Swedberg 1985), and one trial involved the participation of institutions located in four Nordic countries namely Denmark, Finland, Norway and Sweden (Moi 1989). Three trials were multicentric (Colli 1997; Mengel 1989; Moi 1989), only one trial implemented a valid method for sample size calculation (Colli 1997), and all trials included outpatients and were published in English.
Population
The included studies recruited sexually‐active non‐pregnant women between 17 and 56 years of age, either single or married, with symptomatic BV. Four studies only included women who were involved into a monogamous heterosexual relationship (Colli 1997; Mengel 1989; Moi 1989; Vutyavanich 1993), and there was no information about this for the remaining trials (Heikkinen 1989; Swedberg 1985; Vejtorp 1988). All included trials used the Amsel's criteria to diagnose the presence of the condition and required the discovery of at least three of these four criteria, in the absence of clinical evidence of mucopurulent
cervicitis, trichomoniasis, genital herpes, papilloma virus or candidiasis. The included studies excluded participants with a recent history of systemic or topical
antibiotic treatment for other condition different to bacterial vaginosis (BV).
There were no restrictions regarding the concurrent use of contraceptive methods during the treatment period, except for Colli 1997, which excluded barrier method users. Four studies specified the contraceptive method at entry (Heikkinen 1989; Moi 1989; Vejtorp 1988; Vutyavanich 1993), and the most frequently used was the birth control pill, followed by intrauterine device, tubal resection and the condom. Two trials allowed sexual activity during the study (Moi 1989; Vutyavanich 1993), while Colli 1997 invited the participants to abstain. The remaining included trials did not mentioned whether sexual intercourse allowed or advised against. Finally, most women were treated with 5‐nitroimidazoles, namely the most commonly prescribed metronidazole (Mengel 1989; Moi 1989; Swedberg 1985; Vejtorp 1988), followed by tinidazole (Heikkinen 1989; Vutyavanich 1993). One study used clindamycin cream at bed time (Colli 1997).
Interventions
All included trials used the oral route to provide the sexual partner's treatment. The most frequently reported intervention was the use of 5‐nitroimidazoles in six studies (Heikkinen 1989; Mengel 1989; Moi 1989; Swedberg 1985; Vejtorp 1988; Vutyavanich 1993). Four of these trials used metronidazole as treatment (Mengel 1989; Moi 1989; Swedberg 1985; Vejtorp 1988), while two trials used tinidazole (Heikkinen 1989; Vutyavanich 1993). Only one study used a lincosamide for treatment (Colli 1997).
The schemes used for metronidazole included 2 g as a single dose (Mengel 1989; Swedberg 1985), 2 g on day one and day three (Moi 1989; Vejtorp 1988), and 500 mg twice daily for seven days (Swedberg 1985). The included studies that used tinidazole gave a 2 g single dose (Vutyavanich 1993), or 1 g for four days (Heikkinen 1989). One study provided clindamycin 150 mg four times daily for seven consecutive days (Colli 1997). None of the included trials assessed the effectiveness of other antibiotic treatments occasionally prescribed in clinical practice, such as aminopenicillins and macrolides.
Comparisons
Five trials used placebo (Colli 1997; Mengel 1989; Moi 1989; Vejtorp 1988; Vutyavanich 1993). Two trials compared the effectiveness of concurrent antibiotic treatment for the sexual partners with no intervention (Heikkinen 1989; Swedberg 1985).
Outcomes
None of the primary or secondary outcomes were reported by the totality of the retrieved clinical trials and there were some differences in reporting and definition of the outcomes between trials. Four included studies reported recurrence (Colli 1997; Heikkinen 1989; Moi 1989; Vejtorp 1988), and their presence was established based on the application of Amsel criteria on healthy participants following treatment for BV, with the exception of Moi 1989, which also required the reappearance of symptoms. Only one study assessed this outcome between the first and fourth week (Moi 1989), and the other three studies assessed for this outcome posterior to the fourth week.
Seven studies reported clinical improvement after treatment (Colli 1997; Heikkinen 1989; Mengel 1989; Moi 1989; Swedberg 1985; Vejtorp 1988; Vutyavanich 1993), and used the definition of the absence of Amsel's criteria through physical exam plus wet mount. Four trials assessed clinical improvement at the first week (Colli 1997; Moi 1989; Vejtorp 1988; Vutyavanich 1993), five trials assessed this outcome between the first and fourth week (Colli 1997; Heikkinen 1989; Moi 1989; Swedberg 1985; Vutyavanich 1993), and four trials assessed it after the fourth week (Colli 1997; Mengel 1989; Moi 1989; Vejtorp 1988). On the other hand, four studies monitored symptomatic improvement (Heikkinen 1989; Moi 1989; Vejtorp 1988; Vutyavanich 1993). Three trials evaluated symptomatic improvement at the first week (Moi 1989; Vejtorp 1988; Vutyavanich 1993), two trials assessed it between the first and fourth week (Moi 1989; Vutyavanich 1993), and three trials reported it after the fourth week (Heikkinen 1989; Moi 1989; Vejtorp 1988).
Finally, three trials reported the frequency of minor adverse events during treatment. Two of them captured the information through symptoms reported by participants (Colli 1997; Vutyavanich 1993), and the other trial used a questionnaire (Mengel 1989). The minor side effects reported in sexual partners of women treated for BV were the presence of nausea, stomachache, metallic taste and dizziness. We did not obtain any data on the secondary outcomes serious adverse events and cost‐effectiveness of the intervention.
Length of follow‐up
There were some differences in length of follow‐up between the included studies, which followed participants for either three (Swedberg 1985), four (Vutyavanich 1993), five (Vejtorp 1988), eight (Mengel 1989) or 12 weeks (Moi 1989; Colli 1997; Heikkinen 1989).
Excluded studies
We excluded 13 studies for the following reasons: 10 studies were not RCTs or did not provide a comparison group (all sexual partners were treated) and two studies did not provide a valid intervention (the sexual partners did not received antibiotic treatment or not all women were treated) (see the 'Characteristics of excluded studies' table). One trial is currently recruiting participants (see the 'Characteristics of ongoing studies' table).
Risk of bias in included studies
We have summarized the 'Risk of bias' assessment in Figure 2 and Figure 3. Also, we provided additional details of the included trials in the 'Characteristics of included studies' tables.

'Risk of bias' graph: review authors' judgements about each 'Risk of bias' item presented as percentages across all included studies.

'Risk of bias' summary: review authors' judgements about each 'Risk of bias' item for each included study.
Allocation
Random sequence generation (checking for possible selection bias)
Four trials adequately reported the random sequence generation method by using a computer‐generated randomisation list, so that selection bias at entry was low (Mengel 1989; Swedberg 1985; Vejtorp 1988; Vutyavanich 1993). The remaining included trials did not report the random sequence generation methods, and the risk of selection bias at entry was unclear (Colli 1997; Heikkinen 1989; Moi 1989).
Allocation concealment (checking for possible selection bias)
Two trials adequately implemented a valid allocation concealment method using sequentially numbered drugs containers (Mengel 1989), or by pharmacy‐controlled allocation (Swedberg 1985); thus the risk of selection bias at entry in these trials was low. The five remaining included trials did not report the method used to conceal allocation to interventions prior to assignment, and the risk of selection bias at entry was unclear (Colli 1997; Heikkinen 1989; Moi 1989; Vejtorp 1988; Vutyavanich 1993).
Blinding
Five trials used placebo for the control group to blind trial participants and personnel, and we judged the risk of performance bias as low (Colli 1997; Mengel 1989; Moi 1989; Vejtorp 1988; Vutyavanich 1993). The trial authors assessed two outcomes, recurrence and clinical improvement objectively, in contrast with other outcomes, such as symptomatic improvement and side effects pain, which were subjectively evaluated. However, we judged that the blinding of the outcome assessors from knowledge of which intervention each participant received prevented the risk of detection bias.
The remaining two trials compared the concurrent use of antibiotic treatment with no intervention (Heikkinen 1989; Swedberg 1985). Swedberg 1985 was unblinded to personnel and trial participants and was at high risk of performance bias. However, we appraised the outcome clinical improvement as at low risk of detection bias. This is because it was objectively assessed with Amsel's criteria, and lack of blinding of the outcome assessor was unlikely to affect the results. We considered Heikkinen 1989 as at high risk of performance and detection bias because was unblinded to personnel and trial participants. Also, the outcomes recurrence and symptomatic improvement were subjectively assessed and lack of blinding of the outcome assessor was likely to affect the results. The trial authors objectively assessed the outcome of clinical cure through Amsel's criteria, which made detection bias unlikely for this outcome.
Incomplete outcome data
Three trials appropriately stated the attrition and exclusions at each stage and the reasons were balanced across groups (Mengel 1989; Vejtorp 1988; Vutyavanich 1993). In addition, the level of missing data was not over 20% and the attrition or exclusion probably was unrelated to the outcomes, which made attrition bias unlikely.
We assessed two trials as at unclear risk of bias (Colli 1997; Moi 1989). In Colli 1997, we judged the outcomes of clinical cure at 1, 4 and 12 weeks and gastrointestinal symptoms as at low risk of bias (e.g. no missing outcome data; missing outcome data balanced across groups). However, we assessed the outcome of recurrence as at high risk of bias because the level of missing data was over 20%. Something similar occurred with Moi 1989, where we judged the outcomes of symptomatic improvement and clinical cure at the first and fourth week as at low risk of bias (e.g. no missing outcome data; missing outcome data balanced across groups). However, for the same outcomes at 12 weeks, the risk of bias was high according to the level of missing data (greater than 20%).
Two trials had missing data greater that 20% and did not state the reasons why (Heikkinen 1989; Swedberg 1985); the trial authors conducted the analyses only for those participants who were completely treated (per protocol analysis). We assessed these trials as at high risk of bias.
Selective reporting
The trial protocol was unavailable for each of the included trials (Colli 1997; Heikkinen 1989; Mengel 1989; Moi 1989; Swedberg 1985; Vejtorp 1988; Vutyavanich 1993). It is unclear whether or not the published reports included all the expected outcomes, including those that were prespecified. The report had insufficient information to permit judgment of “yes” or “no”, and we rated this factor as at unclear risk of bias in each of the included trials.
Other potential sources of bias
Pharmaceutical companies funded four trials (Heikkinen 1989; Moi 1989; Swedberg 1985; Vejtorp 1988), and academic institutions sponsored two trials (Mengel 1989; Vutyavanich 1993). One trial did not mention the funding sources (Colli 1997). We judged one trial, Mengel 1989, as at high risk of bias because of the nature and direction of their results. The remaining studies appeared to be free from other sources of bias.
Effects of interventions
See: Summary of findings for the main comparison Any antibiotic treatment versus placebo; Summary of findings 2 Any antibiotic treatment versus no intervention; Summary of findings 3 Any antibiotic treatment versus placebo
1. Any antibiotic treatment versus placebo
Five trials ( Colli 1997; Mengel 1989; Moi 1989; Vejtorp 1988; Vutyavanich 1993) including 854 participants compared any antibiotic treatment versus placebo. They did not all contribute data to each outcome.
1.1.Recurrence of BV between the first and fourth week
Only one trial reported on this outcome (Moi 1989). There was no evidence of significant difference between antibiotic treatment and placebo in the recurrence between first and fourth week of treatment (RR 1.28, 95% CI 0.68 to 2.43; 218 participants, one study; Analysis 1.1). The quality of evidence was low due to the limitations of imprecision.
1.2. Recurrence of BV after the fourth week
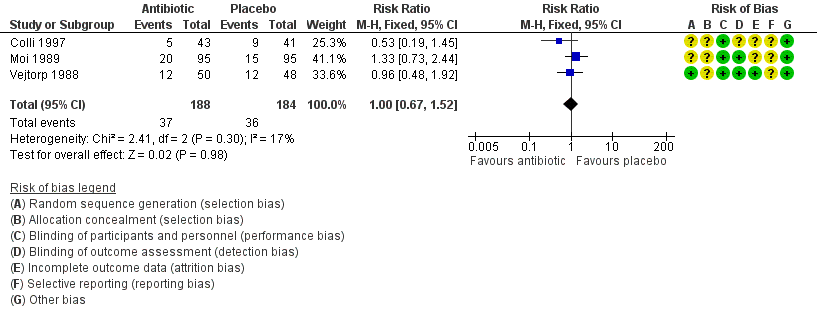
The results correspond to the meta‐analysis of three trials (Colli 1997; Moi 1989; Vejtorp 1988). There was no evidence of significant difference between antibiotic treatment and placebo in recurrence of BV after the fourth week of treatment (RR 1.00, 95% CI 0.67 to 1.52; 372 participants, three studies; I² statistic = 17%; Analysis 1.2; Figure 4). The quality of the evidence was very low due to the limitations of imprecision.

Forest plot of comparison: 1 Any antibiotic treatment versus placebo, outcome: 1.2 Recurrence of BV after the fourth week.
1.3. Clinical improvement during the first week
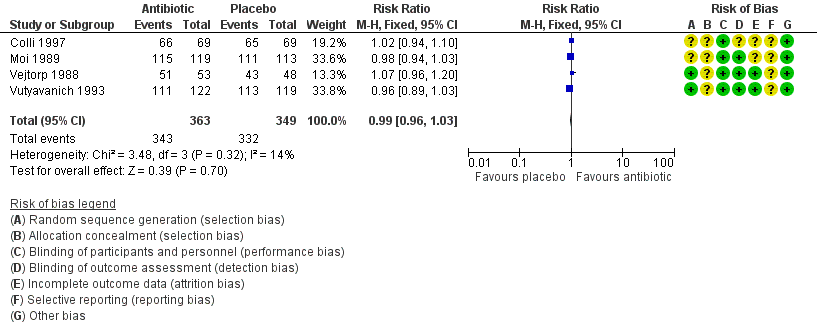
The results correspond to the meta‐analysis of four trials (Colli 1997; Moi 1989; Vejtorp 1988; Vutyavanich 1993). There was no evidence of significant difference in clinical improvement during the first week (RR 0.99, 95% CI 0.96 to 1.03; 712 participants, four studies; I² statistic = 14%; Analysis 1.3; Figure 5). The quality of the evidence was high.

Forest plot of comparison: 1 Any antibiotic treatment versus placebo, outcome: 1.3 Clinical improvement during the first week.
1.4. Clinical improvement between the first and fourth week
The results correspond to the meta‐analysis of three trials (Colli 1997; Moi 1989; Vutyavanich 1993). There was no evidence of significant difference in clinical improvement between the first and fourth week (RR 1.02, 95% CI 0.94 to 1.11; 590 participants, three studies; I² statistic = 31%; Analysis 1.4; Figure 6). The quality of the evidence was high.
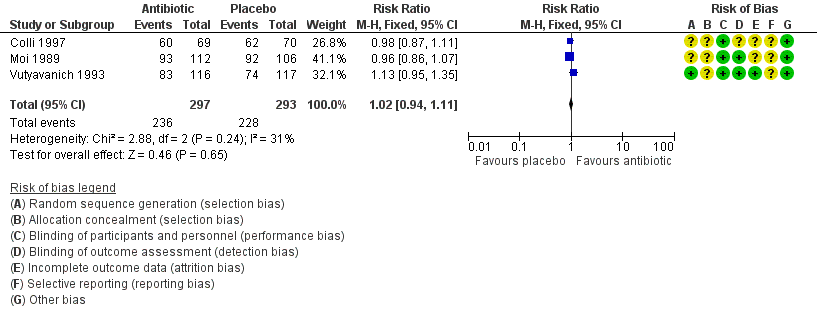
Forest plot of comparison: 1 Any antibiotic treatment versus placebo, outcome: 1.4 Clinical improvement between the first and fourth week.
1.5. Clinical improvement after the fourth week
The results correspond to the meta‐analysis of four trials (Colli 1997; Moi 1989; Vejtorp 1988; Mengel 1989). There was no evidence of significant difference in clinical improvement after the fourth week (RR 0.98, 95% CI 0.90 to 1.07; 572 participants, four studies; I² statistic = 0%; Analysis 1.5; Figure 7). The quality of the evidence was high.
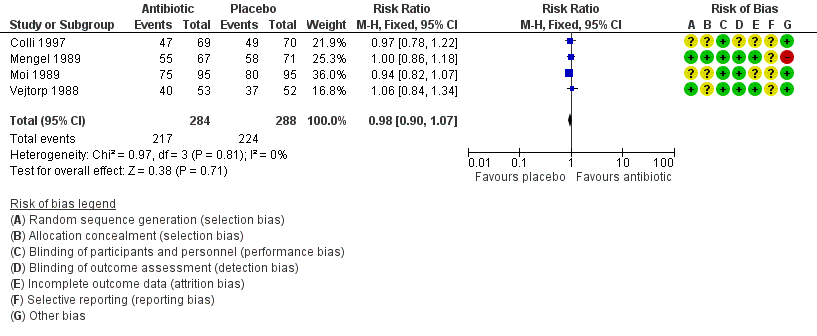
Forest plot of comparison: 1 Any antibiotic treatment versus placebo, outcome: 1.5 Clinical improvement after the fourth week.
1.6. Symptomatic improvement during the first week
The results correspond to the meta‐analysis of three trials (Moi 1989; Vejtorp 1988; Vutyavanich 1993). Antibiotic treatment was not associated with a significant symptomatic improvement during the first week (RR 1.06, 95% CI 1.00 to 1.12; 577 participants, three studies; I² statistic = 0%; Analysis 1.6; Figure 8). The quality of the evidence was high.

Forest plot of comparison: 1 Any antibiotic treatment versus placebo, outcome: 1.6 Symptomatic improvement during the first week.
1.7. Symptomatic improvement between the first and fourth week
Two trials informed this outcome (Moi 1989; Vutyavanich 1993). There was no evidence of significant difference in this outcome (RR 0.93, 95% CI 0.84 to 1.03; 444 participants, two studies; I² statistic = 0%; Analysis 1.7). The quality of the evidence was high.
1.8. Symptomatic improvement after the fourth week
Two trials informed this outcome (Moi 1989; Vejtorp 1988). There was no evidence of significant difference in this outcome (RR 1.03, 95% CI 0.90 to 1.17; 296 participants, two studies; I² statistic = 0%; Analysis 1.8). The quality of the evidence was high.
1.9. Minor adverse events during therapy in the sexual partner
The results correspond to the meta‐analysis of three trials (Colli 1997; Mengel 1989; Vutyavanich 1993). Antibiotic treatment was associated with a significant minor adverse events report during therapy in sexual partner (RR 2.55, 95% CI 1.55 to 4.18; 477 participants, three studies; I² statistic = 0%; Analysis 1.9; Figure 9). The quality of the evidence was low due to the limitations of imprecision.

Forest plot of comparison: 1 Any antibiotic treatment versus placebo, outcome: 1.9 Minor adverse events during therapy in sexual partner.
2. Any antibiotic treatment versus no intervention
Two trials including 172 participants compared the effectiveness of concurrent antibiotic treatment for the sexual partners with no intervention.
2.1. Recurrence of BV after the fourth week
One trial informed this outcome (Heikkinen 1989). There was no evidence of statistically significance difference in recurrence of BV after the fourth week (RR 1.71, 95% CI 0.65 to 4.55; 51 participants, one study; Analysis 2.1). The quality of the evidence was very low due to the limitations of imprecision, blinding and incomplete outcome data domains.
2.2. Clinical improvement between the first and fourth week
Two trials informed this outcome (Heikkinen 1989; Swedberg 1985) There was no evidence of statistically significance difference in this outcome (RR 0.93, 95% CI 0.70 to 1.25; 152 participants, two studies; I² statistic = 62%; Analysis 2.2). The quality of the evidence was very low due to the limitations of imprecision, substantial heterogeneity, blinding and incomplete outcome data domains.
2.3.Symptomatic improvement after the fourth week
One trial informed this outcome (Heikkinen 1989). There was no evidence of statistically significance difference in symptomatic improvement after the fourth week (RR 0.66, 95% CI 0.39 to 1.11; 70 participants, one study; Analysis 2.3). The quality of the evidence was very low due to the limitations of imprecision, blinding and incomplete outcome data domains.
Subgroup analysis and investigation of heterogeneity
We performed subgroup analyses to explore the heterogeneity sources that we found in the analyses of "recurrence" for the comparison antibiotic versus placebo. For this analysis we explored whether differences by antibiotic type (5‐Nitroimidazoles versus Lincosamides) reduced the heterogeneity in the overall effect size. The tests for subgroup effect were not significantly different when we explored heterogeneity source by antibiotic type (assessed after the fourth week, P = 0.16, Analysis 3.1). We did not perform subgroup analysis by antibiotic doses (single versus multiple), because the included trials did not provide enough information for this outcome.
In the analyses of “clinical improvement” for the comparison antibiotic versus placebo, neither of the tests for subgroup effect showed evidence of statistically significant differences, analysing by antibiotic type (assessed during first week, P = 0.53, Analysis 3.2; between the first and fourth week, P = 0.53, Analysis 3.3; and after the fourth week, P = 0.92, Analysis 3.4) or by antibiotic doses (assessed during first week, P = 0.18, Analysis 4.1; between the first and fourth week, P = 0.12, Analysis 4.2; and after the fourth week, P = 0.76, Analysis 4.3). The effects of the intervention for these outcomes did not change according to the intervention characteristics.
In the analyses of “symptomatic improvement” for the comparison antibiotic versus placebo, neither of the tests for subgroup effect showed evidence of statistically significant differences, analysing by antibiotic doses (assessed during first week, P = 0.29, Analysis 4.4; and between the first and fourth week, P = 0.71, Analysis 4.5). We did not perform subgroup analysis by antibiotic type because the included trials did not provide the required information for these analyses. However, for the analyses "minor adverse events during therapy" for the same comparison, neither of the tests for subgroup effect showed evidence of statistically significant differences, analysing by antibiotic type (P = 0.49, Analysis 3.5) or by dose (P = 0.49, Analysis 4.6).
We did not perform the subgroup analysis according to kind of relationship, because not all of the included trials, provided enough information on these basal conditions. Finally we neither analysed by income classifications (low‐ versus high‐income) because all retrieved studies were performed in a high‐income country.
Sensitivity analysis
We explored the impact of including trials at high or unclear risk of bias for incomplete outcome data domain in the overall assessment of treatment effects. For the comparison antibiotic treatment versus placebo, neither of the test effects showed evidence of statistically significant differences regardless of the outcome assessed (recurrence, clinical or symptomatic improvement and minor adverse events) or the period of time during which it was measured (during the first, between the first and fourth or after the fourth week).
In this sense, we observed the following results for low risk studies.
-
Recurrence after the fourth week (RR 0.96, 95% CI 0.48 to 1.92; 98 participants, one study; Vejtorp 1988)
-
Clinical improvement during first week (RR 0.99, 95% CI 0.93 to 1.05; 242 participants, two studies; I² statistic = 66%; Vejtorp 1988; Vutyavanich 1993); between the first and fourth week (RR 1.13, 95% CI 0.95 to 1.35; 233 participants, one study; Vutyavanich 1993); and after the fourth week (RR 1.03, 95% CI 0.90 to 1.17; 243 participants, two studies; I² statistic = 0%; Mengel 1989; Vejtorp 1988)
-
Symptomatic improvement during first week (RR 1.06, 95% CI 0.98 to 1.14; 348 participants, two studies; I² statistic = 40%; Vejtorp 1988; Vutyavanich 1993); between the first and fourth week (RR 0.95, 95% CI 0.83 to 1.08; 232 participants, one study; Vutyavanich 1993); and after the fourth week (RR 1.03, 95% CI 0.83 to 1.29; 107 participants, one study; Vejtorp 1988 ).
-
Minor adverse events of the intervention during therapy (RR 2.76, 95% CI 1.60 to 4.77; 339 participants, two studies; I² statistic = 0%, Mengel 1989; Vutyavanich 1993).
We did not perform a sensitivity analysis for the comparison of antibiotic versus no intervention, because we assessed all of the included trials as at high risk of bias for incomplete outcome data domain.
Discussion
Summary of main results
Seven RCTs (1026 participants) met our inclusion criteria of this review, and industry funded four of these trials. Five trials (854 patients) compared any antibiotic treatment for the treatment of sexual partners with placebo. Based on high quality evidence antibiotic treatment does not increase the rate of clinical or symptomatic improvement in women during the first week (risk ratio (RR) 0.99, 95% confidence interval (CI) 0.96 to 1.03; 712 participants, four studies; RR 1.06, 95% CI 1.00 to 1.12; 577 patients, three studies, respectively), between the first and fourth week (RR 1.02, 95% CI 0.94 to 1.11; 590 participants, three studies; RR 0.93, 95% CI 0.84 to 1.03; 444 participants, two studies; respectively) or after the fourth week (RR 0.98, 95% CI 0.90 to 1.07; 572 participants, four studies; RR 1.03, 95% CI 0.90 to 1.17; 296 participants, two studies; respectively). Antibiotic treatment does not led to a lower recurrence rate during the first and fourth week (RR 1.28, 95% CI 0.68 to 2.43; 218 participants, one study; low quality evidence) or after the fourth week of treatment (RR 1.00, 95% CI 0.67 to 1.52; 372 participants, three studies; low quality evidence) in women, but increases the frequency of adverse events (most frequently gastrointestinal symptoms) reported by sexual partners (RR 2.55, 95% CI 1.55 to 4.18; 477 participants, three studies; low‐certainty evidence) see the 'Summary of findings' tables summary of findings Table for the main comparison; summary of findings Table 2; summary of findings Table 3.
Two trials (172 participants) compared any antibiotic treatment for the sexual partners with no intervention. When we compared it with no intervention, the effects of antibiotic treatment on recurrence rate after the fourth week (RR 1.71, 95% CI 0.65 to 4.55; 51 participants, one study), clinical improvement between the first and fourth week (RR 0.93, 95% CI 0.70 to 1.25; 152 participants, two studies) and symptomatic improvement after the fourth week (RR 0.66, 95% CI 0.39 to 1.11; 70 participants, one study) were imprecise and there were no differences between groups. We downgraded the quality of the evidence to low or very low.
Overall completeness and applicability of evidence
We conducted a comprehensive search to retrieve all published and unpublished RCTs. We were able to evaluate all primary outcomes except for serious adverse events and the secondary outcome of cost effectiveness of the intervention that were not reported in any trial. The applicability of the evidence into the target population (the sexual partners of women treated for non‐recurrent bacterial vaginosis (BV)) is broad because the retrieved trials were conducted in different clinical settings. In this sense, the result of this systematic review can be applied into clinical practice regardless of the marital status, the form of relationship (monogamous or not), the concurrent use of contraceptive methods or the frequency of sexual intercourse during the treatment. On the other hand, the interventions analysed in the review encompass multiple clinical scenarios that are common in current practice: various antibiotic regimens including 5‐nitroimidazoles and lincosamides with different schemes single dose, and treatments from two to seven days.
Finally, because the included studies only assessed the safety and effectiveness of the intervention for heterosexual relationships, the results should not be extrapolated to a different population.
Quality of the evidence
We considered five of the seven included trials to be at low risk of bias. These studies corresponded to the comparison of any antibiotic treatment versus placebo, and consequently with high confidence on the effect estimate for most outcomes. However, for the comparison any antibiotic treatment versus non‐intervention, the confidence on the effect estimate was very low due to trial limitations (lack of blinding and incomplete outcome data), inconsistency (unexplained variability in some results) and some imprecise results (few participants and outcome events with wide CIs). We could not evaluate publication bias, because there were too few included trials into each comparison (see the 'Summary of findings' tables: summary of findings Table for the main comparison; summary of findings Table 2; summary of findings Table 3).
Potential biases in the review process
This systematic review has many strengths regarding the review process: we adhered to the predefined objectives and study eligibility criteria; our literature search included an appropriate range of databases and sources, including relevant additional methods to identify relevant reports and retrieve as many eligible studies as possible; and we assessed all studies adequately for risk of bias. Two authors performed data extraction independently. However, we have some concerns about publication bias. Publication bias is a possibility because the included trials were mostly funded by industry and due to the limited number of trials for each comparison.
Agreements and disagreements with other studies or reviews
There are two previous systematic reviews published on this topic (Mehta 2012; Potter 1999). Our review includes one study that the previous two reviews did not include (Heikkinen 1989). The authors of those reviews considered that a meta‐analysis could not be conducted due to significant risk of bias in the retrieved studies and by some limitations about heterogeneity; however, these were not a limiting issue for a meta‐analysis. Also, as we have shown, the included studies (particularly for the antibiotic treatment versus placebo comparison) are of high quality, there is no significant heterogeneity and we have presented the meta‐analyses.
Our conclusions, about the lack of benefit following sexual partner treatment, agree with the recommendation of some important guidelines where this is not recommended (Workowski 2015; van Schalkwyk 2015). However, these recommendations were not based on a systematic and explicit approach.

Study flow diagram.

'Risk of bias' graph: review authors' judgements about each 'Risk of bias' item presented as percentages across all included studies.
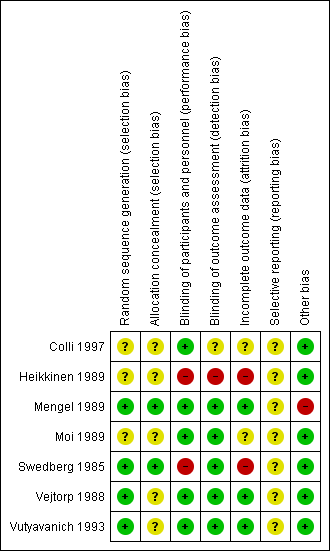
'Risk of bias' summary: review authors' judgements about each 'Risk of bias' item for each included study.
Forest plot of comparison: 1 Any antibiotic treatment versus placebo, outcome: 1.2 Recurrence of BV after the fourth week.
Forest plot of comparison: 1 Any antibiotic treatment versus placebo, outcome: 1.3 Clinical improvement during the first week.

Forest plot of comparison: 1 Any antibiotic treatment versus placebo, outcome: 1.4 Clinical improvement between the first and fourth week.

Forest plot of comparison: 1 Any antibiotic treatment versus placebo, outcome: 1.5 Clinical improvement after the fourth week.

Forest plot of comparison: 1 Any antibiotic treatment versus placebo, outcome: 1.6 Symptomatic improvement during the first week.

Forest plot of comparison: 1 Any antibiotic treatment versus placebo, outcome: 1.9 Minor adverse events during therapy in sexual partner.

Comparison 1 Any antibiotic treatment versus placebo, Outcome 1 Recurrence of BV between the first and fourth week.

Comparison 1 Any antibiotic treatment versus placebo, Outcome 2 Recurrence of BV after the fourth week.
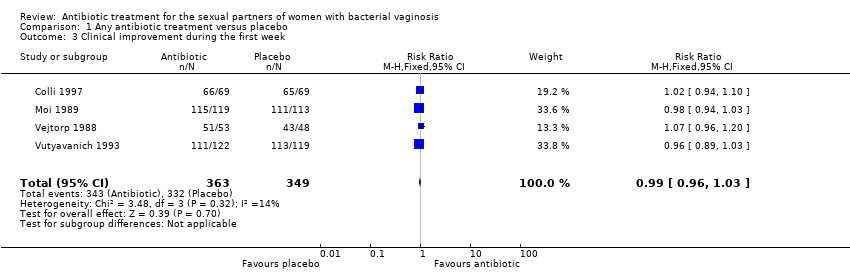
Comparison 1 Any antibiotic treatment versus placebo, Outcome 3 Clinical improvement during the first week.
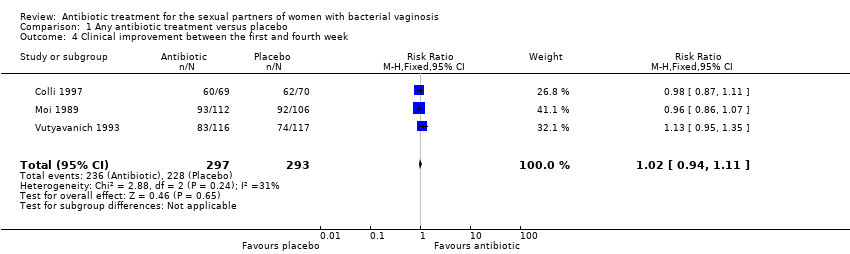
Comparison 1 Any antibiotic treatment versus placebo, Outcome 4 Clinical improvement between the first and fourth week.
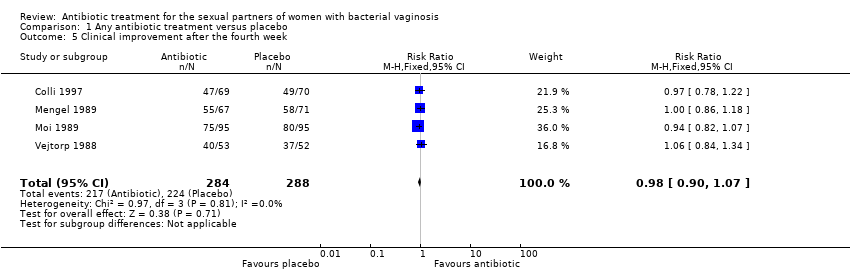
Comparison 1 Any antibiotic treatment versus placebo, Outcome 5 Clinical improvement after the fourth week.

Comparison 1 Any antibiotic treatment versus placebo, Outcome 6 Symptomatic improvement during the first week.
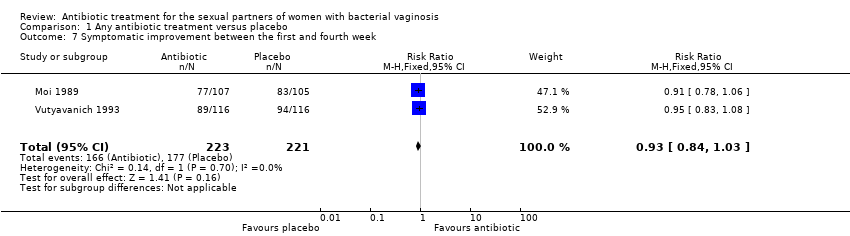
Comparison 1 Any antibiotic treatment versus placebo, Outcome 7 Symptomatic improvement between the first and fourth week.

Comparison 1 Any antibiotic treatment versus placebo, Outcome 8 Symptomatic improvement after the fourth week.

Comparison 1 Any antibiotic treatment versus placebo, Outcome 9 Minor adverse events during therapy in sexual partner.
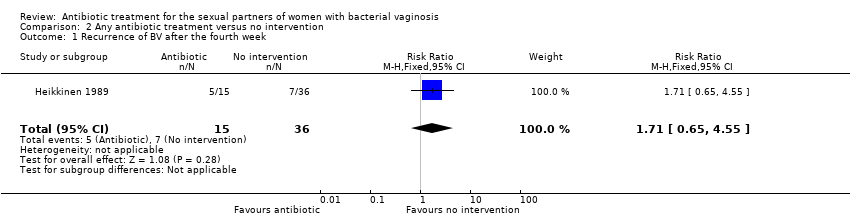
Comparison 2 Any antibiotic treatment versus no intervention, Outcome 1 Recurrence of BV after the fourth week.

Comparison 2 Any antibiotic treatment versus no intervention, Outcome 2 Clinical improvement between the first and fourth week.

Comparison 2 Any antibiotic treatment versus no intervention, Outcome 3 Symptomatic improvement after the fourth week.

Comparison 3 Any antibiotic treatment versus placebo (by antibiotic type), Outcome 1 Recurrence of BV after the fourth week.

Comparison 3 Any antibiotic treatment versus placebo (by antibiotic type), Outcome 2 Clinical improvement during the first week.

Comparison 3 Any antibiotic treatment versus placebo (by antibiotic type), Outcome 3 Clinical improvement between the first and fourth week.

Comparison 3 Any antibiotic treatment versus placebo (by antibiotic type), Outcome 4 Clinical improvement after the fourth week.
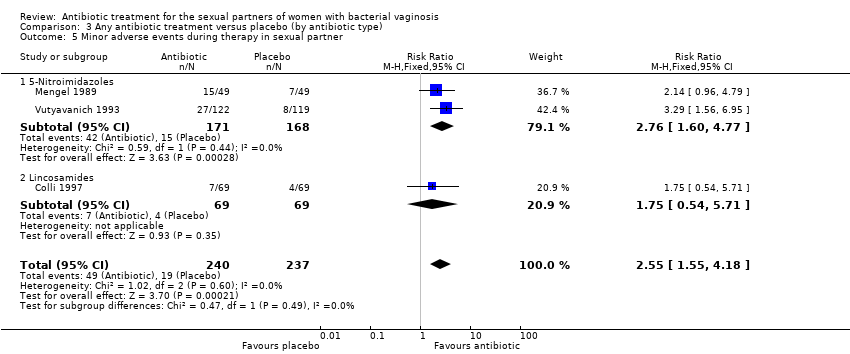
Comparison 3 Any antibiotic treatment versus placebo (by antibiotic type), Outcome 5 Minor adverse events during therapy in sexual partner.

Comparison 4 Any antibiotic treatment versus placebo (by dose), Outcome 1 Clinical improvement during the first week.

Comparison 4 Any antibiotic treatment versus placebo (by dose), Outcome 2 Clinical improvement between the first and fourth week.

Comparison 4 Any antibiotic treatment versus placebo (by dose), Outcome 3 Clinical improvement after the fourth week.

Comparison 4 Any antibiotic treatment versus placebo (by dose), Outcome 4 Symptomatic improvement during the first week.

Comparison 4 Any antibiotic treatment versus placebo (by dose), Outcome 5 Symptomatic improvement between the first and fourth week.
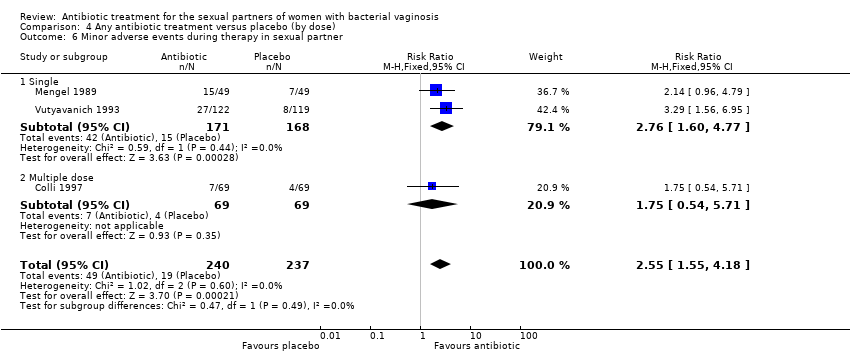
Comparison 4 Any antibiotic treatment versus placebo (by dose), Outcome 6 Minor adverse events during therapy in sexual partner.

Comparison 5 Any antibiotic treatment versus placebo (attrition bias), Outcome 1 Recurrence of BV after the fourth week.
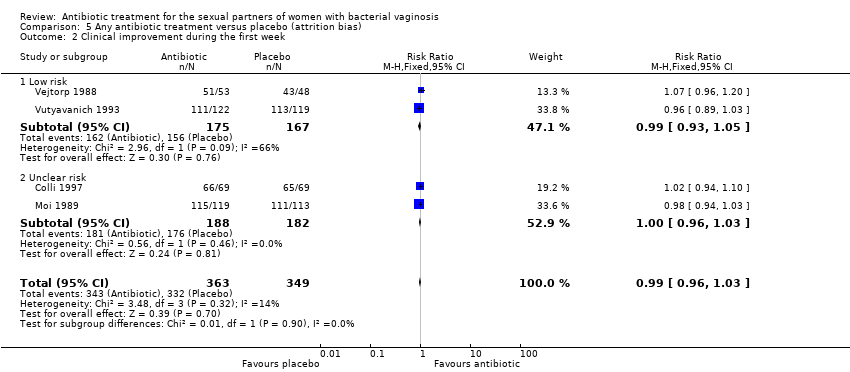
Comparison 5 Any antibiotic treatment versus placebo (attrition bias), Outcome 2 Clinical improvement during the first week.

Comparison 5 Any antibiotic treatment versus placebo (attrition bias), Outcome 3 Clinical improvement between the first and fourth week.

Comparison 5 Any antibiotic treatment versus placebo (attrition bias), Outcome 4 Clinical improvement after the fourth week.
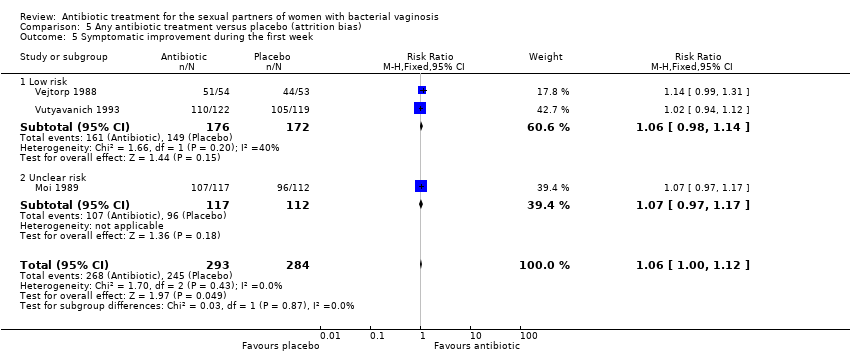
Comparison 5 Any antibiotic treatment versus placebo (attrition bias), Outcome 5 Symptomatic improvement during the first week.
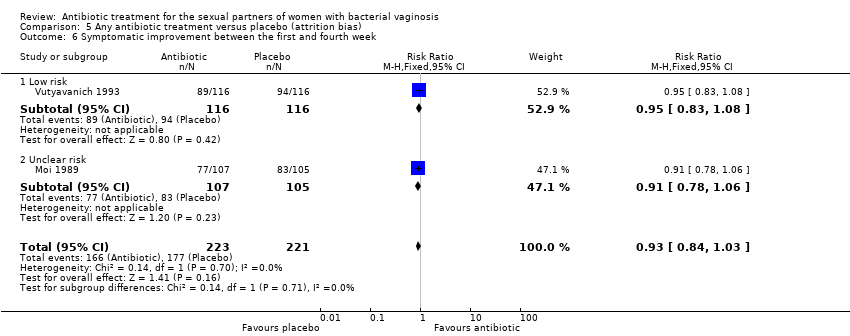
Comparison 5 Any antibiotic treatment versus placebo (attrition bias), Outcome 6 Symptomatic improvement between the first and fourth week.

Comparison 5 Any antibiotic treatment versus placebo (attrition bias), Outcome 7 Symptomatic improvement after the fourth week.

Comparison 5 Any antibiotic treatment versus placebo (attrition bias), Outcome 8 Minor adverse events during therapy in sexual partner.
| Any antibiotic treatment versus placebo for the sexual partners of woman with bacterial vaginosis | |||||
| Patient or population: sexual partners of women with bacterial vaginosis | |||||
| Outcomes | Anticipated absolute effects* (95% CI) | Relative effect | Number of participants | Quality of the evidence | |
| Risk with placebo | Risk with any antibiotic treatment | ||||
| Recurrence follow‐up 4 to 12 weeks | Study population | RR 1.00 | 372 | ⊕⊝⊝⊝ | |
| 196 per 1000 | 196 per 1000 | ||||
| Clinical improvement follow‐up 1 to 4 weeks | Study population | RR 1.02 | 590 | ⊕⊕⊕⊕ | |
| 778 per 1000 | 794 per 1000 | ||||
| Clinical improvement follow‐up 4 to 12 weeks | Study population | RR 0.98 | 572 | ⊕⊕⊕⊕ | |
| 778 per 1000 | 762 per 1000 | ||||
| Symptomatic improvement during the first week | Study population | RR 1.06 | 577 | ⊕⊕⊕⊕ | |
| 863 per 1000 | 914 per 1000 | ||||
| Symptomatic improvement follow‐up 1 to 4 weeks | Study population | RR 0.93 | 444 | ⊕⊕⊕⊕ | |
| 801 per 1000 | 745 per 1000 | ||||
| Symptomatic improvement follow‐up 4 to 12 weeks | Study population | RR 1.03 | 296 | ⊕⊕⊕⊕ | |
| 743 per 1000 | 766 per 1000 | ||||
| Minor adverse events in sexual partner | Study population | RR 2.55 | 477 | ⊕⊕⊝⊝ | |
| 80 per 1000 | 204 per 1000 | ||||
| *The risk in the intervention group (and its 95% CI) is based on the assumed risk in the comparison group and the relative effect of the intervention (and its 95% CI). | |||||
| GRADE Working Group grades of evidence | |||||
| 1Downgraded by 1 level for significant imprecision as the 95% CI was below 0.75 and over 1.25. | |||||
| Any antibiotic treatment versus no intervention | |||||
| Patient or population: sexual partners of women with bacterial vaginosis | |||||
| Outcomes | Anticipated absolute effects* (95% CI) | Relative effect | Number of participants | Quality of the evidence | |
| Risk with no intervention | Risk with any antibiotic treatment | ||||
| Recurrence follow‐up 4 to 12 weeks | Study population | RR 1.71 | 51 | ⊕⊝⊝⊝ | |
| 194 per 1000 | 333 per 1000 | ||||
| Clinical improvement follow‐up 1 to 4 weeks | Study population | RR 0.93 | 152 | ⊕⊝⊝⊝ | |
| 851 per 1000 | 792 per 1000 | ||||
| Symptomatic improvement follow‐up 4 to 12 weeks | Study population | RR 0.66 | 70 | ⊕⊝⊝⊝ | |
| 630 per 1000 | 416 per 1000 | ||||
| *The risk in the intervention group (and its 95% CI) is based on the assumed risk in the comparison group and the relative effect of the intervention (and its 95% CI). | |||||
| GRADE Working Group grades of evidence | |||||
| 1Downgraded by 2 levels due to imprecision as OIS was not achieved and the 95% CI crosses through 0.75 and 1.25. | |||||
| Any antibiotic treatment versus placebo | |||||
| Patient or population: sexual partners of women with bacterial vaginosis | |||||
| Outcomes | Anticipated absolute effects* (95% CI) | Relative effect | Number of participants | Quality of the evidence | |
| Risk with placebo | Risk with any antibiotic treatment | ||||
| Recurrence | Study population | RR 1.28 | 218 | ⊕⊕⊝⊝ | |
| 132 per 1000 | 169 per 1000 | ||||
| Clinical improvement during the first week | Study population | RR 0.99 | 712 | ⊕⊕⊕⊕ | |
| 951 per 1000 | 942 per 1000 | ||||
| *The risk in the intervention group (and its 95% CI) is based on the assumed risk in the comparison group and the relative effect of the intervention (and its 95% CI). | |||||
| GRADE Working Group grades of evidence | |||||
| 1Downgraded by 2 levels for imprecision as the 95% CI crosses through 0.75 and 1.25 and OIS is not achieved. | |||||
| Outcome or subgroup title | No. of studies | No. of participants | Statistical method | Effect size |
| 1 Recurrence of BV between the first and fourth week Show forest plot | 1 | 218 | Risk Ratio (M‐H, Fixed, 95% CI) | 1.28 [0.68, 2.43] |
| 2 Recurrence of BV after the fourth week Show forest plot | 3 | 372 | Risk Ratio (M‐H, Fixed, 95% CI) | 1.00 [0.67, 1.52] |
| 3 Clinical improvement during the first week Show forest plot | 4 | 712 | Risk Ratio (M‐H, Fixed, 95% CI) | 0.99 [0.96, 1.03] |
| 4 Clinical improvement between the first and fourth week Show forest plot | 3 | 590 | Risk Ratio (M‐H, Fixed, 95% CI) | 1.02 [0.94, 1.11] |
| 5 Clinical improvement after the fourth week Show forest plot | 4 | 572 | Risk Ratio (M‐H, Fixed, 95% CI) | 0.98 [0.90, 1.07] |
| 6 Symptomatic improvement during the first week Show forest plot | 3 | 577 | Risk Ratio (M‐H, Fixed, 95% CI) | 1.06 [1.00, 1.12] |
| 7 Symptomatic improvement between the first and fourth week Show forest plot | 2 | 444 | Risk Ratio (M‐H, Fixed, 95% CI) | 0.93 [0.84, 1.03] |
| 8 Symptomatic improvement after the fourth week Show forest plot | 2 | 296 | Risk Ratio (M‐H, Fixed, 95% CI) | 1.03 [0.90, 1.17] |
| 9 Minor adverse events during therapy in sexual partner Show forest plot | 3 | 477 | Risk Ratio (M‐H, Fixed, 95% CI) | 2.55 [1.55, 4.18] |
| Outcome or subgroup title | No. of studies | No. of participants | Statistical method | Effect size |
| 1 Recurrence of BV after the fourth week Show forest plot | 1 | 51 | Risk Ratio (M‐H, Fixed, 95% CI) | 1.71 [0.65, 4.55] |
| 2 Clinical improvement between the first and fourth week Show forest plot | 2 | 152 | Risk Ratio (M‐H, Random, 95% CI) | 0.93 [0.70, 1.25] |
| 3 Symptomatic improvement after the fourth week Show forest plot | 1 | 70 | Risk Ratio (M‐H, Fixed, 95% CI) | 0.66 [0.39, 1.11] |
| Outcome or subgroup title | No. of studies | No. of participants | Statistical method | Effect size |
| 1 Recurrence of BV after the fourth week Show forest plot | 3 | 372 | Risk Ratio (M‐H, Fixed, 95% CI) | 1.00 [0.67, 1.52] |
| 1.1 5‐Nitroimidazoles | 2 | 288 | Risk Ratio (M‐H, Fixed, 95% CI) | 1.17 [0.74, 1.84] |
| 1.2 Lincosamides | 1 | 84 | Risk Ratio (M‐H, Fixed, 95% CI) | 0.53 [0.19, 1.45] |
| 2 Clinical improvement during the first week Show forest plot | 4 | 712 | Risk Ratio (M‐H, Fixed, 95% CI) | 0.99 [0.96, 1.03] |
| 2.1 5‐Nitroimidazoles | 3 | 574 | Risk Ratio (M‐H, Fixed, 95% CI) | 0.99 [0.95, 1.03] |
| 2.2 Lincosamides | 1 | 138 | Risk Ratio (M‐H, Fixed, 95% CI) | 1.02 [0.94, 1.10] |
| 3 Clinical improvement between the first and fourth week Show forest plot | 3 | 590 | Risk Ratio (M‐H, Fixed, 95% CI) | 1.02 [0.94, 1.11] |
| 3.1 5‐Nitroimidazoles | 2 | 451 | Risk Ratio (M‐H, Fixed, 95% CI) | 1.03 [0.93, 1.14] |
| 3.2 Lincosamides | 1 | 139 | Risk Ratio (M‐H, Fixed, 95% CI) | 0.98 [0.87, 1.11] |
| 4 Clinical improvement after the fourth week Show forest plot | 4 | 572 | Risk Ratio (M‐H, Fixed, 95% CI) | 0.98 [0.90, 1.07] |
| 4.1 5‐Nitroimidazoles | 3 | 433 | Risk Ratio (M‐H, Fixed, 95% CI) | 0.99 [0.90, 1.08] |
| 4.2 Lincosamides | 1 | 139 | Risk Ratio (M‐H, Fixed, 95% CI) | 0.97 [0.78, 1.22] |
| 5 Minor adverse events during therapy in sexual partner Show forest plot | 3 | 477 | Risk Ratio (M‐H, Fixed, 95% CI) | 2.55 [1.55, 4.18] |
| 5.1 5‐Nitroimidazoles | 2 | 339 | Risk Ratio (M‐H, Fixed, 95% CI) | 2.76 [1.60, 4.77] |
| 5.2 Lincosamides | 1 | 138 | Risk Ratio (M‐H, Fixed, 95% CI) | 1.75 [0.54, 5.71] |
| Outcome or subgroup title | No. of studies | No. of participants | Statistical method | Effect size |
| 1 Clinical improvement during the first week Show forest plot | 4 | 712 | Risk Ratio (M‐H, Fixed, 95% CI) | 0.99 [0.96, 1.03] |
| 1.1 Single | 1 | 241 | Risk Ratio (M‐H, Fixed, 95% CI) | 0.96 [0.89, 1.03] |
| 1.2 Multiple dose | 3 | 471 | Risk Ratio (M‐H, Fixed, 95% CI) | 1.01 [0.97, 1.05] |
| 2 Clinical improvement between the first and fourth week Show forest plot | 3 | 590 | Risk Ratio (M‐H, Fixed, 95% CI) | 1.02 [0.94, 1.11] |
| 2.1 Single | 1 | 233 | Risk Ratio (M‐H, Fixed, 95% CI) | 1.13 [0.95, 1.35] |
| 2.2 Multiple dose | 2 | 357 | Risk Ratio (M‐H, Fixed, 95% CI) | 0.97 [0.89, 1.05] |
| 3 Clinical improvement after the fourth week Show forest plot | 4 | 572 | Risk Ratio (M‐H, Fixed, 95% CI) | 0.98 [0.90, 1.07] |
| 3.1 Single | 1 | 138 | Risk Ratio (M‐H, Fixed, 95% CI) | 1.00 [0.86, 1.18] |
| 3.2 Multiple dose | 3 | 434 | Risk Ratio (M‐H, Fixed, 95% CI) | 0.98 [0.88, 1.09] |
| 4 Symptomatic improvement during the first week Show forest plot | 3 | 577 | Risk Ratio (M‐H, Fixed, 95% CI) | 1.06 [1.00, 1.12] |
| 4.1 Single | 1 | 241 | Risk Ratio (M‐H, Fixed, 95% CI) | 1.02 [0.94, 1.12] |
| 4.2 Multiple dose | 2 | 336 | Risk Ratio (M‐H, Fixed, 95% CI) | 1.09 [1.01, 1.18] |
| 5 Symptomatic improvement between the first and fourth week Show forest plot | 2 | 444 | Risk Ratio (M‐H, Fixed, 95% CI) | 0.93 [0.84, 1.03] |
| 5.1 Single | 1 | 232 | Risk Ratio (M‐H, Fixed, 95% CI) | 0.95 [0.83, 1.08] |
| 5.2 Multiple dose | 1 | 212 | Risk Ratio (M‐H, Fixed, 95% CI) | 0.91 [0.78, 1.06] |
| 6 Minor adverse events during therapy in sexual partner Show forest plot | 3 | 477 | Risk Ratio (M‐H, Fixed, 95% CI) | 2.55 [1.55, 4.18] |
| 6.1 Single | 2 | 339 | Risk Ratio (M‐H, Fixed, 95% CI) | 2.76 [1.60, 4.77] |
| 6.2 Multiple dose | 1 | 138 | Risk Ratio (M‐H, Fixed, 95% CI) | 1.75 [0.54, 5.71] |
| Outcome or subgroup title | No. of studies | No. of participants | Statistical method | Effect size |
| 1 Recurrence of BV after the fourth week Show forest plot | 3 | 372 | Risk Ratio (M‐H, Fixed, 95% CI) | 1.00 [0.67, 1.52] |
| 1.1 Low risk | 1 | 98 | Risk Ratio (M‐H, Fixed, 95% CI) | 0.96 [0.48, 1.92] |
| 1.2 Unclear risk | 2 | 274 | Risk Ratio (M‐H, Fixed, 95% CI) | 1.03 [0.62, 1.71] |
| 2 Clinical improvement during the first week Show forest plot | 4 | 712 | Risk Ratio (M‐H, Fixed, 95% CI) | 0.99 [0.96, 1.03] |
| 2.1 Low risk | 2 | 342 | Risk Ratio (M‐H, Fixed, 95% CI) | 0.99 [0.93, 1.05] |
| 2.2 Unclear risk | 2 | 370 | Risk Ratio (M‐H, Fixed, 95% CI) | 1.00 [0.96, 1.03] |
| 3 Clinical improvement between the first and fourth week Show forest plot | 3 | 590 | Risk Ratio (M‐H, Fixed, 95% CI) | 1.02 [0.94, 1.11] |
| 3.1 Low risk | 1 | 233 | Risk Ratio (M‐H, Fixed, 95% CI) | 1.13 [0.95, 1.35] |
| 3.2 Unclear risk | 2 | 357 | Risk Ratio (M‐H, Fixed, 95% CI) | 0.97 [0.89, 1.05] |
| 4 Clinical improvement after the fourth week Show forest plot | 4 | 572 | Risk Ratio (M‐H, Fixed, 95% CI) | 0.98 [0.90, 1.07] |
| 4.1 Low risk | 2 | 243 | Risk Ratio (M‐H, Fixed, 95% CI) | 1.03 [0.90, 1.17] |
| 4.2 Unclear risk | 2 | 329 | Risk Ratio (M‐H, Fixed, 95% CI) | 0.95 [0.84, 1.07] |
| 5 Symptomatic improvement during the first week Show forest plot | 3 | 577 | Risk Ratio (M‐H, Fixed, 95% CI) | 1.06 [1.00, 1.12] |
| 5.1 Low risk | 2 | 348 | Risk Ratio (M‐H, Fixed, 95% CI) | 1.06 [0.98, 1.14] |
| 5.2 Unclear risk | 1 | 229 | Risk Ratio (M‐H, Fixed, 95% CI) | 1.07 [0.97, 1.17] |
| 6 Symptomatic improvement between the first and fourth week Show forest plot | 2 | 444 | Risk Ratio (M‐H, Fixed, 95% CI) | 0.93 [0.84, 1.03] |
| 6.1 Low risk | 1 | 232 | Risk Ratio (M‐H, Fixed, 95% CI) | 0.95 [0.83, 1.08] |
| 6.2 Unclear risk | 1 | 212 | Risk Ratio (M‐H, Fixed, 95% CI) | 0.91 [0.78, 1.06] |
| 7 Symptomatic improvement after the fourth week Show forest plot | 2 | 296 | Risk Ratio (M‐H, Fixed, 95% CI) | 1.03 [0.90, 1.17] |
| 7.1 Low risk | 1 | 107 | Risk Ratio (M‐H, Fixed, 95% CI) | 1.03 [0.83, 1.29] |
| 7.2 Unclear risk | 1 | 189 | Risk Ratio (M‐H, Fixed, 95% CI) | 1.02 [0.87, 1.20] |
| 8 Minor adverse events during therapy in sexual partner Show forest plot | 3 | 477 | Risk Ratio (M‐H, Fixed, 95% CI) | 2.55 [1.55, 4.18] |
| 8.1 Low risk | 2 | 339 | Risk Ratio (M‐H, Fixed, 95% CI) | 2.76 [1.60, 4.77] |
| 8.2 Unclear risk | 1 | 138 | Risk Ratio (M‐H, Fixed, 95% CI) | 1.75 [0.54, 5.71] |