Scolaris Content Display Scolaris Content Display

Study flow diagram.
Figuras y tablas -
Figure 1

Study flow diagram.

'Risk of bias' graph: review authors' judgements about each risk of bias item presented as percentages across all included studies.
Figuras y tablas -
Figure 2

'Risk of bias' graph: review authors' judgements about each risk of bias item presented as percentages across all included studies.

'Risk of bias' summary: review authors' judgements about each risk of bias item for each included study.
Figuras y tablas -
Figure 3

'Risk of bias' summary: review authors' judgements about each risk of bias item for each included study.

Network diagram for PPH ≥ 500 mL. The nodes represent an intervention and their size is proportional to the number of trials comparing this intervention to any other in the network. The lines connecting each pair of interventions represent a direct comparison and are drawn proportional to the number of trials making each direct comparison. Numbers on the lines represent the number of trials and participants for each comparison. The colour of the line is green when more than 50% of the trials involved in the specific direct comparison are judged to be at “low risk of bias” if they were double‐blinded, and had allocation concealment with little loss to follow‐up (less than 10%). The colour is red when less than 50% of the trials are at “low risk of bias”. Multi‐arm trials contribute to more than one comparison.
Figuras y tablas -
Figure 4

Network diagram for PPH ≥ 500 mL. The nodes represent an intervention and their size is proportional to the number of trials comparing this intervention to any other in the network. The lines connecting each pair of interventions represent a direct comparison and are drawn proportional to the number of trials making each direct comparison. Numbers on the lines represent the number of trials and participants for each comparison. The colour of the line is green when more than 50% of the trials involved in the specific direct comparison are judged to be at “low risk of bias” if they were double‐blinded, and had allocation concealment with little loss to follow‐up (less than 10%). The colour is red when less than 50% of the trials are at “low risk of bias”. Multi‐arm trials contribute to more than one comparison.

Forest plot with relative risk ratios and 95% CIs from network meta‐analysis and pairwise analyses for prevention of PPH ≥ 500 mL.
Figuras y tablas -
Figure 5

Forest plot with relative risk ratios and 95% CIs from network meta‐analysis and pairwise analyses for prevention of PPH ≥ 500 mL.

Cumulative rankograms comparing each of the uterotonic drugs for prevention of PPH ≥ 500 mL. Ranking indicates the cumulative probability of being the best drug, the second best, the third best, etc. The x‐axis shows the relative ranking and the y‐axis the cumulative probability of each ranking. We estimate the SUrface underneath this Cumulative RAnking line (SUCRA); the larger the SUCRA the higher its rank among all available drug options.
Figuras y tablas -
Figure 6

Cumulative rankograms comparing each of the uterotonic drugs for prevention of PPH ≥ 500 mL. Ranking indicates the cumulative probability of being the best drug, the second best, the third best, etc. The x‐axis shows the relative ranking and the y‐axis the cumulative probability of each ranking. We estimate the SUrface underneath this Cumulative RAnking line (SUCRA); the larger the SUCRA the higher its rank among all available drug options.

Network diagram for PPH ≥ 1000 mL.
Figuras y tablas -
Figure 7

Network diagram for PPH ≥ 1000 mL.

Forest plot with relative risk ratios and 95% CIs from network meta‐analysis and pairwise analyses for prevention of PPH ≥ 1000 mL.
Figuras y tablas -
Figure 8

Forest plot with relative risk ratios and 95% CIs from network meta‐analysis and pairwise analyses for prevention of PPH ≥ 1000 mL.

Cumulative rankograms comparing each of the uterotonic drugs for prevention of PPH ≥ 1000 mL.
Figuras y tablas -
Figure 9

Cumulative rankograms comparing each of the uterotonic drugs for prevention of PPH ≥ 1000 mL.

Forest plot with relative risk ratios and 95% CIs from network meta‐analysis and pairwise analyses for maternal death.
Figuras y tablas -
Figure 10

Forest plot with relative risk ratios and 95% CIs from network meta‐analysis and pairwise analyses for maternal death.

Cumulative rankograms comparing each of the uterotonic drugs for prevention of maternal death.
Figuras y tablas -
Figure 11

Cumulative rankograms comparing each of the uterotonic drugs for prevention of maternal death.

Forest plot with relative risk ratios and 95% CIs from network meta‐analysis and pairwise analyses for maternal death or severe morbidity.
Figuras y tablas -
Figure 12

Forest plot with relative risk ratios and 95% CIs from network meta‐analysis and pairwise analyses for maternal death or severe morbidity.

Cumulative rankograms comparing each of the uterotonic drugs for prevention of maternal deaths or severe morbidity events.
Figuras y tablas -
Figure 13

Cumulative rankograms comparing each of the uterotonic drugs for prevention of maternal deaths or severe morbidity events.

Forest plot with relative risk ratios and 95% CIs from network meta‐analysis and pairwise analyses for the requirement of additional uterotonics.
Figuras y tablas -
Figure 14

Forest plot with relative risk ratios and 95% CIs from network meta‐analysis and pairwise analyses for the requirement of additional uterotonics.

Cumulative rankograms comparing each of the uterotonic drugs for the requirement of additional uterotonics.
Figuras y tablas -
Figure 15

Cumulative rankograms comparing each of the uterotonic drugs for the requirement of additional uterotonics.

Forest plot with relative risk ratios and 95% CIs from network meta‐analysis and pairwise analyses for the requirement of blood transfusion.
Figuras y tablas -
Figure 16

Forest plot with relative risk ratios and 95% CIs from network meta‐analysis and pairwise analyses for the requirement of blood transfusion.

Cumulative rankograms comparing each of the uterotonic drugs for the requirement of blood transfusion.
Figuras y tablas -
Figure 17

Cumulative rankograms comparing each of the uterotonic drugs for the requirement of blood transfusion.

Forest plot with relative risk ratios and 95% CIs from network meta‐analysis and pairwise analyses for the requirement of manual removal of placenta.
Figuras y tablas -
Figure 18

Forest plot with relative risk ratios and 95% CIs from network meta‐analysis and pairwise analyses for the requirement of manual removal of placenta.

Cumulative rankograms comparing each of the uterotonic drugs for the requirement of manual removal of placenta.
Figuras y tablas -
Figure 19

Cumulative rankograms comparing each of the uterotonic drugs for the requirement of manual removal of placenta.

Forest plot with relative risk ratios and 95% CIs from network meta‐analysis and pairwise analyses for blood loss (mL).
Figuras y tablas -
Figure 20

Forest plot with relative risk ratios and 95% CIs from network meta‐analysis and pairwise analyses for blood loss (mL).

Cumulative rankograms comparing each of the uterotonic drugs for blood loss (mL).
Figuras y tablas -
Figure 21

Cumulative rankograms comparing each of the uterotonic drugs for blood loss (mL).

Forest plot with relative risk ratios and 95% CIs from network meta‐analysis and pairwise analyses for duration of third stage (minutes).
Figuras y tablas -
Figure 22

Forest plot with relative risk ratios and 95% CIs from network meta‐analysis and pairwise analyses for duration of third stage (minutes).

Cumulative rankograms comparing each of the uterotonic drugs for duration of third stage (minutes).
Figuras y tablas -
Figure 23

Cumulative rankograms comparing each of the uterotonic drugs for duration of third stage (minutes).

Forest plot with relative risk ratios and 95% CIs from network meta‐analysis and pairwise analyses for change in haemoglobin measurements before and after birth (g/L).
Figuras y tablas -
Figure 24

Forest plot with relative risk ratios and 95% CIs from network meta‐analysis and pairwise analyses for change in haemoglobin measurements before and after birth (g/L).

Cumulative rankograms comparing each of the uterotonic drugs for change in haemoglobin measurements before and after birth (g/L).
Figuras y tablas -
Figure 25

Cumulative rankograms comparing each of the uterotonic drugs for change in haemoglobin measurements before and after birth (g/L).

Forest plot with relative risk ratios and 95% CIs from network meta‐analysis and pairwise analyses for neonatal unit admissions.
Figuras y tablas -
Figure 26

Forest plot with relative risk ratios and 95% CIs from network meta‐analysis and pairwise analyses for neonatal unit admissions.

Cumulative rankograms comparing each of the uterotonic drugs for neonatal unit admissions.
Figuras y tablas -
Figure 27

Cumulative rankograms comparing each of the uterotonic drugs for neonatal unit admissions.

Forest plot with relative risk ratios and 95% CIs from network meta‐analysis and pairwise analyses for breastfeeding at discharge.
Figuras y tablas -
Figure 28

Forest plot with relative risk ratios and 95% CIs from network meta‐analysis and pairwise analyses for breastfeeding at discharge.

Cumulative rankograms comparing each of the uterotonic drugs for breastfeeding at discharge.
Figuras y tablas -
Figure 29

Cumulative rankograms comparing each of the uterotonic drugs for breastfeeding at discharge.

Forest plot with relative risk ratios and 95% CIs from network meta‐analysis and pairwise analyses for nausea.
Figuras y tablas -
Figure 30

Forest plot with relative risk ratios and 95% CIs from network meta‐analysis and pairwise analyses for nausea.

Cumulative rankograms comparing each of the uterotonic drugs for nausea.
Figuras y tablas -
Figure 31

Cumulative rankograms comparing each of the uterotonic drugs for nausea.

Forest plot with relative risk ratios and 95% CIs from network meta‐analysis and pairwise analyses for vomiting.
Figuras y tablas -
Figure 32

Forest plot with relative risk ratios and 95% CIs from network meta‐analysis and pairwise analyses for vomiting.

Cumulative rankograms comparing each of the uterotonic drugs for vomiting.
Figuras y tablas -
Figure 33

Cumulative rankograms comparing each of the uterotonic drugs for vomiting.

Forest plot with relative risk ratios and 95% CIs from network meta‐analysis and pairwise analyses for hypertension.
Figuras y tablas -
Figure 34

Forest plot with relative risk ratios and 95% CIs from network meta‐analysis and pairwise analyses for hypertension.

Cumulative rankograms comparing each of the uterotonic drugs for hypertension.
Figuras y tablas -
Figure 35

Cumulative rankograms comparing each of the uterotonic drugs for hypertension.

Forest plot with relative risk ratios and 95% CIs from network meta‐analysis and pairwise analyses for headache.
Figuras y tablas -
Figure 36

Forest plot with relative risk ratios and 95% CIs from network meta‐analysis and pairwise analyses for headache.

Cumulative rankograms comparing each of the uterotonic drugs for headache.
Figuras y tablas -
Figure 37

Cumulative rankograms comparing each of the uterotonic drugs for headache.

Forest plot with relative risk ratios and 95% CIs from network meta‐analysis and pairwise analyses for fever.
Figuras y tablas -
Figure 38

Forest plot with relative risk ratios and 95% CIs from network meta‐analysis and pairwise analyses for fever.

Cumulative rankograms comparing each of the uterotonic drugs for fever.
Figuras y tablas -
Figure 39

Cumulative rankograms comparing each of the uterotonic drugs for fever.

Forest plot with relative risk ratios and 95% CIs from network meta‐analysis and pairwise analyses for shivering.
Figuras y tablas -
Figure 40

Forest plot with relative risk ratios and 95% CIs from network meta‐analysis and pairwise analyses for shivering.

Cumulative rankograms comparing each of the uterotonic drugs for shivering.
Figuras y tablas -
Figure 41

Cumulative rankograms comparing each of the uterotonic drugs for shivering.

Forest plot with relative risk ratios and 95% CIs from network meta‐analysis and pairwise analyses for tachycardia.
Figuras y tablas -
Figure 42

Forest plot with relative risk ratios and 95% CIs from network meta‐analysis and pairwise analyses for tachycardia.

Cumulative rankograms comparing each of the uterotonic drugs for tachycardia.
Figuras y tablas -
Figure 43

Cumulative rankograms comparing each of the uterotonic drugs for tachycardia.

Forest plot with relative risk ratios and 95% CIs from network meta‐analysis and pairwise analyses for hypotension.
Figuras y tablas -
Figure 44

Forest plot with relative risk ratios and 95% CIs from network meta‐analysis and pairwise analyses for hypotension.

Cumulative rankograms comparing each of the uterotonic drugs for hypotension.
Figuras y tablas -
Figure 45

Cumulative rankograms comparing each of the uterotonic drugs for hypotension.

Forest plot with relative risk ratios and 95% CIs from network meta‐analysis and pairwise analyses for abdominal pain.
Figuras y tablas -
Figure 46

Forest plot with relative risk ratios and 95% CIs from network meta‐analysis and pairwise analyses for abdominal pain.

Cumulative rankograms comparing each of the uterotonic drugs for abdominal pain.
Figuras y tablas -
Figure 47

Cumulative rankograms comparing each of the uterotonic drugs for abdominal pain.

Forest plot with relative risk ratios and 95% CIs from network meta‐analysis and pairwise analyses for prevention of PPH ≥ 500 mL by mode of birth (vaginal birth).
Figuras y tablas -
Figure 48

Forest plot with relative risk ratios and 95% CIs from network meta‐analysis and pairwise analyses for prevention of PPH ≥ 500 mL by mode of birth (vaginal birth).

Cumulative rankograms comparing each of the uterotonic drugs for prevention of PPH ≥ 500 mL by mode of birth (vaginal birth).
Figuras y tablas -
Figure 49

Cumulative rankograms comparing each of the uterotonic drugs for prevention of PPH ≥ 500 mL by mode of birth (vaginal birth).

Forest plot with relative risk ratios and 95% CIs from network meta‐analysis and pairwise analyses for prevention of PPH ≥ 500 mL by mode of birth (caesarean).
Figuras y tablas -
Figure 50

Forest plot with relative risk ratios and 95% CIs from network meta‐analysis and pairwise analyses for prevention of PPH ≥ 500 mL by mode of birth (caesarean).

Cumulative rankograms comparing each of the uterotonic drugs for prevention of PPH ≥ 500 mL by mode of birth (caesarean).
Figuras y tablas -
Figure 51

Cumulative rankograms comparing each of the uterotonic drugs for prevention of PPH ≥ 500 mL by mode of birth (caesarean).

Forest plot with relative risk ratios and 95% CIs from network meta‐analysis and pairwise analyses for prevention of PPH ≥ 500 mL by prior risk for PPH (low risk).
Figuras y tablas -
Figure 52

Forest plot with relative risk ratios and 95% CIs from network meta‐analysis and pairwise analyses for prevention of PPH ≥ 500 mL by prior risk for PPH (low risk).

Cumulative rankograms comparing each of the uterotonic drugs for prevention of PPH ≥ 500 mL by prior risk for PPH (low risk).
Figuras y tablas -
Figure 53

Cumulative rankograms comparing each of the uterotonic drugs for prevention of PPH ≥ 500 mL by prior risk for PPH (low risk).

Forest plot with relative risk ratios and 95% CIs from network meta‐analysis and pairwise analyses for prevention of PPH ≥ 500 mL by prior risk for PPH (high risk).
Figuras y tablas -
Figure 54

Forest plot with relative risk ratios and 95% CIs from network meta‐analysis and pairwise analyses for prevention of PPH ≥ 500 mL by prior risk for PPH (high risk).

Cumulative rankograms comparing each of the uterotonic drugs for prevention of PPH ≥ 500 mL by prior risk for PPH (high risk).
Figuras y tablas -
Figure 55

Cumulative rankograms comparing each of the uterotonic drugs for prevention of PPH ≥ 500 mL by prior risk for PPH (high risk).

Forest plot with relative risk ratios and 95% CIs from network meta‐analysis and pairwise analyses for prevention of PPH ≥ 500 mL by healthcare setting (hospital setting).
Figuras y tablas -
Figure 56

Forest plot with relative risk ratios and 95% CIs from network meta‐analysis and pairwise analyses for prevention of PPH ≥ 500 mL by healthcare setting (hospital setting).

Cumulative rankograms comparing each of the uterotonic drugs for prevention of PPH ≥ 500 mL by healthcare setting (hospital setting).
Figuras y tablas -
Figure 57

Cumulative rankograms comparing each of the uterotonic drugs for prevention of PPH ≥ 500 mL by healthcare setting (hospital setting).

Forest plot with relative risk ratios and 95% CIs from network meta‐analysis and pairwise analyses for prevention of PPH ≥ 500 mL by healthcare setting (community setting).
Figuras y tablas -
Figure 58

Forest plot with relative risk ratios and 95% CIs from network meta‐analysis and pairwise analyses for prevention of PPH ≥ 500 mL by healthcare setting (community setting).

Cumulative rankograms comparing each of the uterotonic drugs for prevention of PPH ≥ 500 mL by healthcare setting (community setting).
Figuras y tablas -
Figure 59

Cumulative rankograms comparing each of the uterotonic drugs for prevention of PPH ≥ 500 mL by healthcare setting (community setting).

Forest plot with relative risk ratios and 95% CIs from network meta‐analysis and pairwise analyses for prevention of PPH ≥ 500 mL restricted to misoprostol studies that use a low dose (less or equal to 500 mcg).
Figuras y tablas -
Figure 60

Forest plot with relative risk ratios and 95% CIs from network meta‐analysis and pairwise analyses for prevention of PPH ≥ 500 mL restricted to misoprostol studies that use a low dose (less or equal to 500 mcg).

Cumulative rankograms comparing each of the uterotonic drugs for prevention of PPH ≥ 500 mL restricted to misoprostol studies that use a low dose (less or equal to 500 mcg).
Figuras y tablas -
Figure 61

Cumulative rankograms comparing each of the uterotonic drugs for prevention of PPH ≥ 500 mL restricted to misoprostol studies that use a low dose (less or equal to 500 mcg).

Forest plot with relative risk ratios and 95% CIs from network meta‐analysis and pairwise analyses for prevention of PPH ≥ 500 mL restricted to misoprostol studies that use a high dose (600 mcg or more).
Figuras y tablas -
Figure 62

Forest plot with relative risk ratios and 95% CIs from network meta‐analysis and pairwise analyses for prevention of PPH ≥ 500 mL restricted to misoprostol studies that use a high dose (600 mcg or more).

Cumulative rankograms comparing each of the uterotonic drugs for prevention of PPH ≥ 1000 mL restricted to misoprostol studies that use a high dose (600 mcg or more).
Figuras y tablas -
Figure 63

Cumulative rankograms comparing each of the uterotonic drugs for prevention of PPH ≥ 1000 mL restricted to misoprostol studies that use a high dose (600 mcg or more).

Forest plot with relative risk ratios and 95% CIs from network meta‐analysis and pairwise analyses for prevention of PPH ≥ 500 mL restricted to oxytocin studies that used an intramuscular or intravenous bolus of any dose.
Figuras y tablas -
Figure 64

Forest plot with relative risk ratios and 95% CIs from network meta‐analysis and pairwise analyses for prevention of PPH ≥ 500 mL restricted to oxytocin studies that used an intramuscular or intravenous bolus of any dose.

Cumulative rankograms comparing each of the uterotonic drugs for prevention of PPH ≥ 500 mL restricted to oxytocin studies that used an intramuscular or intravenous bolus of any dose.
Figuras y tablas -
Figure 65

Cumulative rankograms comparing each of the uterotonic drugs for prevention of PPH ≥ 500 mL restricted to oxytocin studies that used an intramuscular or intravenous bolus of any dose.

Forest plot with relative risk ratios and 95% CIs from network meta‐analysis and pairwise analyses for prevention of PPH ≥ 500 mL restricted to oxytocin studies that used an intravenous bolus plus an infusion of any dose.
Figuras y tablas -
Figure 66

Forest plot with relative risk ratios and 95% CIs from network meta‐analysis and pairwise analyses for prevention of PPH ≥ 500 mL restricted to oxytocin studies that used an intravenous bolus plus an infusion of any dose.

Cumulative rankograms comparing each of the uterotonic drugs for prevention of PPH ≥ 500 mL restricted to oxytocin studies that used an intravenous bolus plus an infusion of any dose.
Figuras y tablas -
Figure 67

Cumulative rankograms comparing each of the uterotonic drugs for prevention of PPH ≥ 500 mL restricted to oxytocin studies that used an intravenous bolus plus an infusion of any dose.

Forest plot with relative risk ratios and 95% CIs from network meta‐analysis and pairwise analyses for prevention of PPH ≥ 500 mL restricted to oxytocin studies that used an intravenous infusion only of any dose.
Figuras y tablas -
Figure 68

Forest plot with relative risk ratios and 95% CIs from network meta‐analysis and pairwise analyses for prevention of PPH ≥ 500 mL restricted to oxytocin studies that used an intravenous infusion only of any dose.

Cumulative rankograms comparing each of the uterotonic drugs for prevention of PPH ≥ 500 mL restricted to oxytocin studies that used an intravenous infusion only of any dose.
Figuras y tablas -
Figure 69

Cumulative rankograms comparing each of the uterotonic drugs for prevention of PPH ≥ 500 mL restricted to oxytocin studies that used an intravenous infusion only of any dose.

Forest plot with relative risk ratios and 95% CIs from network meta‐analysis and pairwise analyses for prevention of PPH ≥ 500 mL restricted to low risk of bias studies only.
Figuras y tablas -
Figure 70

Forest plot with relative risk ratios and 95% CIs from network meta‐analysis and pairwise analyses for prevention of PPH ≥ 500 mL restricted to low risk of bias studies only.

Cumulative rankograms comparing each of the uterotonic drugs for prevention of PPH ≥ 500 mL restricted to low risk of bias studies only.
Figuras y tablas -
Figure 71

Cumulative rankograms comparing each of the uterotonic drugs for prevention of PPH ≥ 500 mL restricted to low risk of bias studies only.

Forest plot with relative risk ratios and 95% CIs from network meta‐analysis and pairwise analyses for prevention of PPH ≥ 500 mL restricted to studies with funding source at low risk of bias (public or no funding).
Figuras y tablas -
Figure 72

Forest plot with relative risk ratios and 95% CIs from network meta‐analysis and pairwise analyses for prevention of PPH ≥ 500 mL restricted to studies with funding source at low risk of bias (public or no funding).

Cumulative rankograms comparing each of the uterotonic drugs for prevention of PPH ≥ 500 mL restricted to studies with funding source at low risk of bias (public or no funding).
Figuras y tablas -
Figure 73

Cumulative rankograms comparing each of the uterotonic drugs for prevention of PPH ≥ 500 mL restricted to studies with funding source at low risk of bias (public or no funding).

Forest plot with relative risk ratios and 95% CIs from network meta‐analysis and pairwise analyses for prevention of PPH ≥ 500 mL restricted to studies with an objective method of measuring blood loss.
Figuras y tablas -
Figure 74

Forest plot with relative risk ratios and 95% CIs from network meta‐analysis and pairwise analyses for prevention of PPH ≥ 500 mL restricted to studies with an objective method of measuring blood loss.

Cumulative rankograms comparing each of the uterotonic drugs for prevention of PPH ≥ 500 mL restricted to studies with an objective method of measuring blood loss.
Figuras y tablas -
Figure 75

Cumulative rankograms comparing each of the uterotonic drugs for prevention of PPH ≥ 500 mL restricted to studies with an objective method of measuring blood loss.

Forest plot with relative risk ratios and 95% CIs from network meta‐analysis and pairwise analyses for prevention of PPH ≥ 500 mL restricted to large studies (> 400 participants).
Figuras y tablas -
Figure 76

Forest plot with relative risk ratios and 95% CIs from network meta‐analysis and pairwise analyses for prevention of PPH ≥ 500 mL restricted to large studies (> 400 participants).

Cumulative rankograms comparing each of the uterotonic drugs for prevention of PPH ≥ 500 mL restricted to large studies (> 400 participants).
Figuras y tablas -
Figure 77

Cumulative rankograms comparing each of the uterotonic drugs for prevention of PPH ≥ 500 mL restricted to large studies (> 400 participants).

Effects of uterotonic drugs for preventing postpartum haemorrhage: a network meta‐analysis

Patient or population: Women giving birth and at the third stage of labour

Settings: Hospital setting

Intervention: Ergometrine plus oxytocin, Carbetocin, Misoprostol plus oxytocin

Comparison: Oxytocin
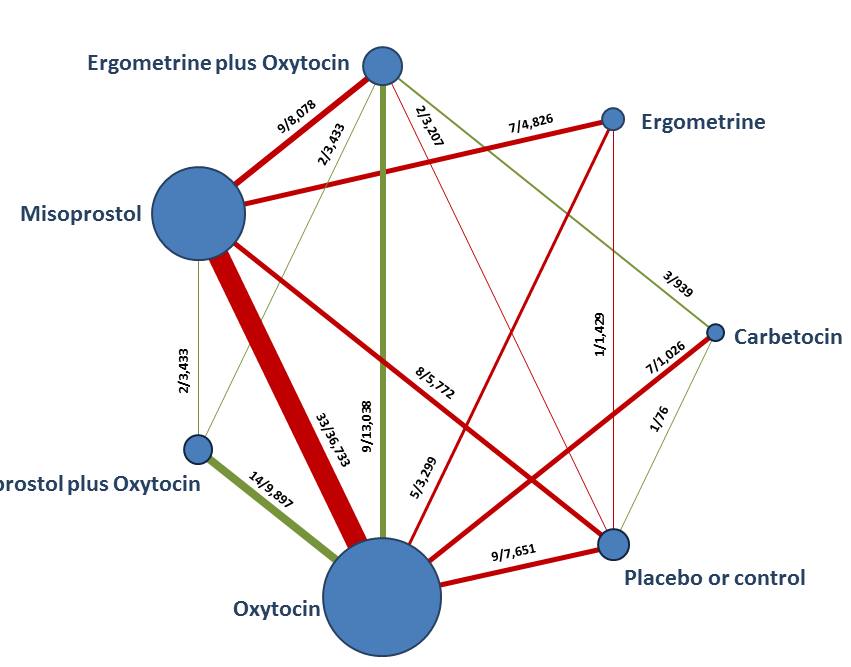
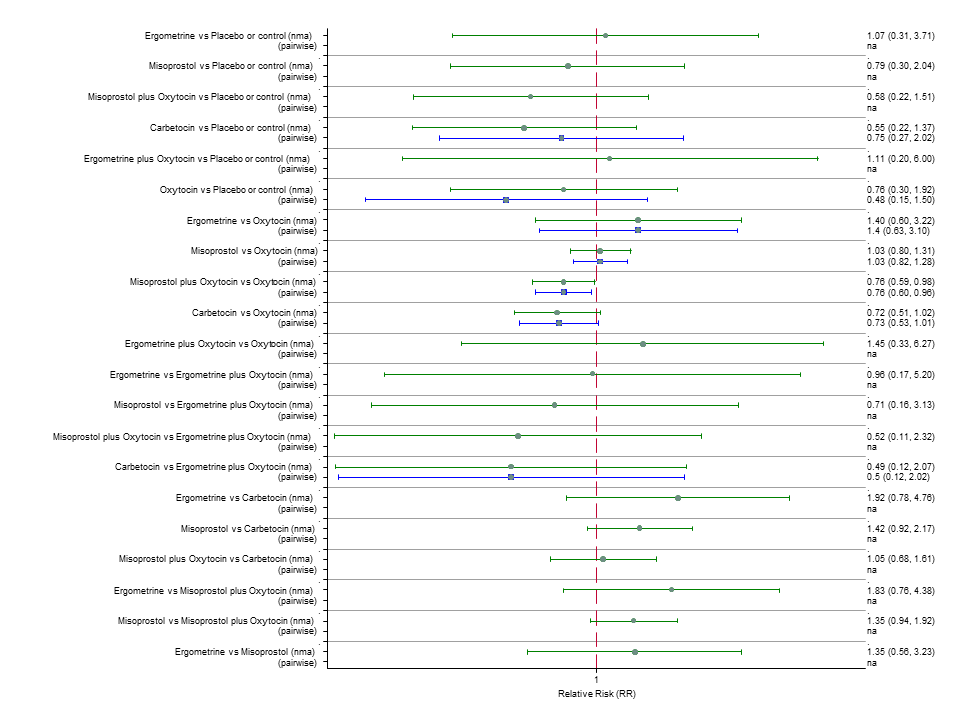
Outcomes

Effects and 95% confidence intervals in the effects. Main comparator is oxytocin.

Comments

Risk with ergometrine plus oxytocin*

Risk with carbetocin*

Risk with misoprostol plus oxytocin*

Risk with oxytocin**

PPH ≥500 mL

7.2% (6 to 8.7) for vaginal births

51.7% (42.7 to 62.2) for caesareans

7.6% (5.5 to 10.5) for vaginal births

53.9% (38.9 to 74.9) for caesareans

7.7% (6.3 to 9.5) for vaginal births

54.7% (44.9 to 67.4) for caesareans

10.5% (9.8 to 11.3) for vaginal births

74.9% (65.7 to 85.4) for caesareans

There was evidence of global inconsistency in this analysis ( P = 0.046). However, the comparisons in this table were consistent except for the comparison of ergometrine versus no treatment not included in this table‐based on a single study.

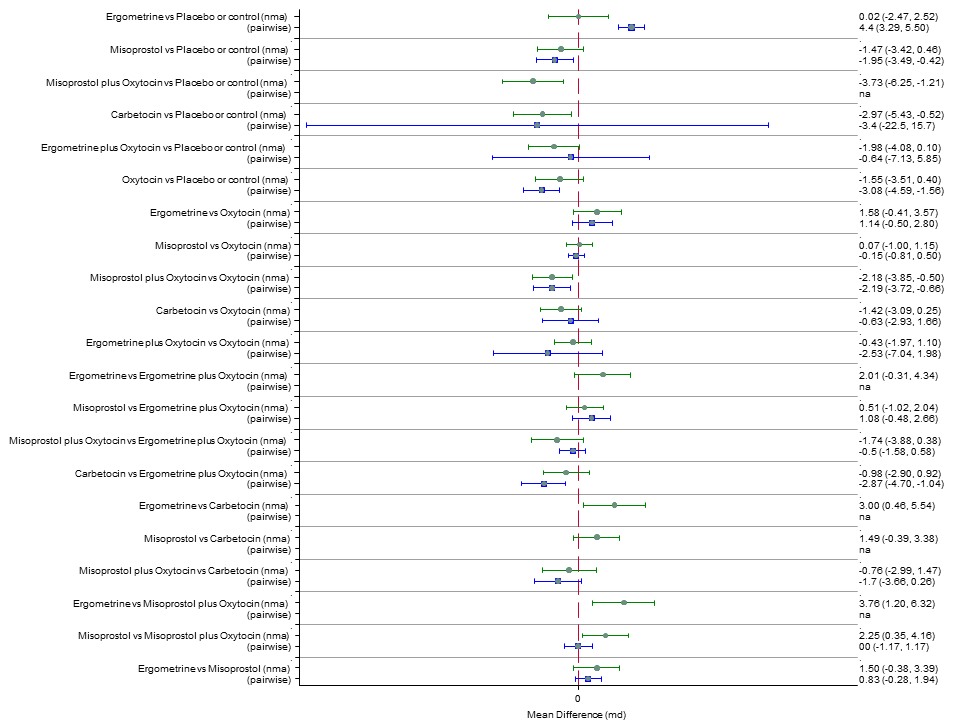
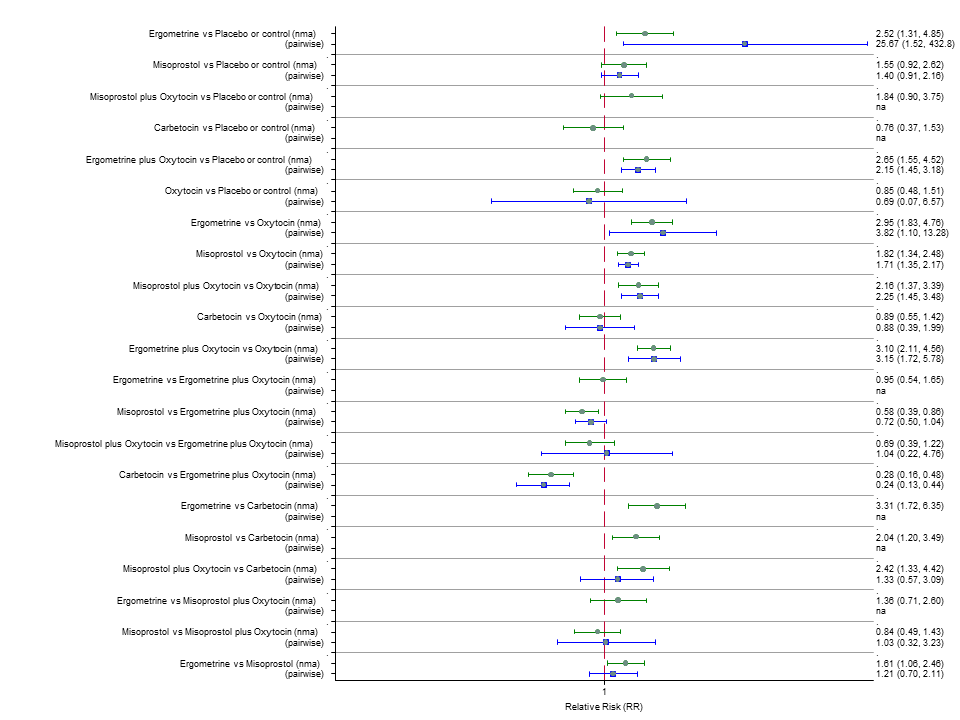
RR 0.69 (0.57 to 0.83) (NMA)

RR 0.72 (0.56 to 0.92) (Pairwise)

RR 0.72 (0.52 to 1.00) (NMA)

RR 0.69 (0.45 to 1.07) (Pairwise)

RR 0.73 (0.60 to 0.90) (NMA)

RR 0.74 (0.62 to 0.88) (Pairwise)

1

⊕⊕⊕⊝ moderate confidence in estimate due to inconsistency based on 10 studies (13,138 women, I2=57.4%)

⊕⊝⊝⊝ very low confidence in estimate due to risk of bias, imprecision and inconsistency based on 8 studies (917 women, I2 = 49.9%)

⊕⊕⊕⊝ moderate confidence in estimate due to inconsistency based on 12 studies (9651 women, I2 = 60.5%)
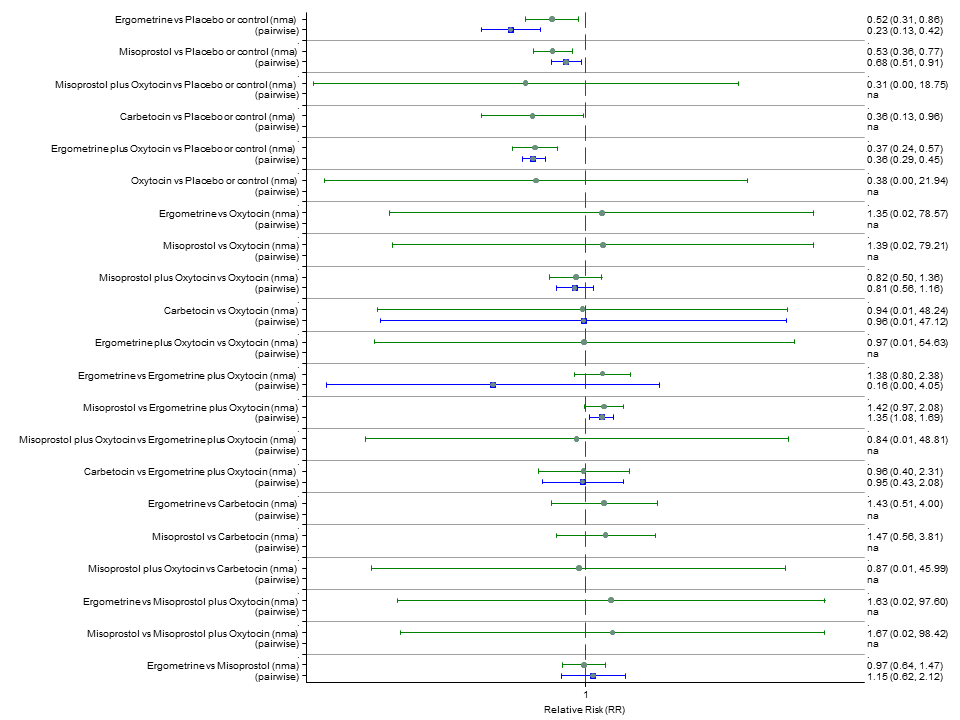
PPH ≥1000 mL

2.8% (2.2 to 3.4) for vaginal births

10.7% (8.5 to 13.2) for caesareans

2.5% (1.4 to 4.6) for vaginal births

9.7% (5.3 to 17.8) for caesareans

3.2% (2.6 to 4.1) for vaginal births

12.5% (10 to 15.8) for caesareans

3.6% (3.4 to 3.9) for vaginal births

13.9% (11.7 to 16.6) for caesareans

There was no evidence of global inconsistency (P = 0.345) in this analysis.

RR 0.77 (0.61 to 0.95) (NMA)

RR 0.73 (0.57 to 0.93) (Pairwise)

RR 0.70 (0.38 to 1.28) (NMA)

RR 0.71 (0.38 to 1.35) (Pairwise)

RR 0.90 (0.72 to 1.14) (NMA)

RR 0.89 (0.71 to 1.12) (Pairwise)

1

⊕⊕⊕⊕ high confidence in estimate based on 9 studies (13,038 women, I2 = 0%)

⊕⊕⊝⊝ low confidence in estimate due to risk of bias and imprecision based on 7 studies (1026 women, I2 = 0%)

⊕⊕⊕⊝ moderate confidence in estimate due to imprecision based on 14 studies (9897 women, I2 = 0%)
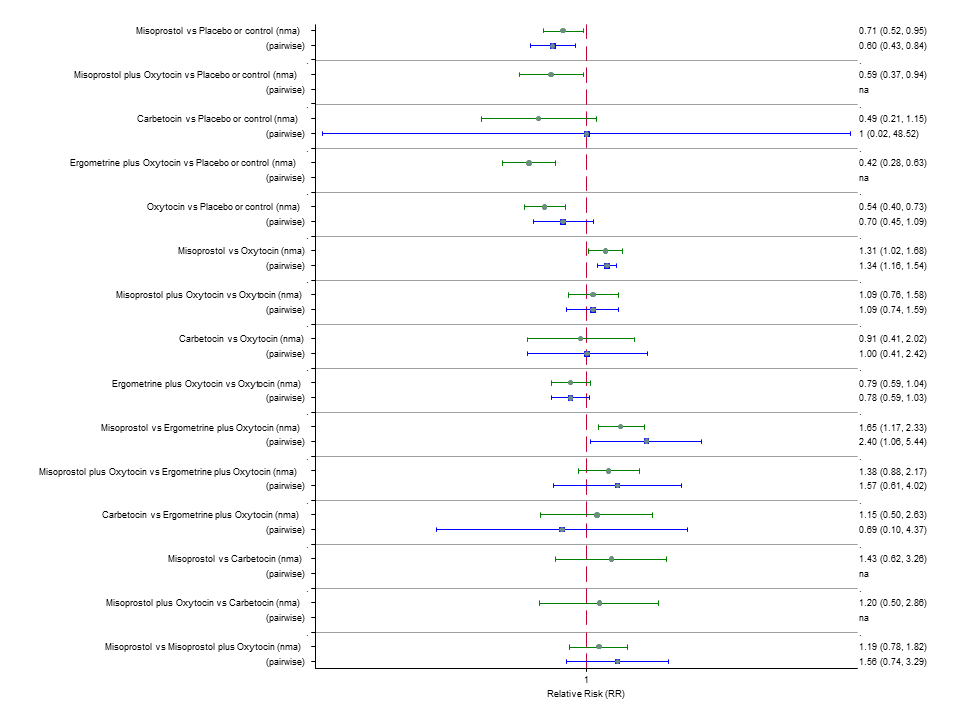
Vomiting

1.9% (1.3 to 2.7) for vaginal births

16.1% (11 to 23.7) for caesareans

0.5% (0.3 to 0.9) for vaginal births

4.6% (2.9 to 7.4) for caesareans

1.3% (0.8 to 2) for vaginal births

11.2% (7.1 to 17.6) for caesareans

0.6% (0.5 to 0.6) for vaginal births

5.2% (4.9 to 5.5) for caesareans

There was no evidence of global inconsistency (P = 0.06) in this analysis.

RR 3.10 (2.11 to 4.56) (NMA)

RR 3.15 (1.72 to 5.78) (Pairwise)

RR 0.89 (0.55 to 1.42) (NMA)

RR 0.88 (0.39 to 1.99) (Pairwise)

RR 2.16 (1.37 to 3.39) (NMA)

RR 2.25 (1.45 to 3.48) (Pairwise)

1

⊕⊕⊕⊕ high confidence in estimate based on 8 studies (9811 women, I2 = 48.1%)

⊕⊝⊝⊝ very low confidence in estimate due to risk of bias, inconsistency and imprecision based on 10 studies (1939 women, I2 = 59.2%)

⊕⊕⊕⊕ high confidence in estimate due to imprecision based on 9 studies (5015 women, I2 = 30.1%)

Hypertension

1.2% (0.4 to 4) for vaginal births

29.6% ( to ) for caesareans

0.6% (0.1 to 3.3) for vaginal births

14.2% (2.5 to 79.7) for caesareans

Risks not available as no studies report this outcome

0.7% (0.7 to 0.8) for vaginal births

16.7% (11.2 to 24.9) for caesareans

There was no evidence of global inconsistency (P = 0.481) in this analysis.

RR 1.77 (0.55 to 5.66) (NMA)

RR 0.95 (0.10 to 8.38) (Pairwise)

RR 0.85 (0.15 to 4.77) (NMA)

RR not available as no studies reported this outcome

1

⊕⊕⊝⊝ low confidence in estimate due to inconsistency and imprecision based on 2 studies (1039 women, I2 = 73.2%)

⊕⊕⊝⊝ low confidence in estimate due to imprecision and based only on indirect evidence

Quality of the evidence cannot be assessed as no studies report this outcome
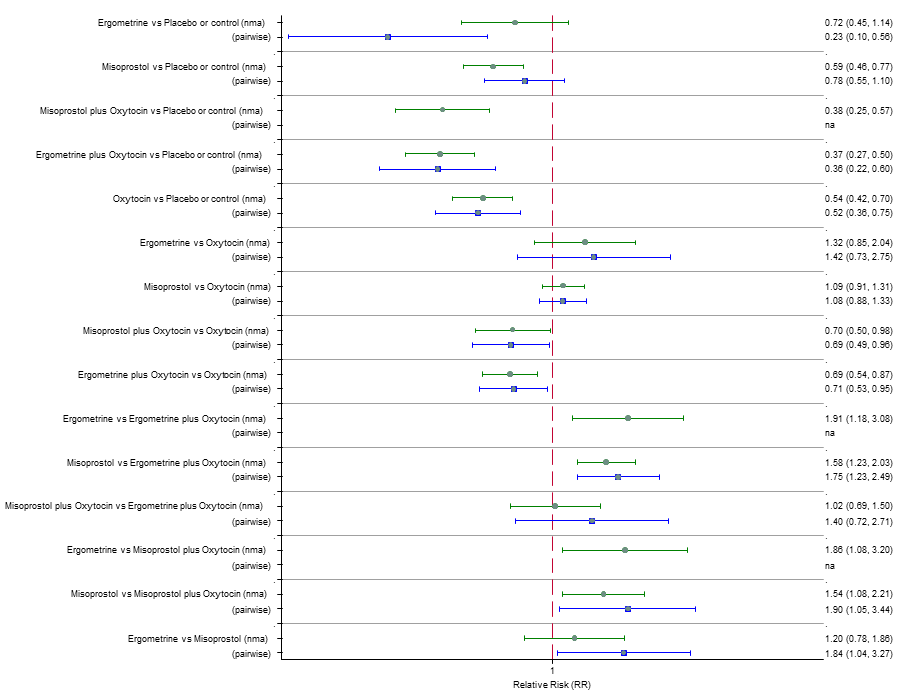
Fever

3% (1.5 to 6) for vaginal births

11.7% (6.5 to 23.2) for caesareans

3.1% (0.8 to 12.1) for vaginal births

12% (3.1 to 46.6) for caesareans

11.4% (8 to 16.4) for vaginal births

44.2% (30.9 to 63.2) for caesareans

3.6% (3.4 to 3.9) for vaginal births

13.9% (11.7 to 16.6) for caesareans

There was no evidence of global inconsistency (P = 0.352) in this analysis.

RR 0.84 (0.42 to 1.67) (NMA)

RR 1.07 (0.47 to 2.43) (Pairwise)

RR 0.86 (0.22 to 3.35) (NMA)

RR 2.11 (0.18 to 24.40) (Pairwise)

RR 3.18 (2.22 to 4.55) (NMA)

RR 2.96 (1.95 to 4.51) (Pairwise)

1

⊕⊕⊕⊝ moderate confidence in estimate due to imprecision based on 2 studies (1591 women, I2 = 0%)

⊕⊝⊝⊝ very low confidence in estimate due to risk of bias, inconsistency and imprecision based on 3 studies (292 women, I2 = 40.9%)

⊕⊕⊕⊝ moderate confidence in estimate due to inconsistency based on 15 studies (8209 women, I2 = 77.8%)

*The risks in the ergometrine plus oxytocin, carbetocin, misoprostol plus oxytocin groups (and their 95% confidence interval) are based on the assumed risk in the oxytocin group and the relative effects of the interventions (and its 95% CI).

**The risk in the oxytocin group (and its 95% confidence interval) is based on a meta‐analysis of proportions from the studies included in this review for this group.
RR: Risk ratio

GRADE Working Group grades of evidence

High quality:

We are very confident that the true effect lies close to that of the estimate of the effect
Moderate quality: We are moderately confident in the effect estimate: The true effect is likely to be close to the estimate of the effect, but there is a possibility that it is substantially different
Low quality: Our confidence in the effect estimate is limited: The true effect may be substantially different from the estimate of the effect
Very low quality: We have very little confidence in the effect estimate: The true effect is likely to be substantially different from the estimate of effect

Figuras y tablas -