| Back School compared with no treatment for low back pain |
| Patient or population: people with low back pain Intervention: Back School Comparison: no treatment |
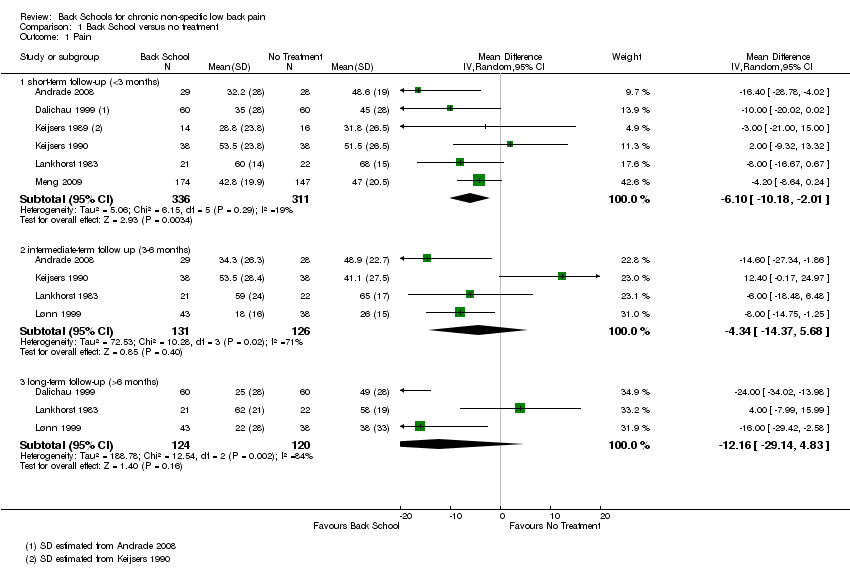
| Pain: short‐term follow‐up (< 3 months) Multiple scales: scale from 0 to 100
(worse pain) | The mean pain at short‐term follow‐up ranged across control groups from 31.8 to 68 points. | The mean pain (short term) in the intervention groups was 6.10 lower (10.18 lower to 2.01 lower). | MD ‐6.10 (‐10.18 to ‐2.01) | 647 participants (6 studies) | ⊕⊝⊝⊝
very low2,3,4 |
| Pain: intermediate‐term follow‐up (3 to 6 months) Multiple scales: scale from 0 to 100
(worse pain) | The mean pain at intermediate‐term follow‐up ranged across control groups from 26 to 65 points. | The mean pain (intermediate term) in the intervention groups was 4.34 lower (14.37 lower to 5.68 higher). | MD ‐4.34 (‐14.37 to 5.68) | 257 participants (4 studies) | ⊕⊝⊝⊝
very low1,2,4 |
| Pain: long‐term follow‐up (> 6 months) Multiple scales: scale from 0 to 100
(worse pain) | The mean pain at long‐term follow‐up ranged across control groups from 38 to 58 points. | The mean pain (long term) in the intervention groups was 12.16 lower (29.14 lower to 4.83 higher). | MD ‐12.16 (‐29.14 to 4.38) | 244 participants (3 studies) | ⊝⊝⊝⊝
very low1,2,3,4 |
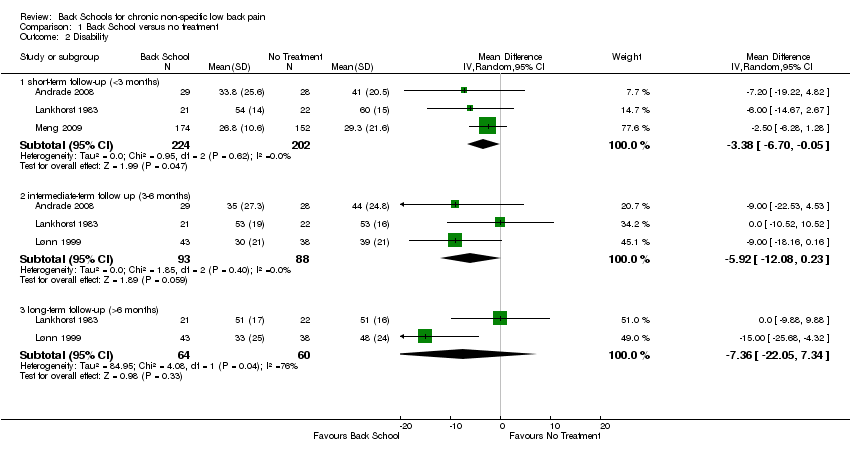
| Disability: short‐term follow‐up (< 3 months) Multiple scales: scale from 0 to 100 (worse disability) | The mean disability at short‐term follow‐up ranged across control groups from 29.3 to 60 points. | The mean disability (short term) in the intervention groups was 3.83 lower (6.70 lower to 0.05 lower). | MD ‐3.38 (‐6.70 to ‐0.05) | 426 participants (3 studies) | ⊕⊝⊝⊝
very low2,3,4 |
| Disability: intermediate‐term follow‐up (3 to 6 months) Multiple scales: scale from 0 to 100 (worse disability) | The mean disability at intermediate‐term follow‐up ranged across control groups from 39 to 53 points. | The mean disability (intermediate term) in the intervention groups was 5.92 lower (12.80 lower to 0.23 higher). | MD ‐5.92 (‐12.08 to 0.23) | 181 participants (3 studies) | ⊕⊝⊝⊝
very low1,2,4 |
| Disability: long‐term follow‐up (> 6 months) Multiple scales: scale from 0 to 100 (worse disability) | The mean disability long‐term follow‐up ranged across control groups from 48 to 51 points. | The mean disability (long term) in the intervention
groups was 7.36 lower (22.05 lower to 7.34 higher). | MD ‐7.36 (‐22.05 to 7.34) | 124 participants (2 studies) | ⊕⊝⊝⊝
very low1,2,4 |
| Adverse events Not reported |
| Work status Not reported |
| The corresponding risk (and its 95% confidence interval) is based on the assumed risk in the comparison group and the relative effect of the intervention (and its 95% CI). CI: confidence interval; MD: mean difference |
| GRADE Working Group grades of evidence High‐quality evidence: There are consistent findings among at least 75% of randomised controlled trials with low risk of bias; consistent, direct, and precise data; and no known or suspected publication biases. Further research is unlikely to change either the estimate or our confidence in the results. Moderate‐quality evidence: Further research is likely to have an important impact on our confidence in the estimate of effect and may change the estimate.
Low‐quality evidence: Further research is very likely to have an important impact on our confidence in the estimate of effect and is likely to change the estimate.
Very low‐quality evidence: We are very uncertain about the results.
No evidence: We identified no randomised controlled trials that addressed this outcome. |