Etrolizumab para la inducción de la remisión en la colitis ulcerosa
Información
- DOI:
- https://doi.org/10.1002/14651858.CD011661.pub2Copiar DOI

- Base de datos:
-
- Cochrane Database of Systematic Reviews
- Versión publicada:
-
- 02 diciembre 2015see what's new
- Tipo:
-
- Intervention
- Etapa:
-
- Review
- Grupo Editorial Cochrane:
-
Grupo Cochrane de Salud digestiva
- Copyright:
-
- Copyright © 2015 The Cochrane Collaboration. Published by John Wiley & Sons, Ltd.
Cifras del artículo
Altmetric:
Citado por:
Autores
Contributions of authors
Greg Rosenfeld contributed to planning the study and manuscript preparation.
Claire Parker contributed to planning the study, identification of relevant studies, assessment of methodological quality, data extraction, data analysis and manuscript preparation.
John MacDonald contributed to planning the study, identification of relevant studies, assessment of methodological quality, data extraction, data analysis, and manuscript preparation.
Brian Bressler contributed to planning the study and manuscript preparation.
Declarations of interest
Dr Bressler participated as a co‐investigator in Rutgeerts 2013.
Greg Rosenfeld has received fees from Abbvie, Janssen and Shire for lectures; and fees from Abbvie for development of educational presentations. All of the fees received are outside the scope of the submitted work. Dr Rosenfeld is a sub‐investigator for a Phase III clinical trial investigating etrolizumab for Crohn's disease and ulcerative colitis.
Claire Parker has no known conflicts to declare.
John MacDonald has no known conflicts to declare.
Brian Bressler has received fee(s) from Janssen, Abbvie, Celltrion, and Takeda for consultancy; has grants/grants pending from Janssen; payment for lectures from Takeda, Ferring, Actavis, Janssen, Abbvie, and Shire; stock/stock options with Qu Biologics and travel expenses from Janssen, and Abbvie. All of these activities are outside the submitted work.
Acknowledgements
Funding for the IBD/FBD Review Group (September 1, 2010 ‐ August 31, 2015) has been provided by the Canadian Institutes of Health Research (CIHR) Knowledge Translation Branch (CON‐ 105529) and the CIHR Institutes of Nutrition, Metabolism and Diabetes (INMD); and Infection and Immunity (III) and the Ontario Ministry ofHealth and Long Term Care (HLTC3968FL‐ 2010‐2235).
Miss Ila Stewart has provided support for the IBD/FBD Review Group through the Olive Stewart Fund.
Version history
| Published | Title | Stage | Authors | Version |
| 2015 Dec 02 | Etrolizumab for induction of remission in ulcerative colitis | Review | Greg Rosenfeld, Claire E Parker, John K MacDonald, Brian Bressler | |
| 2015 Apr 19 | Etrolizumab for induction of remission in ulcerative colitis | Protocol | Greg Rosenfeld, Brian Bressler, Claire E Parker, John K MacDonald, Daniel C Baumgart, Séverine Vermeire, Brian G Feagan | |
Keywords
MeSH
Medical Subject Headings (MeSH) Keywords
Medical Subject Headings Check Words
Humans;
PICO

Study flow diagram.
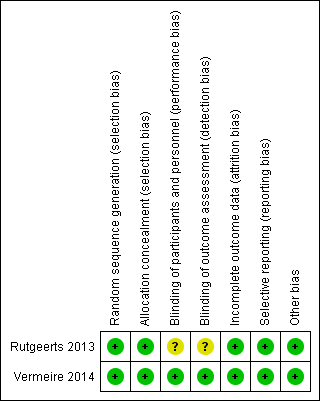
Risk of bias summary: review authors' judgements about each risk of bias item for each included study.

Comparison 1 Etrolizumab versus placebo, Outcome 1 Failure to enter clinical remission at week 6.
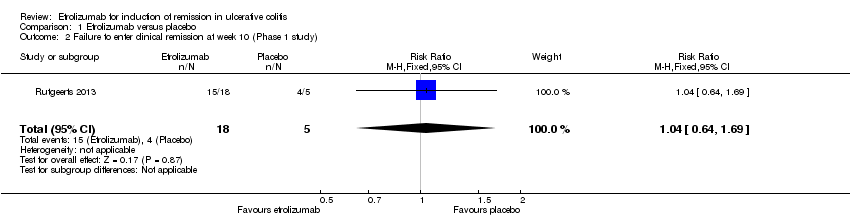
Comparison 1 Etrolizumab versus placebo, Outcome 2 Failure to enter clinical remission at week 10 (Phase 1 study).
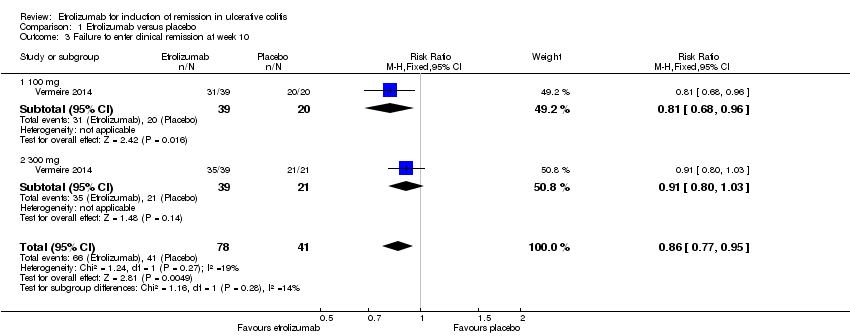
Comparison 1 Etrolizumab versus placebo, Outcome 3 Failure to enter clinical remission at week 10.
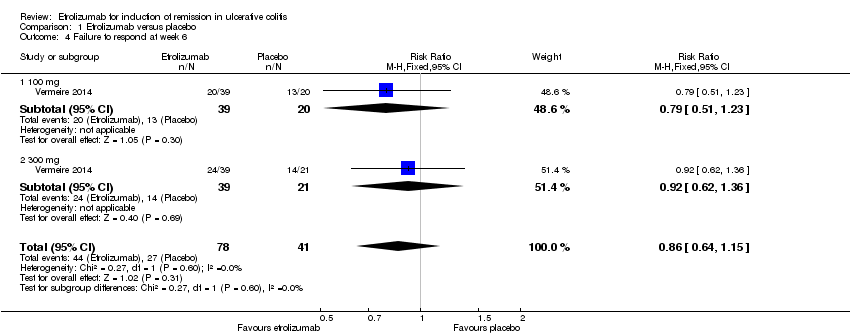
Comparison 1 Etrolizumab versus placebo, Outcome 4 Failure to respond at week 6.

Comparison 1 Etrolizumab versus placebo, Outcome 5 Failure to respond at week 10 (Phase 1 study).

Comparison 1 Etrolizumab versus placebo, Outcome 6 Failure to respond at week 10.
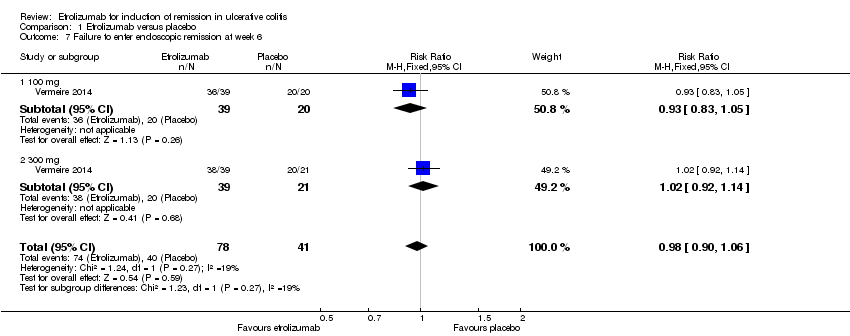
Comparison 1 Etrolizumab versus placebo, Outcome 7 Failure to enter endoscopic remission at week 6.
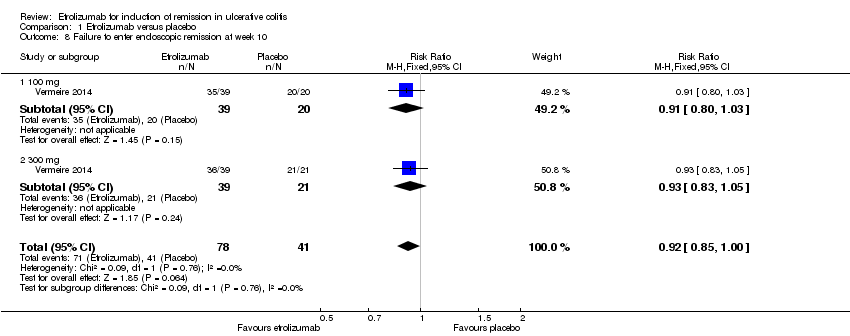
Comparison 1 Etrolizumab versus placebo, Outcome 8 Failure to enter endoscopic remission at week 10.

Comparison 1 Etrolizumab versus placebo, Outcome 9 Adverse events.
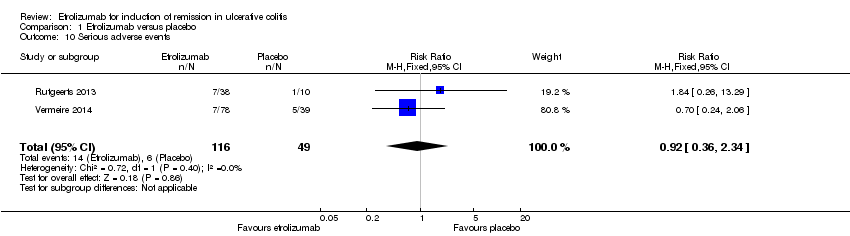
Comparison 1 Etrolizumab versus placebo, Outcome 10 Serious adverse events.

Comparison 1 Etrolizumab versus placebo, Outcome 11 Withdrawal due to adverse events.
| Etrolizumab versus placebo for induction of remission in ulcerative colitis | ||||||
| Patient or population: patients with induction of remission in ulcerative colitis | ||||||
| Outcomes | Illustrative comparative risks* (95% CI) | Relative effect | No of Participants | Quality of the evidence | Comments | |
| Assumed risk | Corresponding risk | |||||
| Control | Etrolizumab versus placebo | |||||
| Failure to enter clinical remission at week 10 | 1000 per 10001 | 860 per 1000 | RR 0.86 | 119 | ⊕⊕⊕⊝ | |
| Failure to enter clinical remission at week 10 ‐ 100 mg | 1000 per 10001 | 810 per 1000 | RR 0.81 | 59 | ⊕⊕⊕⊝ | |
| Failure to respond at week 10 | 707 per 10001 | 679 per 1000 | RR 0.96 | 119 | ⊕⊕⊕⊝ | |
| Failure to enter endoscopic remission at week 6 | 976 per 10001 | 956 per 1000 | RR 0.98 | 119 | ⊕⊕⊕⊝ | |
| Failure to enter endoscopic remission at week 10 | 1000 per 10001 | 920 per 1000 | RR 0.92 | 119 | ⊕⊕⊕⊝ | |
| Adverse events | 721 per 10001 | 541 per 1000 | RR 0.75 | 124 | ⊕⊕⊕⊝ | |
| Serious adverse events | 122 per 10001 | 113 per 1000 | RR 0.92 | 165 | ⊕⊕⊝⊝ | |
| *The basis for the assumed risk (e.g. the median control group risk across studies) is provided in footnotes. The corresponding risk (and its 95% confidence interval) is based on the assumed risk in the comparison group and the relative effect of the intervention (and its 95% CI). | ||||||
| GRADE Working Group grades of evidence | ||||||
| 1 Control group risk estimates come from control arm of meta‐analysis, based on included trials. 2 Downgraded one level due to sparse data (107 events). 3 Downgraded one level due to sparse data (51 events). 4 Downgraded one level due to sparse data (82 events). 5 Downgraded one level due to sparse data (114 events). 6 Downgraded one level due to sparse data (112 events). 7Downgraded one level due to sparse data (75 events). 8 Downgraded two levels due to very sparse data (20 events). | ||||||
| Outcome or subgroup title | No. of studies | No. of participants | Statistical method | Effect size |
| 1 Failure to enter clinical remission at week 6 Show forest plot | 1 | 119 | Risk Ratio (M‐H, Fixed, 95% CI) | 0.96 [0.87, 1.06] |
| 1.1 100 mg | 1 | 59 | Risk Ratio (M‐H, Fixed, 95% CI) | 0.94 [0.82, 1.09] |
| 1.2 300 mg | 1 | 60 | Risk Ratio (M‐H, Fixed, 95% CI) | 0.97 [0.85, 1.11] |
| 2 Failure to enter clinical remission at week 10 (Phase 1 study) Show forest plot | 1 | 23 | Risk Ratio (M‐H, Fixed, 95% CI) | 1.04 [0.64, 1.69] |
| 3 Failure to enter clinical remission at week 10 Show forest plot | 1 | 119 | Risk Ratio (M‐H, Fixed, 95% CI) | 0.86 [0.77, 0.95] |
| 3.1 100 mg | 1 | 59 | Risk Ratio (M‐H, Fixed, 95% CI) | 0.81 [0.68, 0.96] |
| 3.2 300 mg | 1 | 60 | Risk Ratio (M‐H, Fixed, 95% CI) | 0.91 [0.80, 1.03] |
| 4 Failure to respond at week 6 Show forest plot | 1 | 119 | Risk Ratio (M‐H, Fixed, 95% CI) | 0.86 [0.64, 1.15] |
| 4.1 100 mg | 1 | 59 | Risk Ratio (M‐H, Fixed, 95% CI) | 0.79 [0.51, 1.23] |
| 4.2 300 mg | 1 | 60 | Risk Ratio (M‐H, Fixed, 95% CI) | 0.92 [0.62, 1.36] |
| 5 Failure to respond at week 10 (Phase 1 study) Show forest plot | 1 | 23 | Risk Ratio (M‐H, Fixed, 95% CI) | 1.67 [0.26, 10.82] |
| 6 Failure to respond at week 10 Show forest plot | 1 | 119 | Risk Ratio (M‐H, Fixed, 95% CI) | 0.96 [0.75, 1.23] |
| 6.1 100 mg | 1 | 59 | Risk Ratio (M‐H, Fixed, 95% CI) | 0.95 [0.66, 1.37] |
| 6.2 300 mg | 1 | 60 | Risk Ratio (M‐H, Fixed, 95% CI) | 0.97 [0.69, 1.36] |
| 7 Failure to enter endoscopic remission at week 6 Show forest plot | 1 | 119 | Risk Ratio (M‐H, Fixed, 95% CI) | 0.98 [0.90, 1.06] |
| 7.1 100 mg | 1 | 59 | Risk Ratio (M‐H, Fixed, 95% CI) | 0.93 [0.83, 1.05] |
| 7.2 300 mg | 1 | 60 | Risk Ratio (M‐H, Fixed, 95% CI) | 1.02 [0.92, 1.14] |
| 8 Failure to enter endoscopic remission at week 10 Show forest plot | 1 | 119 | Risk Ratio (M‐H, Fixed, 95% CI) | 0.92 [0.85, 1.00] |
| 8.1 100 mg | 1 | 59 | Risk Ratio (M‐H, Fixed, 95% CI) | 0.91 [0.80, 1.03] |
| 8.2 300 mg | 1 | 60 | Risk Ratio (M‐H, Fixed, 95% CI) | 0.93 [0.83, 1.05] |
| 9 Adverse events Show forest plot | 2 | Risk Ratio (M‐H, Fixed, 95% CI) | Totals not selected | |
| 10 Serious adverse events Show forest plot | 2 | 165 | Risk Ratio (M‐H, Fixed, 95% CI) | 0.92 [0.36, 2.34] |
| 11 Withdrawal due to adverse events Show forest plot | 2 | 165 | Risk Ratio (M‐H, Fixed, 95% CI) | 1.09 [0.26, 4.62] |