Scolaris Content Display Scolaris Content Display

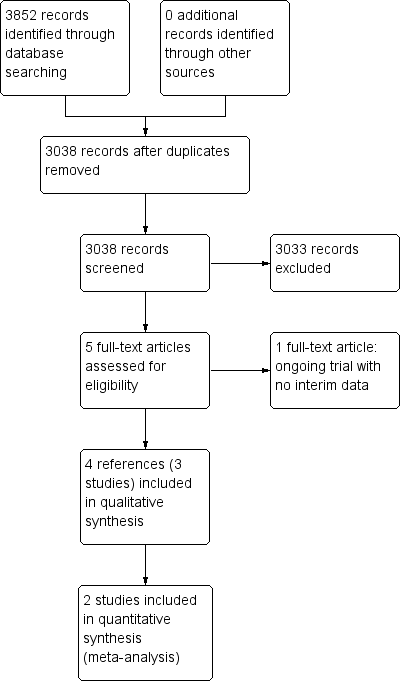
Study flow diagram.
Figuras y tablas -
Figure 1

Study flow diagram.

Risk of bias graph: review authors' judgements about each risk of bias item presented as percentages across all included studies.
Figuras y tablas -
Figure 2

Risk of bias graph: review authors' judgements about each risk of bias item presented as percentages across all included studies.

Risk of bias summary: review authors' judgements about each risk of bias item for each included study.
Figuras y tablas -
Figure 3

Risk of bias summary: review authors' judgements about each risk of bias item for each included study.

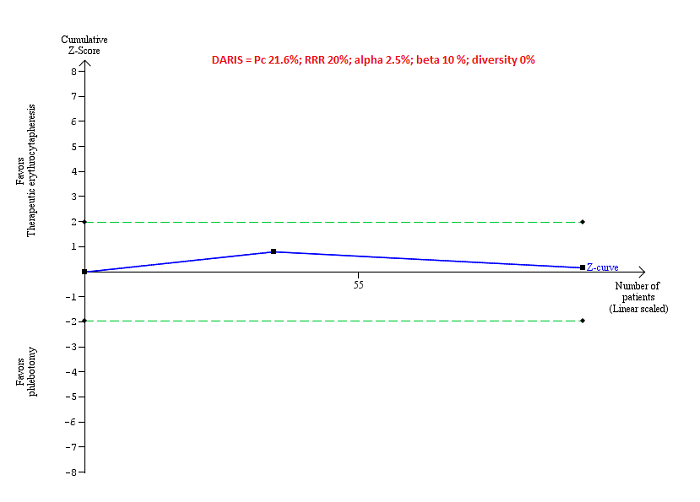
Trial Sequential Analysis of adverse events (proportion) performed using an alpha error of 2.5%, power of 90% (beta error of 10%), relative risk reduction of 20%, control group proportion (Pc) observed in trials (21.6% for proportion of people with adverse events), and observed diversity (0%) shows that the accrued sample size was only a small fraction of the diversity‐adjusted required information size (DARIS) that the boundaries could not be drawn. The Z‐curve (blue line) does not cross the conventional boundaries (dotted green line). There was a high risk of random errors.
Figuras y tablas -
Figure 4

Trial Sequential Analysis of adverse events (proportion) performed using an alpha error of 2.5%, power of 90% (beta error of 10%), relative risk reduction of 20%, control group proportion (Pc) observed in trials (21.6% for proportion of people with adverse events), and observed diversity (0%) shows that the accrued sample size was only a small fraction of the diversity‐adjusted required information size (DARIS) that the boundaries could not be drawn. The Z‐curve (blue line) does not cross the conventional boundaries (dotted green line). There was a high risk of random errors.

Comparison 1 Therapeutic erythrocytapheresis versus phlebotomy, Outcome 1 Adverse events (proportion).
Figuras y tablas -
Analysis 1.1

Comparison 1 Therapeutic erythrocytapheresis versus phlebotomy, Outcome 1 Adverse events (proportion).

Comparison 1 Therapeutic erythrocytapheresis versus phlebotomy, Outcome 2 Adverse events (number).
Figuras y tablas -
Analysis 1.2

Comparison 1 Therapeutic erythrocytapheresis versus phlebotomy, Outcome 2 Adverse events (number).

Comparison 1 Therapeutic erythrocytapheresis versus phlebotomy, Outcome 3 Health‐related quality of life (EQ‐VAS).
Figuras y tablas -
Analysis 1.3

Comparison 1 Therapeutic erythrocytapheresis versus phlebotomy, Outcome 3 Health‐related quality of life (EQ‐VAS).

Summary of findings for the main comparison. Erythrocytapheresis versus phlebotomy for hereditary haemochromatosis

Erythrocytapheresis versus phlebotomy for hereditary haemochromatosis

Patient or population: people with hereditary haemochromatosis
Settings: secondary or tertiary
Intervention: erythrocytapheresis
Comparison: phlebotomy

Outcomes

Illustrative comparative risks* (95% CI)

Relative effect
(95% CI)

No of participants
(studies)

Quality of the evidence
(GRADE)

Assumed risk

Corresponding risk

Phlebotomy

Therapeutic erythrocytapheresis

Long‐term mortality

None of the included trials reported mortality beyond 1 year.

Mortality

Follow‐up period: 8 months

There was no mortality in either group in the short‐term in the 1 trial that reported this information.

38
(1 study)

⊕⊝⊝⊝
Very low1,2

Serious adverse events

Follow‐up period: 8 months

There were no serious adverse events in either group in the 1 trial that reported this information.

38
(1 study)

⊕⊝⊝⊝
Very low1,2

Health‐related quality of life
EQ‐VAS. Scale from: 0 to 100.

Follow‐up period: 8 months

The mean health‐related quality of life in the control groups was
68

The mean health‐related quality of life in the intervention groups was
1 higher
(10.8 lower to 12.8 higher)

38
(1 study)

⊕⊝⊝⊝
Very low1,2

Health‐related quality of life beyond one year

None of the included trials reported health‐related quality of life beyond one year

*The basis for the assumed risk is the mean control group proportion or control event rate. The corresponding risk (and its 95% confidence interval) is based on the assumed risk in the comparison group and the relative effect of the intervention (and its 95% CI).
CI: confidence interval.

GRADE Working Group grades of evidence
High quality: further research is very unlikely to change our confidence in the estimate of effect.
Moderate quality: further research is likely to have an important impact on our confidence in the estimate of effect and may change the estimate.
Low quality: further research is very likely to have an important impact on our confidence in the estimate of effect and is likely to change the estimate.
Very low quality: we are very uncertain about the estimate.

1 Downgraded one level for risk of bias.
2 Downgraded two levels for imprecision (one level for small sample size and one level for wide confidence intervals).

Figuras y tablas -
Summary of findings for the main comparison. Erythrocytapheresis versus phlebotomy for hereditary haemochromatosis
Comparison 1. Therapeutic erythrocytapheresis versus phlebotomy

Outcome or subgroup title

No. of studies

No. of participants

Statistical method

Effect size

1 Adverse events (proportion) Show forest plot

2

100

Odds Ratio (M‐H, Fixed, 95% CI)

0.93 [0.36, 2.43]

2 Adverse events (number) Show forest plot

1

Rate Ratio (Fixed, 95% CI)

Totals not selected

3 Health‐related quality of life (EQ‐VAS) Show forest plot

1

Mean Difference (IV, Fixed, 95% CI)

Totals not selected

Figuras y tablas -
Comparison 1. Therapeutic erythrocytapheresis versus phlebotomy