Interventions for hereditary haemochromatosis
Abstract
Background
Hereditary haemochromatosis is a genetic disorder related to proteins involved in iron transport, resulting in iron load and deposition of iron in various tissues of the body. This iron overload leads to complications including liver cirrhosis (and related complications such as liver failure and hepatocellular carcinoma), cardiac failure, cardiac arrhythmias, impotence, diabetes, arthritis, and skin pigmentation. Phlebotomy (venesection or 'blood letting') is the currently recommended treatment for hereditary haemochromatosis. The optimal treatment of hereditary haemochromatosis remains controversial.
Objectives
To assess the comparative benefits and harms of different interventions in the treatment of hereditary haemochromatosis through a network meta‐analysis and to generate rankings of the available treatments according to their safety and efficacy. However, we found only one comparison. Therefore, we did not perform the network meta‐analysis and we assessed the comparative benefits and harms of different interventions using standard Cochrane methodology.
Search methods
We searched the Cochrane Central Register of Controlled Trials (CENTRAL), MEDLINE, Embase, Science Citation Index Expanded, World Health Organization International Clinical Trials Registry Platform, and randomised clinical trials registers to March 2016 to identify randomised clinical trials on treatments for hereditary haemochromatosis.
Selection criteria
We included only randomised clinical trials (irrespective of language, blinding, or publication status) in participants with hereditary haemochromatosis. We excluded trials which included participants who had previously undergone liver transplantation. We considered any of the various interventions compared with each other or with inactive treatment.
Data collection and analysis
We used standard methodological procedures expected by Cochrane. We calculated the odds ratio (OR) and rate ratio with 95% confidence intervals (CI) using both fixed‐effect and random‐effects models with RevMan 5 based on available‐participant analysis. We assessed risk of bias according to Cochrane, controlled risk of random errors with Trial Sequential Analysis, and assessed the quality of the evidence using GRADE.
Main results
Three trials with 146 participants met the inclusion criteria of this review. Two parallel group trials with 100 participants provided information on one or more outcomes. The remaining trial was a cross‐over trial, with no usable data for analysis. All the trials were at high risk of bias. Overall, all the evidence was of very low quality. All three trials compared erythrocytapheresis (removal of red cells only, instead of whole blood) versus phlebotomy. Two of the trials shared the same first author. The mean or median age in the three trials ranged from 42 to 55 years. None of the trials reported whether the included participants were symptomatic or asymptomatic or a mixture of both. Two trials were conducted in people who were haemochromatosis treatment‐naive. The trial that provided most data for this review excluded people with malignancy, heart failure, and serious cardiac arrhythmias. We found no trials assessing iron‐chelating agents.
Only one of the trials with 38 participants reported no short‐term mortality and no serious adverse events at the end of the short‐term follow‐up (eight months). Two trials reported the proportion of people with adverse events: 10/49 (20.4%) in the erythrocytapheresis group versus 11/51 (21.6%) in the phlebotomy group. One of these two trials provided data on adverse event rates (42.1 events per 100 participants with erythrocytapheresis versus 52.6 events per 100 participants with phlebotomy). There was no evidence of differences in the proportion of people with adverse events and the number of adverse events (serious and non‐serious) between the groups (proportion of people with adverse events: OR 0.93, 95% CI 0.36 to 2.43; participants = 100; trials = 2; number of adverse events: rate ratio 0.80, 95% CI 0.32 to 2.03; participants = 38; trial = 1). There was no difference between the groups regarding short‐term health‐related quality of life (mean difference (MD) 1.00, 95% CI ‐10.80 to 12.80; participants = 38; trials = 1). This outcome was measured using EQ‐VAS (range: 0 to 100 where a higher score indicates better health‐related quality of life). None of the trials reported mortality beyond one year, health‐related quality of life beyond one year, liver transplantation, decompensated liver disease, cirrhosis, hepatocellular carcinoma, diabetes, or cardiovascular complications during the long‐term follow‐up.
The two trials that provided data for this review were funded by parties with no vested interest in the results; the source of funding of the third trial was not reported.
Authors' conclusions
There is currently insufficient evidence to determine whether erythrocytapheresis is beneficial or harmful compared with phlebotomy. Phlebotomy has less equipment requirements and remains the treatment of choice in people with hereditary haemochromatosis who require blood letting in some form. However, it should be noted that there is no evidence from randomised clinical trials that blood letting in any form is beneficial in people with hereditary haemochromatosis. Having said this, a trial including no treatment is unlikely to be conducted. Future trials should compare different frequencies of phlebotomy and erythrocytapheresis versus phlebotomy with and without different iron‐chelating agents compared with each other, and with placebo. Such trials should include long‐term follow‐up of participants (e.g. using national record linkage databases) to determine whether treatments are beneficial or harmful in terms of clinical outcomes such as deaths, health‐related quality of life, liver damage and its consequences, heart damage and its consequences, and other outcomes that are of importance to people with hereditary haemochromatosis.
PICO
Plain language summary
Treatments for hereditary haemochromatosis
Background
Hereditary haemochromatosis is an inherited genetic disorder (derived from one's parents) resulting in excessive iron accumulation in the body. Some people develop liver damage leading to liver failure, heart damage leading to heart failure, impotence (inability for a man to have an erection or orgasm), diabetes, arthritis (joint pain and swelling), and skin pigmentation (colouring) because of excessive iron accumulation. Several treatments are used to treat hereditary haemochromatosis but the best way is not clear. We searched for randomised clinical trials (well‐design clinical studies where people are randomly put into one of two or more treatment groups) reported to March 2016. We included trials in which participants had not had a liver transplant. Apart from using standard Cochrane methods which allow comparison of only two treatments at a time (direct comparison), we planned to use an advanced method which allows comparison of the many different treatments which are individually compared in the trials (network meta‐analysis). However, because there was only one comparison, we used standard Cochrane methodology.
Study characteristics
We identified three trials. Two trials with 100 participants provided information on one or more outcomes (measures of how well the treatments worked). The trials compared phlebotomy (removal of blood or 'blood letting') versus erythrocytapheresis (removal of blood, separation of red cells (which carry oxygen in the blood), and return of the remaining parts of the blood). Two trials were conducted in people who had not undergone previous treatment for haemochromatosis. The trial that provided most data for this review excluded people with cancer, heart failure, and serious irregular heartbeats.
Source of funding: the two trials that provided data for this review were funded by parties with no vested interest in the results; the source of funding of the third trial was not reported.
Key results
There were no deaths or serious complications in the short term in either group in the only trial that reported this information. There was no evidence of any difference in the percentage of people with any complications, the number of complications per person, and short‐term health‐related quality of life (a measure of a person's satisfaction with their life and health) between the treatments. None of the trials reported deaths beyond one year, health‐related quality of life beyond one year, liver transplantation, severe liver damage, liver failure, liver cancer, diabetes, heart failure, or stroke during the long term. There is currently insufficient evidence to determine whether erythrocytapheresis is beneficial or harmful compared with phlebotomy. Erythrocytapheresis requires special equipment, while phlebotomy does not. So, phlebotomy remains the treatment of choice in people with hereditary haemochromatosis even though there is no evidence from randomised clinical trials that blood letting is beneficial. Having said this, a randomised clinical trial including no treatment is unlikely to be conducted.
Quality of evidence
The overall quality of evidence was very low as the trials were at high risk of bias, which means that there is possibility of making wrong conclusions overestimating benefits or underestimating harms of treatments because of the way that the studies were conducted. Further high‐quality randomised clinical trials to identify how often blood letting should be performed and those comparing erythrocytapheresis versus blood letting are required. Such trials should include long‐term monitoring of participants (perhaps by linking health records in some countries).
Authors' conclusions
Summary of findings
| Erythrocytapheresis versus phlebotomy for hereditary haemochromatosis | |||||
| Patient or population: people with hereditary haemochromatosis | |||||
| Outcomes | Illustrative comparative risks* (95% CI) | Relative effect | No of participants | Quality of the evidence | |
| Assumed risk | Corresponding risk | ||||
| Phlebotomy | Therapeutic erythrocytapheresis | ||||
| Long‐term mortality | None of the included trials reported mortality beyond 1 year. | ||||
| Mortality Follow‐up period: 8 months | There was no mortality in either group in the short‐term in the 1 trial that reported this information. | 38 | ⊕⊝⊝⊝ | ||
| Serious adverse events Follow‐up period: 8 months | There were no serious adverse events in either group in the 1 trial that reported this information. | 38 | ⊕⊝⊝⊝ | ||
| Health‐related quality of life Follow‐up period: 8 months | The mean health‐related quality of life in the control groups was | The mean health‐related quality of life in the intervention groups was | ‐ | 38 | ⊕⊝⊝⊝ |
| Health‐related quality of life beyond one year | None of the included trials reported health‐related quality of life beyond one year | ||||
| *The basis for the assumed risk is the mean control group proportion or control event rate. The corresponding risk (and its 95% confidence interval) is based on the assumed risk in the comparison group and the relative effect of the intervention (and its 95% CI). | |||||
| GRADE Working Group grades of evidence | |||||
| 1 Downgraded one level for risk of bias. | |||||
Background
Description of the condition
Hereditary haemochromatosis is a genetic disorder related to proteins involved in iron transport, resulting in iron load and deposition of iron in various tissues of the body (Adams 2007). The most common mutation causing hereditary haemochromatosis is substitution of cysteine with tyrosine at position 282 (C282Y) of the HFE gene (Feder 1996; Pietrangelo 2004; Adams 2007; Bardou‐Jacquet 2014). This is an autosomal‐recessive genetic disorder (i.e. it can manifest itself only when both alleles (copies of the gene in both chromosomes) carry the mutation) (Feder 1996; Pietrangelo 2004; Adams 2007; Bardou‐Jacquet 2014). However, compound heterozygosity with another allele H63D (substitution of histamine with aspartic acid at position 63) (i.e. one copy of the C282Y mutated human haemochromatosis protein (HFE) gene and one copy of the H63D mutated HFE gene) can also result in manifestation of haemochromatosis (Feder 1996; van Bokhoven 2011). Several other mutations related to the HFE protein and other proteins involved in iron transport, namely ferroportin, hepcidin, transferrin receptor‐2, haemojuvelin, and ceruloplasmin, can lead to hereditary haemochromatosis (Pietrangelo 2004; Adams 2007; van Bokhoven 2011). Carriers of the autosomal‐recessive mutated HFE gene (either the C282Y or H63D allele in one of the chromosomes) varies globally and depends on ethnic origin. In the US, the prevalence of the carrier state is about 5.4% for C282Y and 13.5% for H63D alleles (Steinberg 2001). Approximately 0.3% of the general population in the US are homozygous for C282Y, 1.9% are homozygous for H63D, and 2% have C282Y/H63D compound heterozygosity (Steinberg 2001). The frequencies of C282Y and H63D alleles are more common in non‐Hispanic white people compared to non‐Hispanic black people and Mexican‐American people (Steinberg 2001). In Europe, there is significant variation in different countries with the frequency of C282Y more common in countries such as Ireland and the UK (Lucotte 2003). Overall, 0% to 28% of people carry at least one C282Y allele in different countries in Europe (Mercier 1998; Cassanelli 2001; Lucotte 2003; Ropero 2006; Voicu 2009); and 23% to 30% carry at least one H63D allele (Cassanelli 2001; Ropero 2006; Voicu 2009). However, on average, only 0.3% of people are homozygous for the C282Y allele. In Australia, screening of people of Northern Europe ancestry revealed that 0.7% of people were homozygous for the C282Y mutation and an additional 2.4% had C282Y/H63D compound heterozygosity (Allen 2008).
Diagnosis of hereditary haemochromatosis is suspected by abnormal serum iron studies such as serum ferritin and transferrin saturation, and established by the presence of C282Y homozygous gene products and the presence of other known rarer mutations (van Bokhoven 2011). Liver iron stores measured by magnetic resonance imaging or liver biopsy may be helpful in identifying elevated iron stores in the liver (Bacon 2011; van Bokhoven 2011). The proportion of people with haemochromatosis‐predisposing mutations who develop clinical symptoms of iron overload is very controversial. Asymptomatic elevation of serum ferritin and transferrin saturation (i.e. screen‐detected hereditary haemochromatosis) is a common mode of clinical presentation (Bardou‐Jacquet 2014). In symptomatic people, common symptoms related to hereditary haemochromatosis at the time of diagnosis are poor general health, fatigue, malaise, diabetes, and arthralgia (Pietrangelo 2004; Allen 2008; van Bokhoven 2011). Complications related to hereditary haemochromatosis include liver cirrhosis (and related complications such as liver failure and hepatocellular carcinoma), cardiac failure, cardiac arrhythmias, impotence, diabetes, arthritis, and skin pigmentation (Pietrangelo 2004; Schmitt 2005; van Bokhoven 2011; Bardou‐Jacquet 2014). While some researchers state that 28% to 50% of men and 1.4% to 44% of women homozygous for haemochromatosis‐predisposing mutations develop symptoms (Bradley 1996; Allen 2008), other researchers point out that the frequency of symptoms commonly attributed to haemochromatosis such as poor general health, fatigue, malaise, diabetes, and arthralgia were similar between people homozygous for haemochromatosis‐predisposing mutations and the general population (Beutler 2002). Therefore, it is not clear whether these symptoms are related to haemochromatosis at all. However, it should be pointed out that people homozygous for haemochromatosis‐predisposing mutations had more frequent liver disorders compared to the general population (Beutler 2002). Overall, the odds of developing hepatocellular carcinoma and porphyria cutanea tarda (skin blisters in areas of the body exposed to sunlight) were higher in C282Y homozygotes and C282Y/H63D compound heterozygotes compared to people in control groups (Ellervik 2007). Approximately one‐third of symptomatic people with C282Y homozygosity and a mean age of 50 years referred to a tertiary care centre die over 20 years (Wojcik 2002; Schmitt 2005). Although the symptoms related to hereditary haemochromatosis are thought to be due to iron overload and some studies have indicated a relationship between symptoms and a serum ferritin level of 1000 µg/L (Allen 2008), there is currently no firm evidence for a relationship between symptoms and the degree of iron overload (Beutler 2002; van Bokhoven 2011). While screening of family members and the general population have been advocated by some researchers (Pietrangelo 2004; Bacon 2011; de Graaff 2015), other researchers found no evidence of any tangible benefit of screening based on systematic reviews of clinical effectiveness (Schmitt 2005; Whitlock 2006). However, asymptomatic elevation of serum ferritin and transferrin saturation (i.e. screen‐detected hereditary haemochromatosis) is a common mode of clinical presentation (Bardou‐Jacquet 2014).
Description of the intervention
The main treatments for hereditary haemochromatosis include phlebotomy (venesection or blood letting), erythrocytapheresis (removal of red cells only instead of removal of whole blood), and administration of iron‐chelating agents such as desferrioxamine (van Bokhoven 2011). Removal of 500 mL of blood per week guided by serum transferrin levels and haemoglobin levels is recommended (van Bokhoven 2011). The major problems with regular phlebotomy are venous access and the requirement to visit a healthcare facility for treatment (van Bokhoven 2011). While there are no absolute contraindications for phlebotomy, the relative contraindications include severe heart disease and anaemia (Assi 2014), and possibly hypoproteinaemia.
Erythrocytapheresis involves removal of red cells only instead of whole blood and requires specialist equipment. However, the number of treatments can be reduced compared to regular phlebotomy as more iron can be removed per session (van Bokhoven 2011; Rombout‐Sestrienkova 2012). Desferrioxamine is usually administered subcutaneously, intramuscularly, or intravenously (Martindale 2011). A starting dose of 500 mg is recommended and the drug may be administered three to seven times a week (Martindale 2011). Adverse reactions of desferrioxamine include severe allergy, arthralgia, pain at injection site, gastrointestinal symptoms, tachycardia, and thrombocytopenia (Martindale 2011; van Bokhoven 2011). Newer iron‐chelating agents such as deferasirox have also been used for the treatment of primary hereditary haemochromatosis (Cancado 2015). Deferasirox is an oral chelating agent and appears to have equivalent efficacy and safety profiles as desferrioxamine (Vichinsky 2007; Pennell 2014). This review will not cover lifestyle modifications such as reduced alcohol consumption and dietary changes.
How the intervention might work
Since red blood cells contain iron as a component of haemoglobin, their removal (by erythrocytapheresis or phlebotomy) reduces body iron content, which could potentially diminish iron deposition in tissues and the subsequent complications. Desferrioxamine is an iron‐chelating agent that might work by removing iron deposition from the tissues (Martindale 2011).
Why it is important to do this review
The optimal treatment of hereditary haemochromatosis is not known. Currently, both the European Association for the Study of the Liver (EASL) and American Association for the Study of Liver Diseases (AASLD) recommend phlebotomy as the treatment of choice (EASL 2010; Bacon 2011). One randomised clinical trial reported that erythrocytapheresis required fewer sessions than venesection to decrease iron overload (Rombout‐Sestrienkova 2012). It is also not clear whether any of these measures decrease the development of complications. So, there is clearly discordance between the evidence and recommendations. Network meta‐analysis allows combination of the direct evidence and indirect evidence, and allows ranking of different treatments in terms of the different outcomes (Salanti 2011; Salanti 2012). There has been no network meta‐analysis on the comparative effectiveness of different interventions in the treatment of hereditary haemochromatosis. This systematic review and attempted network meta‐analysis provides evidence from randomised clinical trials on the role of different medical interventions in the treatment of people with hereditary haemochromatosis.
Objectives
To assess the comparative benefits and harms of different interventions in the treatment of hereditary haemochromatosis through meta‐analysis and to generate rankings of the available treatments according to their safety and efficacy. However, we found only one comparison. When more trials become available, we will attempt to conduct network meta‐analysis in order to generate rankings of the available treatments according to their safety and efficacy. This is why we retain the planned methodology for network meta‐analysis in our Appendix 1. Once data appear allowing for the conduct of network meta‐analysis, this Appendix 1 will be moved back into the Methods section.
Methods
Criteria for considering studies for this review
Types of studies
We considered only randomised clinical trials for this network meta‐analysis irrespective of language, publication status, or date of publication. We excluded studies of other design because of the risk of bias in such studies. We are all aware that such exclusions make us focus much more on potential benefits and not fully assess the risks of serious adverse events as well as risks of adverse events.
Types of participants
We included participants with hereditary haemochromatosis irrespective of the method of diagnosis of the disease or the presence of symptoms. We exclude randomised clinical trials in which participants had undergone liver transplantation previously.
Types of interventions
We planned to include the following interventions that are possible treatments for hereditary haemochromatosis and can be compared with each other or with no active treatment.
The interventions that we considered were:
-
phlebotomy;
-
desferrioxamine;
-
erythrocytapheresis.
The above list was not exhaustive. If we identified any other interventions that we were not aware of, we planned to consider them as eligible and include them in the review if they were used primarily for the treatment of hereditary haemochromatosis. We excluded trials that did not include at least two or more of the included interventions.
Types of outcome measures
We planned to assess the comparative benefits and harms of available pharmacological interventions aimed at treating people with hereditary haemochromatosis for the following outcomes.
Primary outcomes
-
Long‐term mortality (time to death; maximal follow‐up).
-
Mortality:
-
short‐term mortality (up to one year);
-
medium‐term mortality (one to five years).
-
-
Adverse events (within three months after cessation of treatment). Depending on the availability of data, we attempted to classify adverse effects as serious or non‐serious. We defined a non‐serious adverse event as any untoward medical occurrence not necessarily having a causal relationship with the treatment but resulting in a dose reduction or discontinuation of treatment (any time after commencement of treatment) (ICH‐GCP 1997). We defined a serious adverse event as any event that would increase mortality; was life threatening; required hospitalisation; resulted in persistent or significant disability; was a congenital anomaly/birth defect; or any important medical event that might have jeopardised the person or required intervention to prevent it. We used the definition used by trial authors for non‐serious and serious adverse events:
-
proportion of participants with serious adverse events;
-
number of serious adverse events;
-
proportion of participants with any type of adverse event;
-
number of any type of adverse event.
-
-
Health‐related quality of life as defined in the included trials using a validated scale such as EQ‐5D or 36‐item Short Form (SF‐36) (EuroQol 2014; Ware 2014):
-
short‐term (up to one year);
-
medium‐term (one to five years);
-
long‐term (beyond five years).
-
We planned to consider long‐term health‐related quality of life more important than short‐term or medium‐term health‐related quality of life, although short‐term and medium‐term health‐related quality of life are also important primary outcomes.
Secondary outcomes
-
Liver transplantation (maximal follow‐up):
-
proportion of participants with liver transplantation;
-
time to liver transplantation.
-
-
Decompensated liver disease (maximal follow‐up):
-
proportion of participants with decompensated liver disease;
-
time to liver decompensation.
-
-
Cirrhosis (any cirrhosis with or without clinical symptoms and with or without decompensation) (maximal follow‐up):
-
proportion of participants with cirrhosis;
-
time to cirrhosis.
-
-
Hepatocellular carcinoma (maximal follow‐up).
-
Diabetes (maximal follow‐up).
-
Cardiovascular complications such as cardiac failure, myocardial infarction, and stroke (maximal follow‐up).
Search methods for identification of studies
Electronic searches
We searched the Cochrane Central Register of Controlled Trials (CENTRAL; 2016, Issue 3), MEDLINE (OvidSP), Embase (OvidSP), and Science Citation Index Expanded (Web of Knowledge) (Royle 2003) from inception to 29 March 2016 for randomised clinical trials comparing two or more of the above interventions. We searched for all possible comparisons formed by the interventions of interest. To identify further ongoing or completed trials, we also searched the World Health Organization International Clinical Trials Registry Platform search portal (www.who.int/ictrp/en), which searches various trial registers, including ISRCTN and ClinicalTrials.gov on 29 March 2016. Appendix 2 shows the search strategies used.
Searching other resources
We searched the references of the identified trials and the existing Cochrane Reviews on hereditary haemochromatosis to identify additional trials for inclusion.
Data collection and analysis
Selection of studies
Two review authors (EB and MK) independently identified the trials for inclusion by screening the titles and abstracts. We sought full‐text articles for any references that at least one of the review authors identified for potential inclusion. We selected the trials for inclusion based on the full‐text articles. We planned to list the excluded full‐text references with reasons for their exclusion in the 'Characteristics of excluded studies' table. We listed any ongoing trials identified primarily through the search of the clinical trial registers for further follow‐up. We resolved discrepancies through discussion and by arbitration with KG, DT, and ET.
Data extraction and management
Two review authors (EB and MK) independently extracted the following data.
-
Outcome data (for each outcome and for each treatment arm whenever applicable):
-
number of participants randomised;
-
number of participants included for the analysis;
-
number of participants with events for binary outcomes, mean and standard deviation for continuous outcomes, number of events for count outcomes, and the number of participants with events and the mean follow‐up period for time‐to‐event outcomes;
-
definition of outcomes or scale used if appropriate.
-
-
Data on potential effect modifiers:
-
participant characteristics such as age, sex, comorbidities, proportion of symptomatic participants, method of diagnosis, proportion of people with C282Y homozygosity, previous use of treatments;
-
details of the intervention and control (including dose (in the case of desferrioxamine) or target reduction (in the case of phlebotomy and erythrocytapheresis, frequency, and duration);
-
details of any cointerventions;
-
risk of bias (assessment of risk of bias in included studies).
-
-
Other data:
-
year and language of publication;
-
country in which the participants were recruited;
-
year(s) in which the trial was conducted;
-
inclusion and exclusion criteria;
-
follow‐up time points of the outcome.
-
If available, we planned to obtain the data separately for symptomatic participants and asymptomatic participants from the report. We attempted to contact trial authors when there was unclear or missing information, or when there was doubt whether trials shared the same participants, completely or partially (by identifying common authors and centres), or if we needed clarification whether the trial report was duplicated. We resolved any differences in opinion through discussion.
Assessment of risk of bias in included studies
We followed the guidance given in the Cochrane Handbook for Systematic Reviews of Interventions (Higgins 2011) and in the Cochrane Hepato‐Biliary Module (Gluud 2015) to assess the risk of bias in included studies. Specifically, we assessed the risk of bias in included trials for the following domains (Schulz 1995; Moher 1998; Kjaergard 2001; Wood 2008; Savović 2012a; Savović 2012b; Lundh 2017).
Allocation sequence generation
-
Low risk of bias: the study authors performed sequence generation using computer random number generation or a random number table. Drawing lots, tossing a coin, shuffling cards, and throwing dice were adequate if an independent person not otherwise involved in the study performed them.
-
Unclear risk of bias: the study authors did not specify the method of sequence generation.
-
High risk of bias: the sequence generation method was not random. We planned to only include such studies for assessment of harms.
Allocation concealment
-
Low risk of bias: the participant allocations could not have been foreseen in advance of, or during, enrolment. A central and independent randomisation unit controlled allocation. The investigators were unaware of the allocation sequence (e.g. if the allocation sequence was hidden in sequentially numbered, opaque, and sealed envelopes).
-
Unclear risk of bias: the study authors did not describe the method used to conceal the allocation so the intervention allocations may have been foreseen before, or during, enrolment.
-
High risk of bias: it is likely that the investigators who assigned the participants knew the allocation sequence. We planned to only include such studies for assessment of harms.
Blinding of participants and personnel
-
Low risk of bias: any of the following: no blinding or incomplete blinding, but the review authors judged that the outcome was not likely to be influenced by lack of blinding; or blinding of participants and key study personnel ensured, and it was unlikely that the blinding could have been broken.
-
Unclear risk of bias: any of the following: insufficient information to permit judgement of 'low risk' or 'high risk'; or the trial did not address this outcome.
-
High risk of bias: any of the following: no blinding or incomplete blinding, and the outcome was likely to be influenced by lack of blinding; or blinding of key study participants and personnel attempted, but likely that the blinding could have been broken, and the outcome was likely to be influenced by lack of blinding.
Blinded outcome assessment
-
Low risk of bias: any of the following: no blinding of outcome assessment, but the review authors judged that the outcome measurement was not likely to be influenced by lack of blinding; or blinding of outcome assessment ensured, and unlikely that the blinding could have been broken.
-
Unclear risk of bias: any of the following: insufficient information to permit judgement of 'low risk' or 'high risk'; or the trial did not address this outcome.
-
High risk of bias: any of the following: no blinding of outcome assessment, and the outcome measurement was likely to be influenced by lack of blinding; or blinding of outcome assessment, but likely that the blinding could have been broken, and the outcome measurement was likely to be influenced by lack of blinding.
Incomplete outcome data
-
Low risk of bias: missing data were unlikely to make treatment effects depart from plausible values. The study used sufficient methods, such as multiple imputation, to handle missing data.
-
Unclear risk of bias: there was insufficient information to assess whether missing data in combination with the method used to handle missing data were likely to induce bias on the results.
-
High risk of bias: the results were likely to be biased due to missing data.
Selective outcome reporting
-
Low risk of bias: the trial reported the following predefined outcomes: mortality, decompensated liver disease, requirement for transplantation, and treatment‐related adverse events. If the original trial protocol was available, the outcomes should have been those called for in that protocol. If the trial protocol was obtained from a trial registry (e.g. www.clinicaltrials.gov), the outcomes sought should have been those enumerated in the original protocol if the trial protocol was registered before or at the time that the trial was begun. If the trial protocol was registered after the trial was begun, those outcomes were not considered to be reliable.
-
Unclear risk of bias: not all predefined, or clinically relevant and reasonably expected, outcomes were reported fully, or it was unclear whether data on these outcomes were recorded or not.
-
High risk of bias: one or more predefined or clinically relevant and reasonably expected outcomes were not reported, despite the fact that data on these outcomes should have been available and even recorded.
For‐profit bias
-
Low risk of bias: the trial appeared to be free of industry sponsorship or other type of for‐profit support that could manipulate the trial design, conductance, or results of the trial.
-
Uncertain risk of bias: the trial may or may not have been free of for‐profit bias as no information on clinical trial support or sponsorship was provided.
-
High risk of bias: the trial was sponsored by industry or received other type of for‐profit support.
Other bias
-
Low risk of bias: the trial appeared to be free of other components (e.g. inappropriate control or dose or administration of control, baseline differences, early stopping) that could put it at risk of bias.
-
Uncertain risk of bias: the trial may or may not have been free of other components that could put it at risk of bias.
-
High risk of bias: there were other factors in the trial that could put it at risk of bias (e.g. inappropriate control or dose or administration of control, baseline differences, early stopping).
We considered a trial at low risk of bias if we assessed the trial as at low risk of bias across all domains. We considered a trial at low risk of bias for an outcome if we assessed the trial as at low risk of bias across all study level domains. Otherwise, we considered the trials at uncertain risk of bias or at high risk of bias regarding one or more domains as at high risk of bias.
Measures of treatment effect
For dichotomous variables (e.g. short‐term and medium‐term mortality or liver transplantation, proportion of participants with adverse events, decompensated liver disease, cirrhosis, hepatocellular carcinoma, or diabetes), we calculated the odds ratio (OR) with 95% confidence intervals (CI). For continuous variables (e.g. quality of life reported on the same scale), we calculated the mean difference (MD) with 95% CI. We planned to use standardised mean differences with 95% CI for quality of life if included trials used different scales. For count outcomes (e.g. number of adverse events), we calculated the rate ratio with 95% CI. For time‐to‐event data (e.g. long‐term mortality or requirement for liver transplantation, time to liver decompensation, and time to cirrhosis), we planned to use the hazard ratio with 95% CIs. We also calculated Trial Sequential Analysis‐adjusted CI to control random errors (Thorlund 2011).
Unit of analysis issues
The unit of analysis was the person with hereditary haemochromatosis according to the intervention group to which they were randomly assigned.
Cluster randomised clinical trials
We found no cluster randomised clinical trials. If we found them, we planned to include them provided that the effect estimate adjusted for cluster correlation was available.
Cross‐over randomised clinical trials
We found one cross‐over randomised clinical trial. We planned to only include the outcomes after the period of first treatment since hereditary haemochromatosis is a chronic disease and the treatments could potentially have a residual effect. However, the cross‐over trial did not report any outcomes prior to the cross‐over.
Trials with multiple treatment groups
We collected data for all trial treatment groups that met the inclusion criteria.
Dealing with missing data
We performed an intention‐to‐treat analysis whenever possible (Newell 1992). Otherwise, we planned to use the data that were available to us (e.g. a trial might have reported only per‐protocol analysis results). As such 'per‐protocol' analyses may be biased, we planned to conduct best‐worst case scenario analyses (good outcome in intervention group and bad outcome in control group) and worst‐best case scenario analyses (bad outcome in intervention group and good outcome in control group) as sensitivity analyses whenever possible but did not perform this because there were no post‐randomisation dropouts in either trial that provided data.
For continuous outcomes, we planned to impute the standard deviation from P values according to guidance given in the Cochrane Handbook for Systematic Reviews of Interventions (Higgins 2011). If the data were likely to be normally distributed, we planned to use the median for meta‐analysis when the mean was not available. If it was not possible to calculate the standard deviation from the P value or the CIs, we planned to impute the standard deviation using the largest standard deviation in other trials for that outcome. This form of imputation may decrease the weight of the study for calculation of MDs and may bias the effect estimate to no effect for calculation of standardised mean differences (Higgins 2011).
Assessment of heterogeneity
We assessed clinical and methodological heterogeneity by carefully examining the characteristics and design of included trials. We planned to assess the presence of clinical heterogeneity by comparing effect estimates in the presence or absence of symptoms, different targets of iron reduction, and different doses of desferrioxamine or different methods of erythrocytapheresis or phlebotomy, and the doses of the pharmacological treatments. Different study designs and risk of bias may contribute to methodological heterogeneity. If we identified substantial heterogeneity, clinical, methodological, or statistical, we explored and address heterogeneity in a subgroup analysis (see Subgroup analysis and investigation of heterogeneity). We used the I2 test and Chi2 test for heterogeneity, and overlapping of CIs to assess heterogeneity.
Assessment of reporting biases
We planned to use visual asymmetry on a funnel plot to explore reporting bias in the presence of at least 10 trials that could be included for a direct comparison (Egger 1997; Macaskill 2001). In the presence of heterogeneity that could be explained by subgroup analysis, we planned to produce a funnel plot for each subgroup in the presence of the adequate number of trials. We planned to use the linear regression approach described by Egger 1997 to determine funnel plot asymmetry.
We also considered selective reporting and non‐reporting of trials (identified from searching the trial registers) as evidence of reporting bias.
Data synthesis
We performed the meta‐analyses according to the recommendations of The Cochrane Collaboration (Higgins 2011), using the software package Review Manager 5 (RevMan 2014). We used a random‐effects model (DerSimonian 1986) and a fixed‐effect model (DeMets 1987). In the case of a discrepancy between the two models, we have reported both results; otherwise, we have reported only the results from the fixed‐effect model.
Calculation of required information size and Trial Sequential Analysis
For calculation of the required information size, see Appendix 3. We performed Trial Sequential Analysis to control the risks of random errors (Wetterslev 2008; Thorlund 2011; TSA 2011) when there were at least two trials included in the meta‐analysis. We used an alpha error of 2.5% (Jakobsen 2014), power of 90% (beta error of 10%), a relative risk reduction of 20%, a control group proportion observed in the trials, and the diversity observed in the meta‐analysis.
Subgroup analysis and investigation of heterogeneity
We planned to assess the differences in the effect estimates between the following subgroups.
-
Trials with low risk of bias compared to trials with high risk of bias.
-
Participants with symptomatic compared to participants with asymptomatic hereditary haemochromatosis.
-
Different targets of iron reduction.
-
Different doses of desferrioxamine or different methods of erythrocytapheresis or phlebotomy.
We planned to use the chi2 test for subgroup differences to identify subgroup differences.
Sensitivity analysis
If a trial reported only per‐protocol analysis results, we planned to re‐analyse the results using the best‐worst case scenario and worst‐best case scenario analyses as sensitivity analyses whenever possible. However, we did not perform this because both trials that provided data for this review had no post‐randomisation dropouts.
Presentation of results and GRADE assessments
We reported mortality, serious adverse events, and health‐related quality of life in a 'Summary of findings' table format, downgrading the quality of evidence for risk of bias, inconsistency, indirectness, imprecision, and publication bias using GRADE (Guyatt 2011).
Results
Description of studies
Results of the search
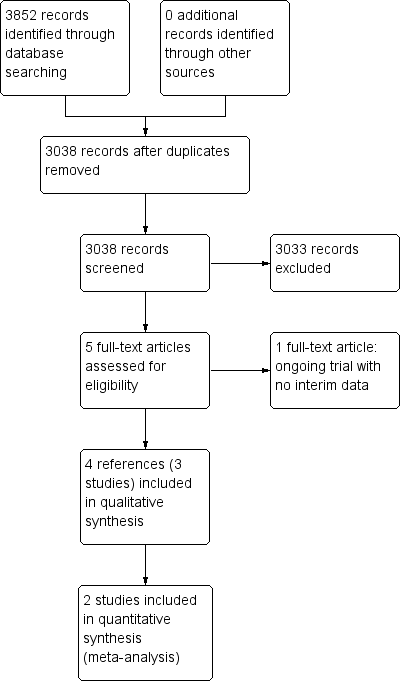
We identified 3852 references through electronic searches of CENTRAL (N = 312), MEDLINE (N = 2245), Embase (N = 489), Science Citation Index Expanded (N = 690), World Health Organization International Clinical Trials Registry Platform (N = 30), and randomised controlled trials registers (N = 86). After the removal of 814 duplicates, we obtained 3038 references. We then excluded 3033 clearly irrelevant references through screening titles and reading abstracts. We retrieved five references for further assessment. No references were identified through scanning reference lists of the identified randomised trials. Four of the references were reports of three trials which fulfilled the inclusion criteria of our review (Rombout‐Sestrienkova 2012; Sundic 2014; Rombout‐Sestrienkova 2016; Characteristics of included studies table). One reference is an ongoing trial without any interim data, comparing erythrocytapheresis versus plasmapheresis (Ong 2015; Characteristics of ongoing studies table). The reference flow is summarised in the study flow diagram (Figure 1).

Study flow diagram.
Included studies
Three trials included 146 participants (Rombout‐Sestrienkova 2012; Sundic 2014; Rombout‐Sestrienkova 2016). All the three trials were two‐armed and compared erythrocytapheresis versus phlebotomy. Two trials were simple parallel randomised clinical trials (Rombout‐Sestrienkova 2012; Sundic 2014). The remaining trial was a cross‐over randomised clinical trial in which participants were randomised to receive therapeutic erythrocytapheresis or phlebotomy (Rombout‐Sestrienkova 2016). After one year, the participants were crossed‐over to receive the opposite treatment (Rombout‐Sestrienkova 2016). Two trials with 100 participants provided data for analyses (Rombout‐Sestrienkova 2012; Sundic 2014).
None of the trials reported whether they included symptomatic or asymptomatic participants, or a mixture of both. Two trials which provided data for this review were conducted in people who had not undergone previous treatment for haemochromatosis (Rombout‐Sestrienkova 2012; Sundic 2014). The trial which did not provide data for this review included only people on maintenance therapy for haemochromatosis (Rombout‐Sestrienkova 2016). The trial that provided most data for this review excluded people with malignancy, heart failure, and serious cardiac arrhythmias (Rombout‐Sestrienkova 2012).
One trial carried out erythrocytapheresis bi‐weekly (not clear whether the authors meant this to be once every two weeks or twice weekly) (Sundic 2014), one trial once every two weeks (Rombout‐Sestrienkova 2012), and on trial variably depending upon serum ferritin level (Rombout‐Sestrienkova 2016). Two trials carried out phlebotomy once a week (Rombout‐Sestrienkova 2012; Sundic 2014), and one trial variably depending upon serum ferritin level (Rombout‐Sestrienkova 2016). The amount of red blood cells withdrawn during each treatment of erythrocytapheresis was 350 mL to 800 mL (Rombout‐Sestrienkova 2012; Sundic 2014; Rombout‐Sestrienkova 2016). The amount of blood withdrawn during each treatment of phlebotomy was 450 mL to 500 mL (Rombout‐Sestrienkova 2012; Sundic 2014; Rombout‐Sestrienkova 2016). The treatment duration in one trial was 12 weeks (Sundic 2014), was one year (after which the people crossed‐over) in one trial (Rombout‐Sestrienkova 2016), and was variable depending upon the amount of iron to be removed in one trial (Rombout‐Sestrienkova 2012). All the trials used serum ferritin level of 50 μg/L or less as the target for treatment.
The mean or median age in the trials ranged from 42 to 55 years. The proportion of females was 9.7% in Sundic 2014 and 26.3% in Rombout‐Sestrienkova 2012. Rombout‐Sestrienkova 2016 did not report this information.
Two trials that provided data for this review were funded by parties with no vested interest in the results (Rombout‐Sestrienkova 2012; Sundic 2014); the other trial did not report the source of funding (Rombout‐Sestrienkova 2016).
Excluded studies
We excluded no studies that we sought full text for.
Risk of bias in included studies
The risk of bias is summarised in Figure 2 and Figure 3. As shown in Figure 3, all the trials were at overall high risk of bias.

Risk of bias graph: review authors' judgements about each risk of bias item presented as percentages across all included studies.
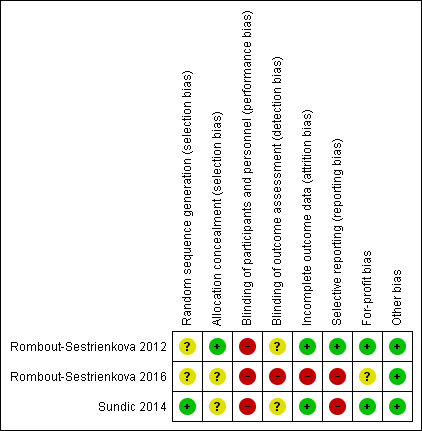
Risk of bias summary: review authors' judgements about each risk of bias item for each included study.
Allocation
One trial was at low risk of selection bias due to random sequence generation (Sundic 2014). The remaining trials were at unclear risk of random sequence generation (Rombout‐Sestrienkova 2012; Rombout‐Sestrienkova 2016). One trial was at low risk of selection bias due to allocation concealment (Rombout‐Sestrienkova 2012). The remaining trials were at unclear risk of allocation concealment (Sundic 2014; Rombout‐Sestrienkova 2016).
Blinding
None of the trials were at low risk of performance or detection bias due to blinding of participants, personnel, and outcome assessors. All the trials were at high risk of performance bias (Rombout‐Sestrienkova 2012; Sundic 2014; Rombout‐Sestrienkova 2016). One trial was at high risk of detection bias (Rombout‐Sestrienkova 2016); the remaining two trials were at unclear risk of detection bias (Rombout‐Sestrienkova 2012; Sundic 2014).
Incomplete outcome data
Two trials were at low risk of attrition bias due to incomplete outcome data (Rombout‐Sestrienkova 2012; Sundic 2014). The remaining trial was at high risk of attrition bias due to incomplete outcome data (Rombout‐Sestrienkova 2016).
Selective reporting
One trial was at low risk of reporting bias due to selective outcome reporting (Rombout‐Sestrienkova 2012). The remaining two trials were at high risk of reporting bias due to selective outcome reporting (Sundic 2014; Rombout‐Sestrienkova 2016).
Other potential sources of bias
Two trials were at low risk of for‐profit bias (Rombout‐Sestrienkova 2012; Sundic 2014). One trial was at unclear risk of for‐profit bias since the source of funding was not reported (Rombout‐Sestrienkova 2016). All the trials were at low risk of 'other' bias.
Effects of interventions
Long‐term mortality
None of the trials reported long‐term mortality.
Mortality
One trial (38 participants) reported short‐term mortality at eight months (Rombout‐Sestrienkova 2012). There was no mortality in either group. None of the trials reported mortality beyond one year.
Serious adverse events
One trial (38 participants) reported serious adverse events (Rombout‐Sestrienkova 2012). There were no serious adverse events in either group.
All adverse events
Two trials with 100 participants reported proportion of participants with any adverse events (Rombout‐Sestrienkova 2012; Sundic 2014). The proportion of people with any adverse events in the erythrocytapheresis group was 10/49 (20.4%) versus 11/51 (21.6%) in the phlebotomy group. There was no evidence of difference in all adverse events between the groups (OR 0.93, 95% CI 0.36 to 2.43; participants = 100; trials = 2; I2 = 0%). There was no alteration in the results by using the random‐effects model.
One of these two trials with 38 participants also reported the number of adverse events (Rombout‐Sestrienkova 2012). The adverse event rate was 42.1 events per 100 participants in the erythrocytapheresis group and 52.6 events per 100 participants in the phlebotomy groups. There was no evidence of difference in all adverse events between the groups (rate ratio 0.80, 95% CI 0.32 to 2.03; participants = 38; trials = 1).
Health‐related quality of life
One trial with 38 participants reported short‐term health‐related quality of life (up to one year) (Rombout‐Sestrienkova 2012) using EQ‐VAS (EuroQol 2014) on a scale of 0 to 100 with higher numbers indicating better health‐related quality of life. There was no significant difference in health‐related quality of life between the groups (MD 1.00, 95% CI ‐10.80 to 12.80; participants = 38; trials = 1). None of the trials reported health‐related quality of life beyond one year.
Liver transplantation
None of the trials reported liver transplantation.
Decompensated liver disease
None of the trials reported decompensated liver disease.
Cirrhosis
None of the trials reported cirrhosis.
Hepatocellular carcinoma
None of the trials reported hepatocellular carcinoma.
Diabetes
None of the trials reported diabetes.
Cardiovascular complications
None of the trials reported cardiovascular complications such as cardiac failure, myocardial infarction, and stroke at maximal follow‐up.
Subgroup analysis
We did not perform any of the subgroup analyses because none of the trials were at low risk of bias, the trials did not report whether the participants were symptomatic or asymptomatic, all the trials used serum ferritin level of 50 μg/L or less as the target, and the trials used similar methods of erythrocytapheresis and phlebotomy.
Trial Sequential Analysis
Only one comparison had more than one trial and was eligible for Trial Sequential Analysis. As shown in Figure 4, the accrued sample size was only a small fraction of the diversity‐adjusted required information size (DARIS); therefore, the boundaries could not be drawn. There was a high risk of random errors. The TSA‐adjusted CI could not be calculated as there was too little information to be used.
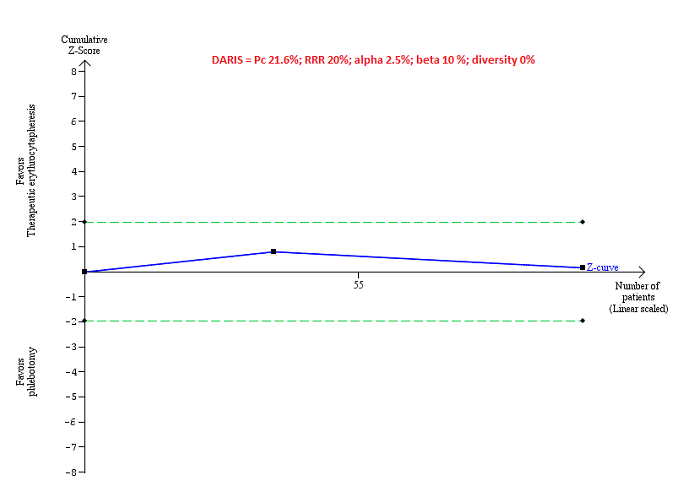
Trial Sequential Analysis of adverse events (proportion) performed using an alpha error of 2.5%, power of 90% (beta error of 10%), relative risk reduction of 20%, control group proportion (Pc) observed in trials (21.6% for proportion of people with adverse events), and observed diversity (0%) shows that the accrued sample size was only a small fraction of the diversity‐adjusted required information size (DARIS) that the boundaries could not be drawn. The Z‐curve (blue line) does not cross the conventional boundaries (dotted green line). There was a high risk of random errors.
Reporting bias
We did not explore reporting bias using a funnel plot because of few trials included in the review.
Quality of evidence
All the evidence available was downgraded to very low quality of evidence because of the risk of bias in the trials (downgraded one level for risk of bias) and imprecision (downgraded one level for small sample size and one more level for wide CIs). There was no evidence of indirectness, heterogeneity, or publication bias. So, we did not downgrade for these domains (summary of findings Table for the main comparison).
Discussion
Summary of main results
In this review, we included three trials (146 participants) (Rombout‐Sestrienkova 2012; Sundic 2014; Rombout‐Sestrienkova 2016). However, one of these trials provide no information for this review (Rombout‐Sestrienkova 2016). Only one trial was included in most of the outcomes (Rombout‐Sestrienkova 2012). The only outcome of interest for this review and reported in more than one trial was proportion of people with adverse events (Rombout‐Sestrienkova 2012; Sundic 2014). There was no short‐term mortality or serious adverse events in either group in the one trial that reported these outcomes (Rombout‐Sestrienkova 2012). There were no statistically significant differences between erythrocytapheresis and phlebotomy in the proportion of people with adverse events, number of adverse events, and short‐term health‐related quality of life. None of the trials reported mortality beyond one year, health‐related quality of life beyond one year, liver transplantation, decompensated liver disease, cirrhosis, hepatocellular carcinoma, diabetes, or cardiovascular complications in the long‐term. In summary, there was no evidence of a difference between erythrocytapheresis and phlebotomy in people with hereditary haemochromatosis.
Overall completeness and applicability of evidence
We planned to include all treatments used for hereditary haemochromatosis but found that the only comparison reported was erythrocytapheresis versus phlebotomy. The current recommended treatment for hereditary haemochromatosis is phlebotomy and the trials were conducted relatively recently. Therefore, the findings of this review are applicable in the current clinical setting. The trials did not report whether the participants were symptomatic or asymptomatic. They probably included participants who required blood letting of some form regardless of symptoms based on the ferritin and transferrin levels. Therefore, the findings of the review are likely to be applicable in symptomatic and asymptomatic people. Both the trials that contributed data for this review included only treatment‐naive people, that is, people who had not received previous treatments for hereditary haemochromatosis. Therefore, the findings of the review are applicable only in people with hereditary haemochromatosis who had not received treatment previously. Finally, the trial that provided most of the information for this review excluded people with malignancy, serious cardiac arrhythmias, heart failure, and epilepsy. Therefore, the findings of this review are not applicable in such people.
Phlebotomy requires minimal equipment while erythrocytapheresis requires special equipment to perform the procedure. Since there is no evidence to suggest that erythrocytapheresis is beneficial versus phlebotomy, there is no need for hospitals to buy special equipment, based on currently available evidence.
Quality of the evidence
The overall quality of evidence was very low for all the outcomes. All the trials were at high risk of bias, mainly because blinding of participants and healthcare providers was not performed in any of the trials. The sample size was small for all the comparisons. The only outcome in which Trial Sequential Analysis was attempted showed that the sample size was less than 5% of the required information size to identify a relative risk reduction of 20%. There were also wide CIs for all the comparisons.
Potential biases in the review process
We followed the guidance of the Cochrane Handbook for Systematic Reviews of Interventions with two review authors independently selecting studies and extracting data. We performed a thorough search of literature. However, the search period included the pre‐mandatory trial registration era and it is possible that we missed some trials on treatments that were not effective or were harmful or were not reported at all.
We only included randomised clinical trials which are known to focus mostly on benefits and do not collect and report harms in a detailed manner. According to our choice of studies (i.e. only randomised clinical trials), we might have missed a large number of studies that address reporting of harms. Accordingly, this review is biased towards benefits ignoring harms. We did not search for interventions and trials registered at regulatory authorities (e.g., FDA (US Food and Drug Administration); EMA (European Medicines Agency), etc). This may have overlooked trials and as such trials usually are unpublished, the lack of inclusion of such trials may make our comparisons look more advantageous than they really are.
Agreements and disagreements with other studies or reviews
There have been no previous systematic reviews on this topic. The authors of the trial that provided most information for this review concluded that erythrocytapheresis is a highly effective treatment to reduce iron overload, and that from a societal perspective, it might potentially also be a cost‐saving therapy (Rombout‐Sestrienkova 2012). Our findings show that it is too early to know whether erythrocytapheresis is beneficial or harmful compared with phlebotomy. While we did not collect the cost information for this review, we noted that the costs of purchasing the equipment and maintenance of the equipment was not included in the cost calculations. This is likely to alter the conclusions about the difference between treatment costs. It is also not clear whether blinding of participants was performed. Lack of blinding of participants to treatment may cause biased estimate of the costs related to productivity loss. Therefore, the existing evidence did not allow us to support the trial authors' conclusions.
Study flow diagram.

Risk of bias graph: review authors' judgements about each risk of bias item presented as percentages across all included studies.

Risk of bias summary: review authors' judgements about each risk of bias item for each included study.

Trial Sequential Analysis of adverse events (proportion) performed using an alpha error of 2.5%, power of 90% (beta error of 10%), relative risk reduction of 20%, control group proportion (Pc) observed in trials (21.6% for proportion of people with adverse events), and observed diversity (0%) shows that the accrued sample size was only a small fraction of the diversity‐adjusted required information size (DARIS) that the boundaries could not be drawn. The Z‐curve (blue line) does not cross the conventional boundaries (dotted green line). There was a high risk of random errors.
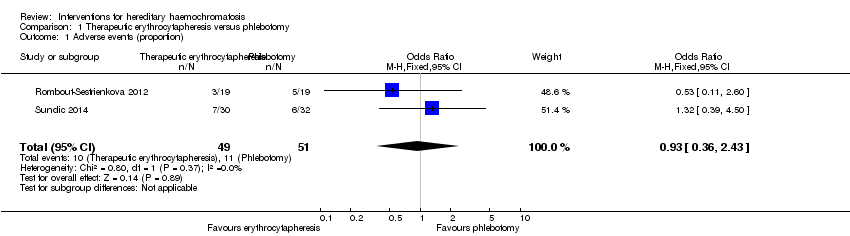
Comparison 1 Therapeutic erythrocytapheresis versus phlebotomy, Outcome 1 Adverse events (proportion).
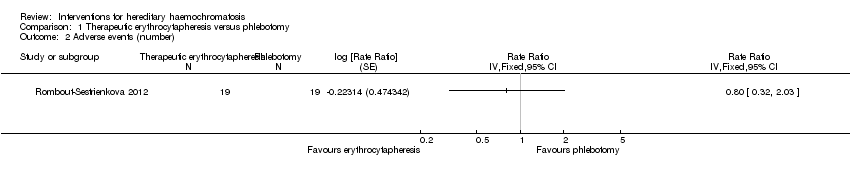
Comparison 1 Therapeutic erythrocytapheresis versus phlebotomy, Outcome 2 Adverse events (number).

Comparison 1 Therapeutic erythrocytapheresis versus phlebotomy, Outcome 3 Health‐related quality of life (EQ‐VAS).
| Erythrocytapheresis versus phlebotomy for hereditary haemochromatosis | |||||
| Patient or population: people with hereditary haemochromatosis | |||||
| Outcomes | Illustrative comparative risks* (95% CI) | Relative effect | No of participants | Quality of the evidence | |
| Assumed risk | Corresponding risk | ||||
| Phlebotomy | Therapeutic erythrocytapheresis | ||||
| Long‐term mortality | None of the included trials reported mortality beyond 1 year. | ||||
| Mortality Follow‐up period: 8 months | There was no mortality in either group in the short‐term in the 1 trial that reported this information. | 38 | ⊕⊝⊝⊝ | ||
| Serious adverse events Follow‐up period: 8 months | There were no serious adverse events in either group in the 1 trial that reported this information. | 38 | ⊕⊝⊝⊝ | ||
| Health‐related quality of life Follow‐up period: 8 months | The mean health‐related quality of life in the control groups was | The mean health‐related quality of life in the intervention groups was | ‐ | 38 | ⊕⊝⊝⊝ |
| Health‐related quality of life beyond one year | None of the included trials reported health‐related quality of life beyond one year | ||||
| *The basis for the assumed risk is the mean control group proportion or control event rate. The corresponding risk (and its 95% confidence interval) is based on the assumed risk in the comparison group and the relative effect of the intervention (and its 95% CI). | |||||
| GRADE Working Group grades of evidence | |||||
| 1 Downgraded one level for risk of bias. | |||||
| Outcome or subgroup title | No. of studies | No. of participants | Statistical method | Effect size |
| 1 Adverse events (proportion) Show forest plot | 2 | 100 | Odds Ratio (M‐H, Fixed, 95% CI) | 0.93 [0.36, 2.43] |
| 2 Adverse events (number) Show forest plot | 1 | Rate Ratio (Fixed, 95% CI) | Totals not selected | |
| 3 Health‐related quality of life (EQ‐VAS) Show forest plot | 1 | Mean Difference (IV, Fixed, 95% CI) | Totals not selected | |