Intervenciones farmacológicas para la infección aguda por hepatitis B
Información
- DOI:
- https://doi.org/10.1002/14651858.CD011645.pub2Copiar DOI

- Base de datos:
-
- Cochrane Database of Systematic Reviews
- Versión publicada:
-
- 21 marzo 2017see what's new
- Tipo:
-
- Intervention
- Etapa:
-
- Review
- Grupo Editorial Cochrane:
-
Grupo Cochrane de Hepatobiliar
- Copyright:
-
- Copyright © 2017 The Cochrane Collaboration. Published by John Wiley & Sons, Ltd.
Cifras del artículo
Altmetric:
Citado por:
Autores
Contributions of authors
KM, MRP, and KG extracted data and provided them in a format that could be analysed.
KG wrote the review.
EB helped KM with data extraction and completing the 'Characteristics of included studies' table.
DT, ET, and BD critically commented on the review.
All review authors agreed on this version before publication.
Sources of support
Internal sources
-
University College London, UK.
External sources
-
National Institute for Health Research, UK.
-
Andrew Burroughs Fellowship, Other.
Dr Elena Buzzetti was supported by the Andrew Burroughs Fellowship from AIGO (Associazione Italiana Gastroenterologi Ospedalieri) and M.I.M.I (Montecatini Interactive Medicine International).
Declarations of interest
This report is independent research funded by the National Institute for Health Research (NIHR Cochrane Programme Grants, 13/89/03 ‐ evidence‐based diagnosis and management of upper digestive, hepato‐biliary, and pancreatic disorders). The views expressed in this publication are those of the authors and not necessarily those of the National Health Service (NHS), the NIHR, or the Department of Health.
KM: no financial disclosures.
MRP: acted as advisory for Astellas and has received educational grants from Astellas and Novartis.
EB: no financial disclosures.
DT: funded by Astellas for his attendance at the International Liver Transplantation Society meeting in 2014; received GBP 25,000 from Boston Scientific to fund a clinical research fellow in 2013.
BD: no financial disclosures.
ET: no financial disclosures.
KG: no financial disclosures.
Acknowledgements
We thank the Cochrane Comparing of Multiple Interventions Methods Group and the Cochrane Hepato‐Biliary for their support and advice. We thank the copy editors for their support.
Cochrane Review Group funding acknowledgement: the Danish State is the largest single funder of the Cochrane Hepato‐Biliary Group through its investment in The Copenhagen Trial Unit, Centre for Clinical Intervention Research, Rigshospitalet, Copenhagen University Hospital, Denmark. Disclaimer: the views and opinions expressed in this review are those of the authors and do not necessarily reflect those of the Danish State or The Copenhagen Trial Unit.
Peer reviewers of review: Nathorn Chaiyakunapruk, Malaysia; Robert Gish, USA; Anders Boyd, France.
Contact editor: Christian Gluud, Denmark.
Sign‐off editor: Christian Gluud, Denmark.
Version history
| Published | Title | Stage | Authors | Version |
| 2017 Mar 21 | Pharmacological interventions for acute hepatitis B infection | Review | Konstantinos Mantzoukis, Manuel Rodríguez‐Perálvarez, Elena Buzzetti, Douglas Thorburn, Brian R Davidson, Emmanuel Tsochatzis, Kurinchi Selvan Gurusamy | |
| 2015 Apr 14 | Pharmacological treatments for acute hepatitis B infection: a network meta‐analysis | Protocol | Kurinchi Selvan Gurusamy, Emmanuel Tsochatzis, Douglas Thorburn, Brian R Davidson | |
Differences between protocol and review
-
It was not possible to assess whether the potential effect modifiers were similar across different comparisons as this information was missing in many trials. Therefore, we did not perform the network meta‐analysis, and assessed the comparative benefits and harms of different interventions using standard Cochrane methodology. The methodology that we plan to use if we conduct a network meta‐analysis in future is available in Appendix 1.
-
We performed Trial Sequential Analysis in addition to conventional methods of assessing the risk of random errors using P values.
-
We have reported seroconversion which is sometimes used as a surrogate for progression to chronic hepatitis B virus infection.
Notes
Considerable overlap is evident in the 'Methods' sections of this review and those of several other reviews written by the same group of authors.
Keywords
MeSH
Medical Subject Headings (MeSH) Keywords
- Acute Disease;
- Antiviral Agents [adverse effects, *therapeutic use];
- Disease Progression;
- Guanine [adverse effects, analogs & derivatives, therapeutic use];
- Hepatic Encephalopathy [drug therapy];
- Hepatitis B [*drug therapy, mortality];
- Hepatitis C, Chronic;
- Immunization, Passive [*methods];
- Interferons [adverse effects, therapeutic use];
- Lamivudine [adverse effects, therapeutic use];
- Network Meta‐Analysis;
- Odds Ratio;
- Randomized Controlled Trials as Topic;
- Reverse Transcriptase Inhibitors [adverse effects, therapeutic use];
Medical Subject Headings Check Words
Humans;
PICO
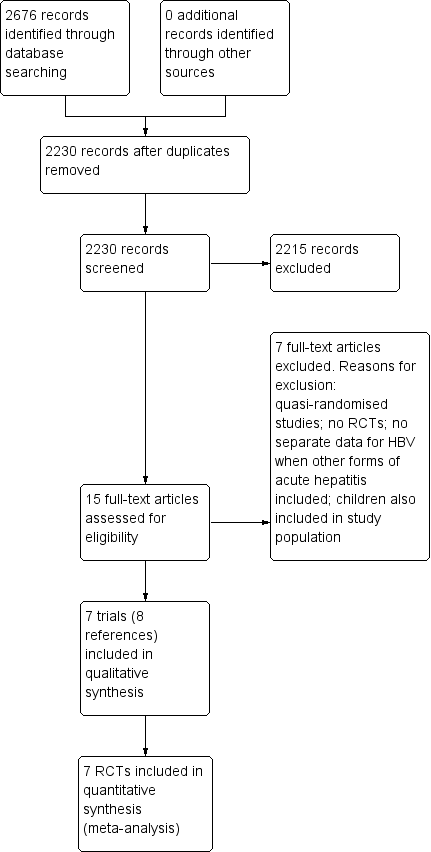
Study flow diagram. HBV: hepatitis B virus; RCT: randomised clinical trial.
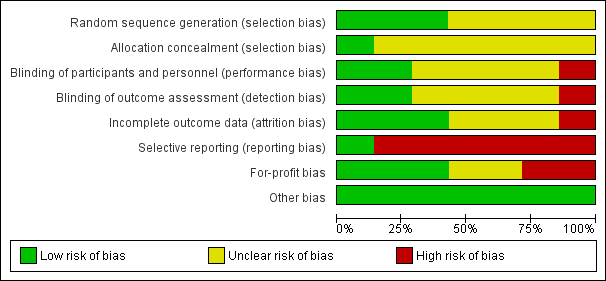
Risk of bias graph: review authors' judgements about each risk of bias item presented as percentages across all included studies.

Risk of bias summary: review authors' judgements about each risk of bias item for each included study.

Trial sequential analysis of progression to chronic hepatitis B virus infection (lamivudine versus placebo or no treatment) and adverse events (proportion) (interferon versus placebo): Using the control group proportion observed in the trials (Pc = 41.3% and 34.9% respectively), alpha error of 2%, beta error of 90%, relative risk reduction (RRR) of 20%, and diversity observed in the analysis (0%), the accrued sample sizes (285 and 200 respectively) were only small proportions of the diversity‐adjusted required information sizes (DARIS) (progression to chronic hepatitis B = 1783; adverse events (proportion) = 2303). While the Z‐curve (blue lines) crossed the conventional boundary of P = 0.05 (dotted green lines) favouring placebo or no treatment, it did not cross any of the trial sequential monitoring boundaries (dotted red lines). There was a high risk of random errors.

Comparison 1 Pharmacological treatments for acute hepatitis B virus infection, Outcome 1 Mortality.
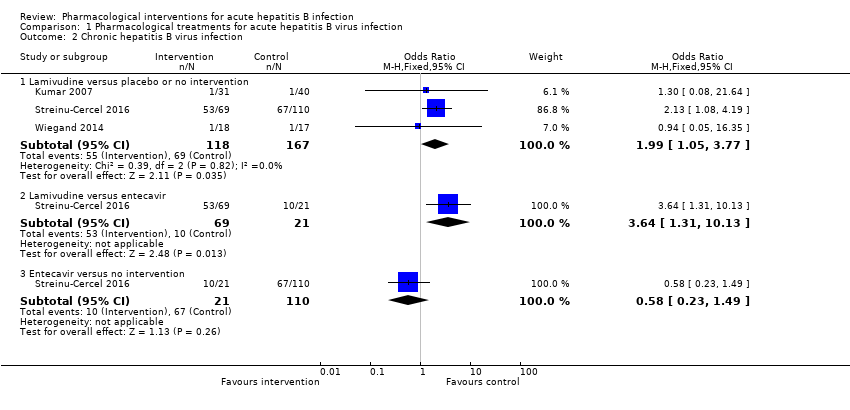
Comparison 1 Pharmacological treatments for acute hepatitis B virus infection, Outcome 2 Chronic hepatitis B virus infection.
| Study | Number of events (intervention) | Number of participants (intervention) | Number of events (control) | Number of participants (control) |
| Interferon versus placebo | ||||
| Tassopoulos 1989 | 0 | 67 | 0 | 33 |
| Lamivudine versus placebo or no intervention | ||||
| Kumar 2007 | 0 | 31 | 0 | 40 |
| Streinu‐Cercel 2016 | 0 | 69 | 0 | 110 |
| Lamivudine versus entecavir | ||||
| Streinu‐Cercel 2016 | 0 | 69 | 0 | 21 |
| Entecavir versus no intervention | ||||
| Streinu‐Cercel 2016 | 0 | 21 | 0 | 110 |
Comparison 1 Pharmacological treatments for acute hepatitis B virus infection, Outcome 3 Serious adverse events.
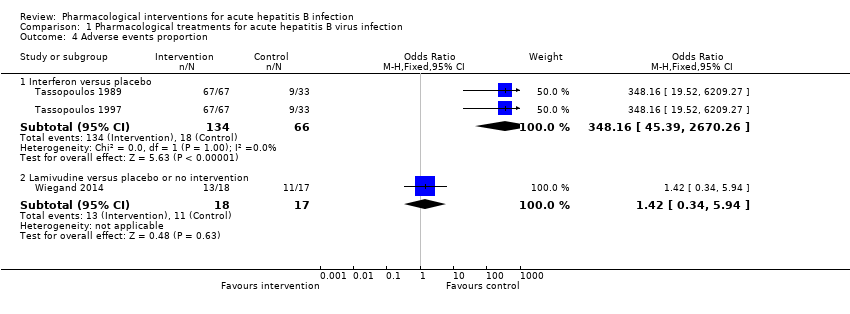
Comparison 1 Pharmacological treatments for acute hepatitis B virus infection, Outcome 4 Adverse events proportion.
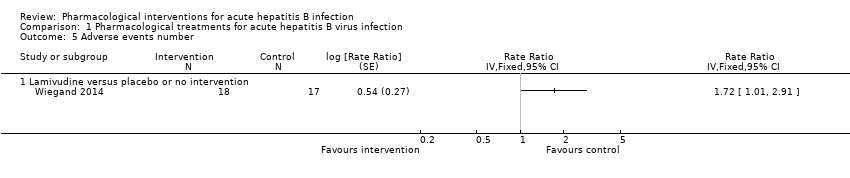
Comparison 1 Pharmacological treatments for acute hepatitis B virus infection, Outcome 5 Adverse events number.
| Study | Mean (interferon) | Number of participants (interferon) | Mean (control) | Number of participants (control) | Mean difference | Statistical significance | Further details on scale used |
| Interferon versus placebo | |||||||
| Tassopoulos 1997 | 48.1 | 67 | 42.7 | 33 | 5.4 | Not stated | Scale not stated. Not reported whether higher score indicates better or worse |
Comparison 1 Pharmacological treatments for acute hepatitis B virus infection, Outcome 6 Health‐related quality of life.
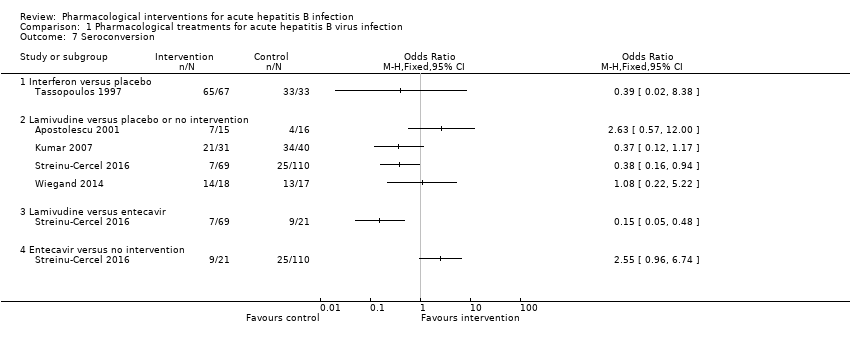
Comparison 1 Pharmacological treatments for acute hepatitis B virus infection, Outcome 7 Seroconversion.

Comparison 1 Pharmacological treatments for acute hepatitis B virus infection, Outcome 8 Time to seroconversion.
| Study | Mean (lamivudine) | Number of participants (lamivudine) | Mean (control) | Number of participants (control) | Mean difference | Statistical significance |
| Lamivudine versus placebo or no intervention | ||||||
| Wiegand 2014 | 17 | 18 | 16 | 17 | 1 | P = 0.519 (not statistically significant) |
Comparison 1 Pharmacological treatments for acute hepatitis B virus infection, Outcome 9 Time to seroconversion [weeks].
| Lamivudine versus no intervention for acute hepatitis B virus infection | |||||
| Patient or population: people with acute HBV infection Settings: secondary or tertiary care Intervention: lamivudine Control: no intervention | |||||
| Outcomes | Illustrative comparative risks* (95% CI) | Relative effect | No of participants | Quality of the evidence | |
| Assumed risk | Corresponding risk | ||||
| No intervention | Lamivudine | ||||
| Short‐term mortality (< 1 year) | 33 per 1000 | 43 per 1000 | OR 1.29 | 250 | ⊕⊝⊝⊝ |
| Progression to chronic HBV infection (6 to 12 months) | 413 per 1000 | 584 per 1000 | OR 1.99 | 285 | ⊕⊝⊝⊝ |
| Progression to fulminant HBV infection | None of the trials reported this information. | ||||
| Serious adverse events (6 to 12 months) | There were no serious adverse events in either group. | 250 (2 trials) | ⊕⊝⊝⊝ | ||
| Adverse events (proportion) (12 months) | 647 per 1000 | 722 per 1000 | OR 1.42 | 35 | ⊕⊝⊝⊝ |
| Adverse events (number of events) (12 months) | 1235 per 1000 | 2124 per 1000 | Rate ratio 1.72 | 35 | ⊕⊝⊝⊝ |
| Health‐related quality of life (1 week) | None of the trials reported this information. | ||||
| *The basis for the assumed risk is the mean control group risk in the control group across studies. The corresponding risk (and its 95% confidence interval) is based on the assumed risk in the comparison group and the relative effect of the intervention (and its 95% CI). CI: confidence interval; HBV: hepatitis B virus; OR: odds ratio. | |||||
| GRADE Working Group grades of evidence | |||||
| 1 The risk of bias in the trial(s) was high (downgraded by 1 level for risk of bias). | |||||
| Interferon versus no intervention for acute hepatitis B virus infection | |||||
| Patient or population: people with acute HBV infection Settings: secondary or tertiary care Intervention: interferon Control: no intervention | |||||
| Outcomes | Illustrative comparative risks* (95% CI) | Relative effect | No of participants | Quality of the evidence | |
| Assumed risk | Corresponding risk | ||||
| No intervention | Interferon | ||||
| Short‐term mortality | None of the trials reported this information. | ||||
| Progression to chronic HBV infection | None of the trials reported this information. | ||||
| Progression to fulminant HBV infection | None of the trials reported this information. | ||||
| Serious adverse events | There were no serious adverse events in either group. | 100 (1 trial) | ⊕⊝⊝⊝ | ||
| Adverse events (proportion) (4 to 6 months) | 273 per 1000 | 992 per 1000 | OR 348.16 | 200 | ⊕⊕⊝⊝ |
| Adverse events (number of events) | None of the trials reported this information. | ||||
| Health‐related quality of life (1 week) | The scale used to report the health‐related quality of life was not stated. Neither was information on whether higher score meant better or worse available. The mean score in the placebo group was 42.7 units. The mean score in the interferon group was 5.4 units higher. There was no information to calculate the 95% confidence intervals or P value. | 100 | ⊕⊝⊝⊝ | ||
| *The basis for the assumed risk is the mean control group risk in the control group across studies. The corresponding risk (and its 95% confidence interval) is based on the assumed risk in the comparison group and the relative effect of the intervention (and its 95% CI). CI: confidence interval; HBV: hepatitis B virus; OR: odds ratio. | |||||
| GRADE Working Group grades of evidence | |||||
| 1 The risk of bias in the trial(s) was high (downgraded by 1 level for risk of bias). | |||||
| Study name | Intervention | Control | Follow‐up period (months) | Sequence generation | Allocation concealment | Blinding of participants and healthcare providers | Blinding of outcome assessors | Incomplete outcome data | Selective outcome reporting | Source of funding | Other bias | Overall risk of bias |
| Hepatitis B Immunoglobulin | Placebo | Not stated | Low | Low | Unclear | Unclear | Unclear | High | Low | Low | High | |
| Interferon | Placebo | Min 5 | Unclear | Unclear | Unclear | Unclear | Unclear | High | High | Low | High | |
| Interferon | Placebo | Min 5 | Unclear | Unclear | Low | Low | Low | High | High | Low | High | |
| Lamivudine | No intervention | Min 3 | Unclear | Unclear | Unclear | Unclear | Unclear | High | Unclear | Low | High | |
| Lamivudine | Placebo | Min 12 | Low | Unclear | Low | Low | Low | Low | Unclear | Low | Unclear | |
| Lamivudine | Placebo | Not stated | Unclear | Unclear | Unclear | Unclear | High | High | Low | Low | High | |
| Lamivudine | Control 1: entecavir | Min 11 | Low | Unclear | High | High | Low | High | Low | Low | High | |
| Min: minimum. | ||||||||||||
| Outcome or subgroup title | No. of studies | No. of participants | Statistical method | Effect size |
| 1 Mortality Show forest plot | 3 | Odds Ratio (M‐H, Fixed, 95% CI) | Totals not selected | |
| 1.1 Hepatitis B immunoglobulin (HBIG) versus placebo | 1 | Odds Ratio (M‐H, Fixed, 95% CI) | 0.0 [0.0, 0.0] | |
| 1.2 Lamivudine versus placebo or no intervention | 2 | Odds Ratio (M‐H, Fixed, 95% CI) | 0.0 [0.0, 0.0] | |
| 1.3 Lamivudine versus entecavir | 1 | Odds Ratio (M‐H, Fixed, 95% CI) | 0.0 [0.0, 0.0] | |
| 1.4 Entecavir versus no intervention | 1 | Odds Ratio (M‐H, Fixed, 95% CI) | 0.0 [0.0, 0.0] | |
| 2 Chronic hepatitis B virus infection Show forest plot | 3 | Odds Ratio (M‐H, Fixed, 95% CI) | Subtotals only | |
| 2.1 Lamivudine versus placebo or no intervention | 3 | 285 | Odds Ratio (M‐H, Fixed, 95% CI) | 1.99 [1.05, 3.77] |
| 2.2 Lamivudine versus entecavir | 1 | 90 | Odds Ratio (M‐H, Fixed, 95% CI) | 3.64 [1.31, 10.13] |
| 2.3 Entecavir versus no intervention | 1 | 131 | Odds Ratio (M‐H, Fixed, 95% CI) | 0.58 [0.23, 1.49] |
| 3 Serious adverse events Show forest plot | Other data | No numeric data | ||
| 3.1 Interferon versus placebo | Other data | No numeric data | ||
| 3.2 Lamivudine versus placebo or no intervention | Other data | No numeric data | ||
| 3.3 Lamivudine versus entecavir | Other data | No numeric data | ||
| 3.4 Entecavir versus no intervention | Other data | No numeric data | ||
| 4 Adverse events proportion Show forest plot | 3 | Odds Ratio (M‐H, Fixed, 95% CI) | Subtotals only | |
| 4.1 Interferon versus placebo | 2 | 200 | Odds Ratio (M‐H, Fixed, 95% CI) | 348.16 [45.39, 2670.26] |
| 4.2 Lamivudine versus placebo or no intervention | 1 | 35 | Odds Ratio (M‐H, Fixed, 95% CI) | 1.42 [0.34, 5.94] |
| 5 Adverse events number Show forest plot | 1 | Rate Ratio (Fixed, 95% CI) | Totals not selected | |
| 5.1 Lamivudine versus placebo or no intervention | 1 | Rate Ratio (Fixed, 95% CI) | 0.0 [0.0, 0.0] | |
| 6 Health‐related quality of life Show forest plot | Other data | No numeric data | ||
| 6.1 Interferon versus placebo | Other data | No numeric data | ||
| 7 Seroconversion Show forest plot | 5 | Odds Ratio (M‐H, Fixed, 95% CI) | Totals not selected | |
| 7.1 Interferon versus placebo | 1 | Odds Ratio (M‐H, Fixed, 95% CI) | 0.0 [0.0, 0.0] | |
| 7.2 Lamivudine versus placebo or no intervention | 4 | Odds Ratio (M‐H, Fixed, 95% CI) | 0.0 [0.0, 0.0] | |
| 7.3 Lamivudine versus entecavir | 1 | Odds Ratio (M‐H, Fixed, 95% CI) | 0.0 [0.0, 0.0] | |
| 7.4 Entecavir versus no intervention | 1 | Odds Ratio (M‐H, Fixed, 95% CI) | 0.0 [0.0, 0.0] | |
| 8 Time to seroconversion Show forest plot | 1 | Mean Difference (IV, Fixed, 95% CI) | Totals not selected | |
| 8.1 Interferon versus placebo | 1 | Mean Difference (IV, Fixed, 95% CI) | 0.0 [0.0, 0.0] | |
| 9 Time to seroconversion [weeks] Show forest plot | Other data | No numeric data | ||
| 9.1 Lamivudine versus placebo or no intervention | Other data | No numeric data | ||