Apoyo alimentario en pacientes adultos hospitalizados en riesgo nutricional
Información
- DOI:
- https://doi.org/10.1002/14651858.CD011598.pub2Copiar DOI

- Base de datos:
-
- Cochrane Database of Systematic Reviews
- Versión publicada:
-
- 19 mayo 2017see what's new
- Tipo:
-
- Intervention
- Etapa:
-
- Review
- Grupo Editorial Cochrane:
-
Grupo Cochrane de Hepatobiliar
- Copyright:
-
- Copyright © 2017 The Cochrane Collaboration. Published by John Wiley & Sons, Ltd.
Cifras del artículo
Altmetric:
Citado por:
Autores
Contributions of authors
Joshua Feinberg (JF): drafted the protocol, extracted data, co‐ordinated the review, conceived the review, designed the review, interpreted the data providing a methodological view, and revised the review.
Emil Eik Nielsen (EEN): drafted the protocol, extracted data, drafted the review, interpreted the data providing a methodological view, and revised the review.
Steven Kwasi Korang: extracted data and commented on the review.
Kirstine Halberg Engell: extracted data and commented on the review.
Marie Skøtt Rasmussen: extracted data and commented on the review.
Kang Zhang: extracted data, co‐ordinated the Chinese data extraction, and commented on the review.
Maria Didriksen: extracted data and commented on the review.
Lisbeth Lund: extracted data and commented on the review.
Niklas Lindahl: extracted data and commented on the review.
Sara Hallum: extracted data and commented on the review.
Xuemei Yang: extracted data and commented on the review.
Ning Liang: extracted data and commented on the review.
Wenjing Xiong: extracted data and commented on the review.
Pernille Brunsgaard: extracted data and commented on the review.
Alexandre Garioud: extracted data and commented on the review.
Sanam Safi: extracted data and commented on the review.
Jane Lindschou: revised the protocol and extracted data.
Jens Kondrup: drafted the Background section of the protocol, interpreted the data by providing a clinical view, and commented on and revised the review.
Christian Gluud: revised the protocol, interpreted the data providing a methodological and clinical view, commented on, and revised the review.
Januc C. Jakobsen: revised the protocol, analysed the data, interpreted the data providing a methodological and clinical view, commented on, and revised the review.
Sources of support
Internal sources
-
The Copenhagen Trial Unit, Centre for Clinical Intervention Research, Rigshospitalet, Copenhagen, Denmark.
Salary for the review authors, use of offices and equipment, access to literature.
-
The Cochrane Hepato‐Biliary Group, Rigshospitalet, Copenhagen, Denmark.
Salary for the review authors, use of offices and equipment, access to literature.
External sources
-
No sources of support supplied
Declarations of interest
Joshua Feinberg: no conflict of interest.
Emil Eik Nielsen: no conflict of interest.
Steven Kwasi Korang: no conflict of interest.
Kirstine Halberg Engell: no conflict of interest.
Marie Skøtt Rasmussen: no conflict of interest.
Kang Zhang: no conflict of interest.
Maria Didriksen: no conflict of interest.
Lisbeth Lund: no conflict of interest.
Niklas Lindahl: no conflict of interest.
Sara Hallum: no conflict of interest.
Xuemei Yang: no conflict of interest.
Ning Liang: no conflict of interest.
Wenjing Xiong: no conflict of interest.
Pernille Brunsgaard: no conflict of interest.
Alexandre Garioud: no conflict of interest.
Sanam Safi: no conflict of interest.
Jane Lindschou: no conflict of interest.
Jens Kondrup has been delivering bi‐annual lectures on nutrition support as part of his job at the Rigshospital, Denmark. JK is involved in an ongoing trial on a new enteral formula (developed by Nutricia) for which JK receives no payment.
Christian Gluud: no conflict of interest.
Januc C. Jakobsen: no conflict of interest.
Acknowledgements
We thank Ronald Koretz for his thorough reading of our review and spotting several oversights on our part. We would also like to thank the copy editor Kate Cahill for her very thorough read of this very large review.
Cochrane Review Group funding acknowledgement: The Danish State is the largest single funder of The Cochrane Hepato‐Biliary Group through its investment in The Copenhagen Trial Unit, Centre for Clinical Intervention Research, Rigshospitalet, Copenhagen University Hospital, Denmark. Disclaimer: The views and opinions expressed in this review are those of the authors and do not necessarily reflect those of the Danish State or The Copenhagen Trial Unit.
Peer reviewers: Tina Munk, Denmark; Iván D. Flórez, Colombia.
Contact editors: Ronald L Koretz, USA; Goran Bjelakovic, Serbia; Agostino Colli, Italy.
Version history
| Published | Title | Stage | Authors | Version |
| 2017 May 19 | Nutrition support in hospitalised adults at nutritional risk | Review | Joshua Feinberg, Emil Eik Nielsen, Steven Kwasi Korang, Kirstine Halberg Engell, Marie Skøtt Nielsen, Kang Zhang, Maria Didriksen, Lisbeth Lund, Niklas Lindahl, Sara Hallum, Ning Liang, Wenjing Xiong, Xuemei Yang, Pernille Brunsgaard, Alexandre Garioud, Sanam Safi, Jane Lindschou, Jens Kondrup, Christian Gluud, Janus C Jakobsen | |
| 2015 Mar 19 | Nutrition support in hospitalised adults at nutritional risk | Protocol | Joshua Feinberg, Emil Eik Nielsen, Christian Gluud, Jane Lindschou, Jens Kondrup, Janus C Jakobsen | |
Differences between protocol and review
-
Added 'mixed' as a possibility in the subgroup comparing trials with different types of intervention.
-
We only require participants to be blinded for 'low risk of bias' for outcome assessment when assessing participant‐reported outcomes such as quality of life.
-
Changed the alpha from 3% to 2.5%. We had miscalculated the adjusted alpha according to Jakobsen 2014.
-
We performed post hoc Trial Sequential Analyses of the different modes of delivery and major surgery participants.
-
Adequate range was changed from '20 kcal/kg to 30 kcal/kg' into '20 kcal/kg to 35 kcal/kg'. In our original definition, participants receiving 30 ‐ 35 kcal/kg were not placed into any category. This did not change any of our results in terms of statistical significance.
-
We added that immuno‐nutrition include branched chain amino acid‐enriched formulas.
-
Solutions of dextrose/glucose of 5% to 10% are considered standard care, even if not explicitly stated in the trial.
Keywords
MeSH
Medical Subject Headings (MeSH) Keywords
- *Food, Fortified [statistics & numerical data];
- *Nutritional Support [adverse effects, statistics & numerical data];
- Body Weight;
- Cause of Death;
- Enteral Nutrition [adverse effects, statistics & numerical data];
- Hospitalization;
- Malnutrition [mortality, *prevention & control];
- Parenteral Nutrition [adverse effects, statistics & numerical data];
- Quality of Life;
- Randomized Controlled Trials as Topic;
Medical Subject Headings Check Words
Adult; Humans;
PICO

Study flow diagram.

Risk of bias summary: review authors' judgements about each risk of bias item for each included study.

Risk of bias graph: review authors' judgements about each risk of bias item presented as percentages across all included studies.

Trial Sequential Analysis on all‐cause mortality (end of intervention) in 114 high risk of bias trials. The diversity‐adjusted required information size (RIS) was calculated based on mortality in the control group of 8.29%; risk ratio reduction of 20% in the experimental group; type I error of 2.5%; and type II error of 20% (80% power). No diversity was noted. The required information size was 9526 participants. The cumulative Z‐curve (blue line) did not cross the trial sequential monitoring boundaries for benefit or harm (red inward sloping lines). The cumulative Z‐curve crossed the inner‐wedge futility line (red outward sloping lines). Additionally the cumulative Z‐score crossed the RIS. The green dotted line shows conventional boundaries (2.5%).

Trial Sequential Analysis on serious adverse events (maximum follow‐up) in 137 high risk of bias trials. The diversity‐adjusted required information size (RIS) was calculated based on an incidence rate of serious adverse event in the control group of 15.2%; risk ratio reduction of 10% in the experimental group; type I error of 2.5%; and type II error of 20% (80% power). No diversity was noted. The required information size was 19535 participants. The cumulative Z‐curve (blue line) did not cross the trial sequential monitoring boundaries for benefit or harm (red inward sloping lines). The cumulative Z‐curve crossed the inner‐wedge futility line (red outward sloping lines) indicating that sufficient information is provided. Additionally the cumulative Z‐score crossed the RIS. The green dotted line shows conventional boundaries (2.5%). The cumulative Z‐curve later crosses the green line, indicating a possible significant effect, but one that is smaller than a 10% risk ratio reduction.

Trial Sequential Analysis on serious adverse events (maximum follow‐up) with participants receiving enteral nutrition in 49 high risk of bias trials. The diversity‐adjusted required information size (RIS) was calculated based on an incidence rate of serious adverse event in the control group of 17.2%; risk ratio reduction of 20% in the experimental group; type I error of 2.5%; and type II error of 20% (80% power). No diversity was noted. The required information size was 4444 participants. The cumulative Z‐curve (blue line) did cross the trial sequential monitoring boundaries for benefit (red inward sloping lines) indicating that enteral nutrition may result in a 20% or greater risk ratio reduction of serious adverse events at maximum follow‐up. The cumulative Z‐curve did not cross the inner‐wedge futility line (red outward sloping lines). The green dotted line shows conventional boundaries (2.5%).

Comparison 1 All‐cause mortality ‐ end of intervention, Outcome 1 All‐cause mortality ‐ overall.

Comparison 1 All‐cause mortality ‐ end of intervention, Outcome 2 All‐cause mortality ‐ bias.
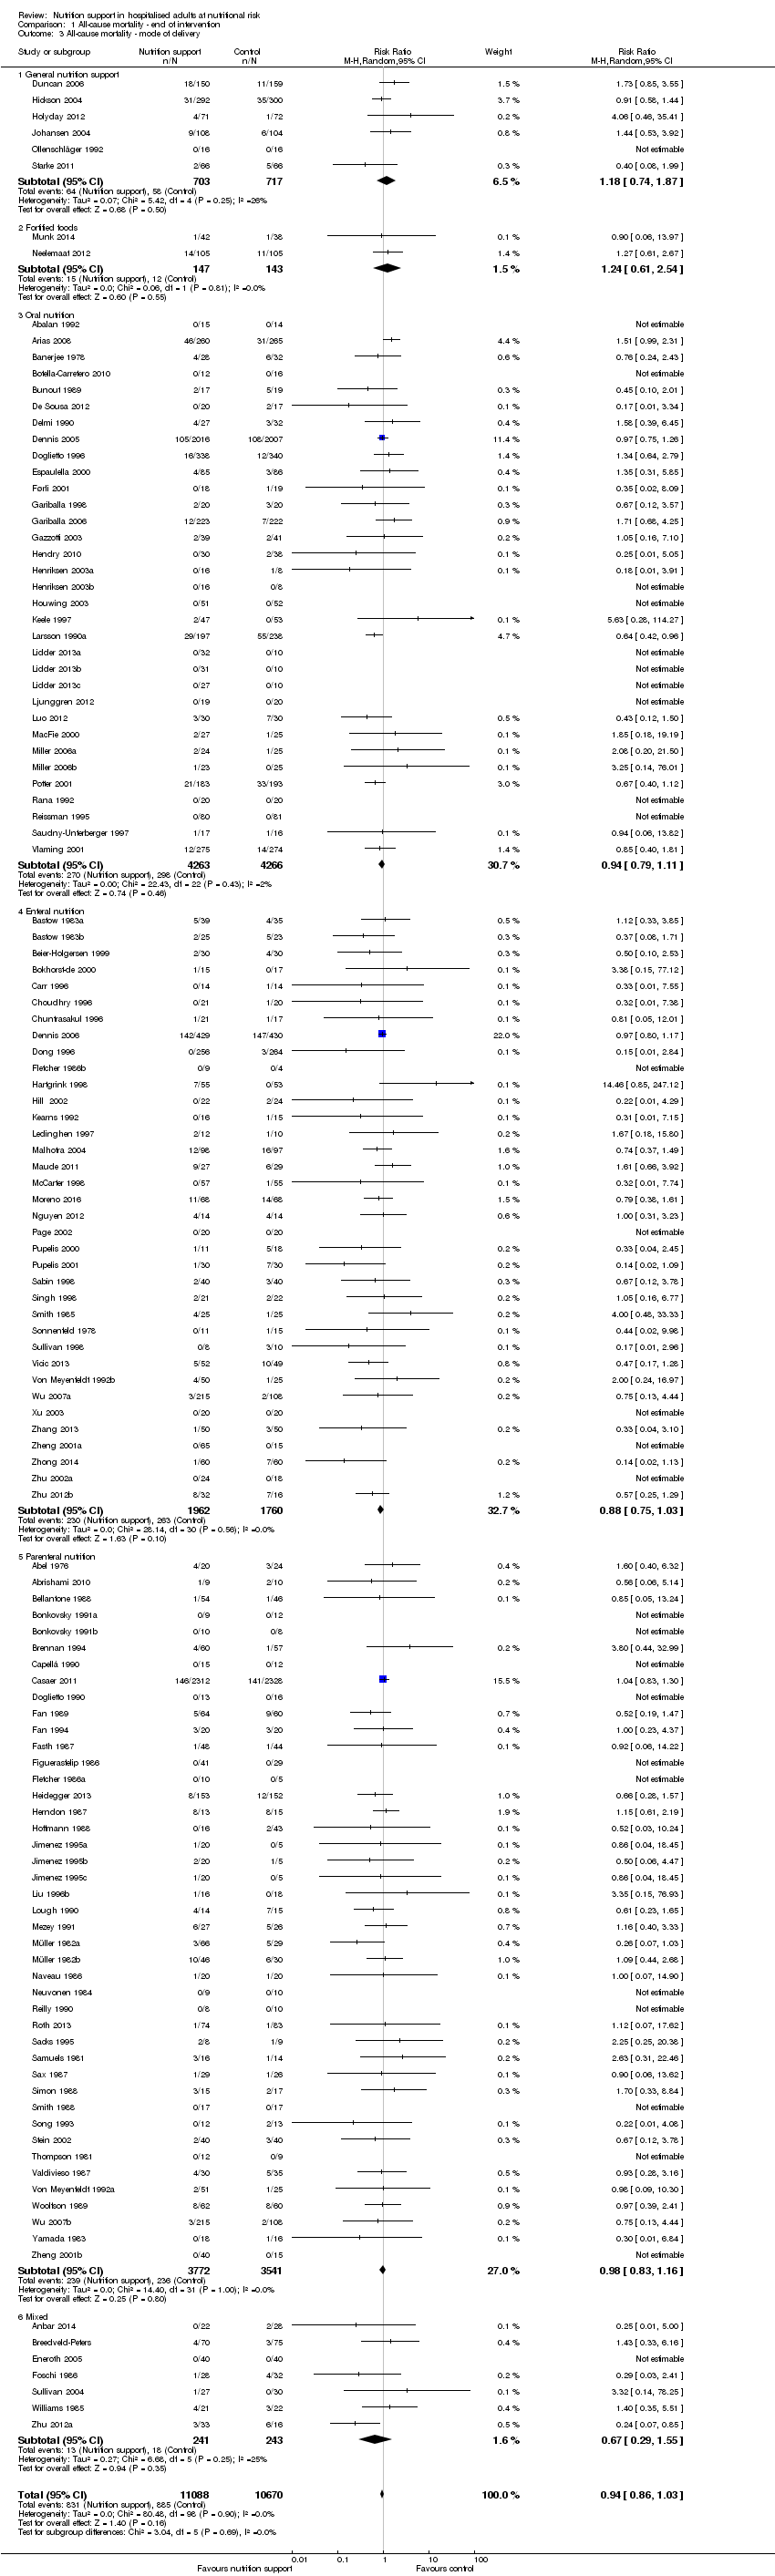
Comparison 1 All‐cause mortality ‐ end of intervention, Outcome 3 All‐cause mortality ‐ mode of delivery.

Comparison 1 All‐cause mortality ‐ end of intervention, Outcome 4 All‐cause mortality ‐ medical specialty.

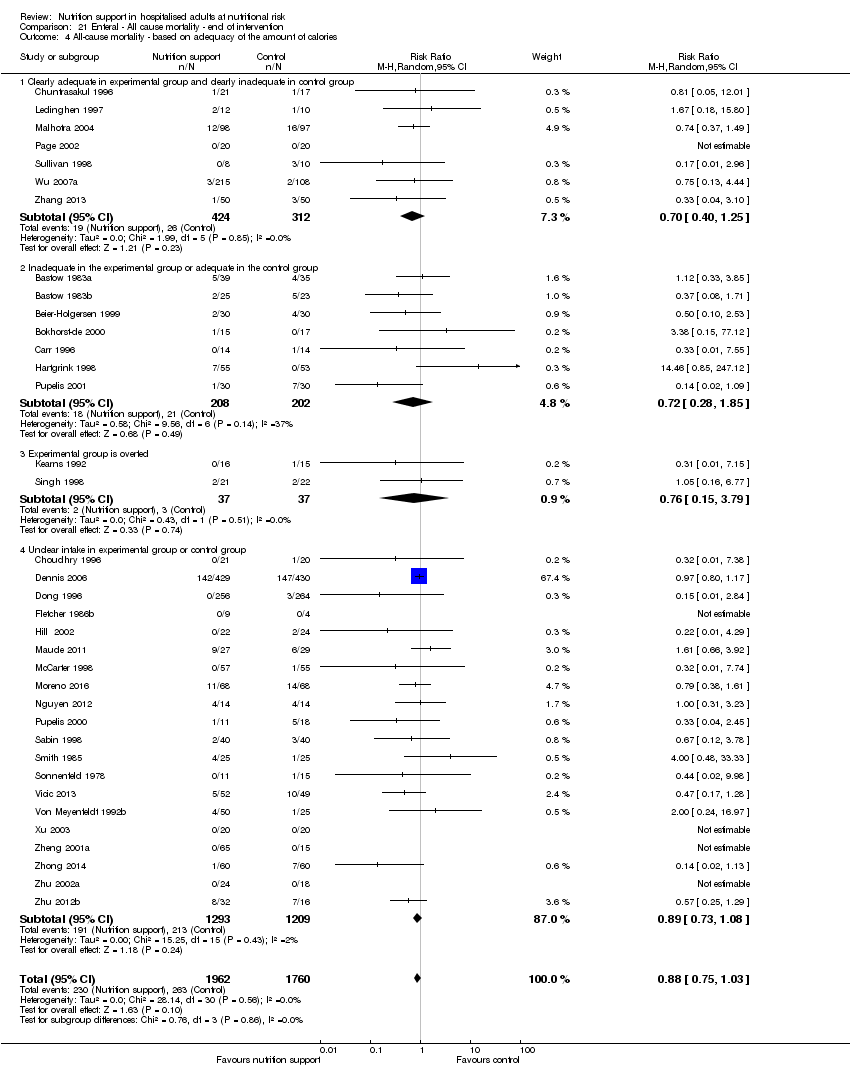
Comparison 1 All‐cause mortality ‐ end of intervention, Outcome 5 All‐cause mortality ‐ based on adequacy of the amount of calories.

Comparison 1 All‐cause mortality ‐ end of intervention, Outcome 6 All‐cause mortality ‐ different screening tools.

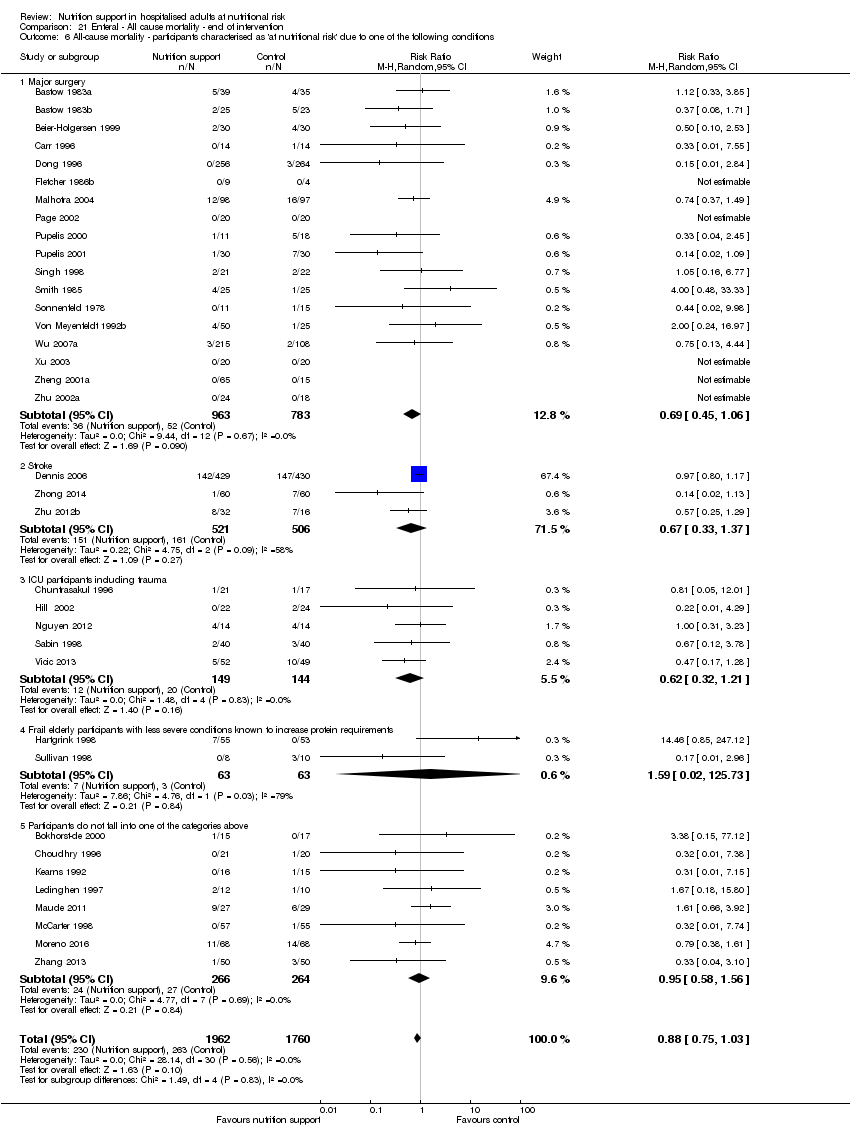
Comparison 1 All‐cause mortality ‐ end of intervention, Outcome 7 All‐cause mortality ‐ participants characterised as 'at nutritional risk' due to one of the following conditions.
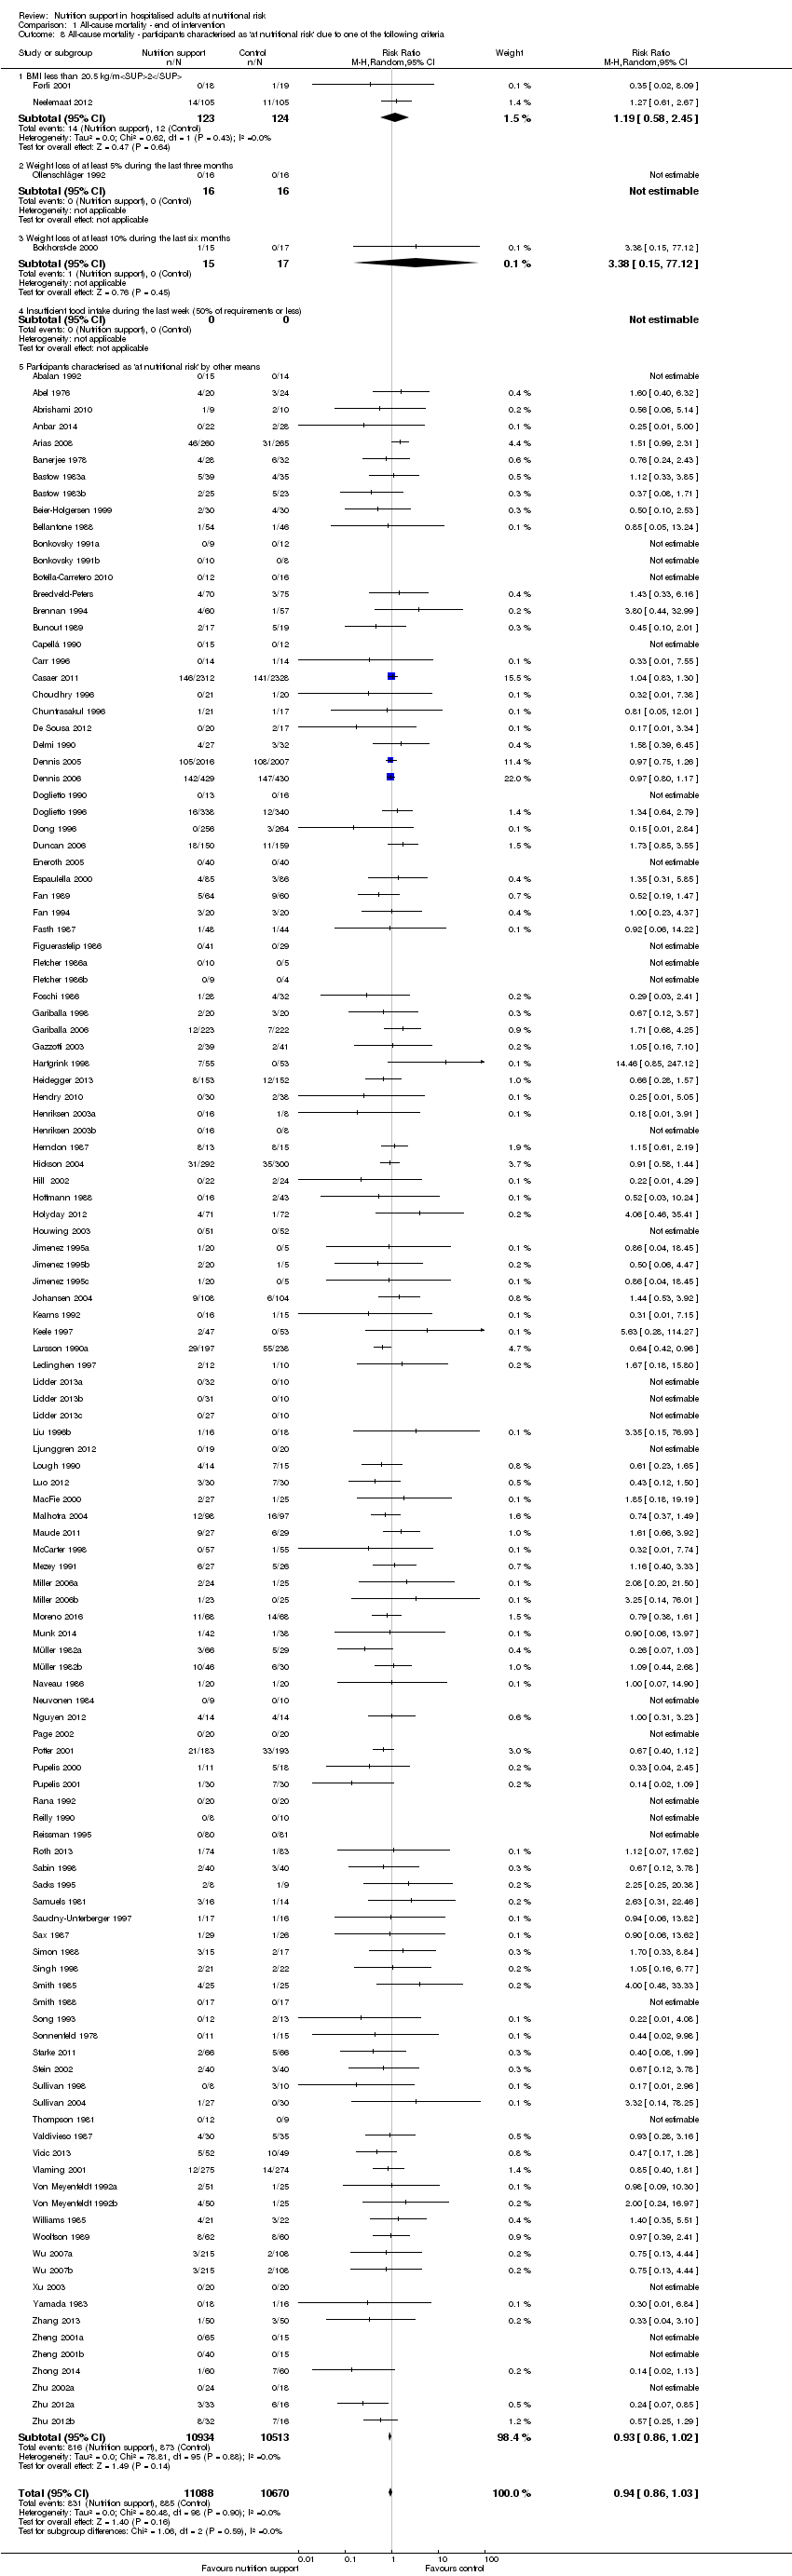
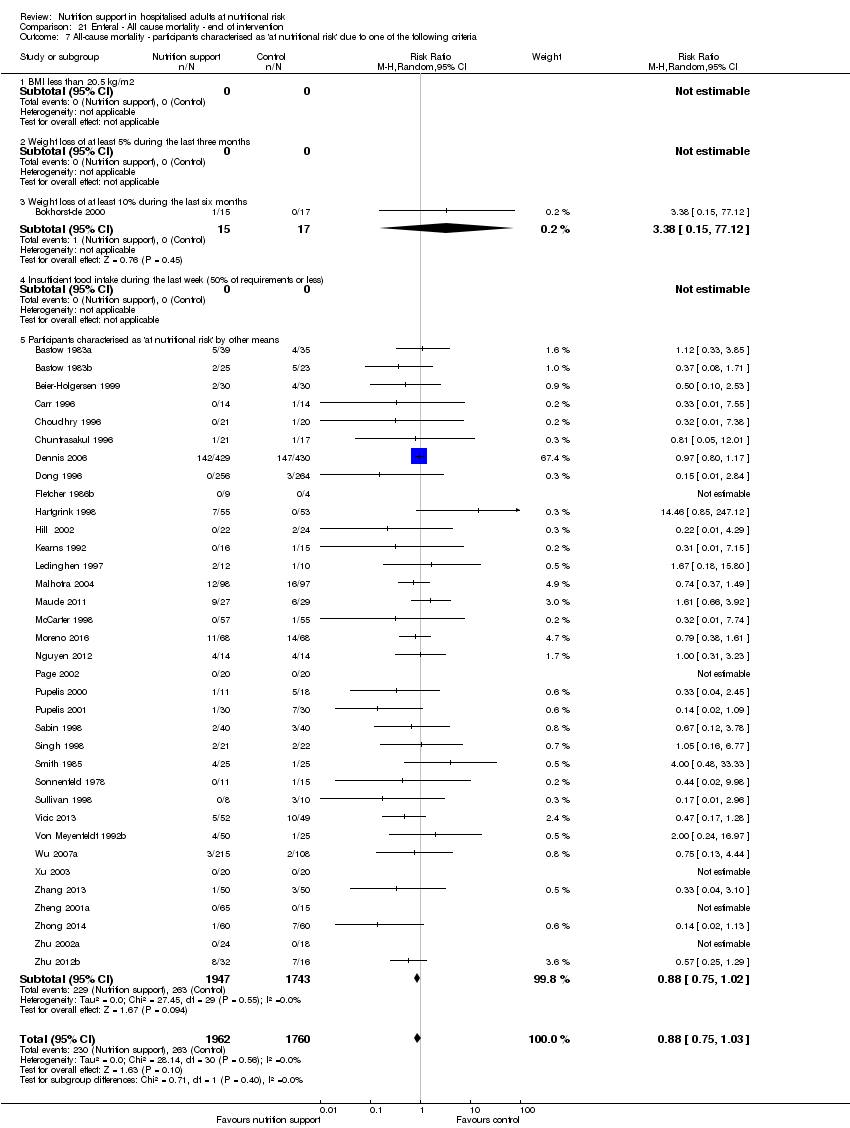
Comparison 1 All‐cause mortality ‐ end of intervention, Outcome 8 All‐cause mortality ‐ participants characterised as 'at nutritional risk' due to one of the following criteria.

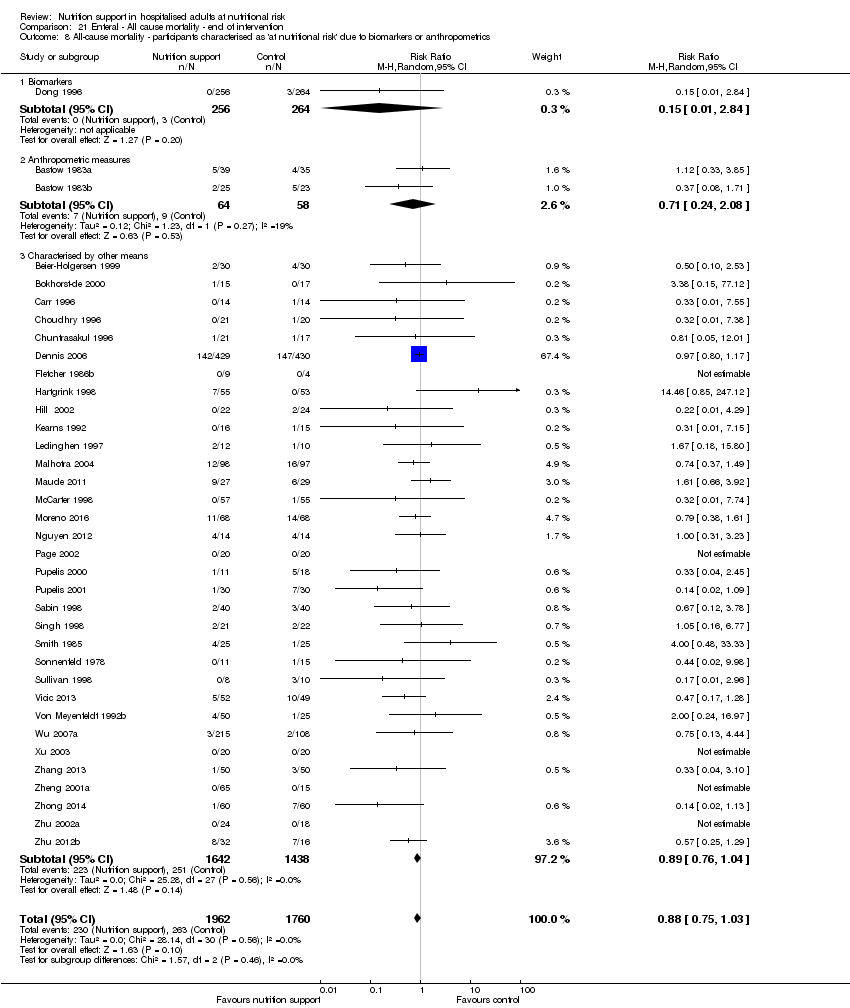
Comparison 1 All‐cause mortality ‐ end of intervention, Outcome 9 All‐cause mortality ‐ participants characterised as 'at nutritional risk' due to biomarkers or anthropometrics.

Comparison 1 All‐cause mortality ‐ end of intervention, Outcome 10 All‐cause mortality ‐ randomisation year.
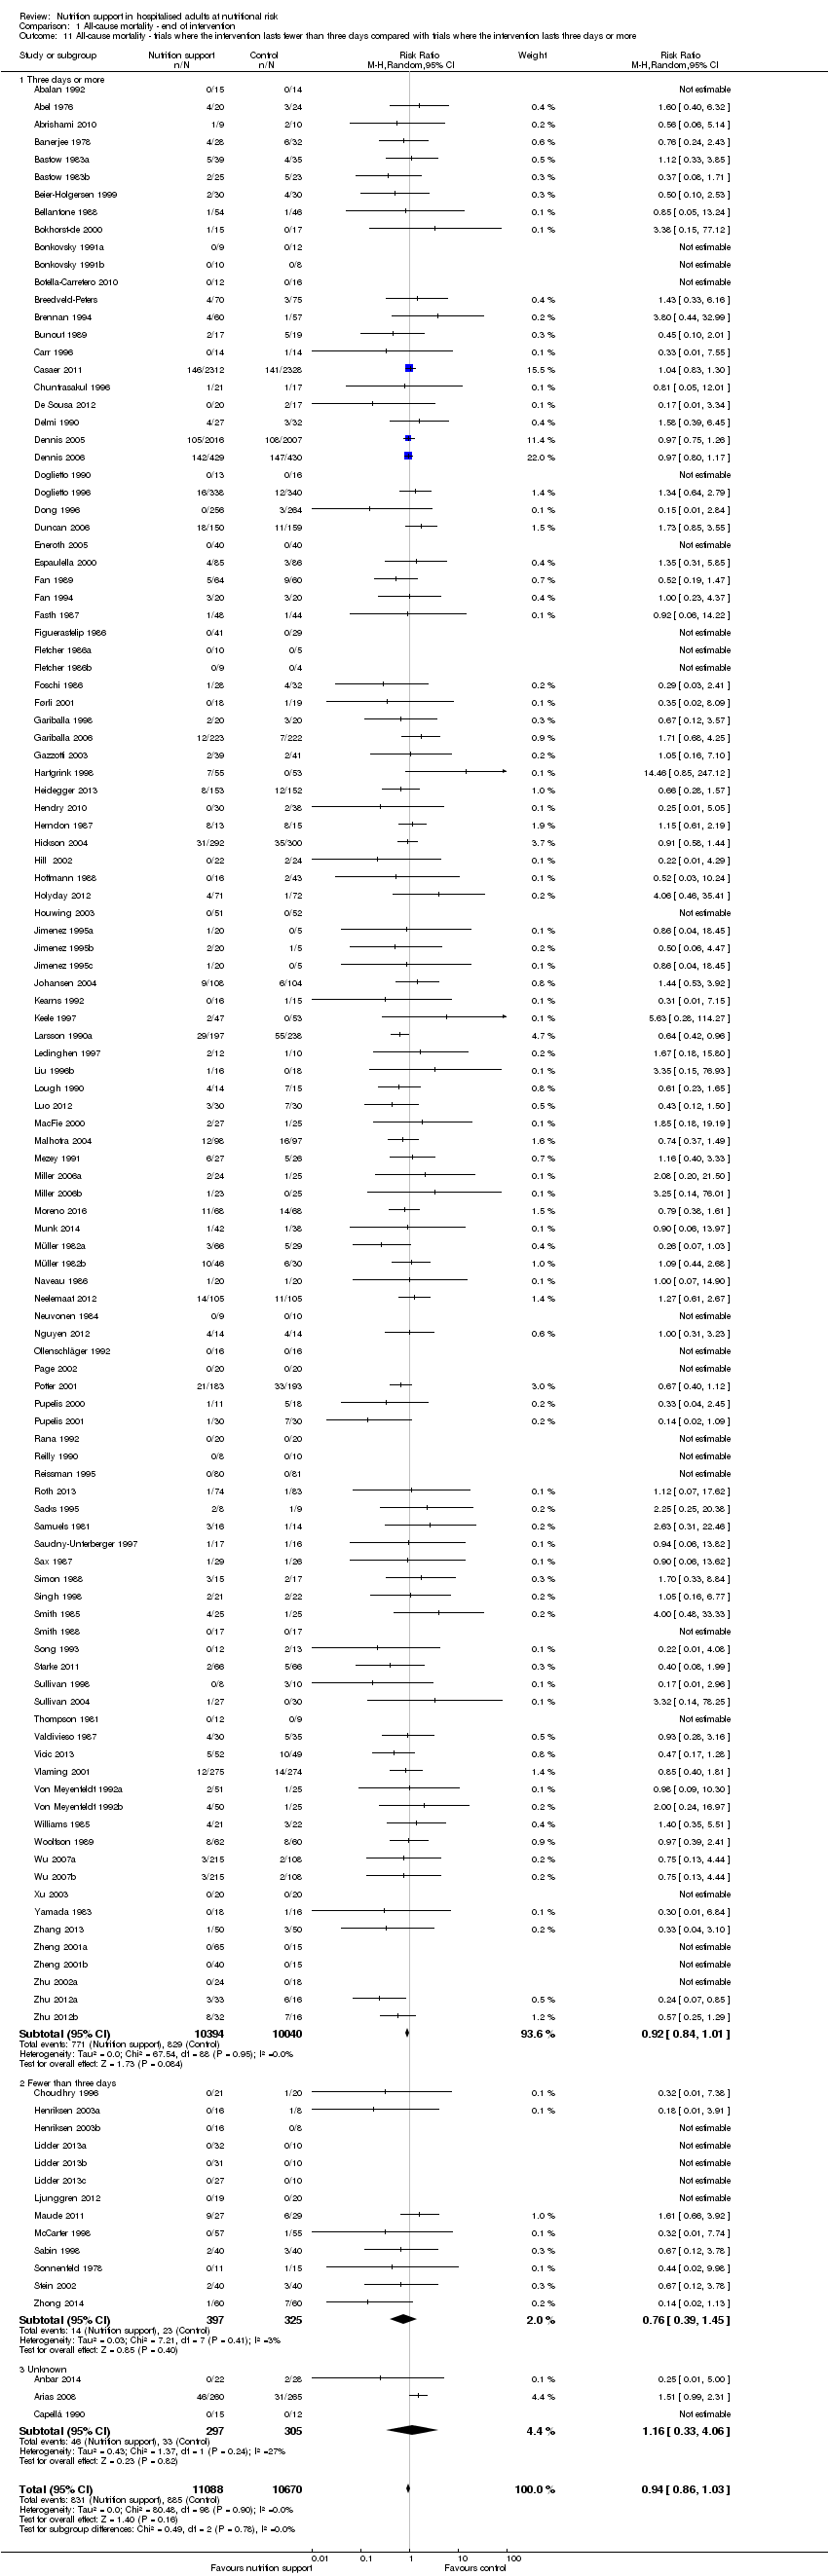
Comparison 1 All‐cause mortality ‐ end of intervention, Outcome 11 All‐cause mortality ‐ trials where the intervention lasts fewer than three days compared with trials where the intervention lasts three days or more.
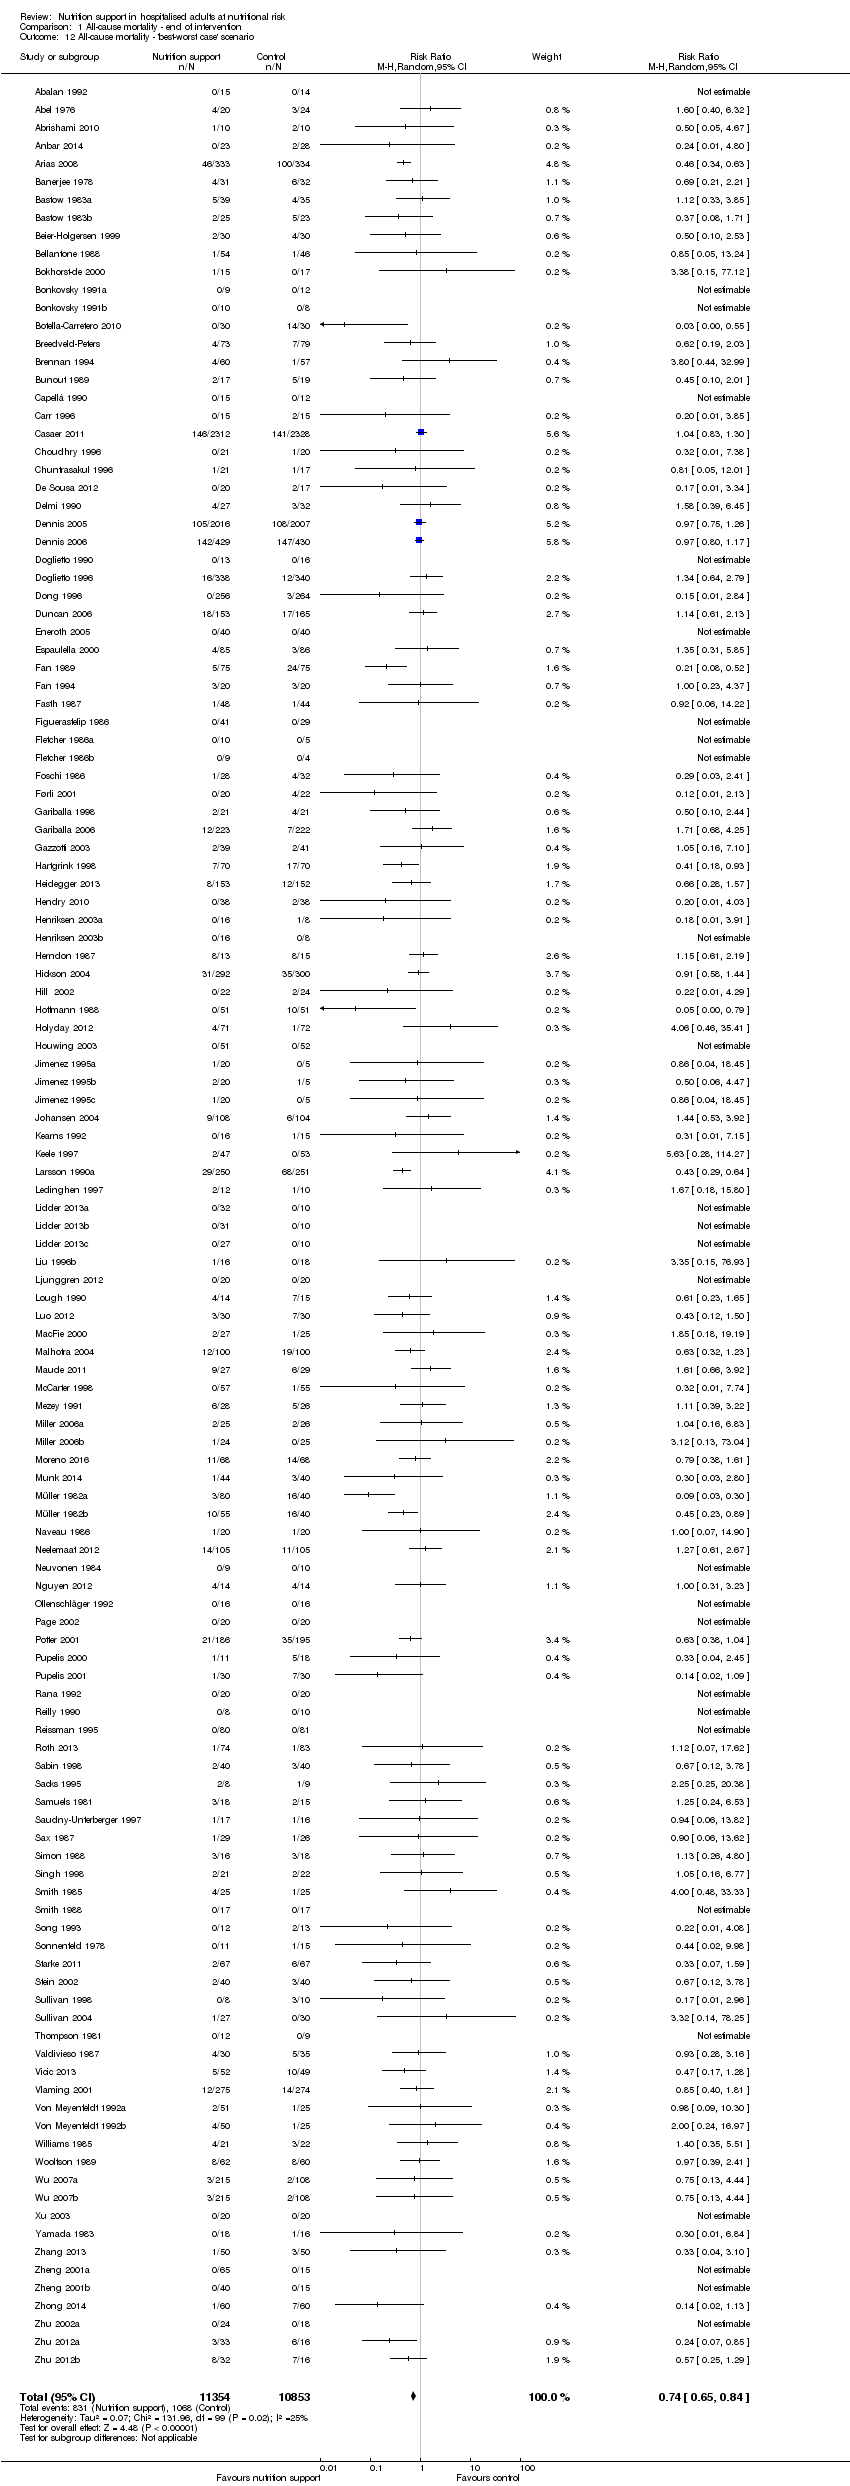
Comparison 1 All‐cause mortality ‐ end of intervention, Outcome 12 All‐cause mortality ‐ 'best‐worst case' scenario.

Comparison 1 All‐cause mortality ‐ end of intervention, Outcome 13 All‐cause mortality ‐ 'worst‐best case' scenario.

Comparison 1 All‐cause mortality ‐ end of intervention, Outcome 14 All‐cause mortality co‐interventions.

Comparison 2 All‐cause mortality ‐ maximum follow‐up, Outcome 1 All‐cause mortality ‐ overall.

Comparison 2 All‐cause mortality ‐ maximum follow‐up, Outcome 2 All‐cause mortality ‐ bias.

Comparison 2 All‐cause mortality ‐ maximum follow‐up, Outcome 3 All‐cause mortality ‐ mode of delivery.

Comparison 2 All‐cause mortality ‐ maximum follow‐up, Outcome 4 All‐cause mortality ‐ medical specialty.

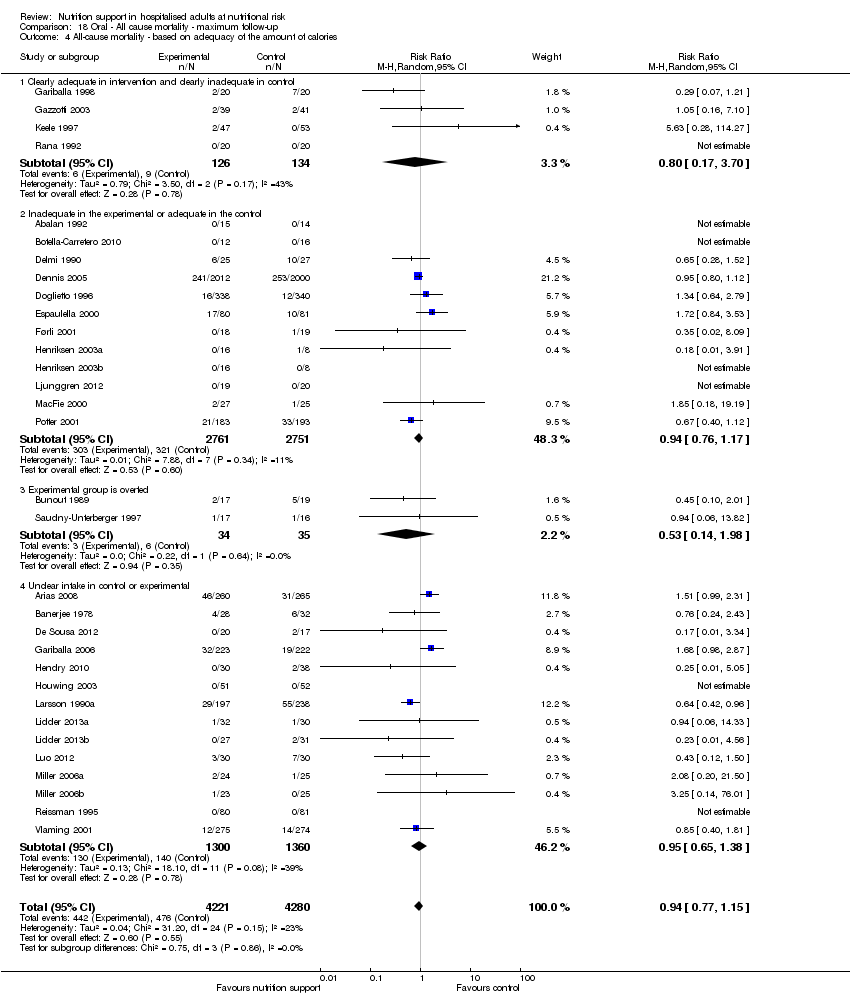
Comparison 2 All‐cause mortality ‐ maximum follow‐up, Outcome 5 All‐cause mortality ‐ based on adequacy of the amount of calories.

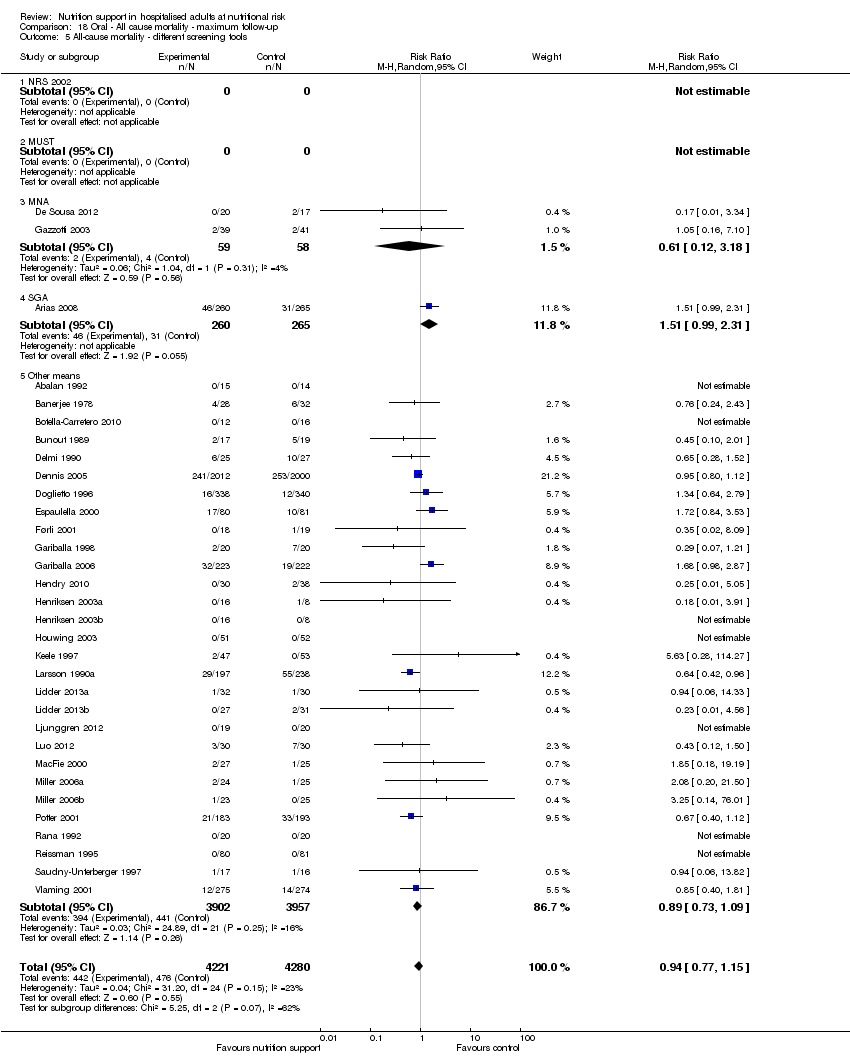
Comparison 2 All‐cause mortality ‐ maximum follow‐up, Outcome 6 All‐cause mortality ‐ different screening tools.

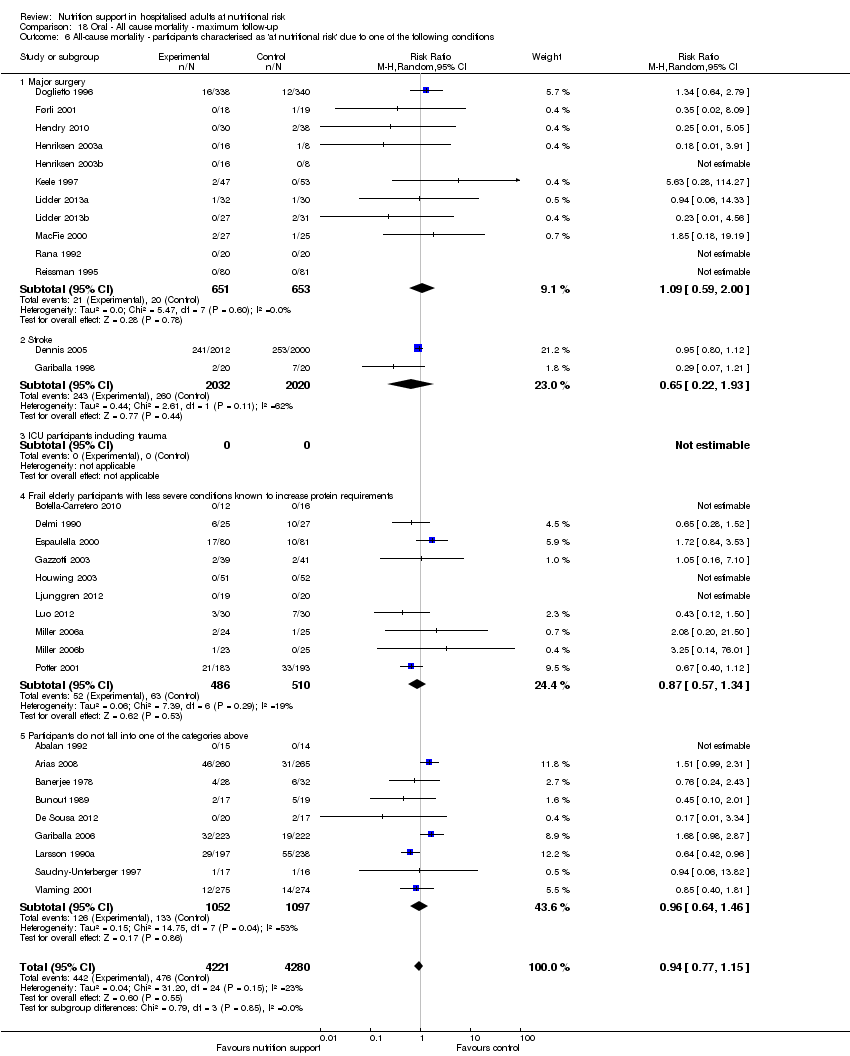
Comparison 2 All‐cause mortality ‐ maximum follow‐up, Outcome 7 All‐cause mortality ‐ participants characterised as 'at nutritional risk' due to one of the following conditions.

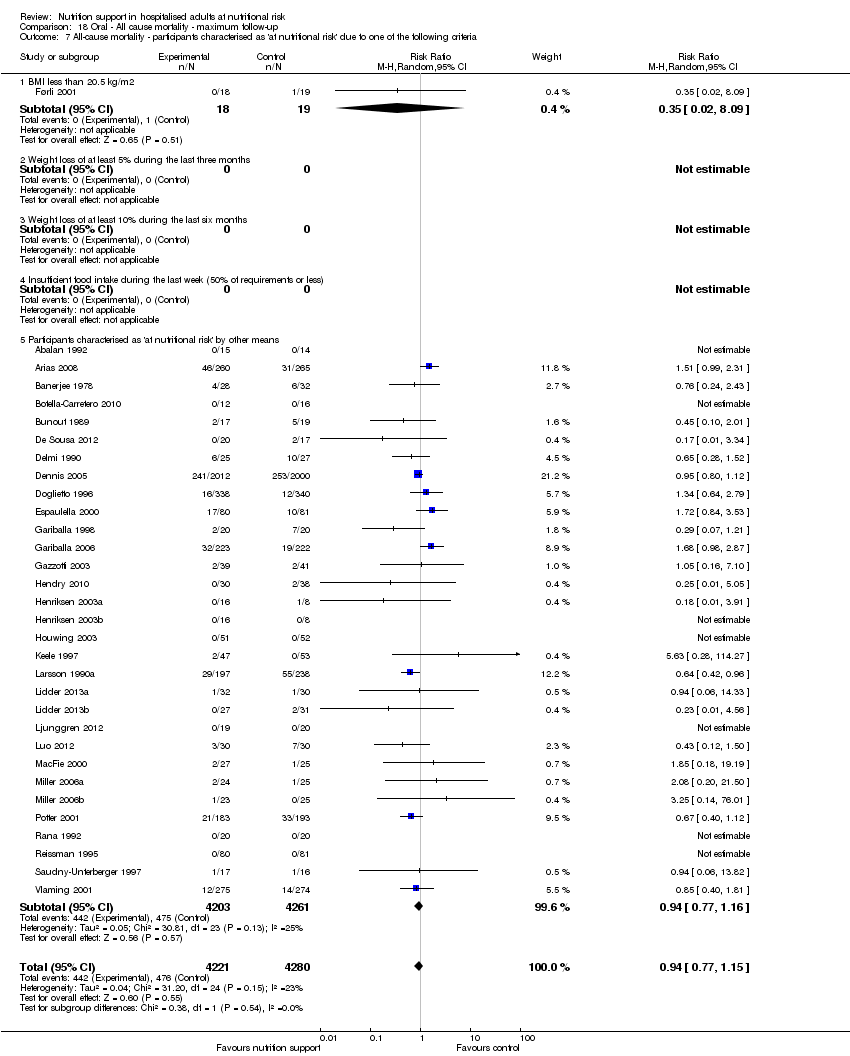
Comparison 2 All‐cause mortality ‐ maximum follow‐up, Outcome 8 All‐cause mortality ‐ participants characterised as 'at nutritional risk' due to one of the following criteria.

Comparison 2 All‐cause mortality ‐ maximum follow‐up, Outcome 9 All‐cause mortality ‐ participants characterised as 'at nutritional risk' due to biomarkers or anthropometrics.

Comparison 2 All‐cause mortality ‐ maximum follow‐up, Outcome 10 All‐cause mortality ‐ randomisation year.
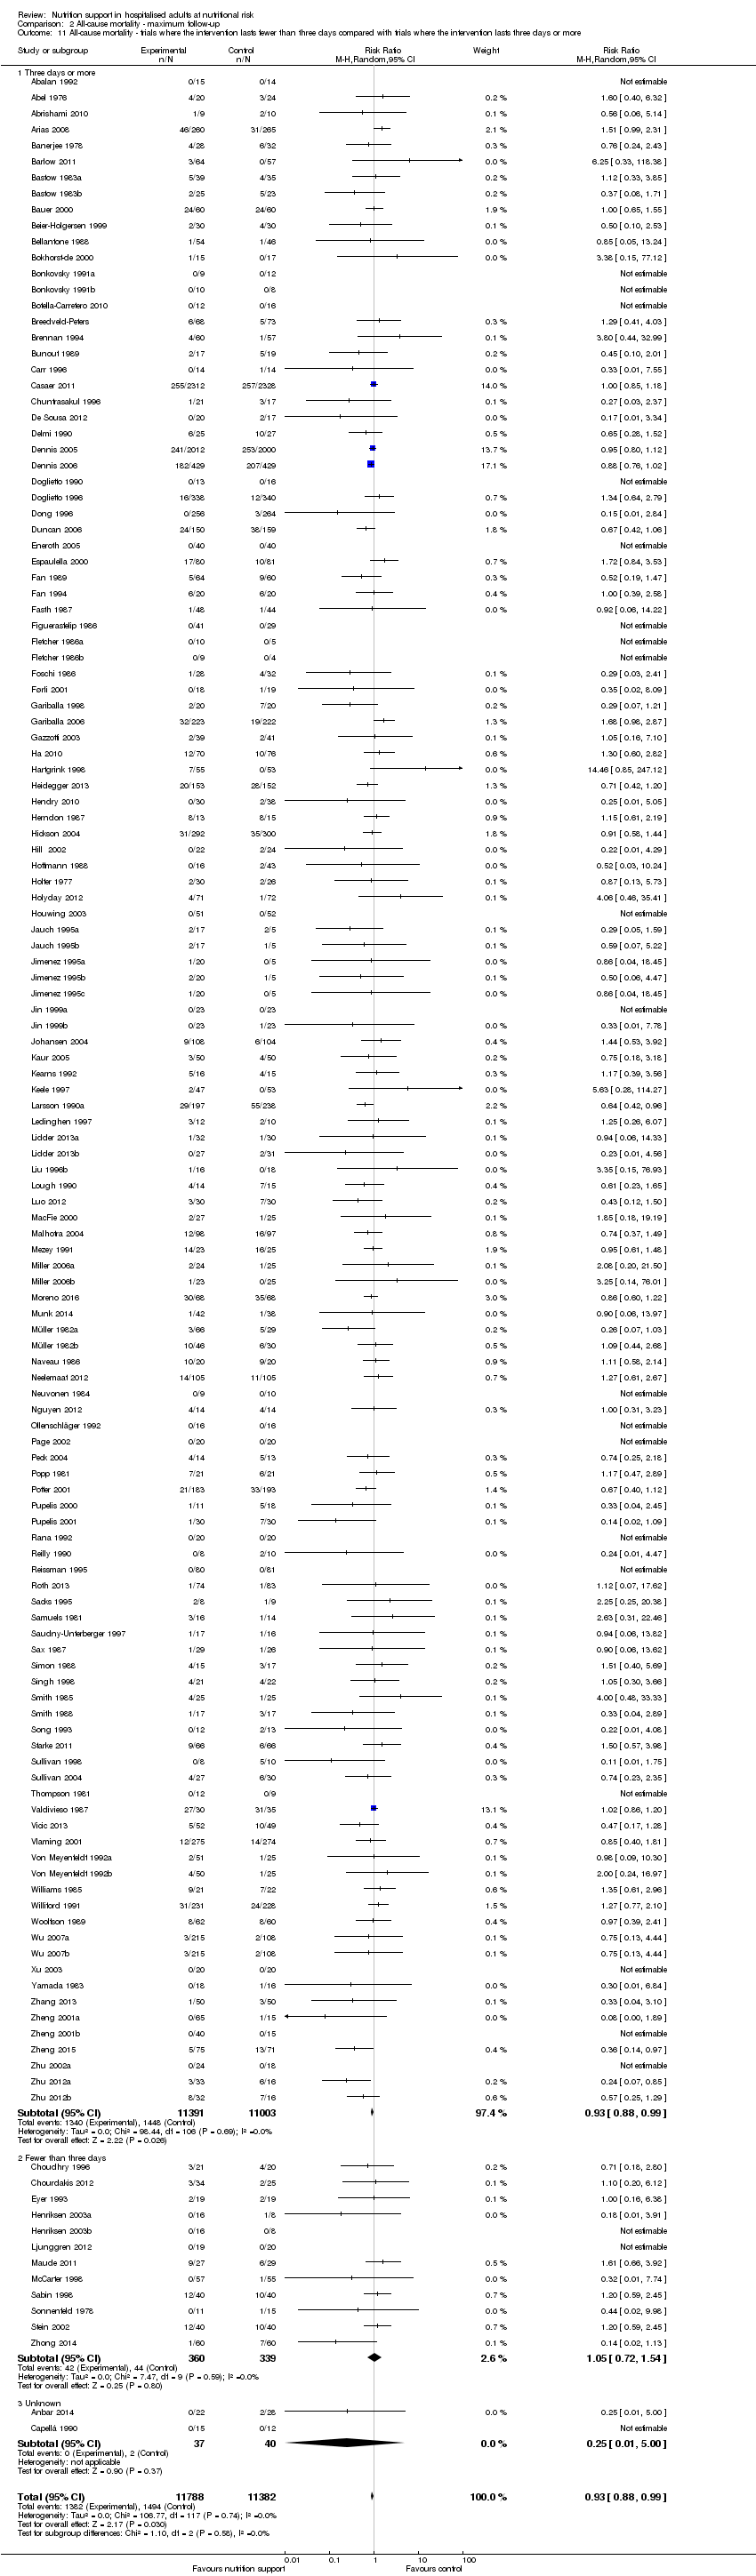
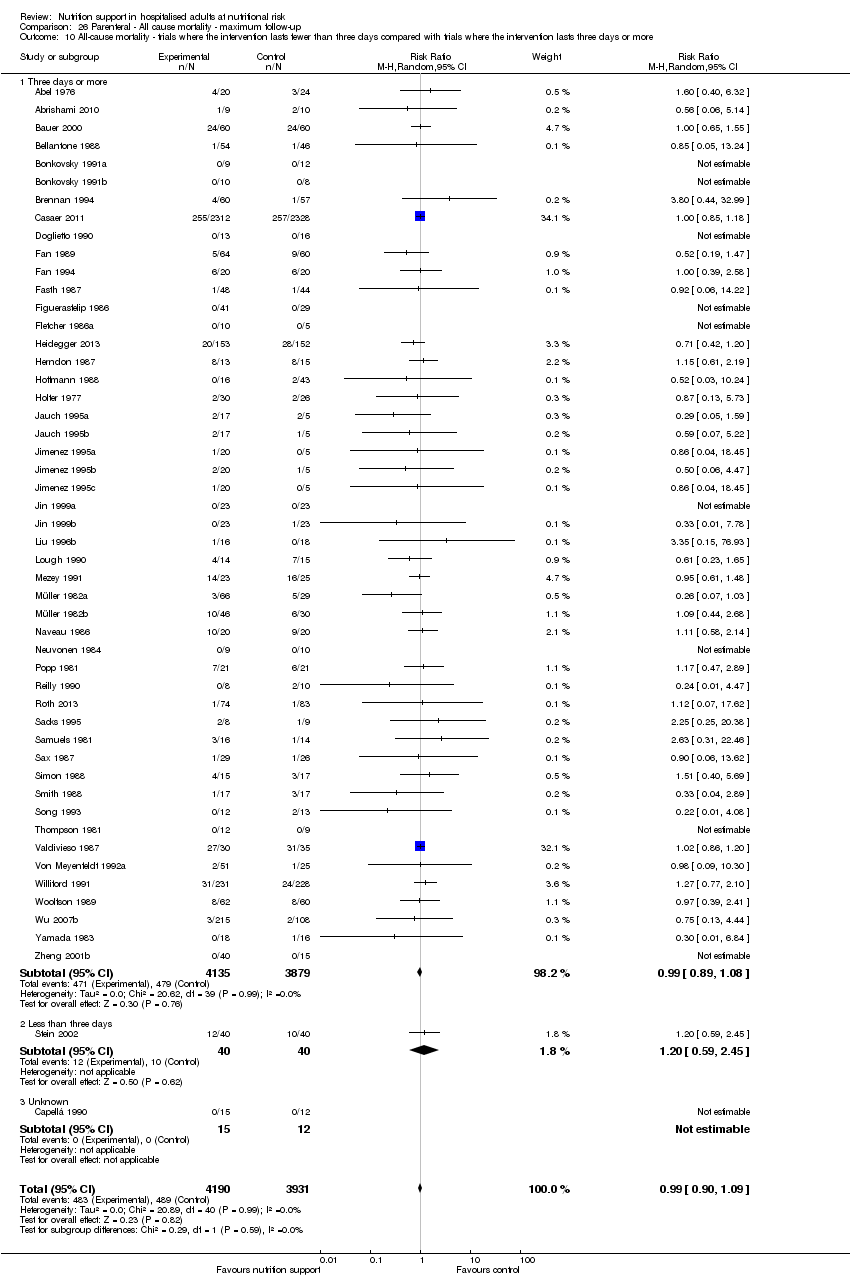
Comparison 2 All‐cause mortality ‐ maximum follow‐up, Outcome 11 All‐cause mortality ‐ trials where the intervention lasts fewer than three days compared with trials where the intervention lasts three days or more.

Comparison 2 All‐cause mortality ‐ maximum follow‐up, Outcome 12 All‐cause mortality ‐ 'best‐worst case' scenario.

Comparison 2 All‐cause mortality ‐ maximum follow‐up, Outcome 13 All‐cause mortality ‐ 'worst‐best case' scenario.

Comparison 2 All‐cause mortality ‐ maximum follow‐up, Outcome 14 All‐cause mortality co‐interventions.
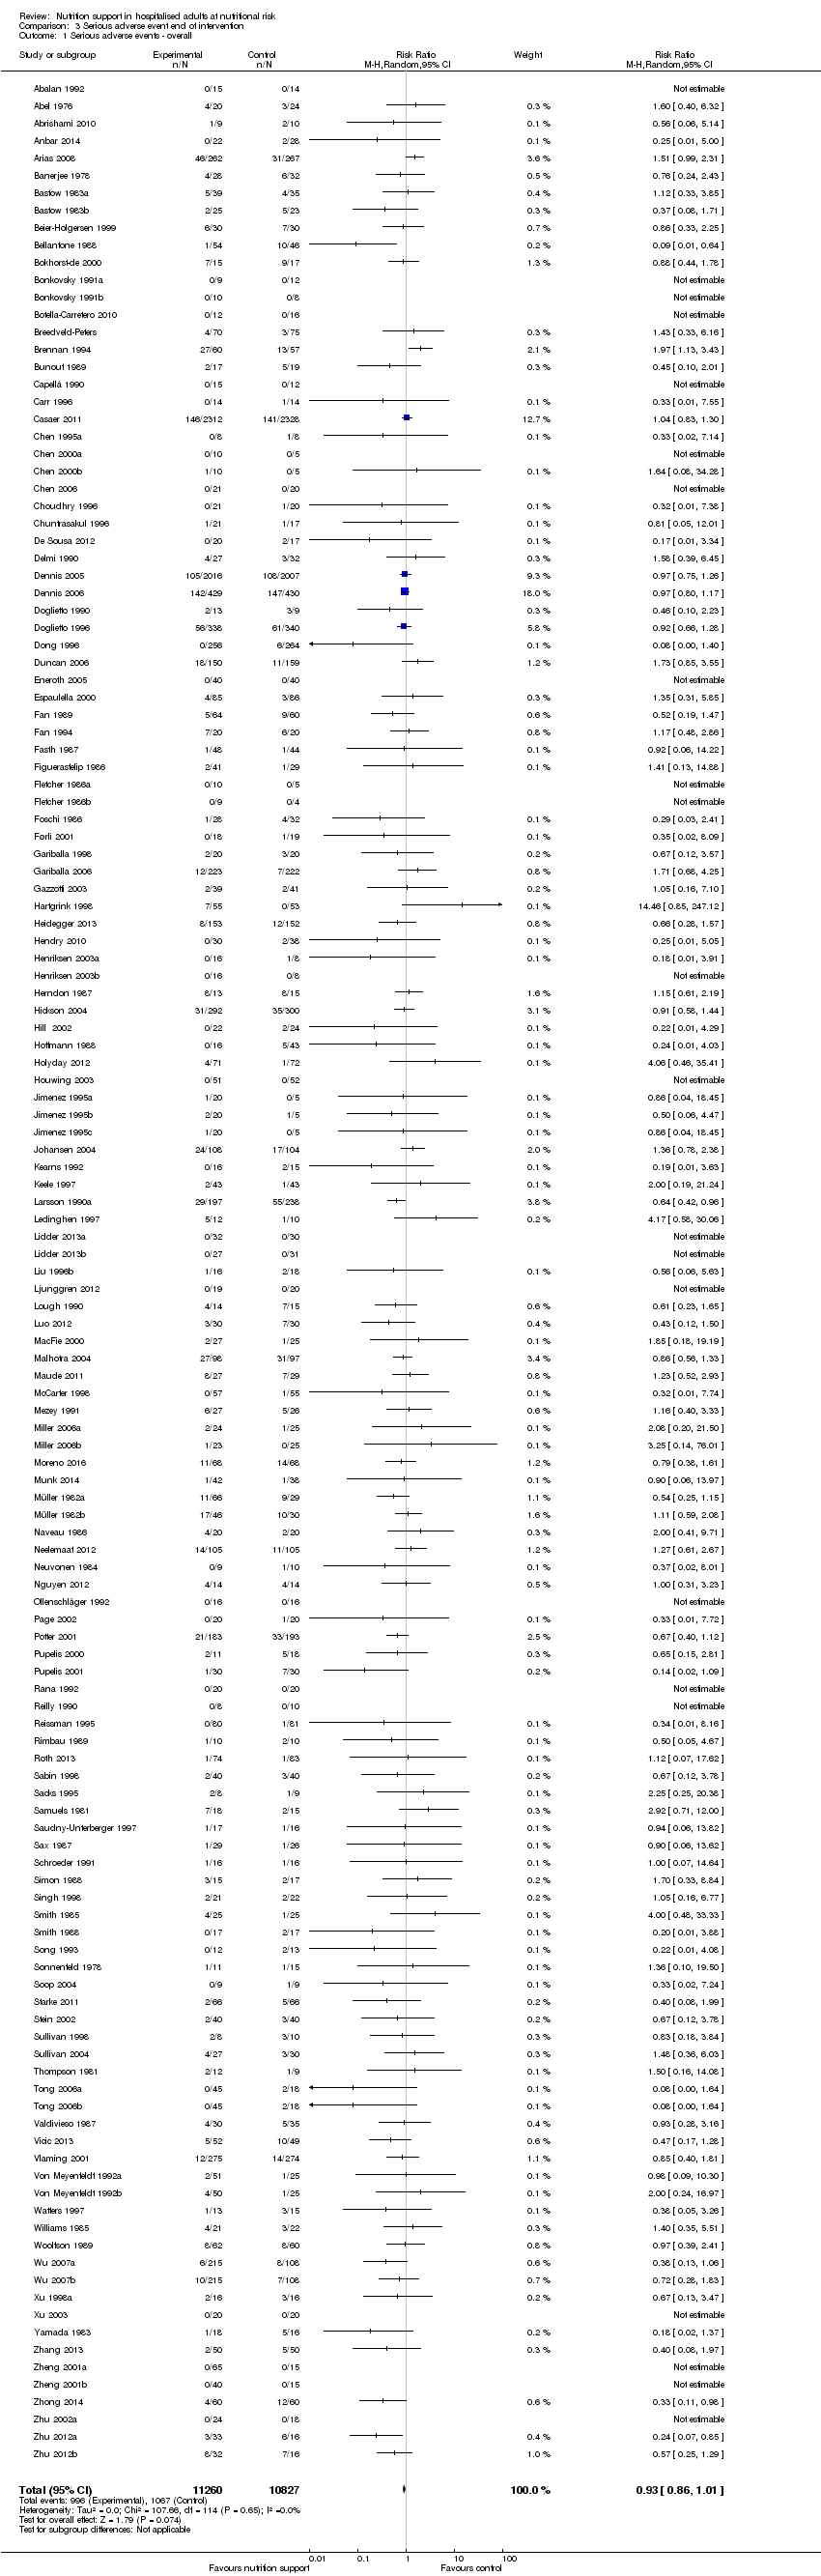
Comparison 3 Serious adverse event end of intervention, Outcome 1 Serious adverse events ‐ overall.

Comparison 3 Serious adverse event end of intervention, Outcome 2 Serious adverse events ‐ bias.

Comparison 3 Serious adverse event end of intervention, Outcome 3 Serious adverse events ‐ mode of delivery.

Comparison 3 Serious adverse event end of intervention, Outcome 4 Serious adverse events ‐ by medical specialty.

Comparison 3 Serious adverse event end of intervention, Outcome 5 Serious adverse events ‐ based on adequacy of the amount of calories.

Comparison 3 Serious adverse event end of intervention, Outcome 6 Serious adverse events ‐ different screening tools.

Comparison 3 Serious adverse event end of intervention, Outcome 7 Serious adverse events ‐ participants characterised as 'at nutritional risk' due to one of the following conditions.
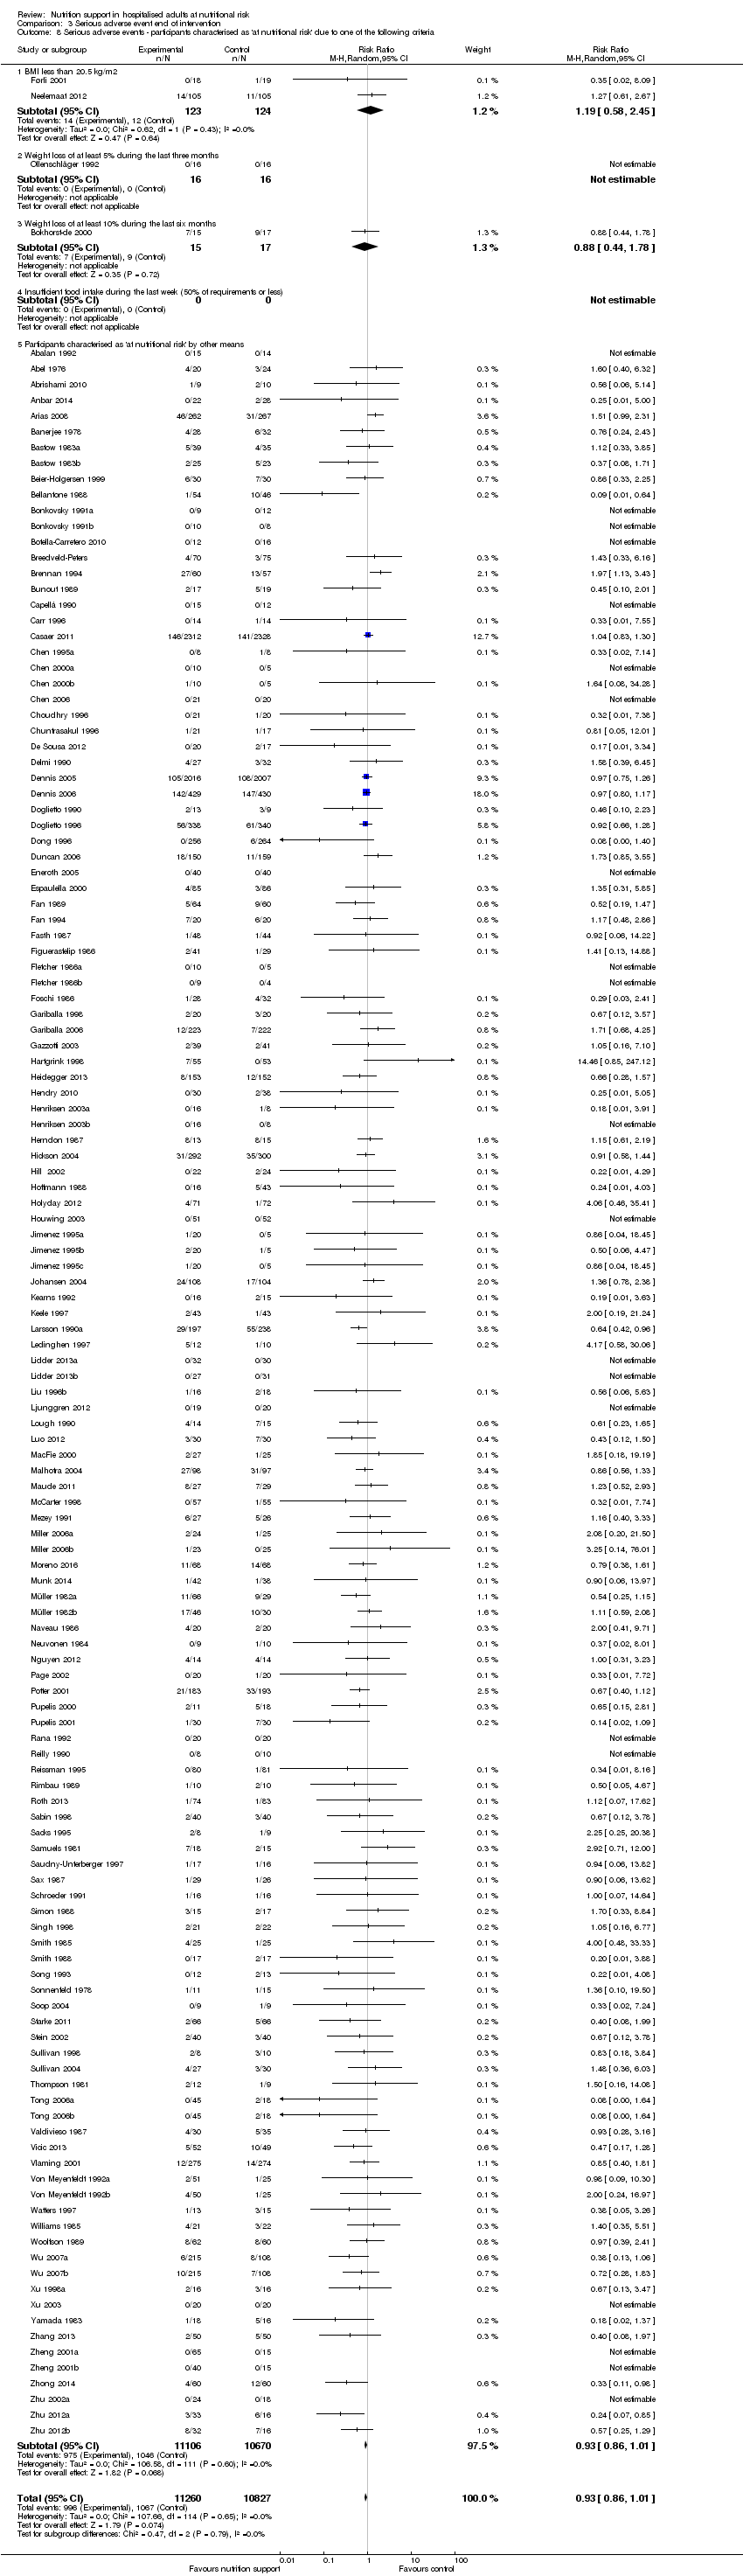
Comparison 3 Serious adverse event end of intervention, Outcome 8 Serious adverse events ‐ participants characterised as 'at nutritional risk' due to one of the following criteria.

Comparison 3 Serious adverse event end of intervention, Outcome 9 Serious adverse events ‐ participants characterised as 'at nutritional risk' due to biomarkers or anthropometrics.
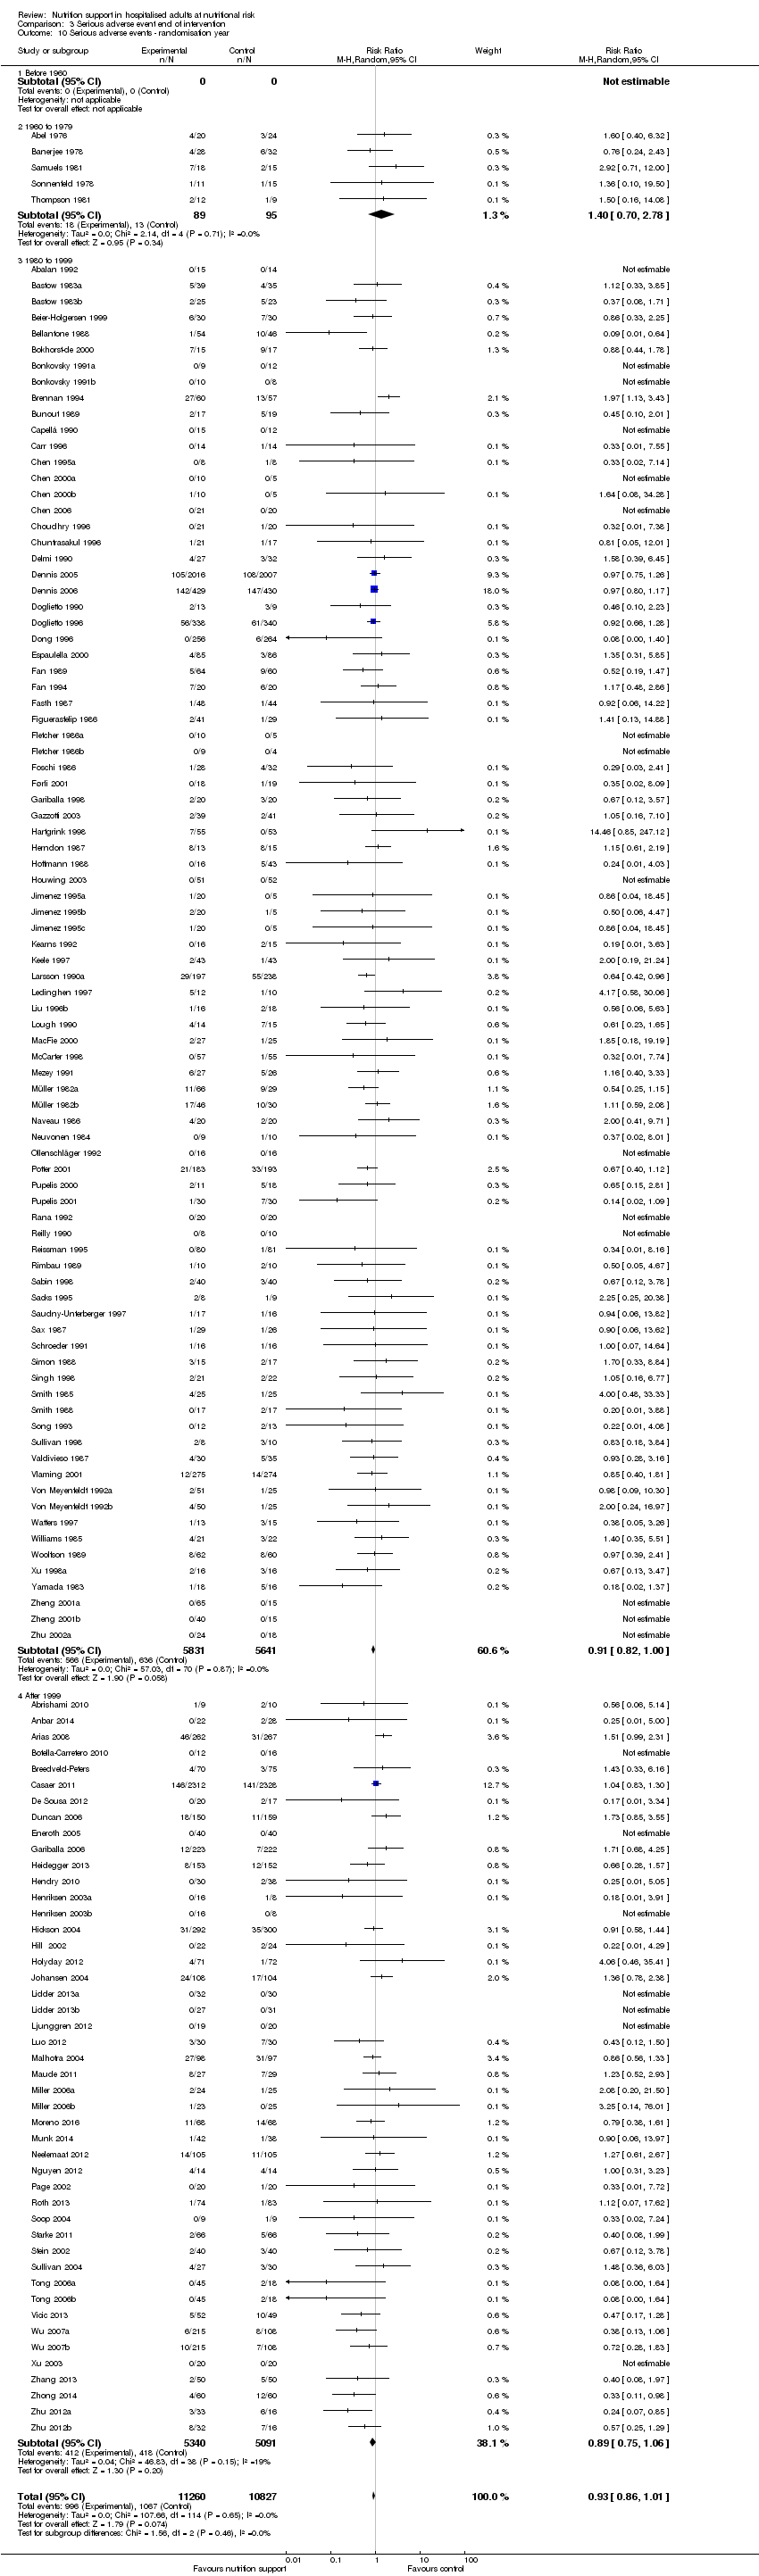
Comparison 3 Serious adverse event end of intervention, Outcome 10 Serious adverse events ‐ randomisation year.

Comparison 3 Serious adverse event end of intervention, Outcome 11 Serious adverse events ‐ trials where the intervention lasts fewer than three days compared with trials where the intervention lasts three days or more.

Comparison 3 Serious adverse event end of intervention, Outcome 12 Serious adverse events ‐ 'best‐worst case' scenario.

Comparison 3 Serious adverse event end of intervention, Outcome 13 Serious adverse events ‐ 'worst‐best case' scenario.

Comparison 3 Serious adverse event end of intervention, Outcome 14 Serious adverse events co‐interventions.
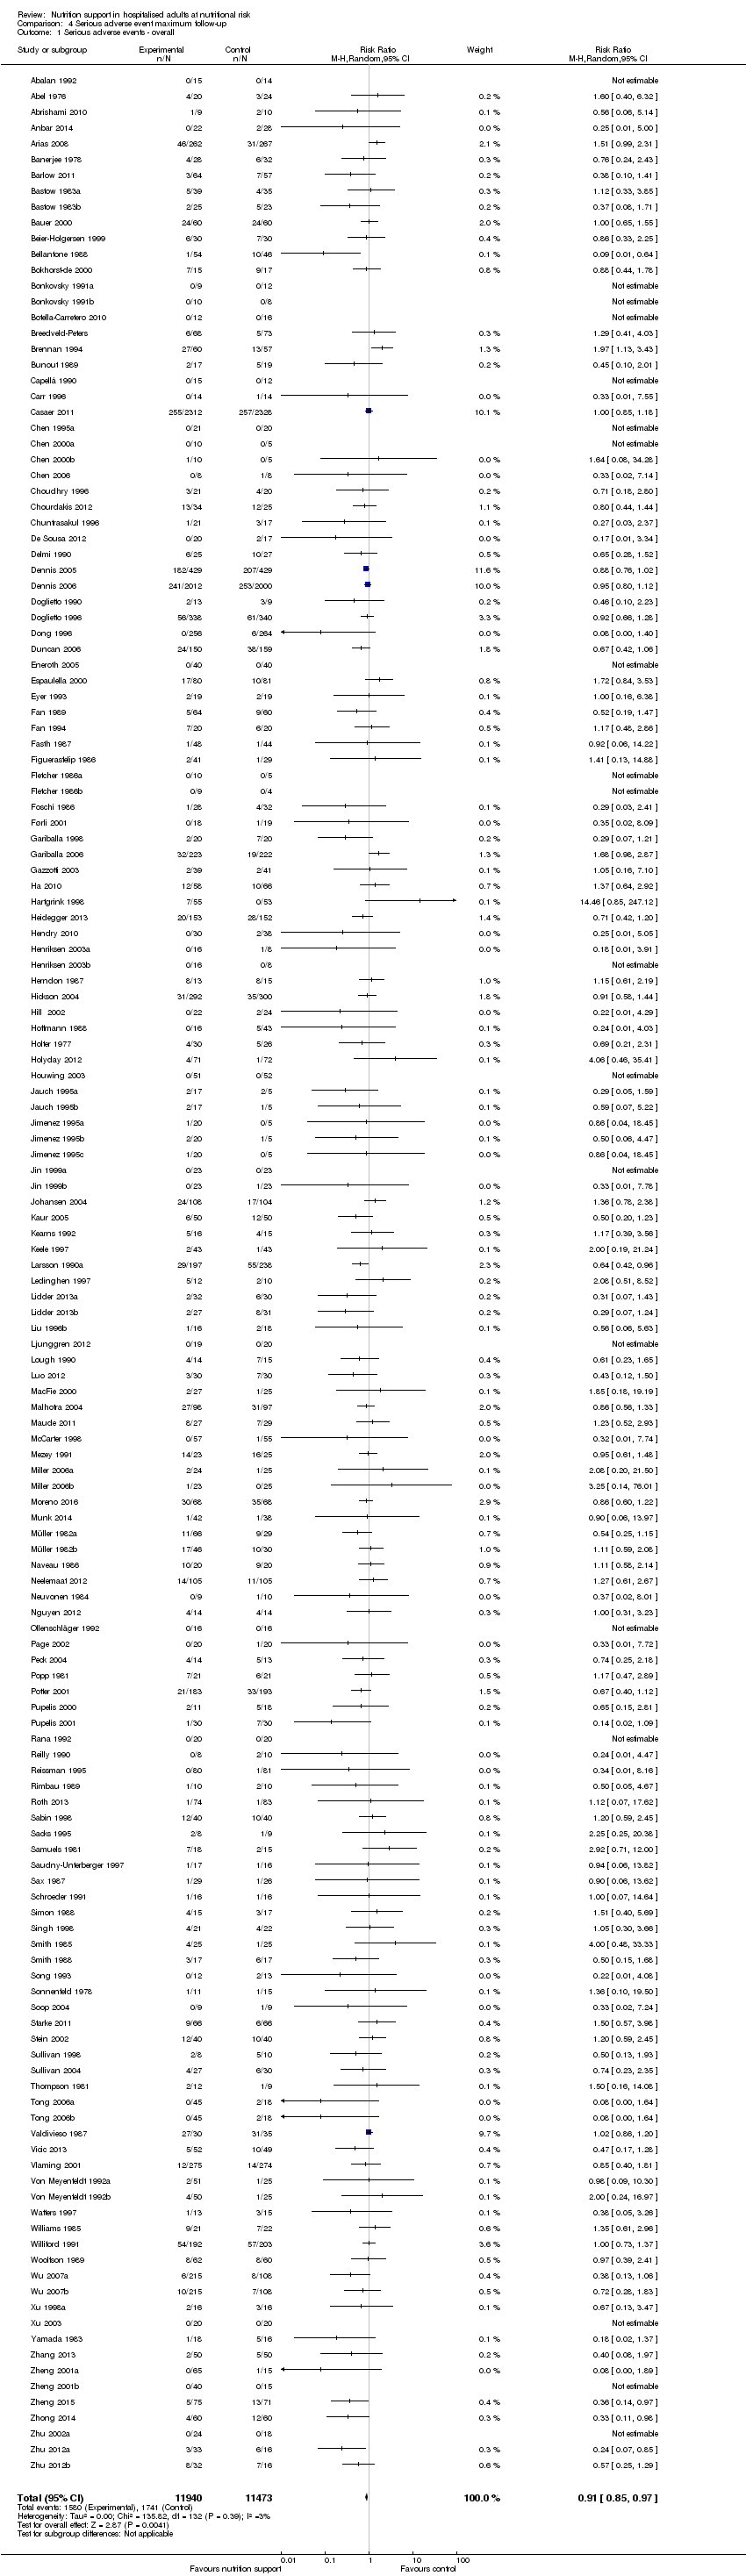
Comparison 4 Serious adverse event maximum follow‐up, Outcome 1 Serious adverse events ‐ overall.

Comparison 4 Serious adverse event maximum follow‐up, Outcome 2 Serious adverse events ‐ bias.

Comparison 4 Serious adverse event maximum follow‐up, Outcome 3 Serious adverse events ‐ mode of delivery.

Comparison 4 Serious adverse event maximum follow‐up, Outcome 4 Serious adverse events ‐ by medical specialty.

Comparison 4 Serious adverse event maximum follow‐up, Outcome 5 Serious adverse events ‐ based on adequacy of the amount of calories.

Comparison 4 Serious adverse event maximum follow‐up, Outcome 6 Serious adverse events ‐ different screening tools.
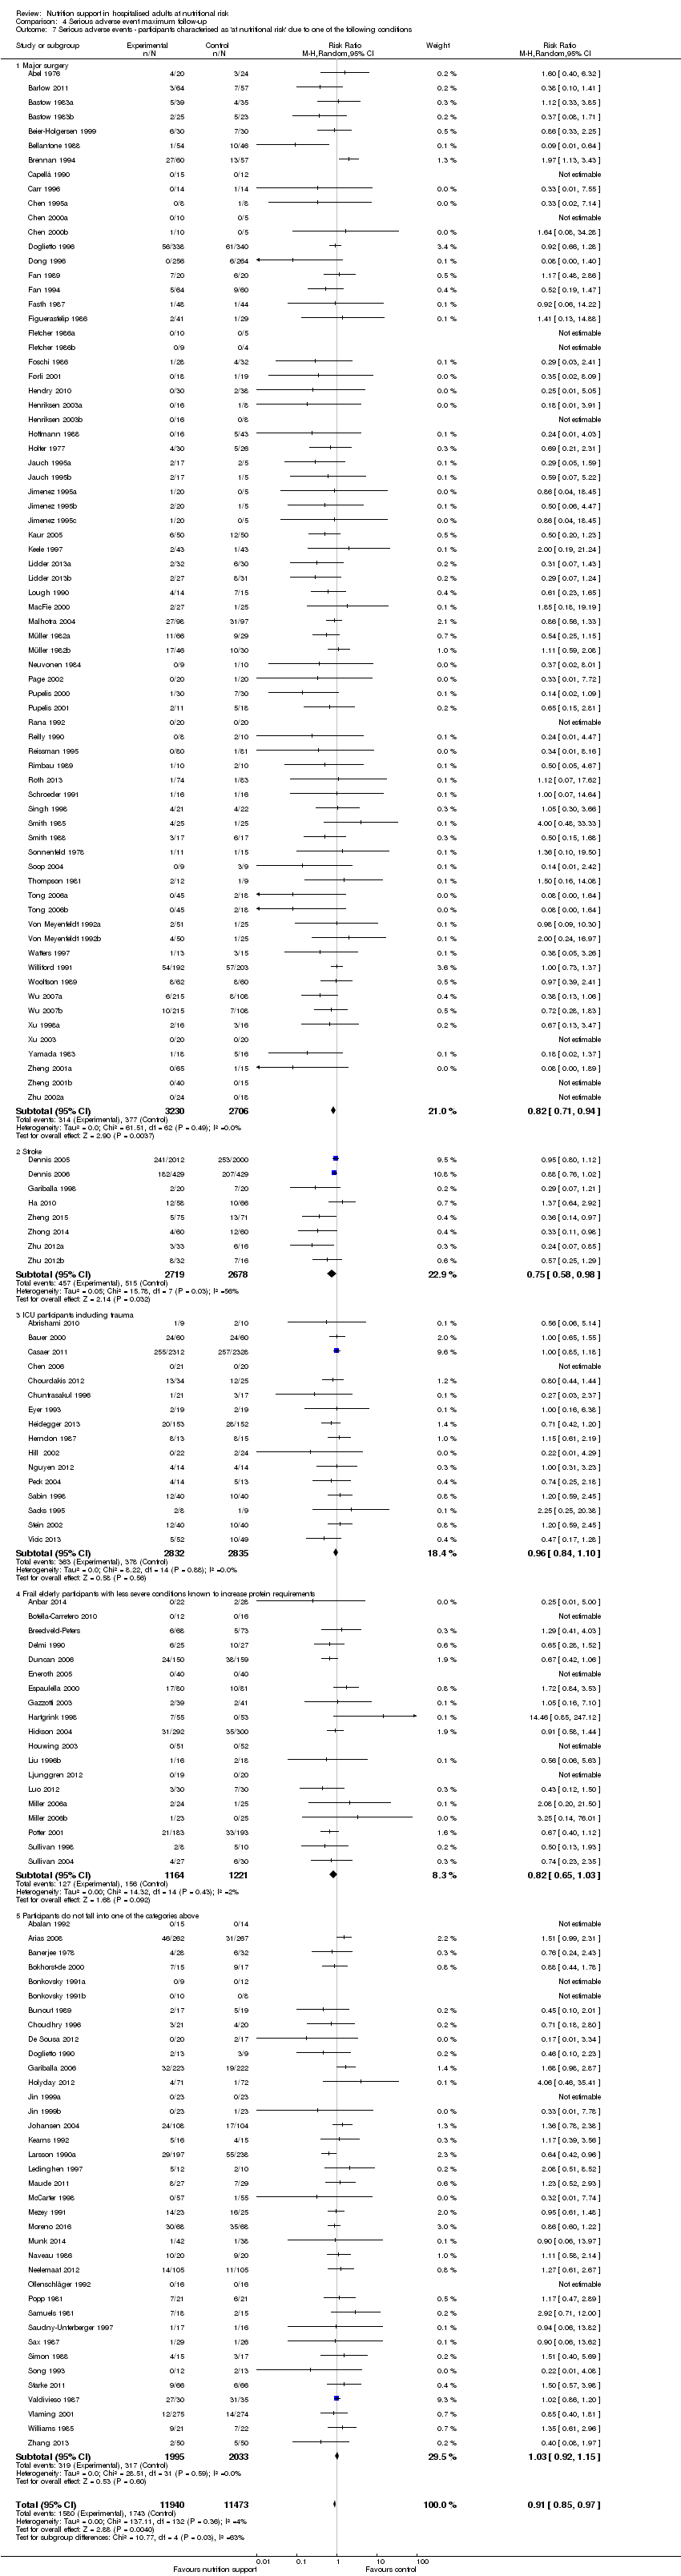
Comparison 4 Serious adverse event maximum follow‐up, Outcome 7 Serious adverse events ‐ participants characterised as 'at nutritional risk' due to one of the following conditions.
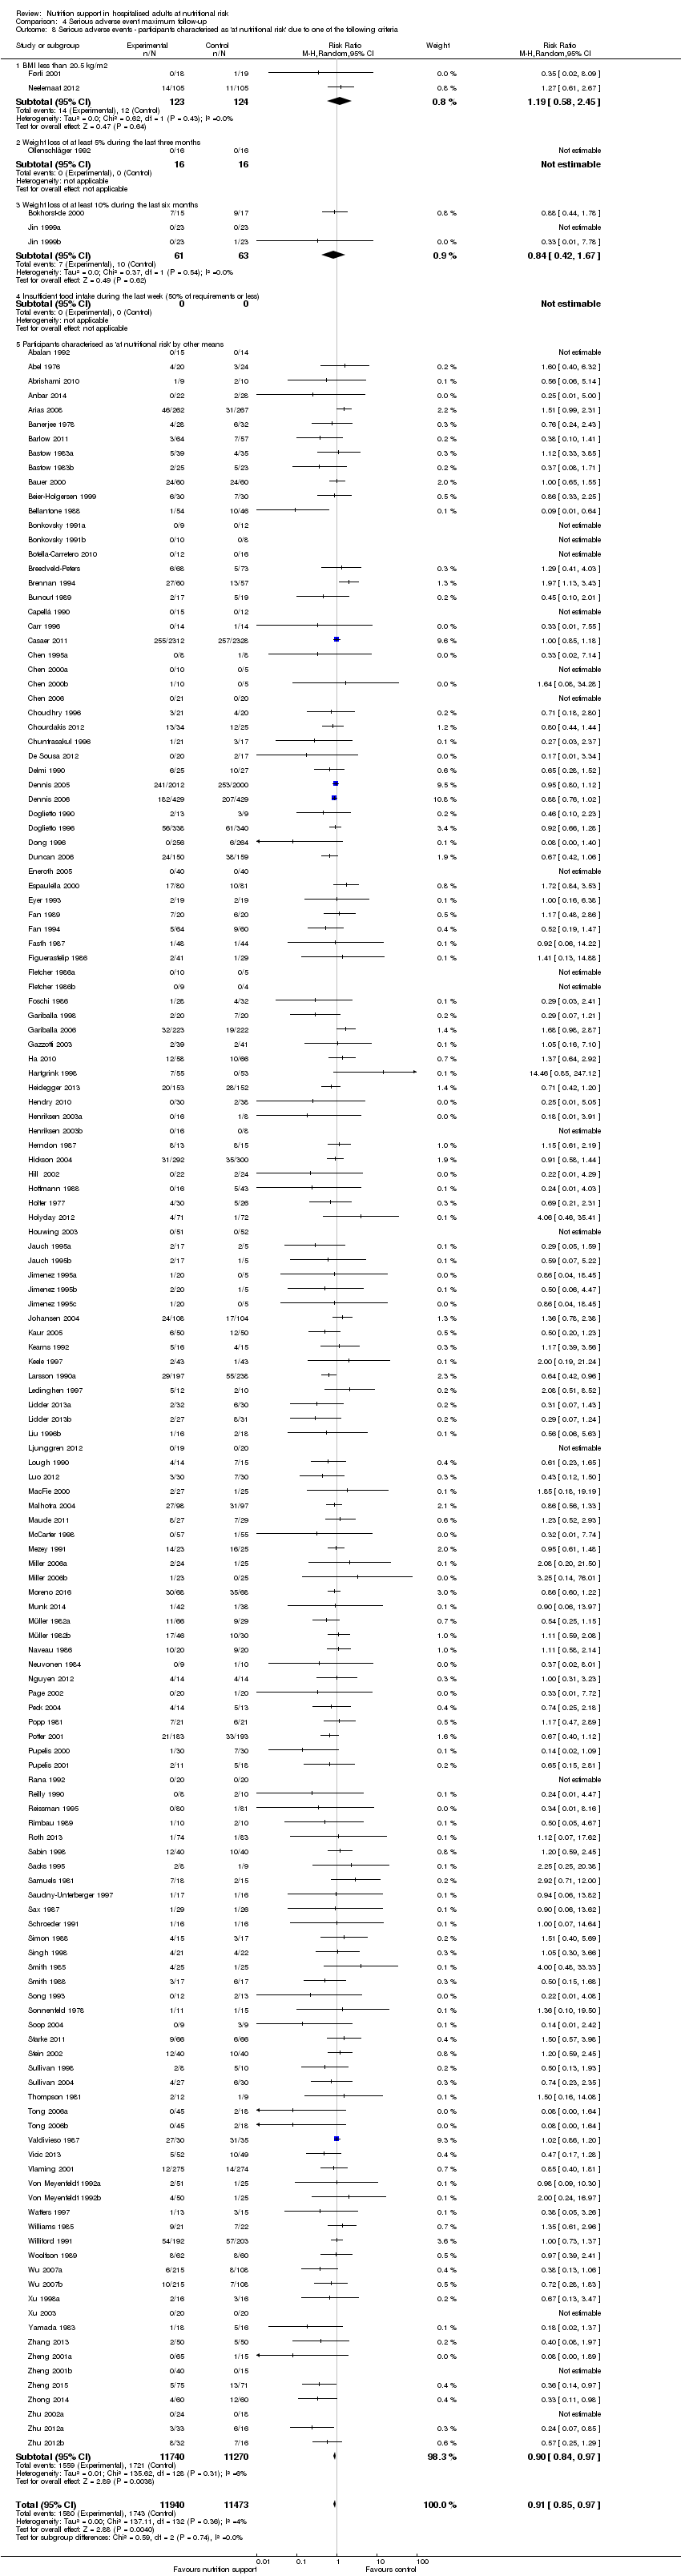
Comparison 4 Serious adverse event maximum follow‐up, Outcome 8 Serious adverse events ‐ participants characterised as 'at nutritional risk' due to one of the following criteria.

Comparison 4 Serious adverse event maximum follow‐up, Outcome 9 Serious adverse events ‐ participants characterised as 'at nutritional risk' due to biomarkers or anthropometrics.

Comparison 4 Serious adverse event maximum follow‐up, Outcome 10 Serious adverse events ‐ randomisation year.

Comparison 4 Serious adverse event maximum follow‐up, Outcome 11 Serious adverse events ‐ trials where the intervention lasts fewer than three days compared with trials where the intervention lasts three days or more.

Comparison 4 Serious adverse event maximum follow‐up, Outcome 12 Serious adverse events ‐ 'best‐worst case' scenario.

Comparison 4 Serious adverse event maximum follow‐up, Outcome 13 Serious adverse events ‐ 'worst‐best case' scenario.

Comparison 4 Serious adverse event maximum follow‐up, Outcome 14 Serious adverse events co‐interventions.

Comparison 4 Serious adverse event maximum follow‐up, Outcome 15 Serious adverse events ‐ 'best‐worse case' scenario (enteral nutrition).

Comparison 4 Serious adverse event maximum follow‐up, Outcome 16 Serious adverse events ‐ 'worst‐best case' scenario (enteral nutrition).

Comparison 5 Quality of life (SF36 ‐ Physical performance) ‐ end of intervention, Outcome 1 Quality of life ‐ overall.

Comparison 6 Quality of life (SF36 ‐ Physical performance) ‐ maximum follow‐up, Outcome 1 Quality of life ‐ overall.

Comparison 7 Quality of life (SF36 ‐ Mental performance ‐ end of intervention, Outcome 1 Quality of life ‐ overall.

Comparison 8 Quality of life (SF36 ‐ Mental performance) ‐ maximum follow‐up, Outcome 1 Quality of life ‐ overall.

Comparison 9 Quality of life (EuroQoL) ‐ maximum follow‐up, Outcome 1 Quality of life ‐ overall.

Comparison 10 Pneumonia, Outcome 1 Pneumonia.
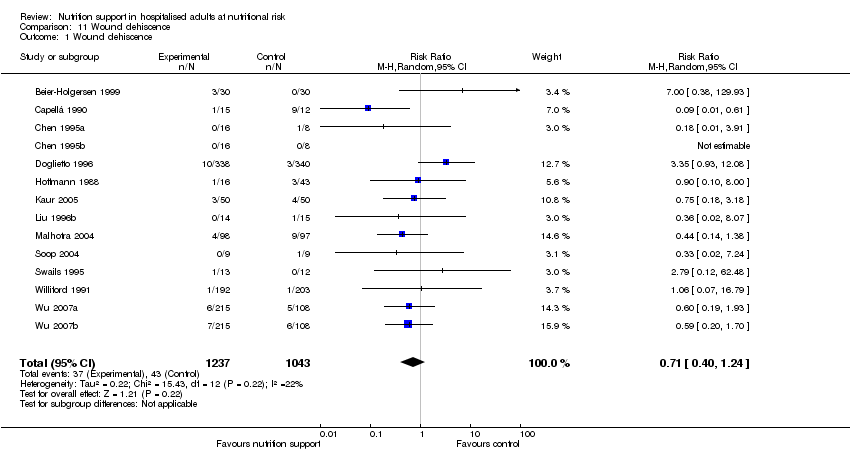
Comparison 11 Wound dehiscence, Outcome 1 Wound dehiscence.

Comparison 12 Renal failure, Outcome 1 Renal failure.
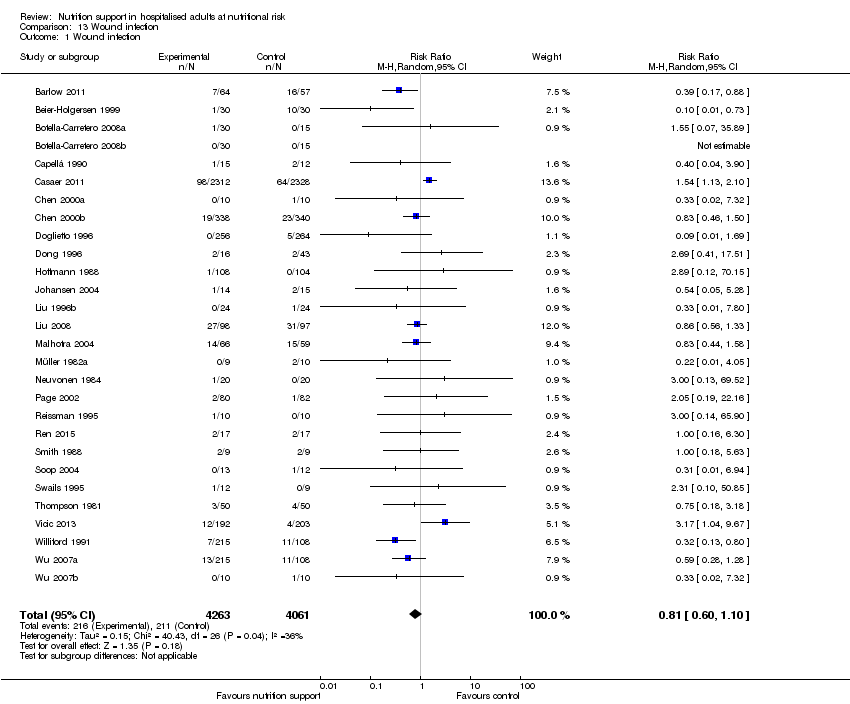
Comparison 13 Wound infection, Outcome 1 Wound infection.

Comparison 14 Heart failure, Outcome 1 Heart failure.

Comparison 15 Clearly adequate and screening tool, Outcome 1 AcM ‐ EoI.

Comparison 15 Clearly adequate and screening tool, Outcome 2 AcM ‐ MF.

Comparison 15 Clearly adequate and screening tool, Outcome 3 SaE ‐ EoI.

Comparison 15 Clearly adequate and screening tool, Outcome 4 SaE ‐ MF.

Comparison 16 Clearly adequate + (NRS component/at risk due to condition), Outcome 1 AcM ‐ EoI.

Comparison 16 Clearly adequate + (NRS component/at risk due to condition), Outcome 2 AcM ‐ MF.

Comparison 16 Clearly adequate + (NRS component/at risk due to condition), Outcome 3 SaE ‐ EoI.
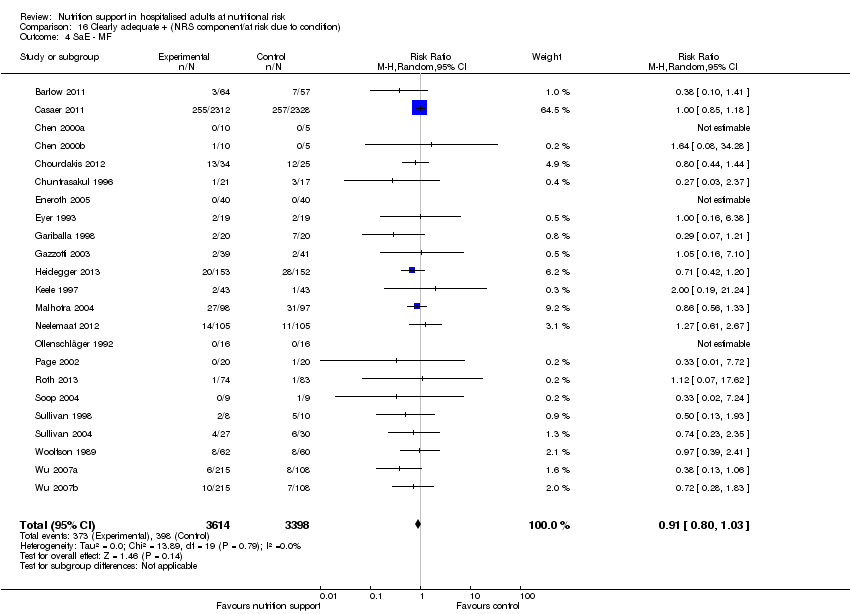
Comparison 16 Clearly adequate + (NRS component/at risk due to condition), Outcome 4 SaE ‐ MF.

Comparison 17 Oral ‐ All cause mortality ‐ end of intervention, Outcome 1 All‐cause mortality ‐ overall.

Comparison 17 Oral ‐ All cause mortality ‐ end of intervention, Outcome 2 All‐cause mortality ‐ bias.

Comparison 17 Oral ‐ All cause mortality ‐ end of intervention, Outcome 3 All‐cause mortality ‐ medical speciality.

Comparison 17 Oral ‐ All cause mortality ‐ end of intervention, Outcome 4 All‐cause mortality ‐ based on adequacy of the amount of calories.

Comparison 17 Oral ‐ All cause mortality ‐ end of intervention, Outcome 5 All‐cause mortality ‐ different screening tools.

Comparison 17 Oral ‐ All cause mortality ‐ end of intervention, Outcome 6 All‐cause mortality ‐ participants characterised as 'at nutritional risk' due to one of the following conditions.

Comparison 17 Oral ‐ All cause mortality ‐ end of intervention, Outcome 7 All‐cause mortality ‐ participants characterised as 'at nutritional risk' due to one of the following criteria.

Comparison 17 Oral ‐ All cause mortality ‐ end of intervention, Outcome 8 All‐cause mortality ‐ participants characterised as 'at nutritional risk' due to biomarkers or anthropometrics.

Comparison 17 Oral ‐ All cause mortality ‐ end of intervention, Outcome 9 All‐cause mortality ‐ randomisation year.
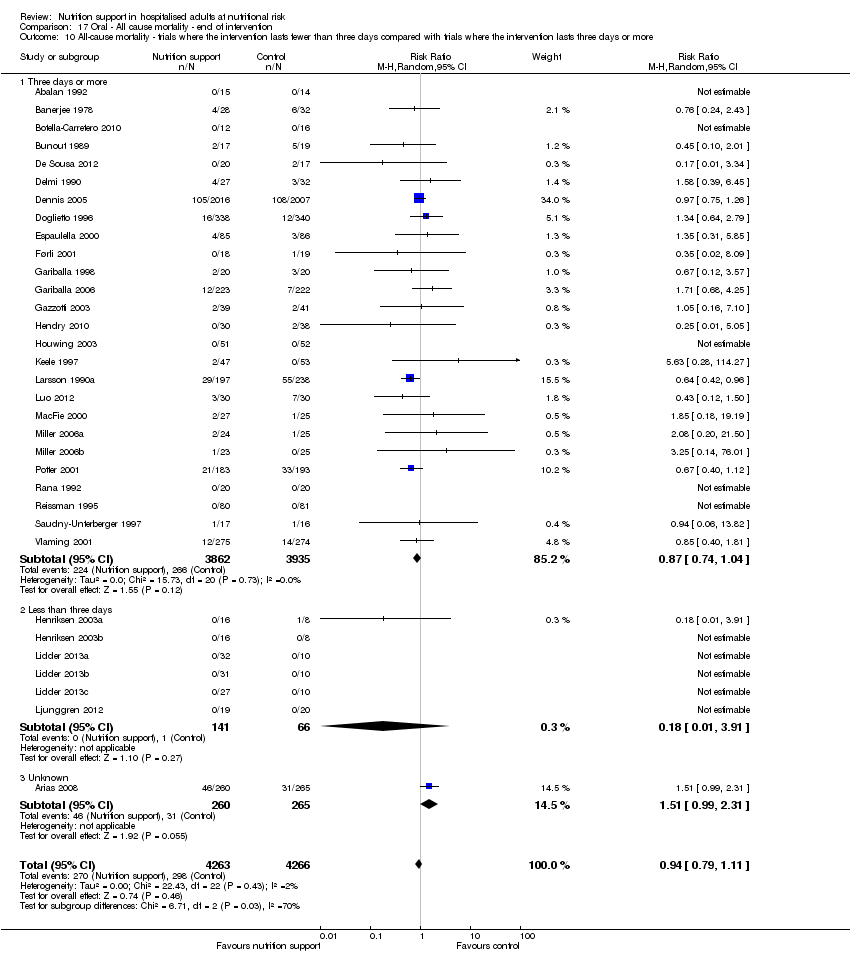
Comparison 17 Oral ‐ All cause mortality ‐ end of intervention, Outcome 10 All‐cause mortality ‐ trials where the intervention lasts fewer than three days compared with trials where the intervention lasts three days or more.

Comparison 17 Oral ‐ All cause mortality ‐ end of intervention, Outcome 11 All‐cause mortality ‐ 'best‐worst case' scenario.

Comparison 17 Oral ‐ All cause mortality ‐ end of intervention, Outcome 12 All‐cause mortality ‐ 'worst‐best case' scenario.
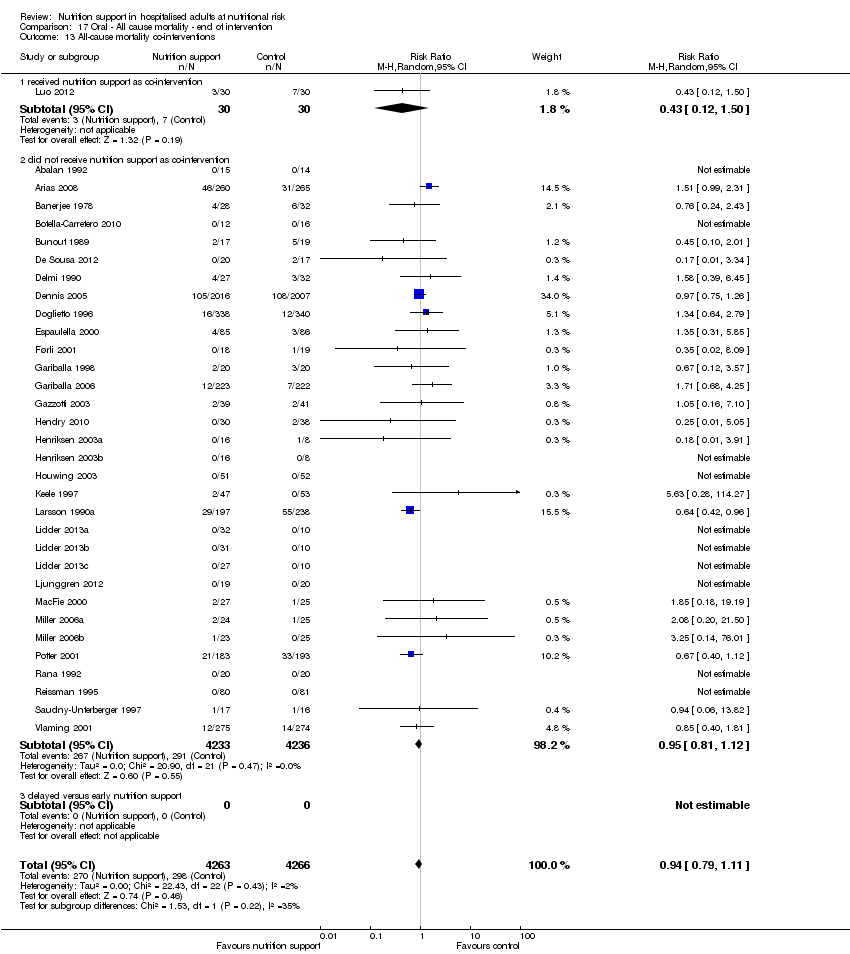
Comparison 17 Oral ‐ All cause mortality ‐ end of intervention, Outcome 13 All‐cause mortality co‐interventions.

Comparison 18 Oral ‐ All cause mortality ‐ maximum follow‐up, Outcome 1 All‐cause mortality ‐ overall.

Comparison 18 Oral ‐ All cause mortality ‐ maximum follow‐up, Outcome 2 All‐cause mortality ‐ bias.

Comparison 18 Oral ‐ All cause mortality ‐ maximum follow‐up, Outcome 3 All‐cause mortality ‐ medical speciality.
Comparison 18 Oral ‐ All cause mortality ‐ maximum follow‐up, Outcome 4 All‐cause mortality ‐ based on adequacy of the amount of calories.
Comparison 18 Oral ‐ All cause mortality ‐ maximum follow‐up, Outcome 5 All‐cause mortality ‐ different screening tools.
Comparison 18 Oral ‐ All cause mortality ‐ maximum follow‐up, Outcome 6 All‐cause mortality ‐ participants characterised as 'at nutritional risk' due to one of the following conditions.
Comparison 18 Oral ‐ All cause mortality ‐ maximum follow‐up, Outcome 7 All‐cause mortality ‐ participants characterised as 'at nutritional risk' due to one of the following criteria.

Comparison 18 Oral ‐ All cause mortality ‐ maximum follow‐up, Outcome 8 All‐cause mortality ‐ participants characterised as 'at nutritional risk' due to biomarkers or anthropometrics.

Comparison 18 Oral ‐ All cause mortality ‐ maximum follow‐up, Outcome 9 All‐cause mortality ‐ randomisation year.

Comparison 18 Oral ‐ All cause mortality ‐ maximum follow‐up, Outcome 10 All‐cause mortality ‐ trials where the intervention lasts fewer than three days compared with trials where the intervention lasts three days or more.

Comparison 18 Oral ‐ All cause mortality ‐ maximum follow‐up, Outcome 11 All‐cause mortality ‐ 'best‐worst case' scenario.
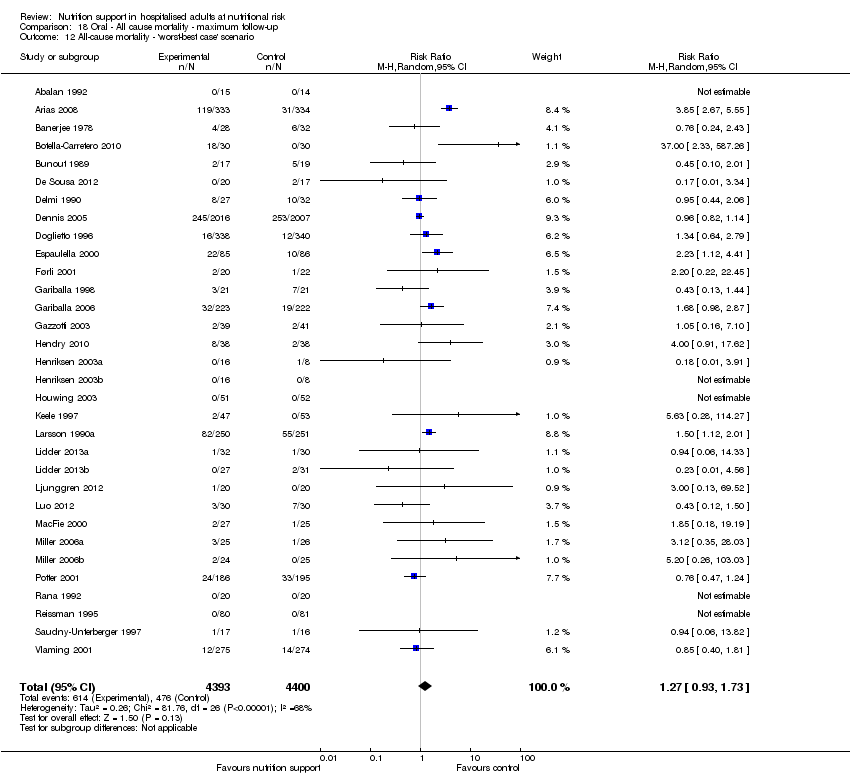
Comparison 18 Oral ‐ All cause mortality ‐ maximum follow‐up, Outcome 12 All‐cause mortality ‐ 'worst‐best case' scenario.

Comparison 18 Oral ‐ All cause mortality ‐ maximum follow‐up, Outcome 13 All‐cause mortality co‐interventions.

Comparison 19 Oral ‐ Serious adverse event end of intervention, Outcome 1 Serious adverse events ‐ overall.

Comparison 19 Oral ‐ Serious adverse event end of intervention, Outcome 2 Serious adverse events ‐ bias.
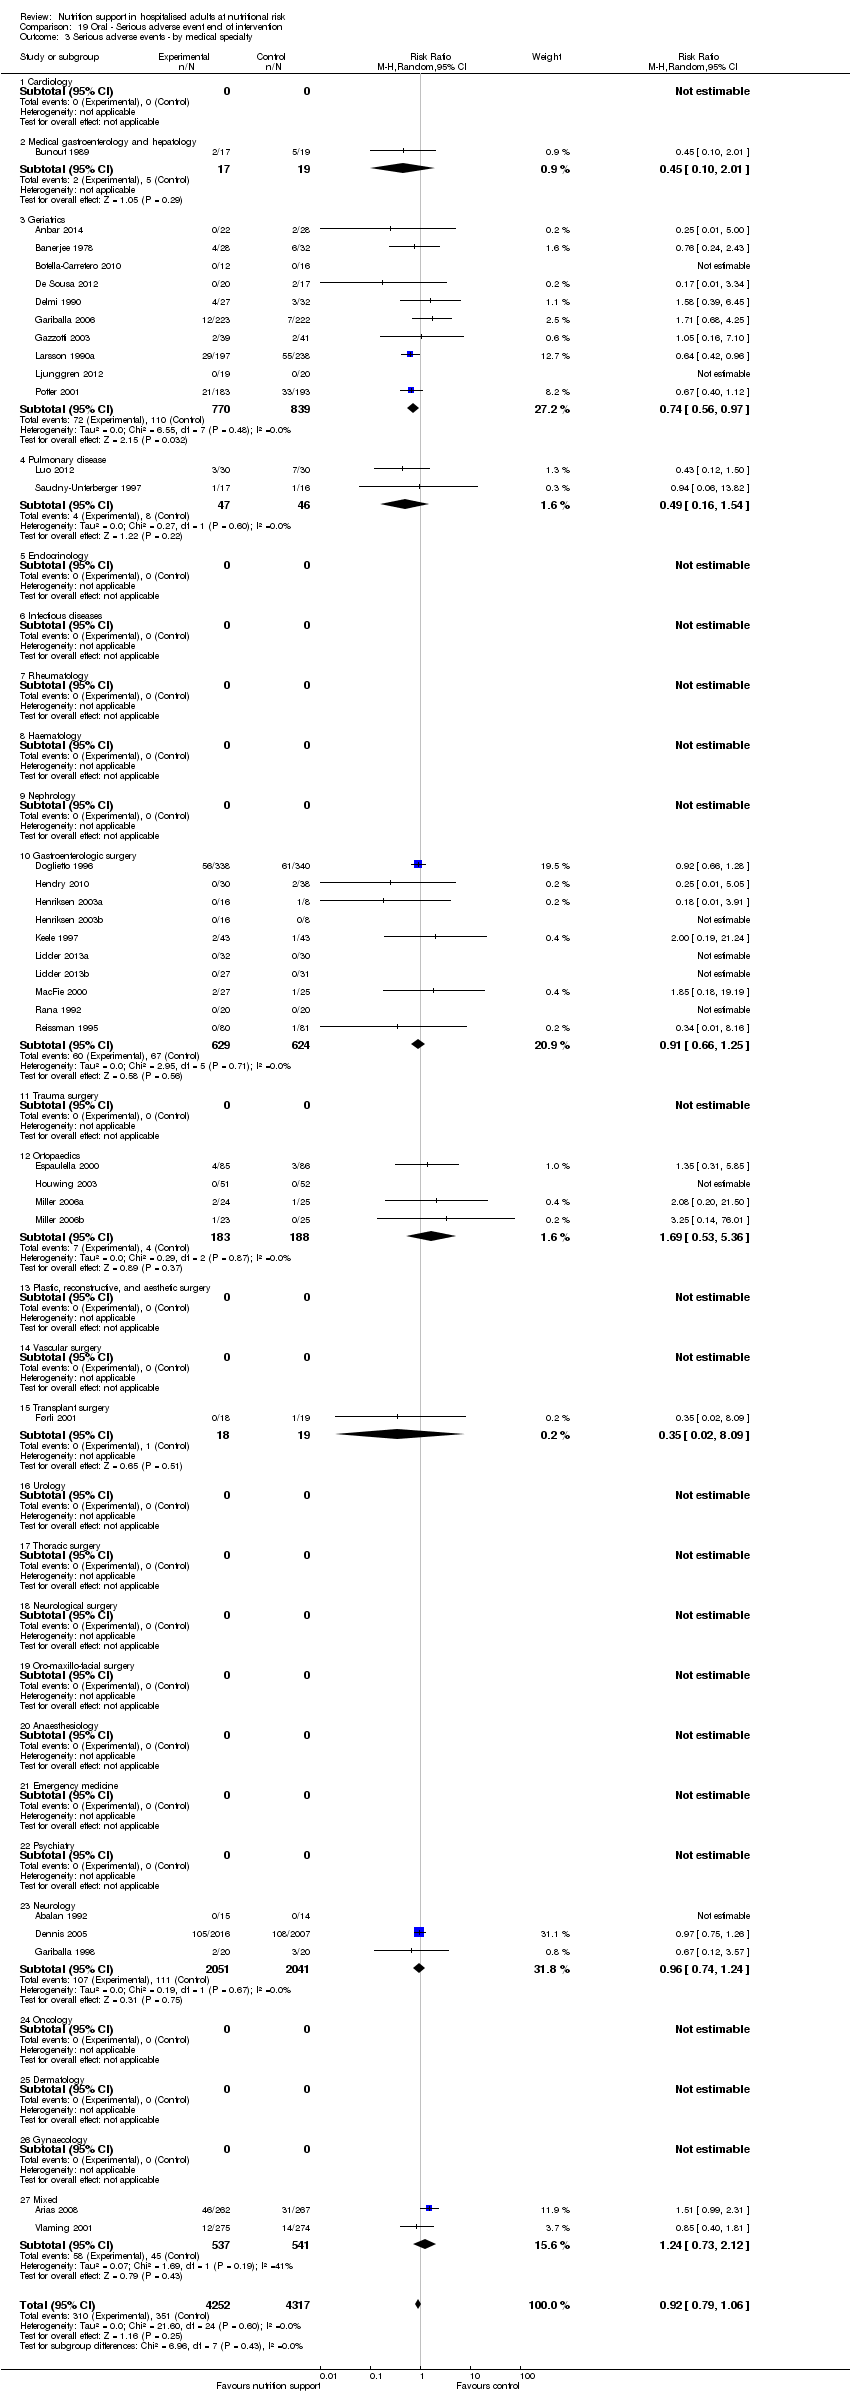
Comparison 19 Oral ‐ Serious adverse event end of intervention, Outcome 3 Serious adverse events ‐ by medical specialty.
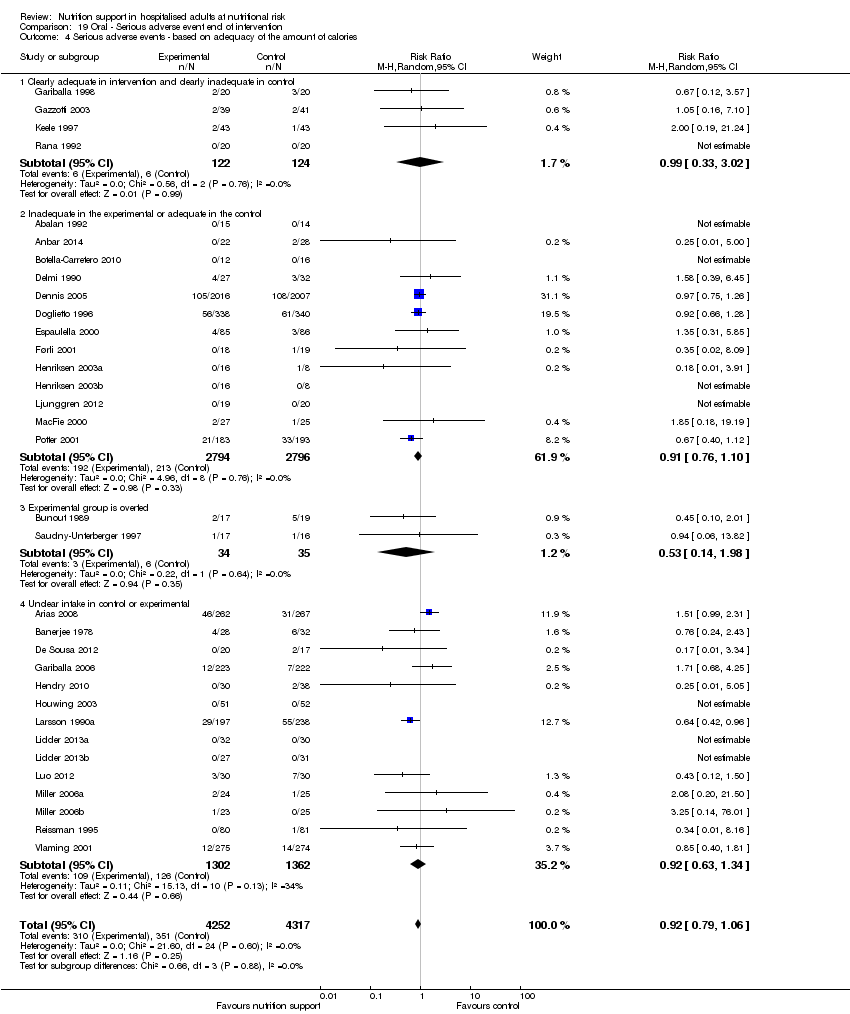
Comparison 19 Oral ‐ Serious adverse event end of intervention, Outcome 4 Serious adverse events ‐ based on adequacy of the amount of calories.
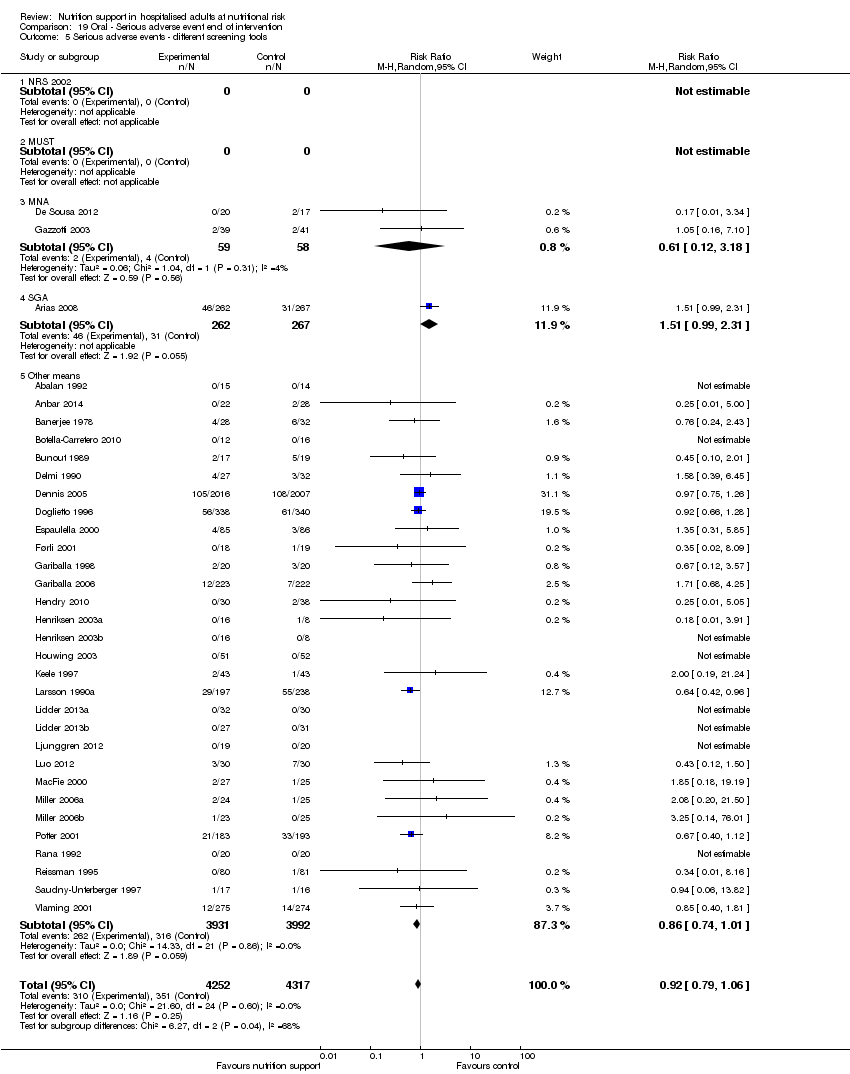
Comparison 19 Oral ‐ Serious adverse event end of intervention, Outcome 5 Serious adverse events ‐ different screening tools.

Comparison 19 Oral ‐ Serious adverse event end of intervention, Outcome 6 Serious adverse events ‐ participants characterised as 'at nutritional risk' due to one of the following conditions.
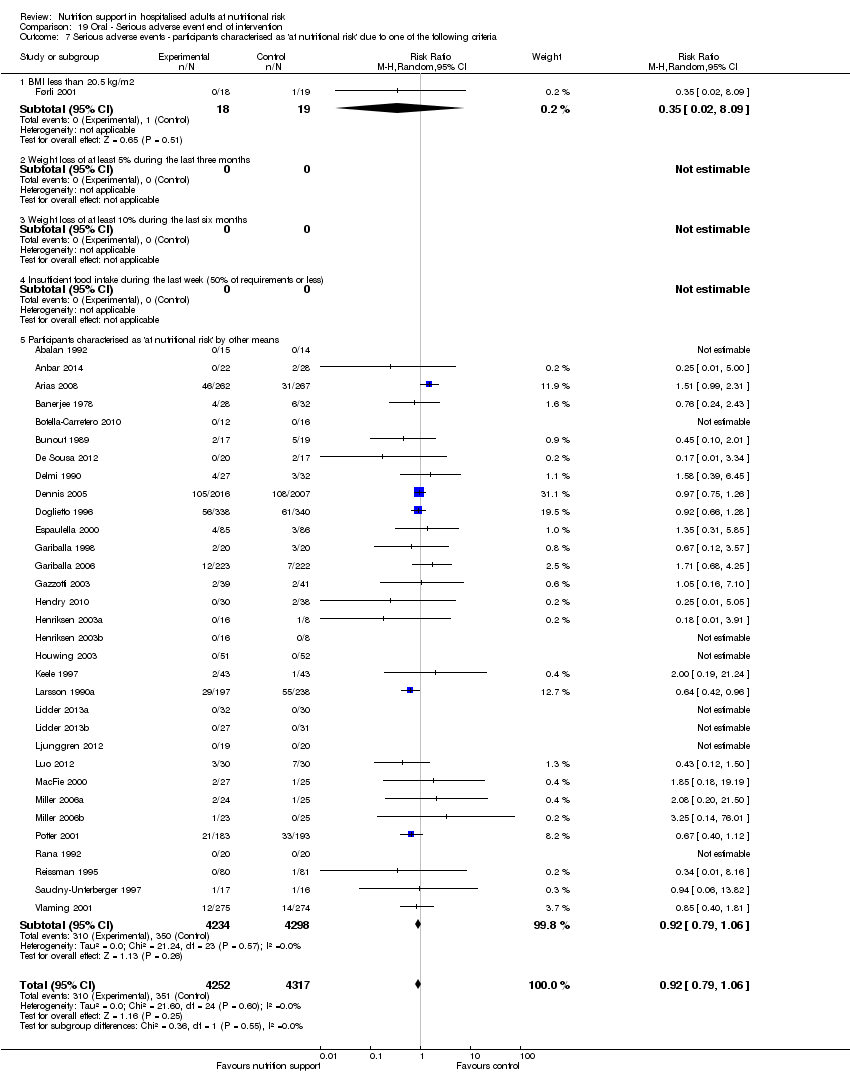
Comparison 19 Oral ‐ Serious adverse event end of intervention, Outcome 7 Serious adverse events ‐ participants characterised as 'at nutritional risk' due to one of the following criteria.
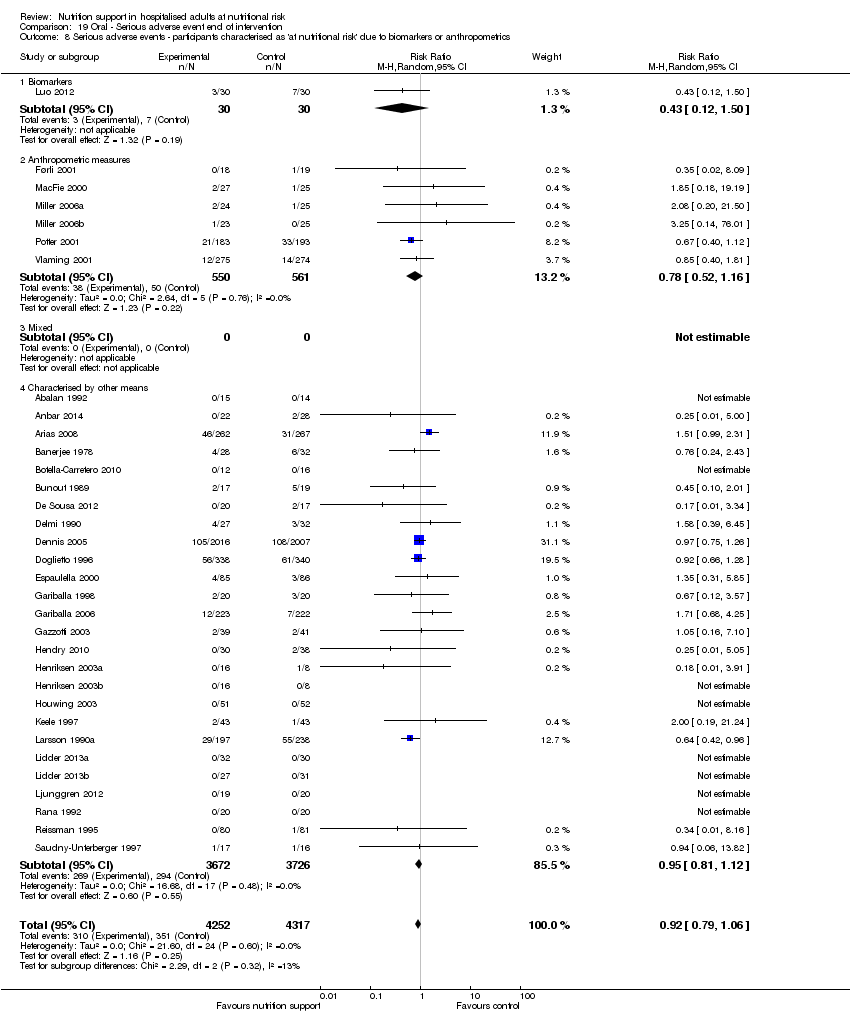
Comparison 19 Oral ‐ Serious adverse event end of intervention, Outcome 8 Serious adverse events ‐ participants characterised as 'at nutritional risk' due to biomarkers or anthropometrics.

Comparison 19 Oral ‐ Serious adverse event end of intervention, Outcome 9 Serious adverse events ‐ randomisation year.

Comparison 19 Oral ‐ Serious adverse event end of intervention, Outcome 10 Serious adverse events ‐ trials where the intervention lasts fewer than three days compared with trials where the intervention lasts three days or more.

Comparison 19 Oral ‐ Serious adverse event end of intervention, Outcome 11 Serious adverse events ‐ 'best‐worst case' scenario.

Comparison 19 Oral ‐ Serious adverse event end of intervention, Outcome 12 Serious adverse events ‐ 'worst‐best case' scenario.
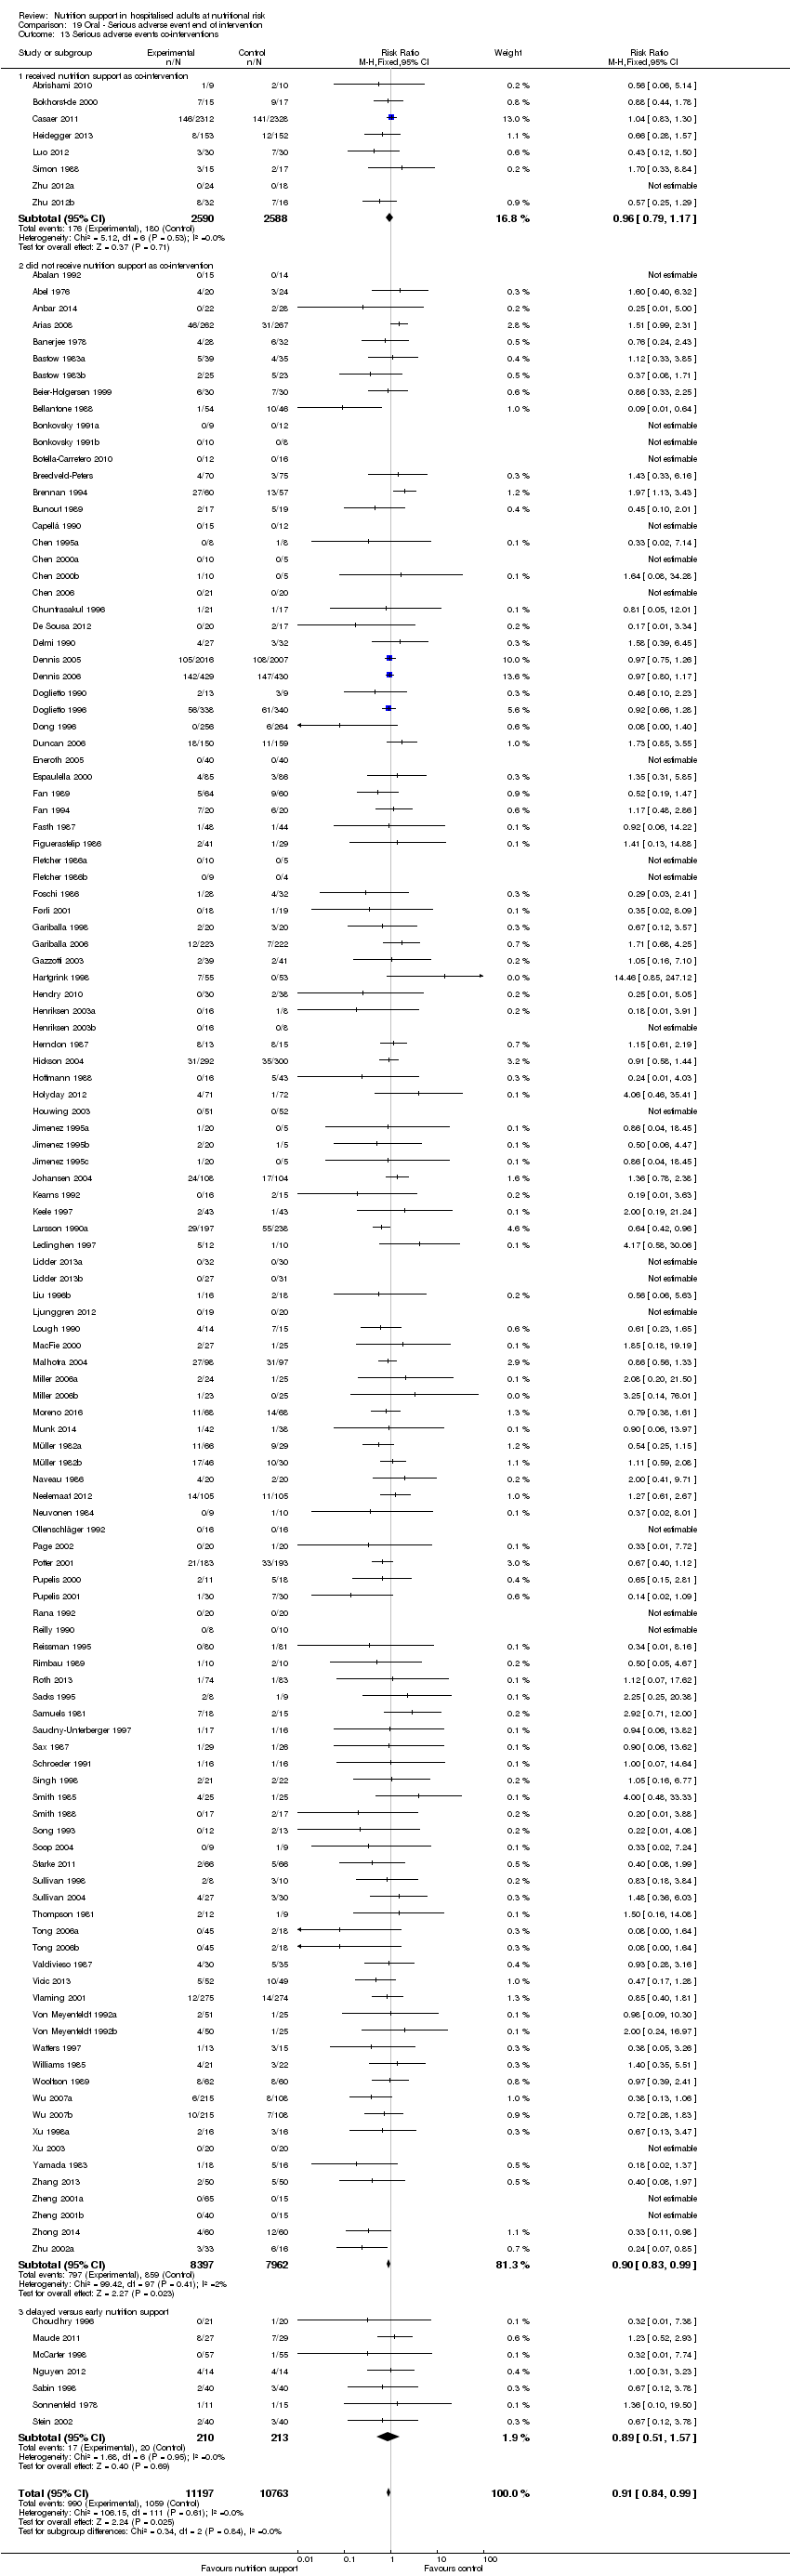
Comparison 19 Oral ‐ Serious adverse event end of intervention, Outcome 13 Serious adverse events co‐interventions.

Comparison 20 Oral ‐ Serious adverse event maximum follow‐up, Outcome 1 Serious adverse events ‐ overall.

Comparison 20 Oral ‐ Serious adverse event maximum follow‐up, Outcome 2 Serious adverse events ‐ bias.
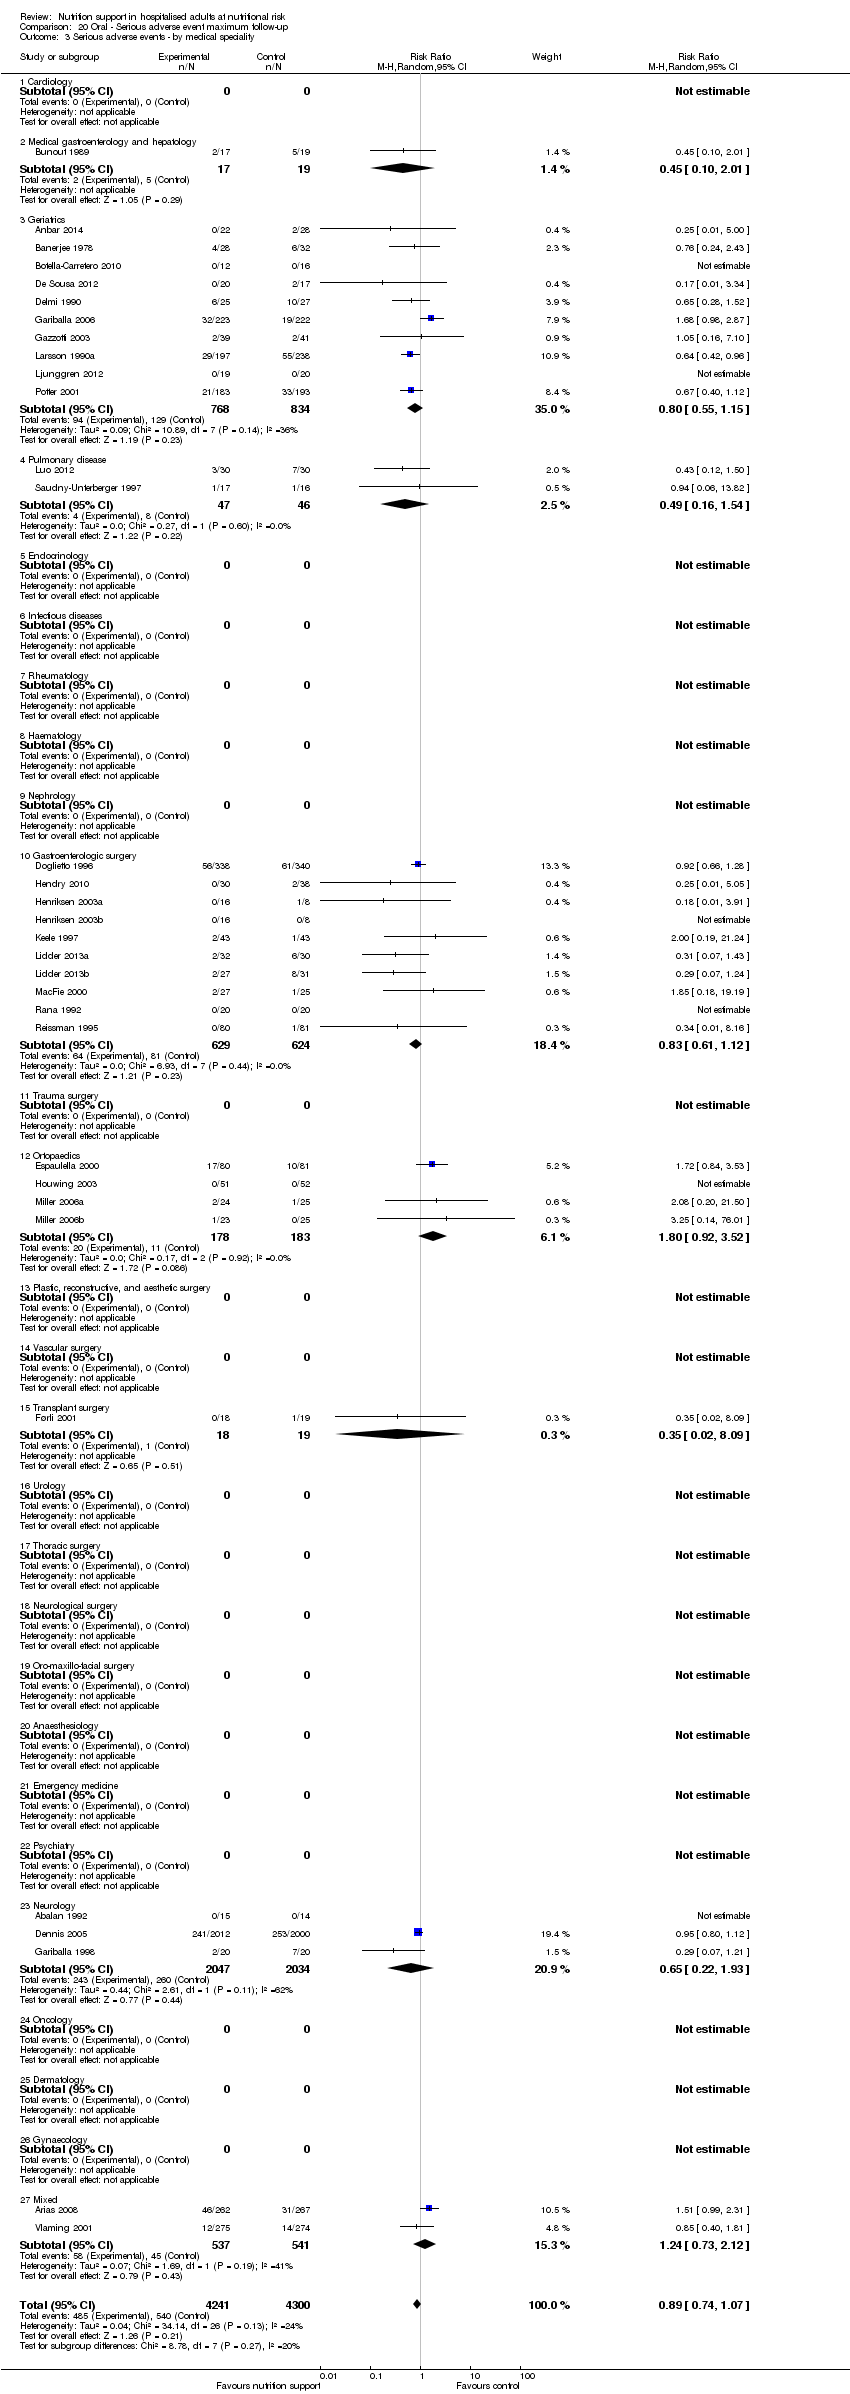
Comparison 20 Oral ‐ Serious adverse event maximum follow‐up, Outcome 3 Serious adverse events ‐ by medical speciality.
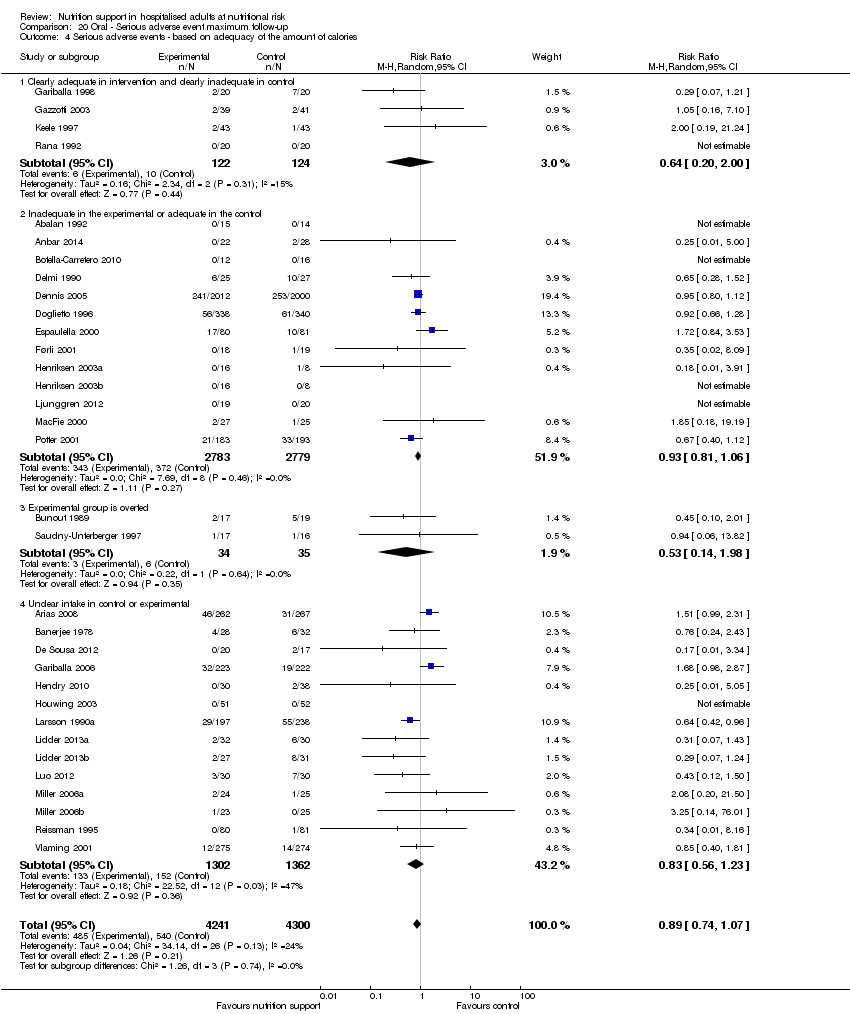
Comparison 20 Oral ‐ Serious adverse event maximum follow‐up, Outcome 4 Serious adverse events ‐ based on adequacy of the amount of calories.

Comparison 20 Oral ‐ Serious adverse event maximum follow‐up, Outcome 5 Serious adverse events ‐ different screening tools.
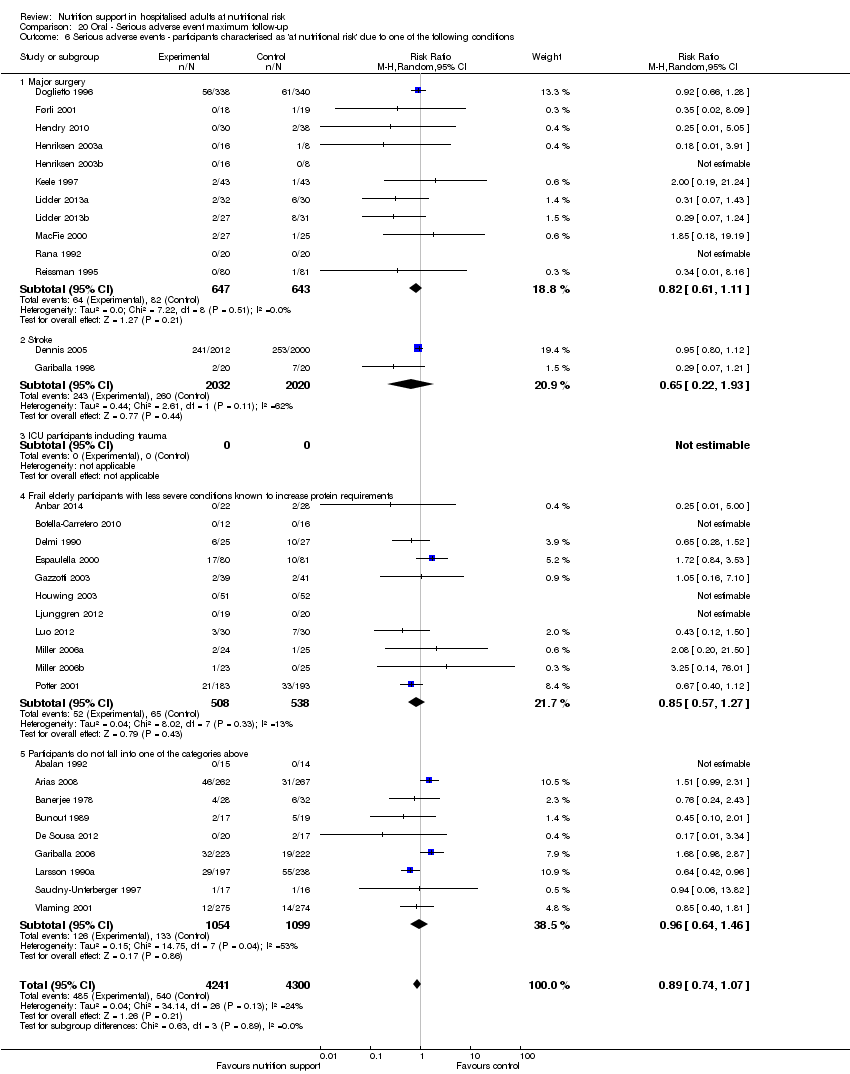
Comparison 20 Oral ‐ Serious adverse event maximum follow‐up, Outcome 6 Serious adverse events ‐ participants characterised as 'at nutritional risk' due to one of the following conditions.
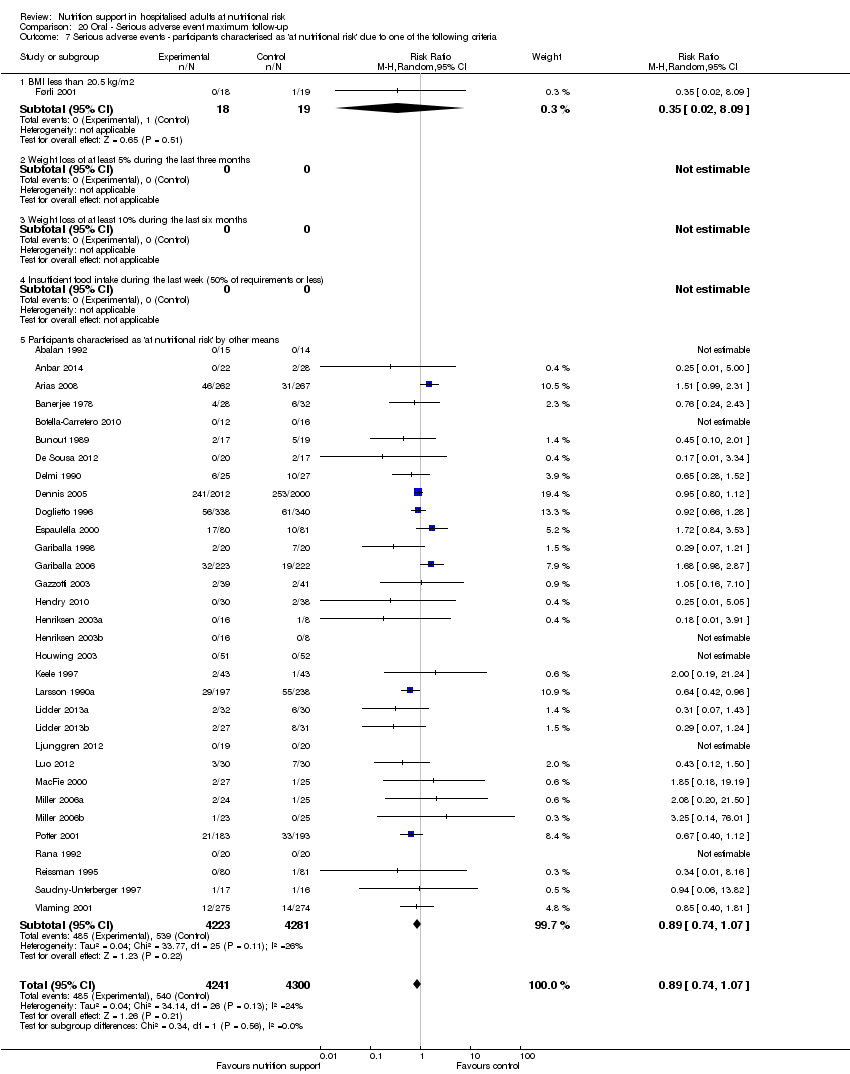
Comparison 20 Oral ‐ Serious adverse event maximum follow‐up, Outcome 7 Serious adverse events ‐ participants characterised as 'at nutritional risk' due to one of the following criteria.

Comparison 20 Oral ‐ Serious adverse event maximum follow‐up, Outcome 8 Serious adverse events ‐ participants characterised as 'at nutritional risk' due to biomarkers or anthropometrics.

Comparison 20 Oral ‐ Serious adverse event maximum follow‐up, Outcome 9 Serious adverse events ‐ randomisation year.
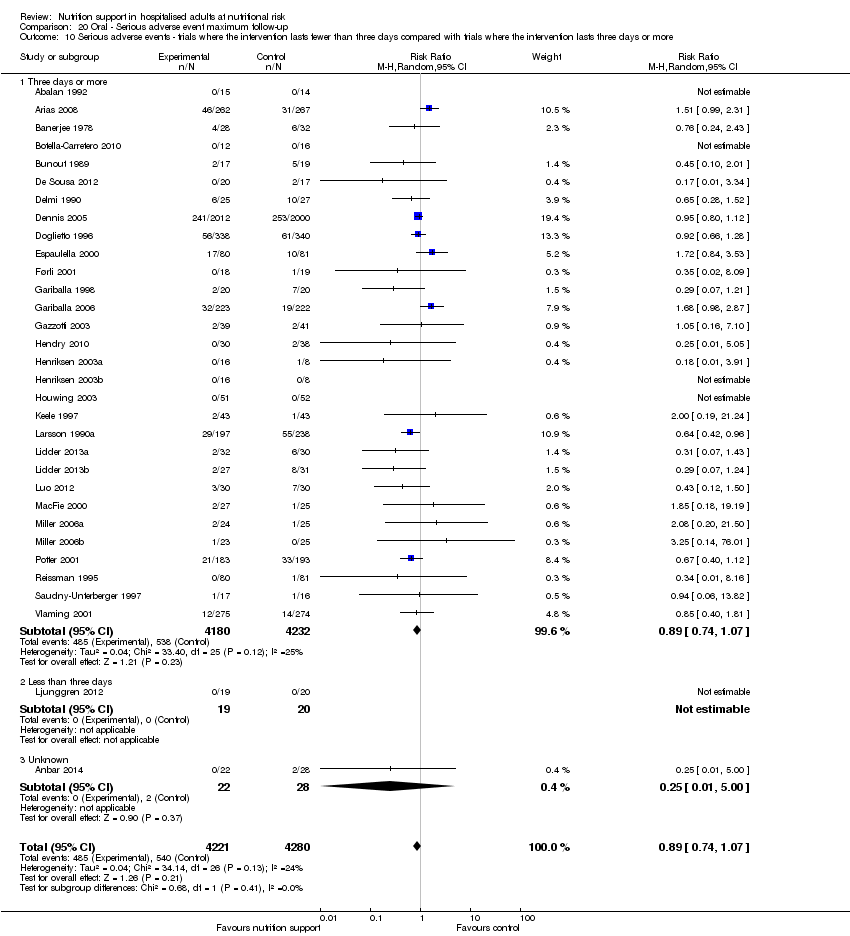
Comparison 20 Oral ‐ Serious adverse event maximum follow‐up, Outcome 10 Serious adverse events ‐ trials where the intervention lasts fewer than three days compared with trials where the intervention lasts three days or more.

Comparison 20 Oral ‐ Serious adverse event maximum follow‐up, Outcome 11 Serious adverse events ‐ 'best‐worst case' scenario.

Comparison 20 Oral ‐ Serious adverse event maximum follow‐up, Outcome 12 Serious adverse events ‐ 'worst‐best case' scenario.

Comparison 20 Oral ‐ Serious adverse event maximum follow‐up, Outcome 13 Serious adverse events co‐interventions.

Comparison 21 Enteral ‐ All cause mortality ‐ end of intervention, Outcome 1 All‐cause mortality ‐ overall.

Comparison 21 Enteral ‐ All cause mortality ‐ end of intervention, Outcome 2 All‐cause mortality ‐ bias.

Comparison 21 Enteral ‐ All cause mortality ‐ end of intervention, Outcome 3 All‐cause mortality ‐ medical speciality.
Comparison 21 Enteral ‐ All cause mortality ‐ end of intervention, Outcome 4 All‐cause mortality ‐ based on adequacy of the amount of calories.

Comparison 21 Enteral ‐ All cause mortality ‐ end of intervention, Outcome 5 All‐cause mortality ‐ different screening tools.
Comparison 21 Enteral ‐ All cause mortality ‐ end of intervention, Outcome 6 All‐cause mortality ‐ participants characterised as 'at nutritional risk' due to one of the following conditions.
Comparison 21 Enteral ‐ All cause mortality ‐ end of intervention, Outcome 7 All‐cause mortality ‐ participants characterised as 'at nutritional risk' due to one of the following criteria.
Comparison 21 Enteral ‐ All cause mortality ‐ end of intervention, Outcome 8 All‐cause mortality ‐ participants characterised as 'at nutritional risk' due to biomarkers or anthropometrics.

Comparison 21 Enteral ‐ All cause mortality ‐ end of intervention, Outcome 9 All‐cause mortality ‐ randomisation year.
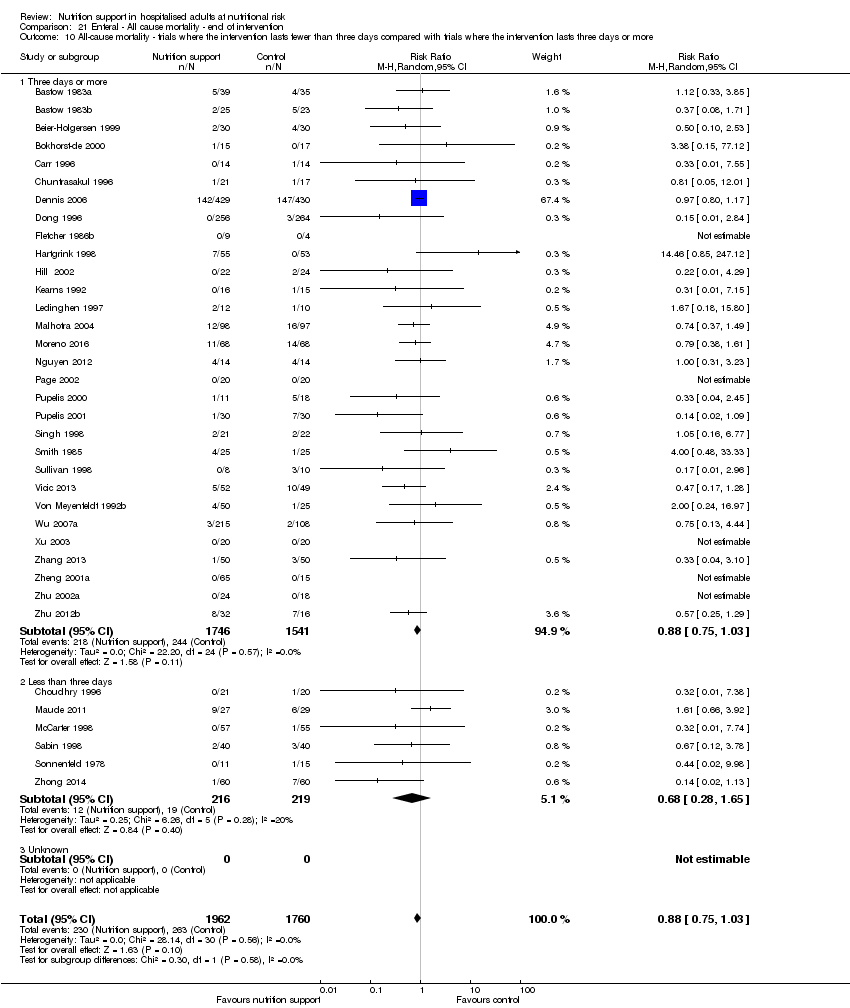
Comparison 21 Enteral ‐ All cause mortality ‐ end of intervention, Outcome 10 All‐cause mortality ‐ trials where the intervention lasts fewer than three days compared with trials where the intervention lasts three days or more.

Comparison 21 Enteral ‐ All cause mortality ‐ end of intervention, Outcome 11 All‐cause mortality ‐ 'best‐worst case' scenario.

Comparison 21 Enteral ‐ All cause mortality ‐ end of intervention, Outcome 12 All‐cause mortality ‐ 'worst‐best case' scenario.

Comparison 21 Enteral ‐ All cause mortality ‐ end of intervention, Outcome 13 All‐cause mortality co‐interventions.
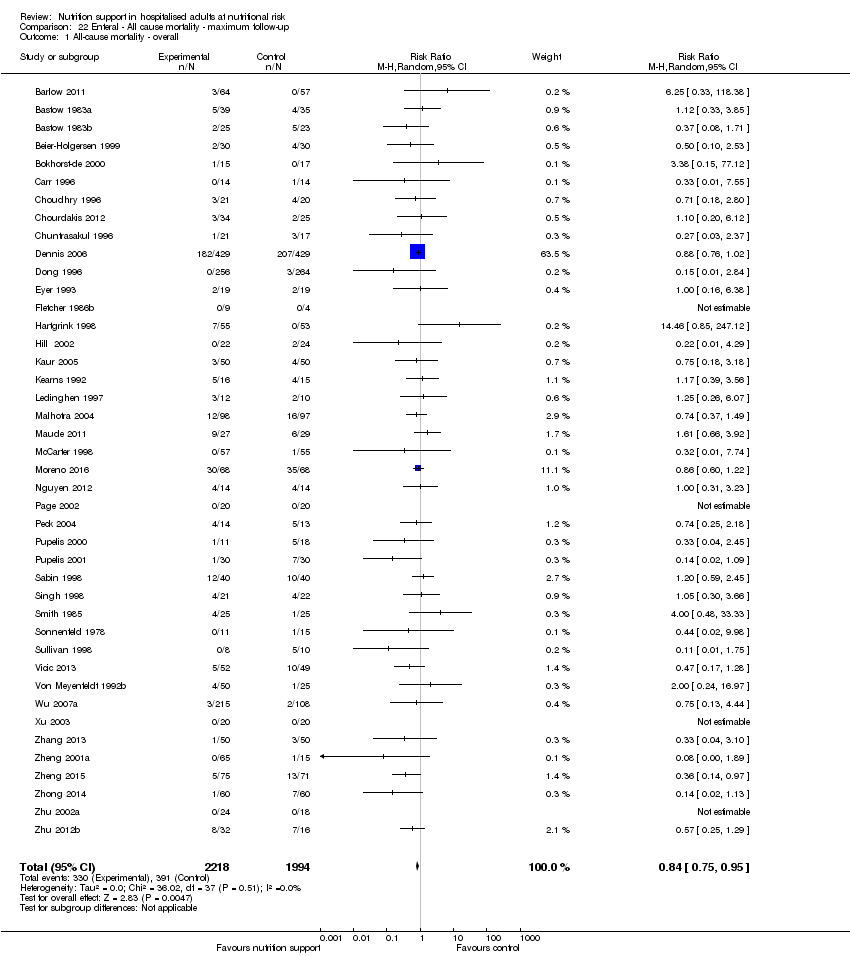
Comparison 22 Enteral ‐ All cause mortality ‐ maximum follow‐up, Outcome 1 All‐cause mortality ‐ overall.

Comparison 22 Enteral ‐ All cause mortality ‐ maximum follow‐up, Outcome 2 All‐cause mortality ‐ bias.

Comparison 22 Enteral ‐ All cause mortality ‐ maximum follow‐up, Outcome 3 All‐cause mortality ‐ medical speciality.

Comparison 22 Enteral ‐ All cause mortality ‐ maximum follow‐up, Outcome 4 All‐cause mortality ‐ based on adequacy of the amount of calories.

Comparison 22 Enteral ‐ All cause mortality ‐ maximum follow‐up, Outcome 5 All‐cause mortality ‐ different screening tools.

Comparison 22 Enteral ‐ All cause mortality ‐ maximum follow‐up, Outcome 6 All‐cause mortality ‐ participants characterised as 'at nutritional risk' due to one of the following conditions.

Comparison 22 Enteral ‐ All cause mortality ‐ maximum follow‐up, Outcome 7 All‐cause mortality ‐ participants characterised as 'at nutritional risk' due to one of the following criteria.
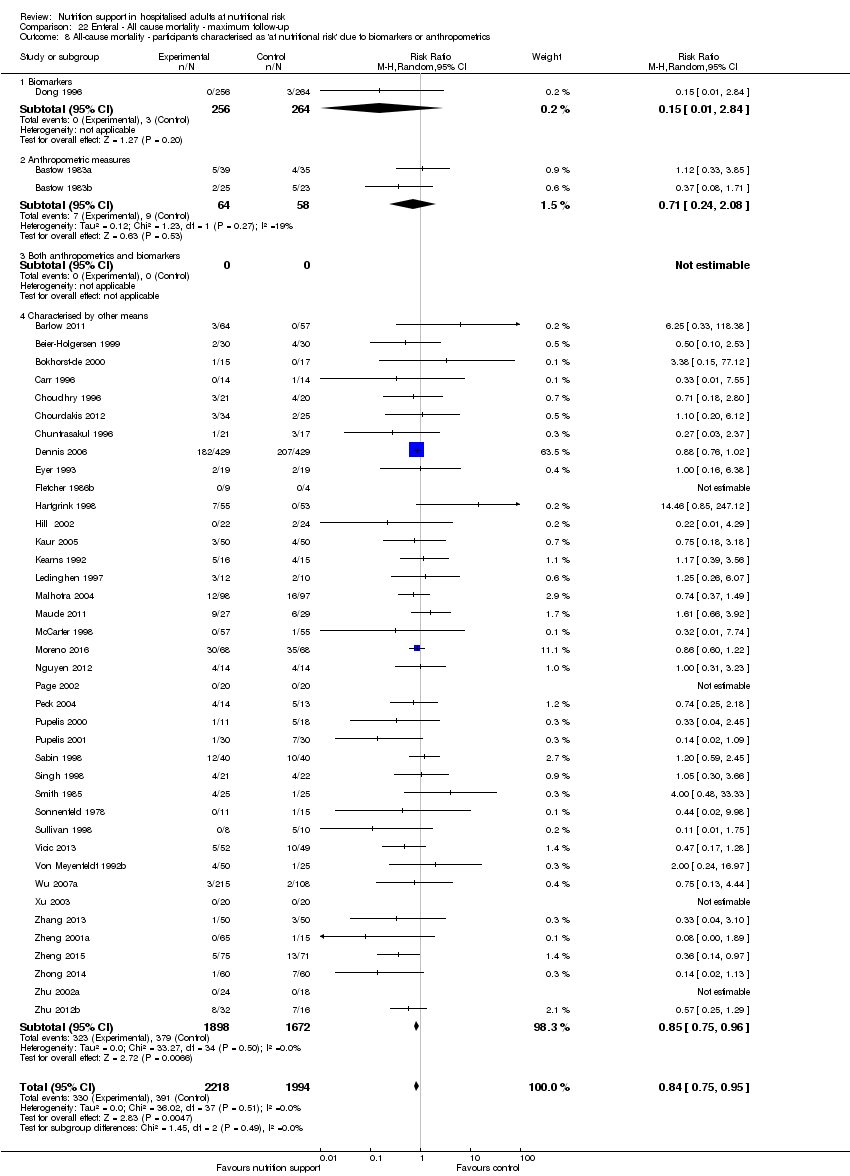
Comparison 22 Enteral ‐ All cause mortality ‐ maximum follow‐up, Outcome 8 All‐cause mortality ‐ participants characterised as 'at nutritional risk' due to biomarkers or anthropometrics.
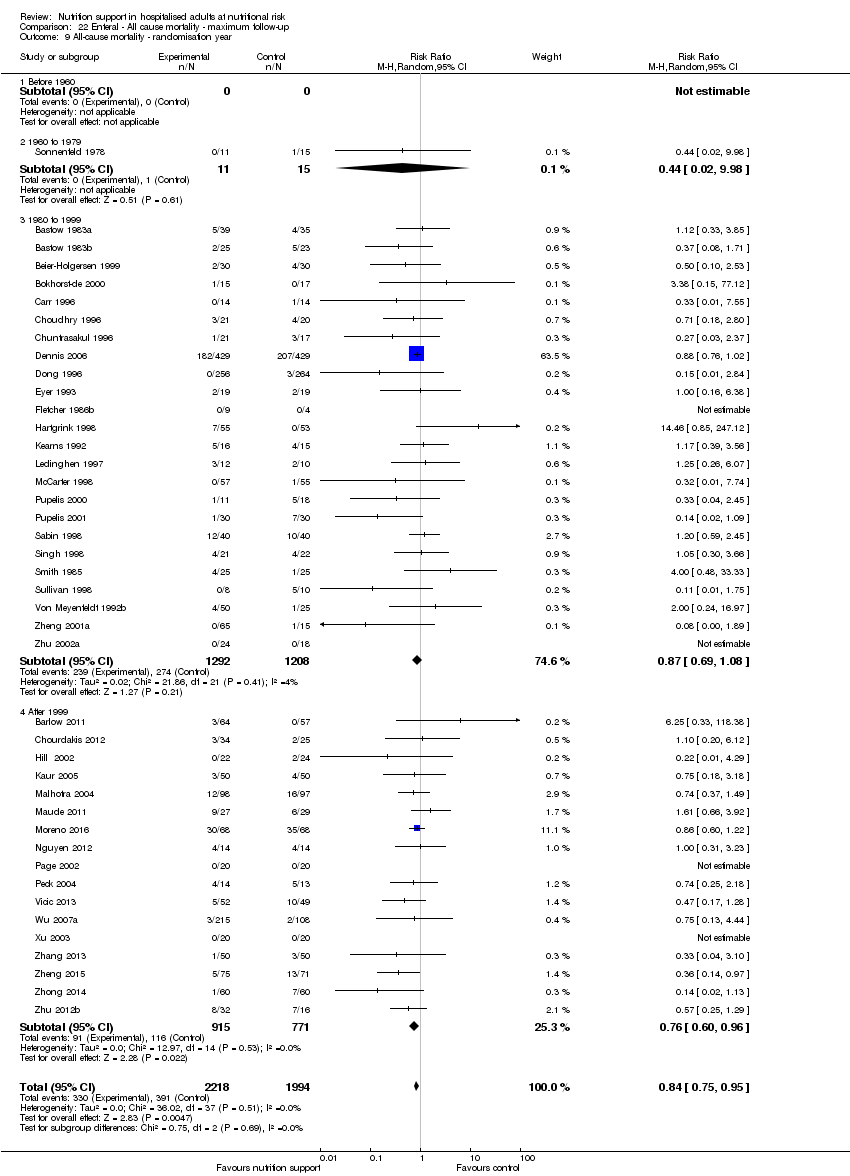
Comparison 22 Enteral ‐ All cause mortality ‐ maximum follow‐up, Outcome 9 All‐cause mortality ‐ randomisation year.
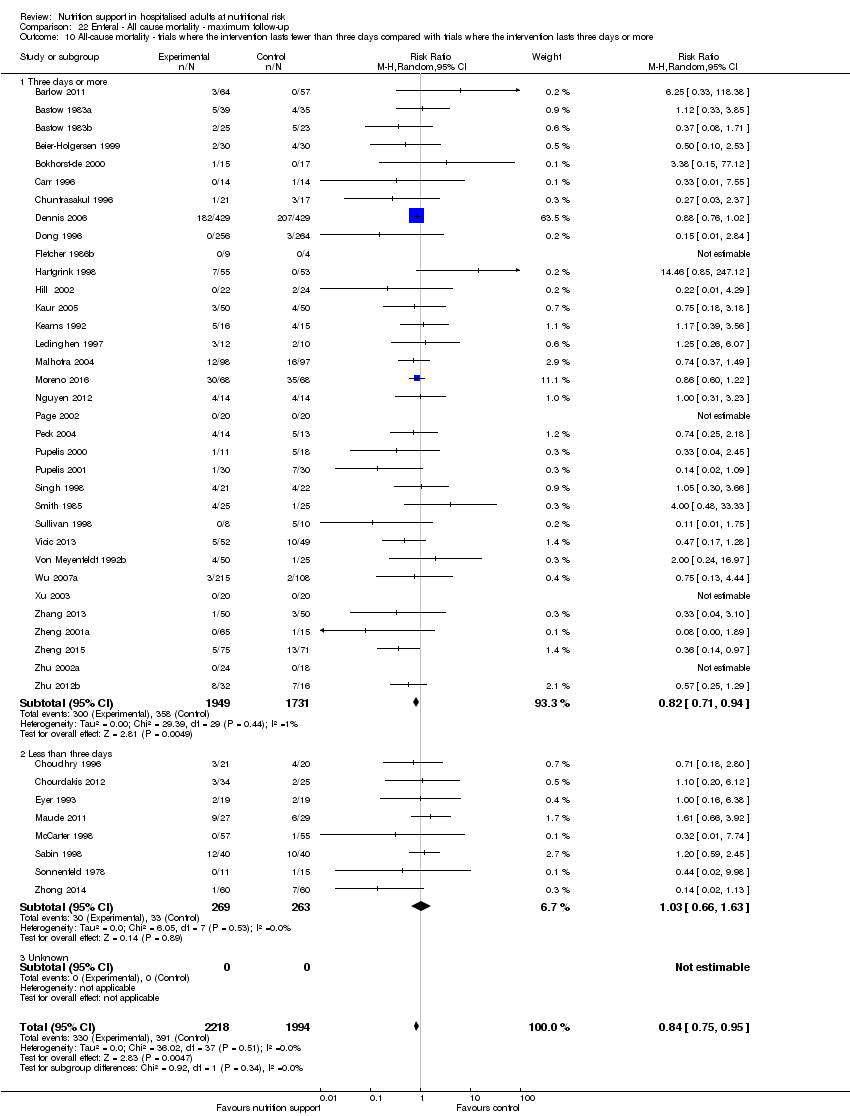
Comparison 22 Enteral ‐ All cause mortality ‐ maximum follow‐up, Outcome 10 All‐cause mortality ‐ trials where the intervention lasts fewer than three days compared with trials where the intervention lasts three days or more.
Comparison 22 Enteral ‐ All cause mortality ‐ maximum follow‐up, Outcome 11 All‐cause mortality ‐ 'best‐worst case' scenario.
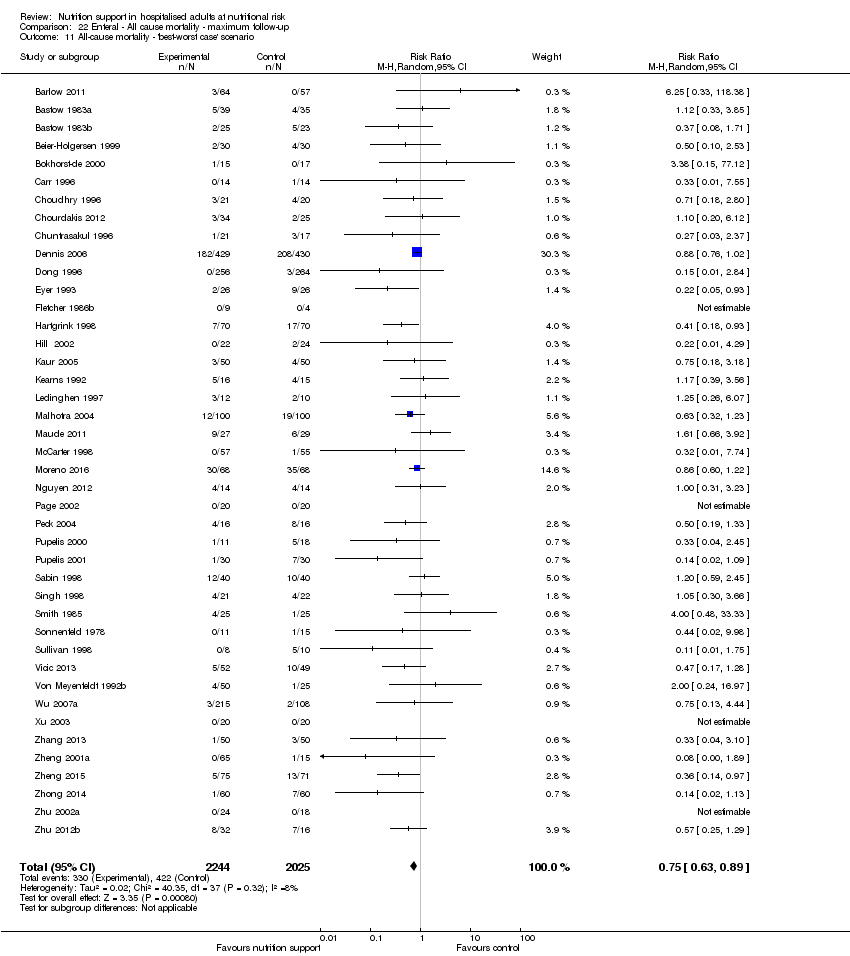
Comparison 22 Enteral ‐ All cause mortality ‐ maximum follow‐up, Outcome 12 All‐cause mortality ‐ 'worst‐best case' scenario.

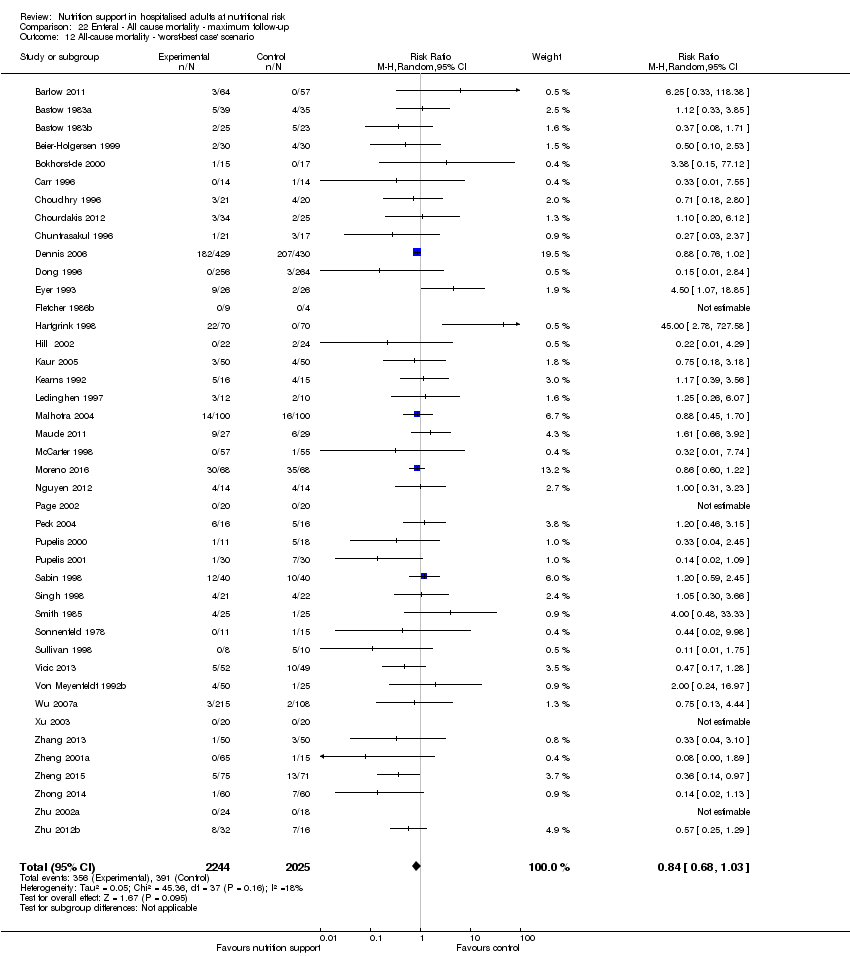
Comparison 22 Enteral ‐ All cause mortality ‐ maximum follow‐up, Outcome 13 All‐cause mortality co‐interventions.

Comparison 23 Enteral ‐ Serious adverse event end of intervention, Outcome 1 Serious adverse events ‐ overall.

Comparison 23 Enteral ‐ Serious adverse event end of intervention, Outcome 2 Serious adverse events ‐ bias.

Comparison 23 Enteral ‐ Serious adverse event end of intervention, Outcome 3 Serious adverse events ‐ by medical specialty.

Comparison 23 Enteral ‐ Serious adverse event end of intervention, Outcome 4 Serious adverse events ‐ based on adequacy of the amount of calories.
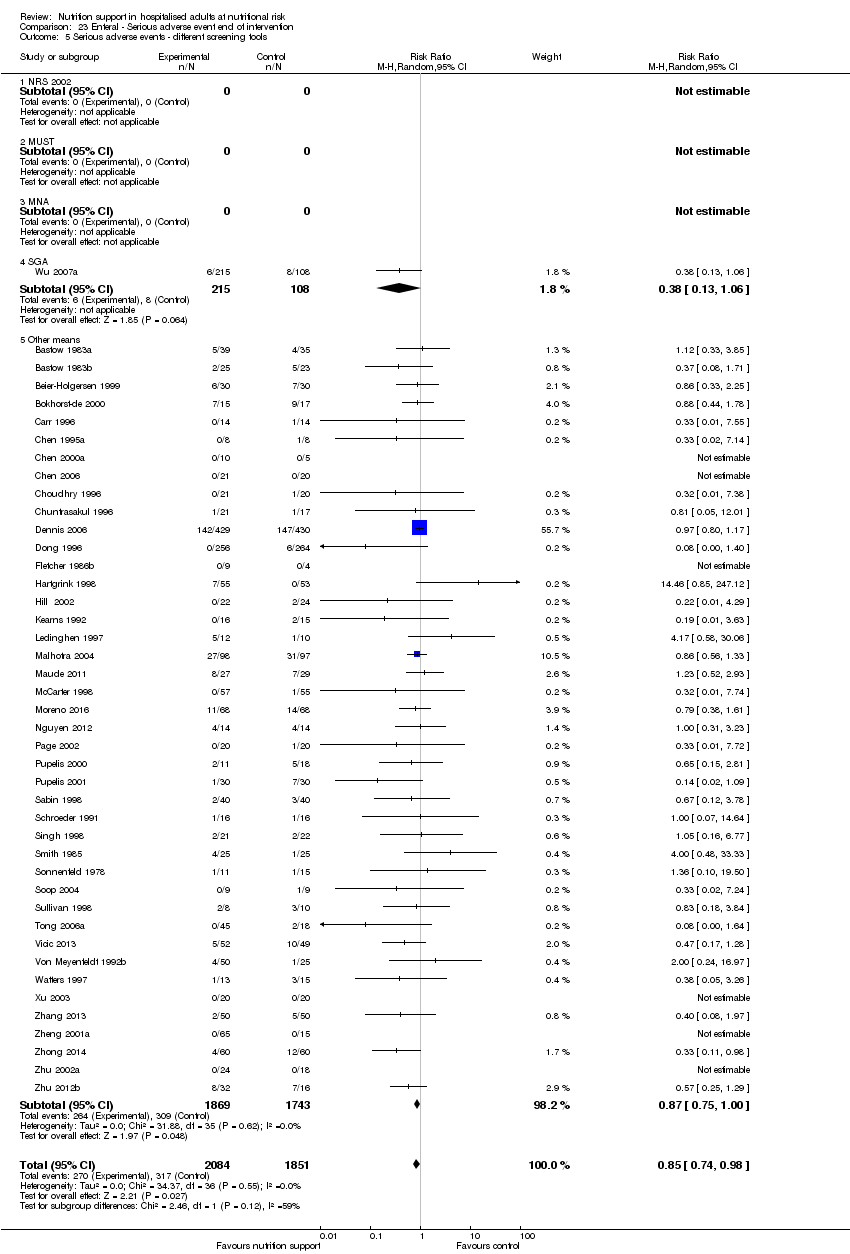
Comparison 23 Enteral ‐ Serious adverse event end of intervention, Outcome 5 Serious adverse events ‐ different screening tools.

Comparison 23 Enteral ‐ Serious adverse event end of intervention, Outcome 6 Serious adverse events ‐ participants characterised as 'at nutritional risk' due to one of the following conditions.

Comparison 23 Enteral ‐ Serious adverse event end of intervention, Outcome 7 Serious adverse events ‐ participants characterised as 'at nutritional risk' due to one of the following criteria.

Comparison 23 Enteral ‐ Serious adverse event end of intervention, Outcome 8 Serious adverse events ‐ participants characterised as 'at nutritional risk' due to biomarkers or anthropometrics.
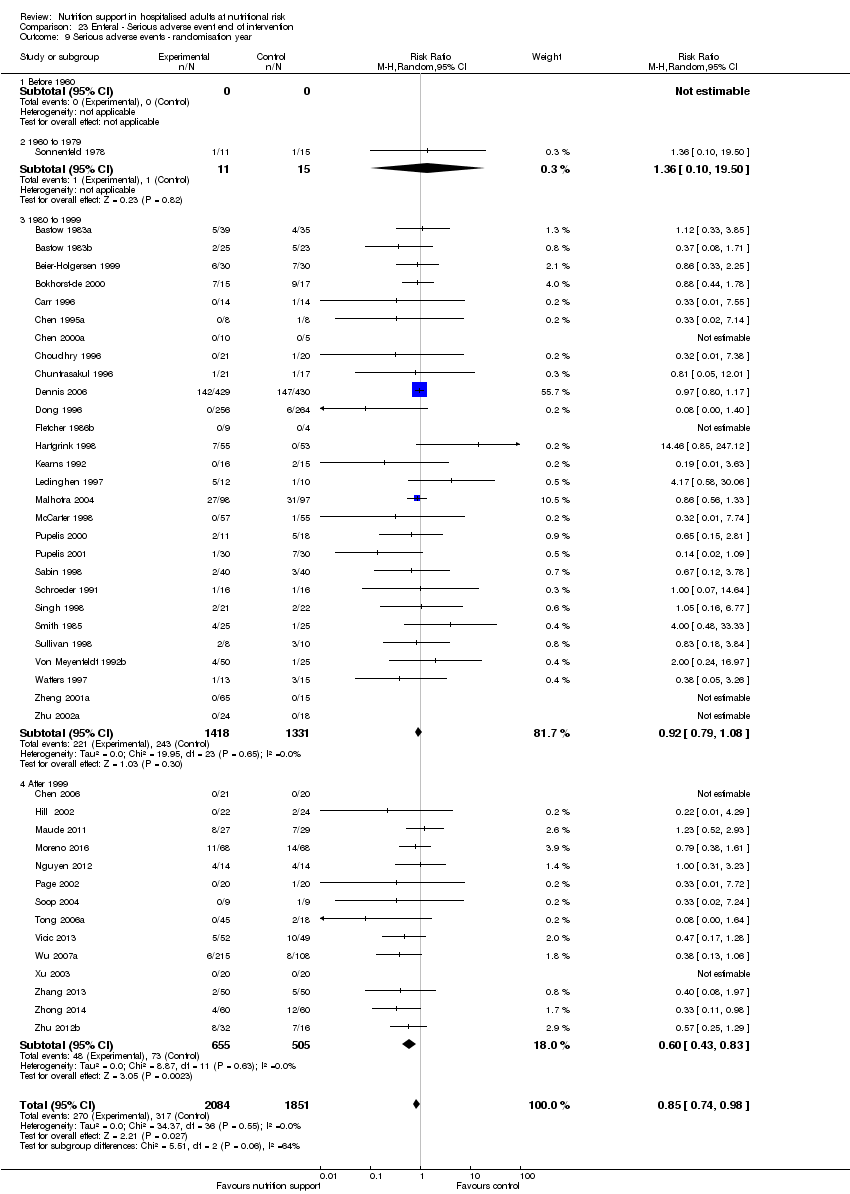
Comparison 23 Enteral ‐ Serious adverse event end of intervention, Outcome 9 Serious adverse events ‐ randomisation year.

Comparison 23 Enteral ‐ Serious adverse event end of intervention, Outcome 10 Serious adverse events ‐ trials where the intervention lasts fewer than three days compared with trials where the intervention lasts three days or more.
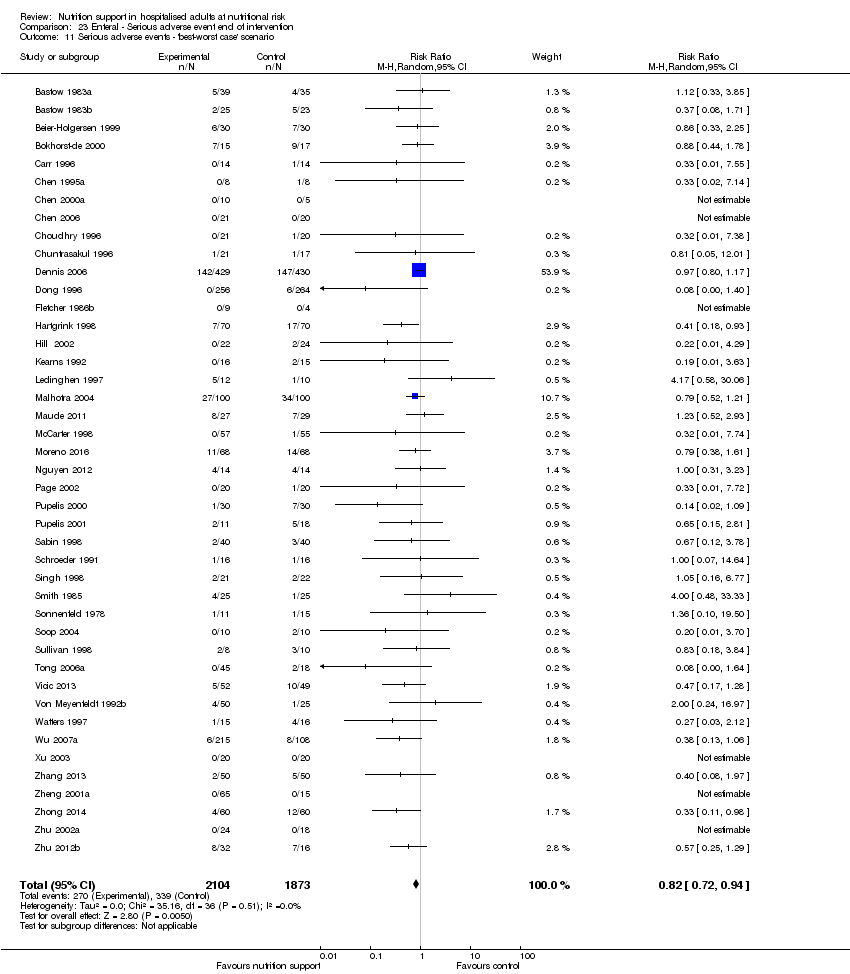
Comparison 23 Enteral ‐ Serious adverse event end of intervention, Outcome 11 Serious adverse events ‐ 'best‐worst case' scenario.

Comparison 23 Enteral ‐ Serious adverse event end of intervention, Outcome 12 Serious adverse events ‐ 'worst‐best case' scenario.

Comparison 23 Enteral ‐ Serious adverse event end of intervention, Outcome 13 Serious adverse events co‐interventions.
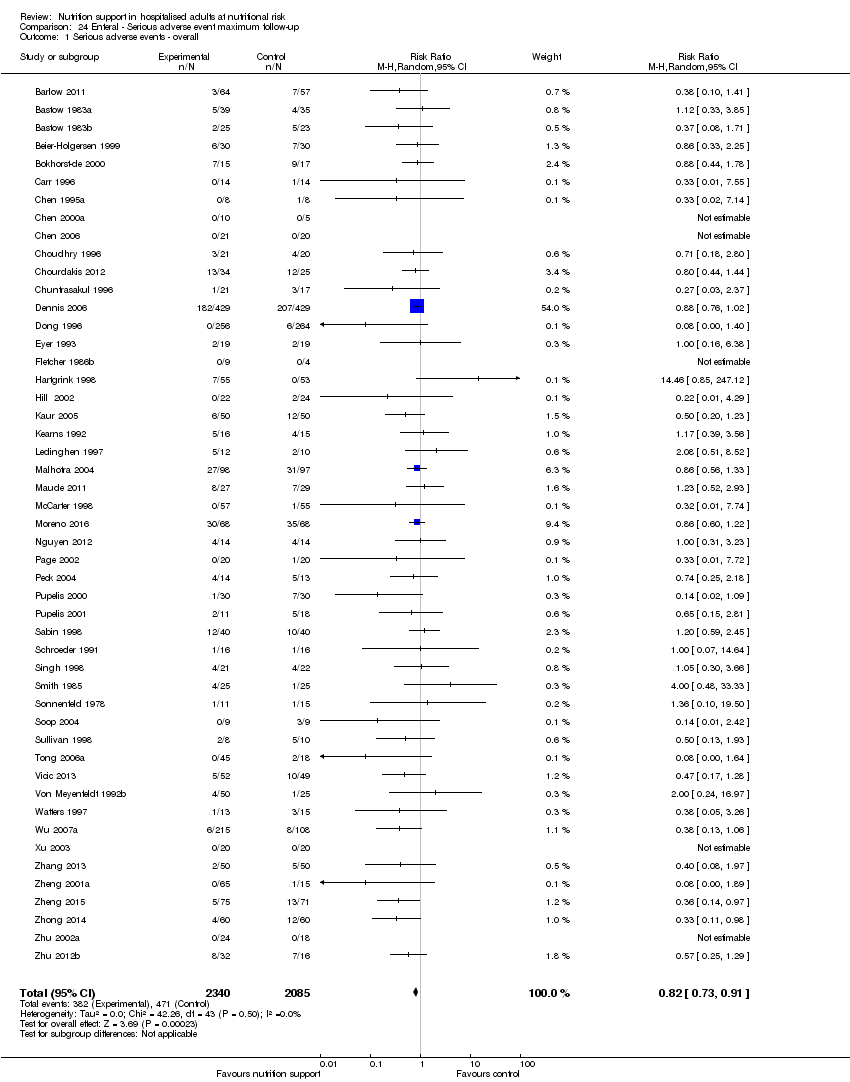
Comparison 24 Enteral ‐ Serious adverse event maximum follow‐up, Outcome 1 Serious adverse events ‐ overall.

Comparison 24 Enteral ‐ Serious adverse event maximum follow‐up, Outcome 2 Serious adverse events ‐ bias.
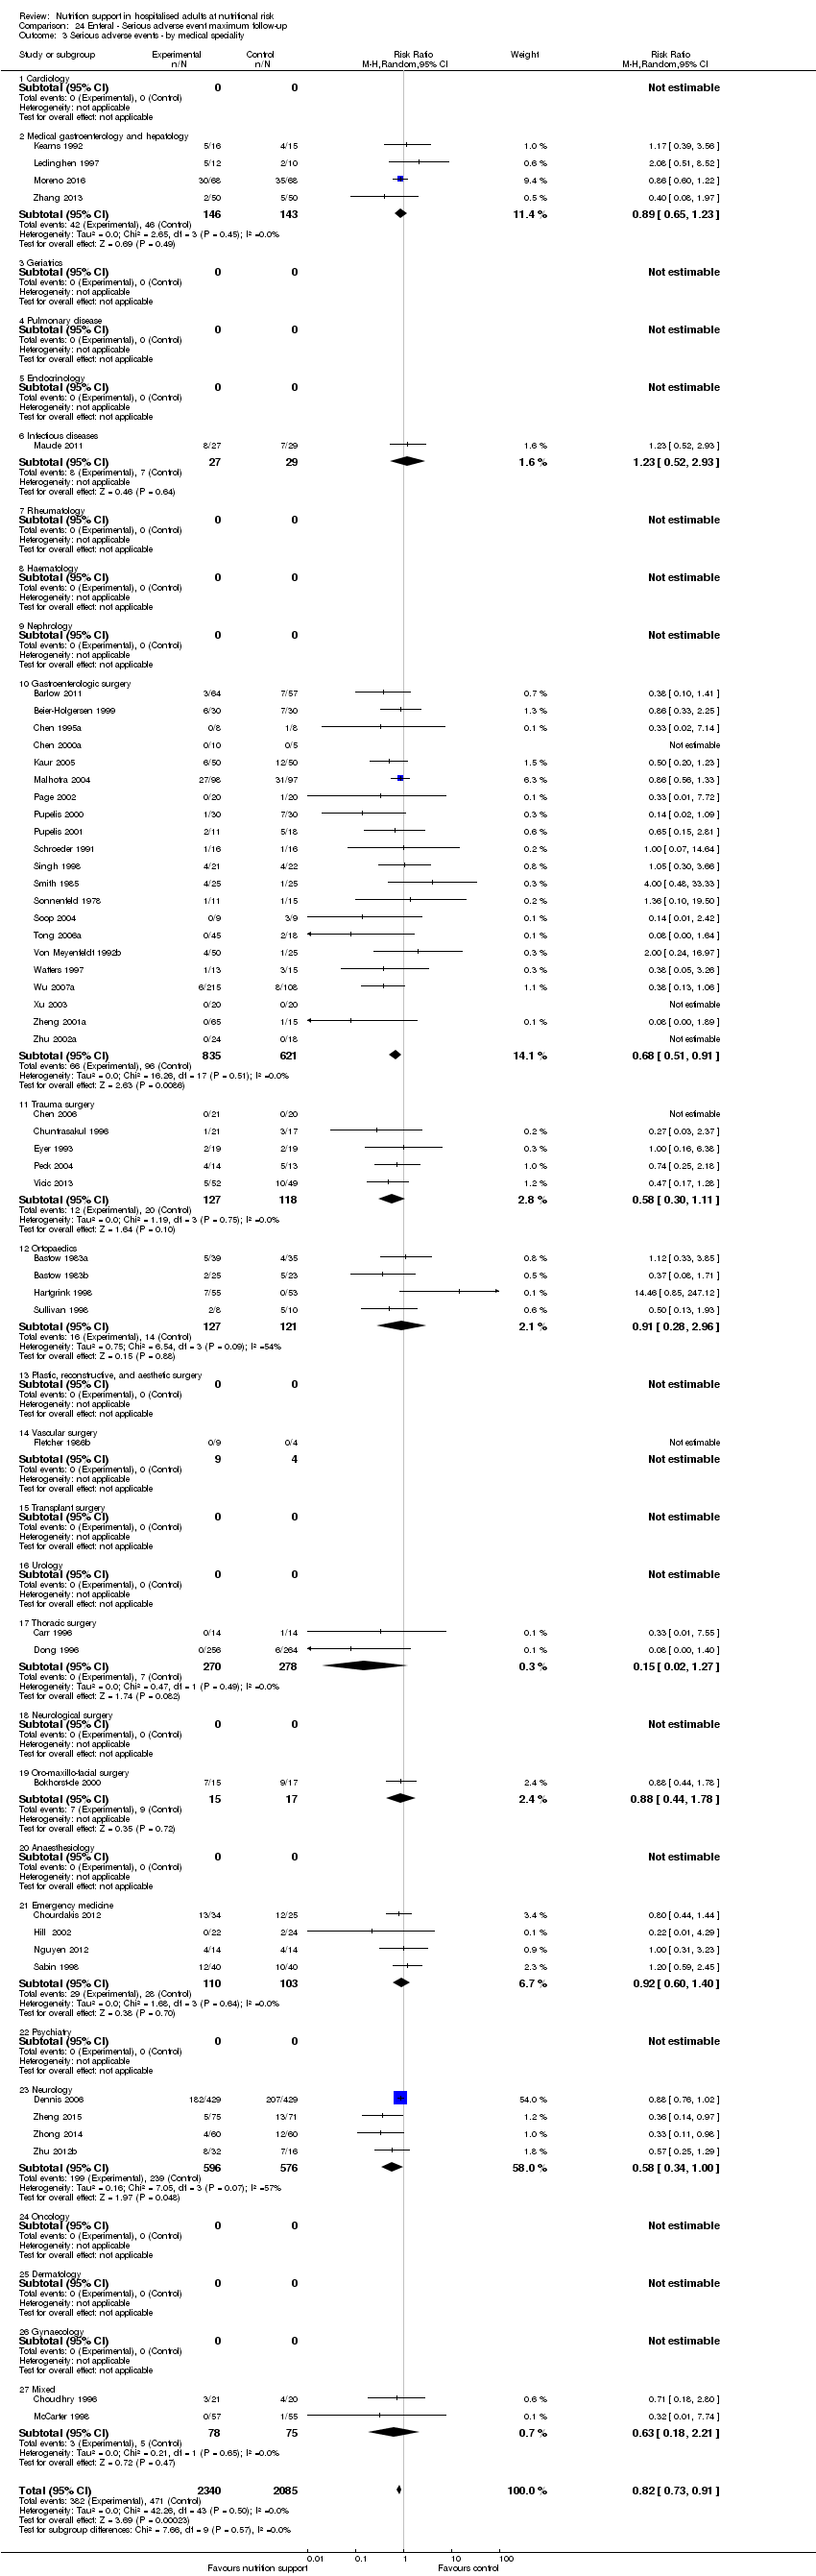
Comparison 24 Enteral ‐ Serious adverse event maximum follow‐up, Outcome 3 Serious adverse events ‐ by medical speciality.

Comparison 24 Enteral ‐ Serious adverse event maximum follow‐up, Outcome 4 Serious adverse events ‐ based on adequacy of the amount of calories.

Comparison 24 Enteral ‐ Serious adverse event maximum follow‐up, Outcome 5 Serious adverse events ‐ different screening tools.

Comparison 24 Enteral ‐ Serious adverse event maximum follow‐up, Outcome 6 Serious adverse events ‐ participants characterised as 'at nutritional risk' due to one of the following conditions.

Comparison 24 Enteral ‐ Serious adverse event maximum follow‐up, Outcome 7 Serious adverse events ‐ participants characterised as 'at nutritional risk' due to one of the following criteria.

Comparison 24 Enteral ‐ Serious adverse event maximum follow‐up, Outcome 8 Serious adverse events ‐ participants characterised as 'at nutritional risk' due to biomarkers or anthropometrics.

Comparison 24 Enteral ‐ Serious adverse event maximum follow‐up, Outcome 9 Serious adverse events ‐ randomisation year.

Comparison 24 Enteral ‐ Serious adverse event maximum follow‐up, Outcome 10 Serious adverse events ‐ trials where the intervention lasts fewer than three days compared with trials where the intervention lasts three days or more.

Comparison 24 Enteral ‐ Serious adverse event maximum follow‐up, Outcome 11 Serious adverse events co‐interventions.

Comparison 24 Enteral ‐ Serious adverse event maximum follow‐up, Outcome 12 Serious adverse events ‐ 'best‐worse case' scenario (enteral nutrition).

Comparison 24 Enteral ‐ Serious adverse event maximum follow‐up, Outcome 13 Serious adverse events ‐ 'worst‐best case' scenario (enteral nutrition).
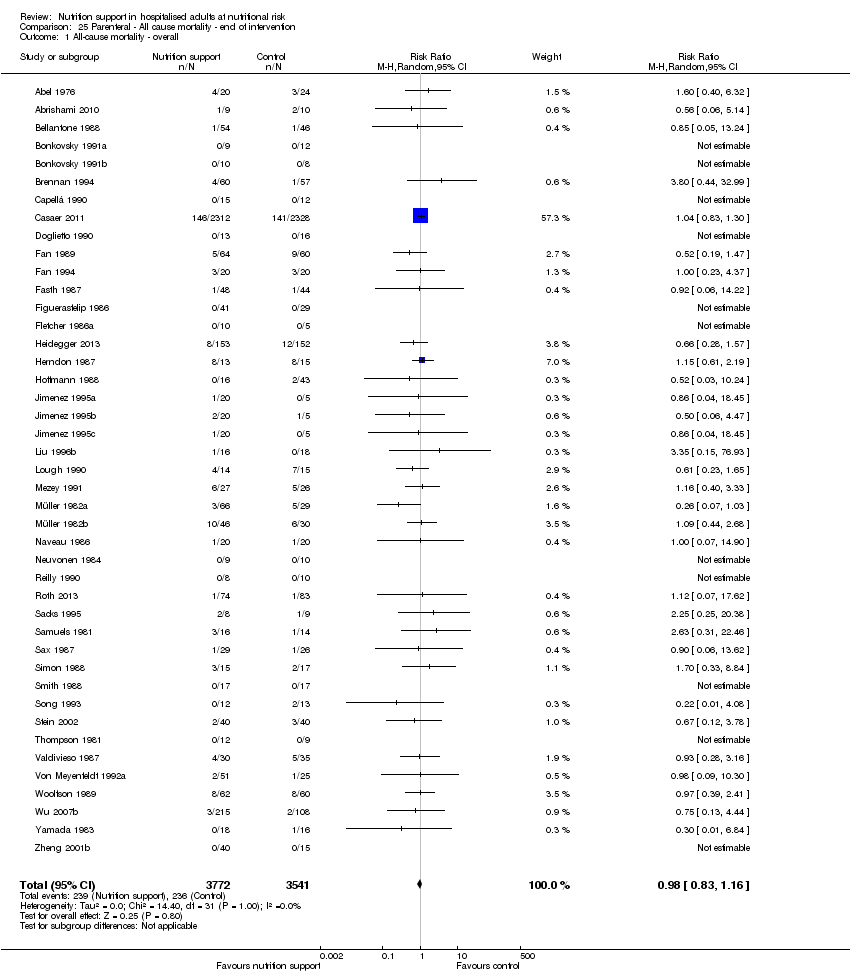
Comparison 25 Parenteral ‐ All cause mortality ‐ end of intervention, Outcome 1 All‐cause mortality ‐ overall.

Comparison 25 Parenteral ‐ All cause mortality ‐ end of intervention, Outcome 2 All‐cause mortality ‐ bias.
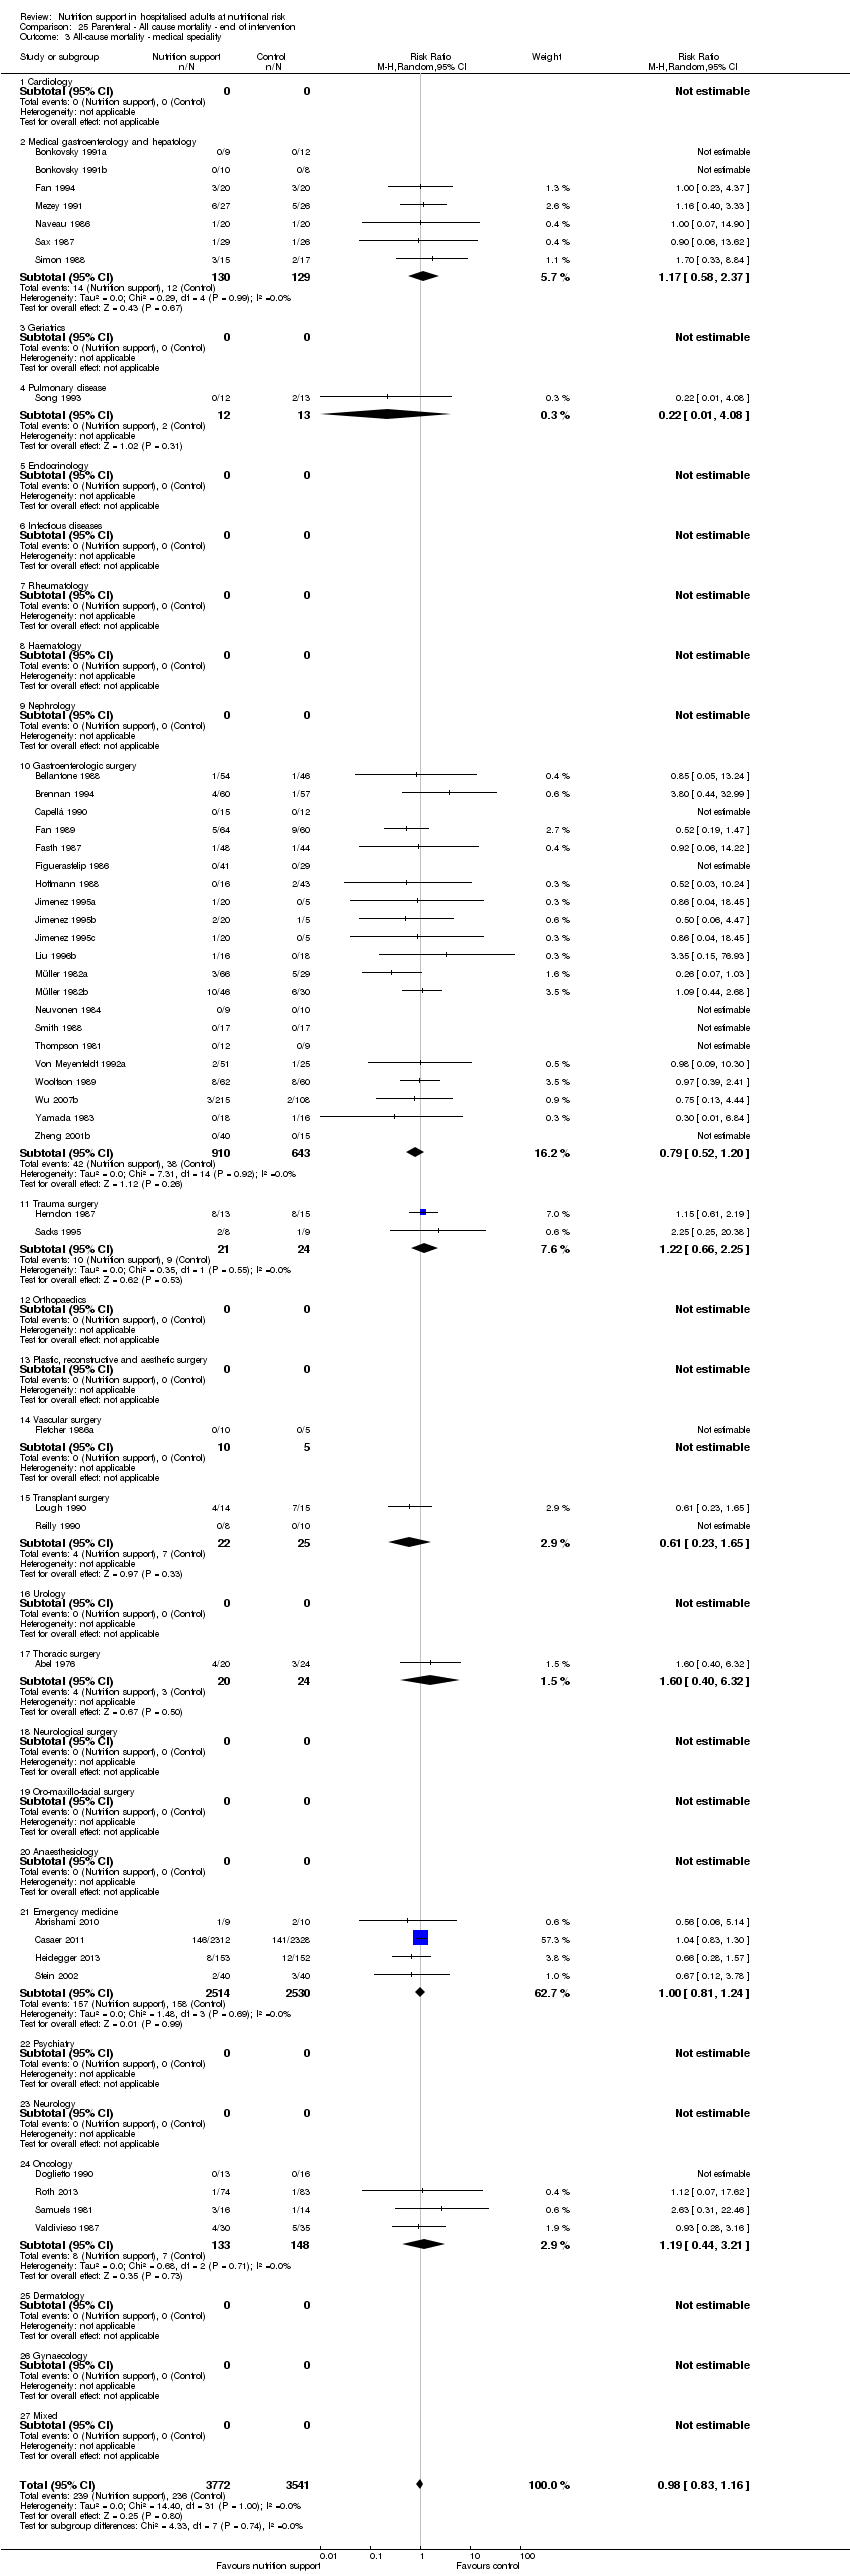
Comparison 25 Parenteral ‐ All cause mortality ‐ end of intervention, Outcome 3 All‐cause mortality ‐ medical speciality.

Comparison 25 Parenteral ‐ All cause mortality ‐ end of intervention, Outcome 4 All‐cause mortality ‐ based on adequacy of the amount of calories.

Comparison 25 Parenteral ‐ All cause mortality ‐ end of intervention, Outcome 5 All‐cause mortality ‐ different screening tools.
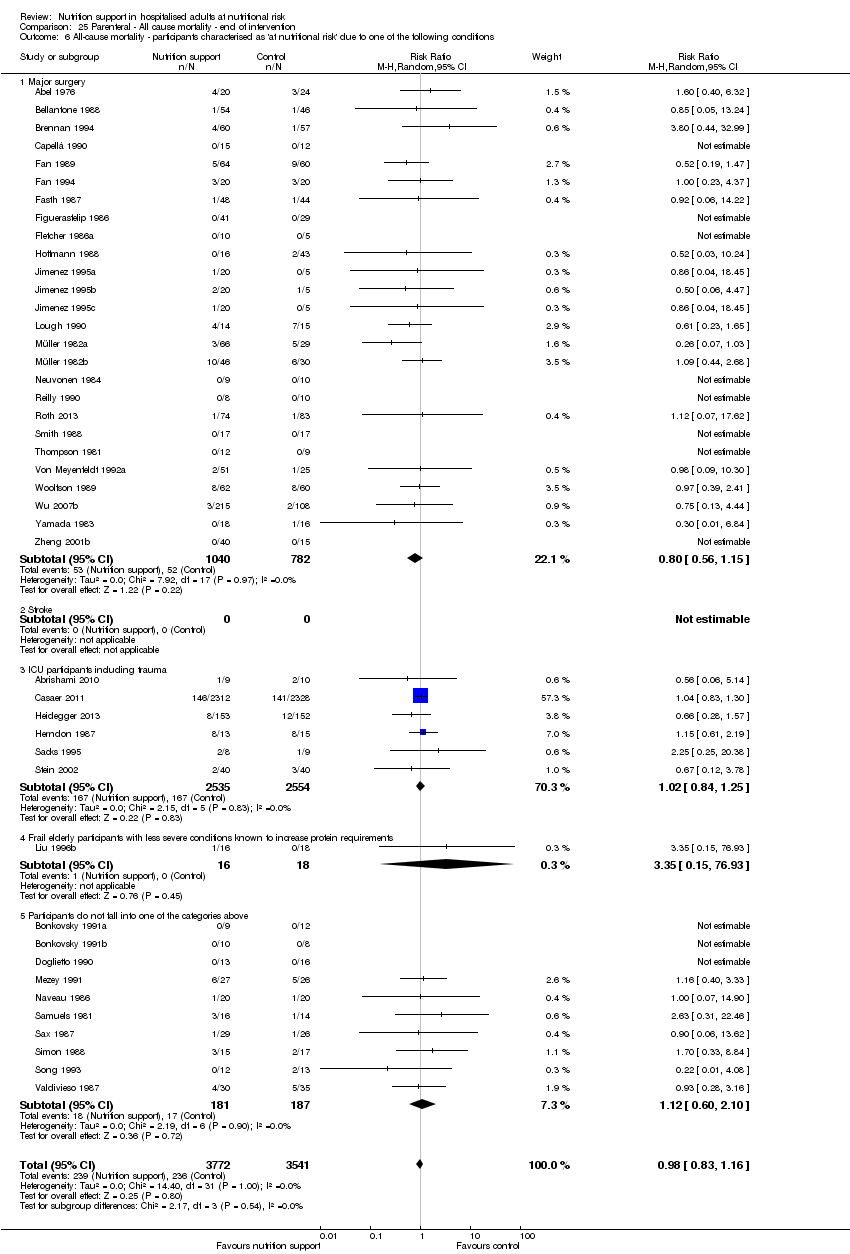
Comparison 25 Parenteral ‐ All cause mortality ‐ end of intervention, Outcome 6 All‐cause mortality ‐ participants characterised as 'at nutritional risk' due to one of the following conditions.

Comparison 25 Parenteral ‐ All cause mortality ‐ end of intervention, Outcome 7 All‐cause mortality ‐ participants characterised as 'at nutritional risk' due to one of the following criteria.
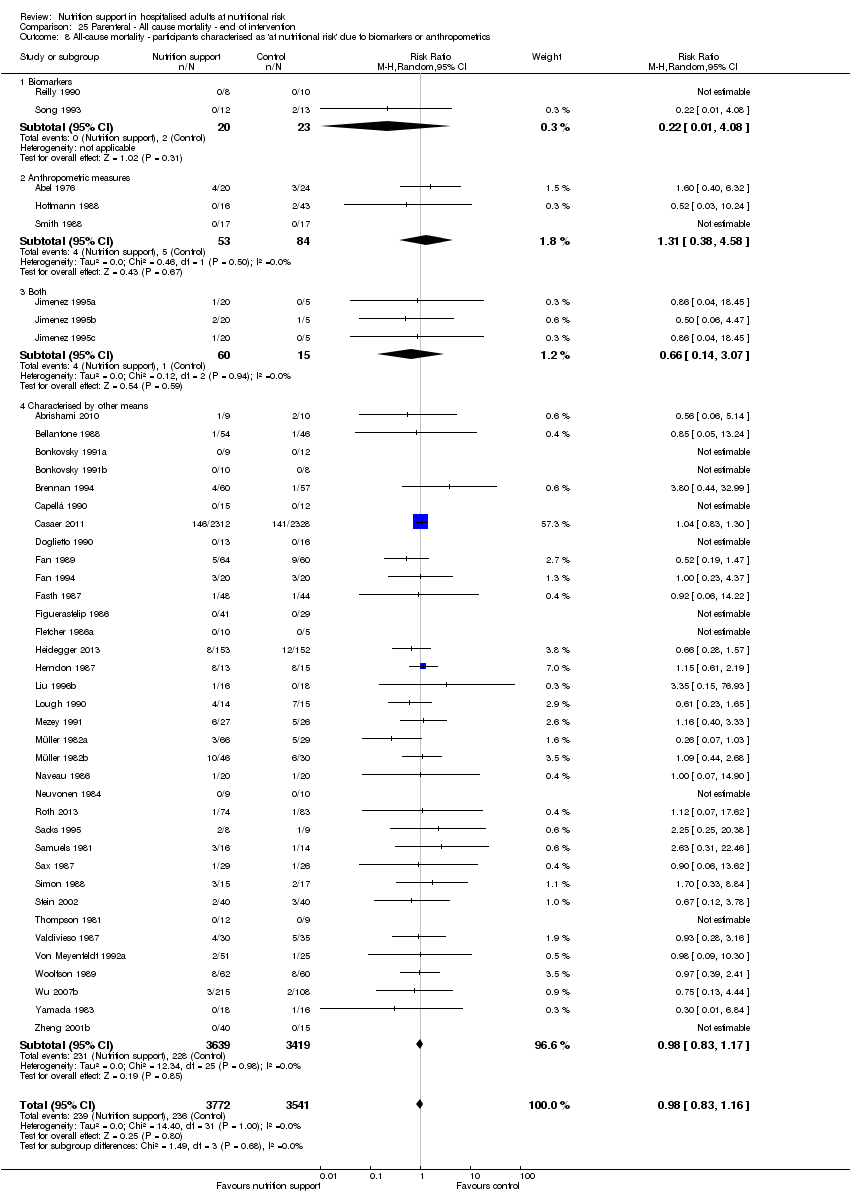
Comparison 25 Parenteral ‐ All cause mortality ‐ end of intervention, Outcome 8 All‐cause mortality ‐ participants characterised as 'at nutritional risk' due to biomarkers or anthropometrics.

Comparison 25 Parenteral ‐ All cause mortality ‐ end of intervention, Outcome 9 All‐cause mortality ‐ randomisation year.

Comparison 25 Parenteral ‐ All cause mortality ‐ end of intervention, Outcome 10 All‐cause mortality ‐ trials where the intervention lasts fewer than three days compared with trials where the intervention lasts three days or more.

Comparison 25 Parenteral ‐ All cause mortality ‐ end of intervention, Outcome 11 All‐cause mortality ‐ 'best‐worst case' scenario.

Comparison 25 Parenteral ‐ All cause mortality ‐ end of intervention, Outcome 12 All‐cause mortality ‐ 'worst‐best case' scenario.
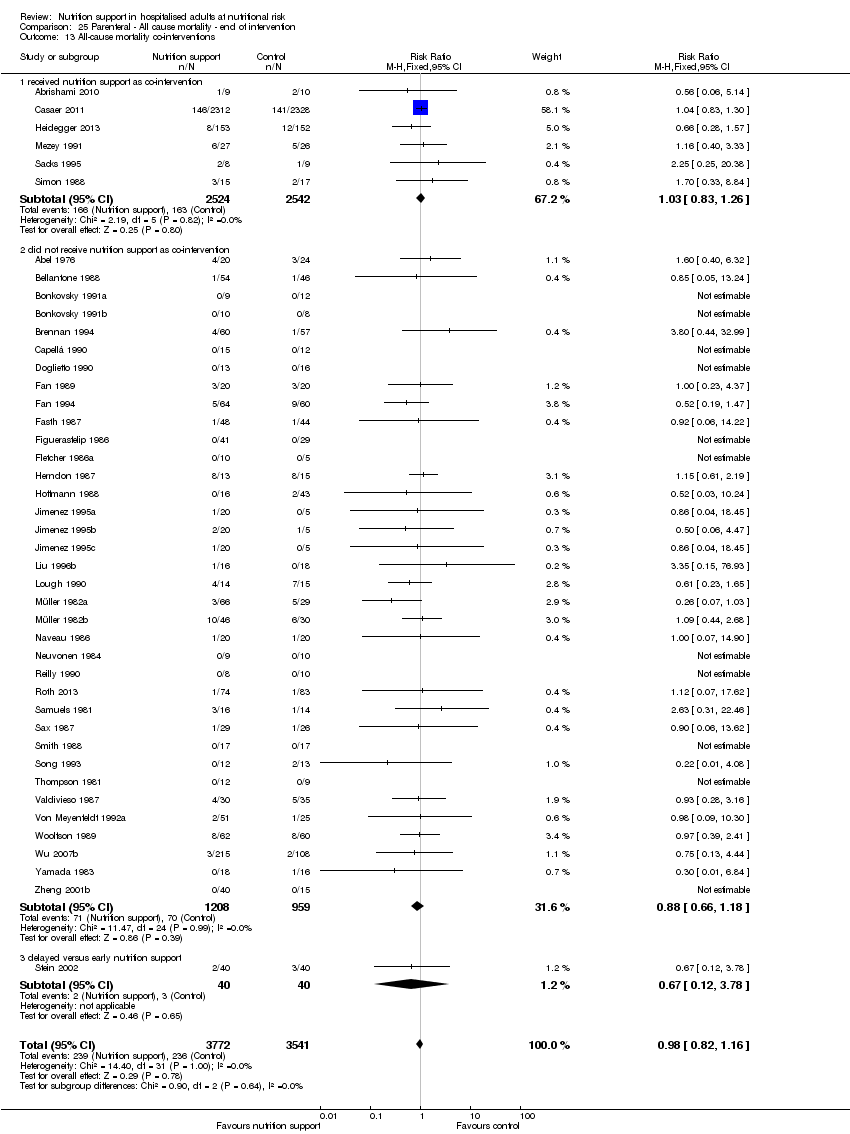
Comparison 25 Parenteral ‐ All cause mortality ‐ end of intervention, Outcome 13 All‐cause mortality co‐interventions.

Comparison 26 Parenteral ‐ All cause mortality ‐ maximum follow‐up, Outcome 1 All‐cause mortality ‐ overall.
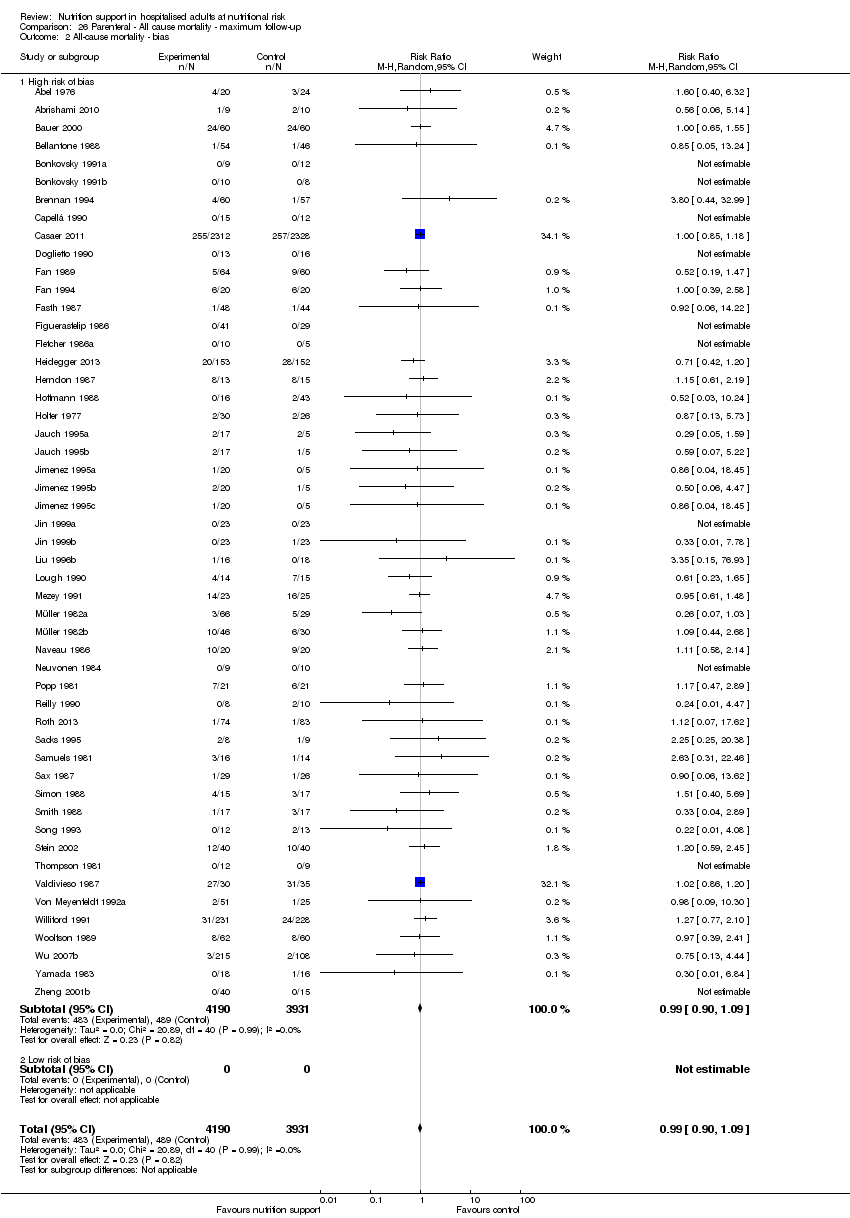
Comparison 26 Parenteral ‐ All cause mortality ‐ maximum follow‐up, Outcome 2 All‐cause mortality ‐ bias.

Comparison 26 Parenteral ‐ All cause mortality ‐ maximum follow‐up, Outcome 3 All‐cause mortality ‐ medical speciality.
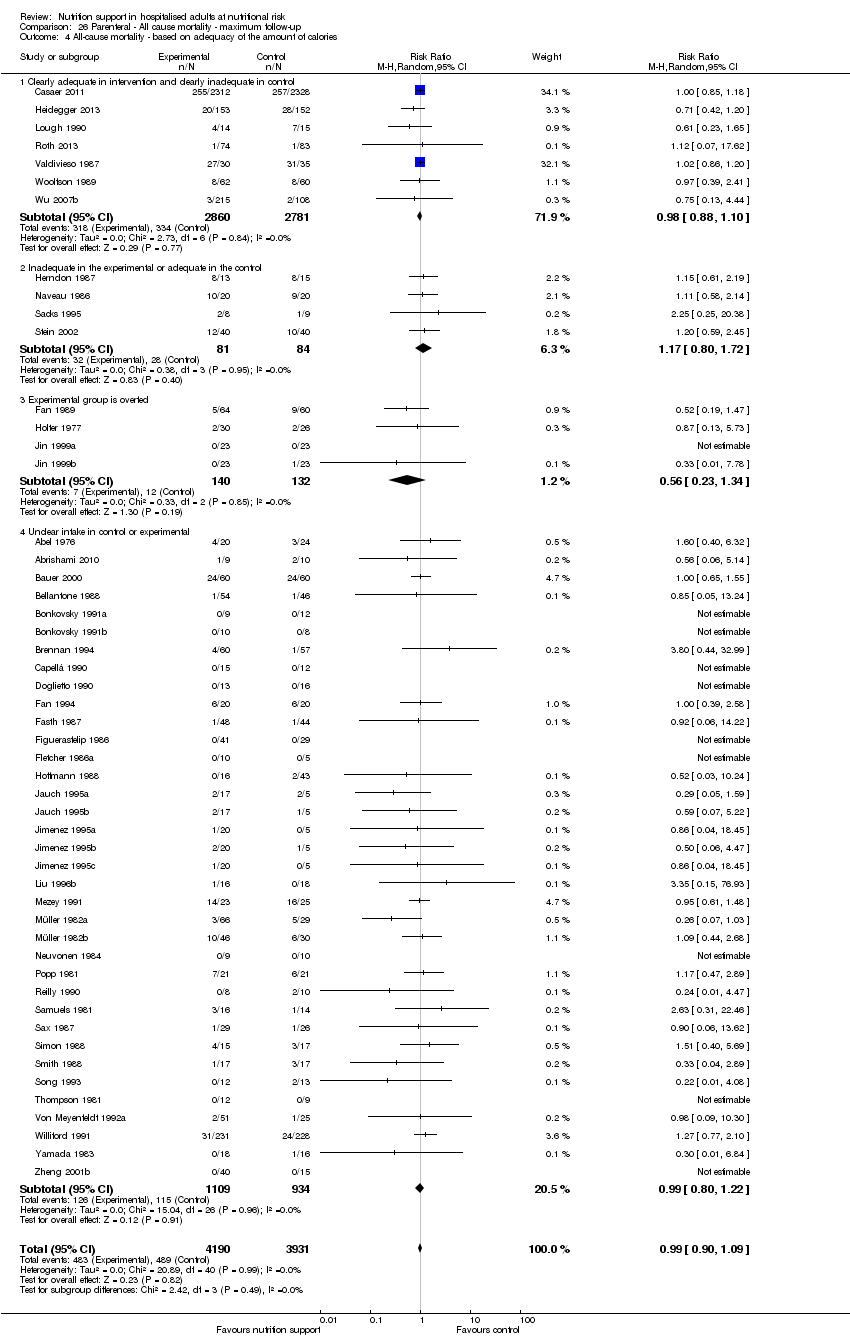
Comparison 26 Parenteral ‐ All cause mortality ‐ maximum follow‐up, Outcome 4 All‐cause mortality ‐ based on adequacy of the amount of calories.

Comparison 26 Parenteral ‐ All cause mortality ‐ maximum follow‐up, Outcome 5 All‐cause mortality ‐ different screening tools.

Comparison 26 Parenteral ‐ All cause mortality ‐ maximum follow‐up, Outcome 6 All‐cause mortality ‐ participants characterised as 'at nutritional risk' due to one of the following conditions.
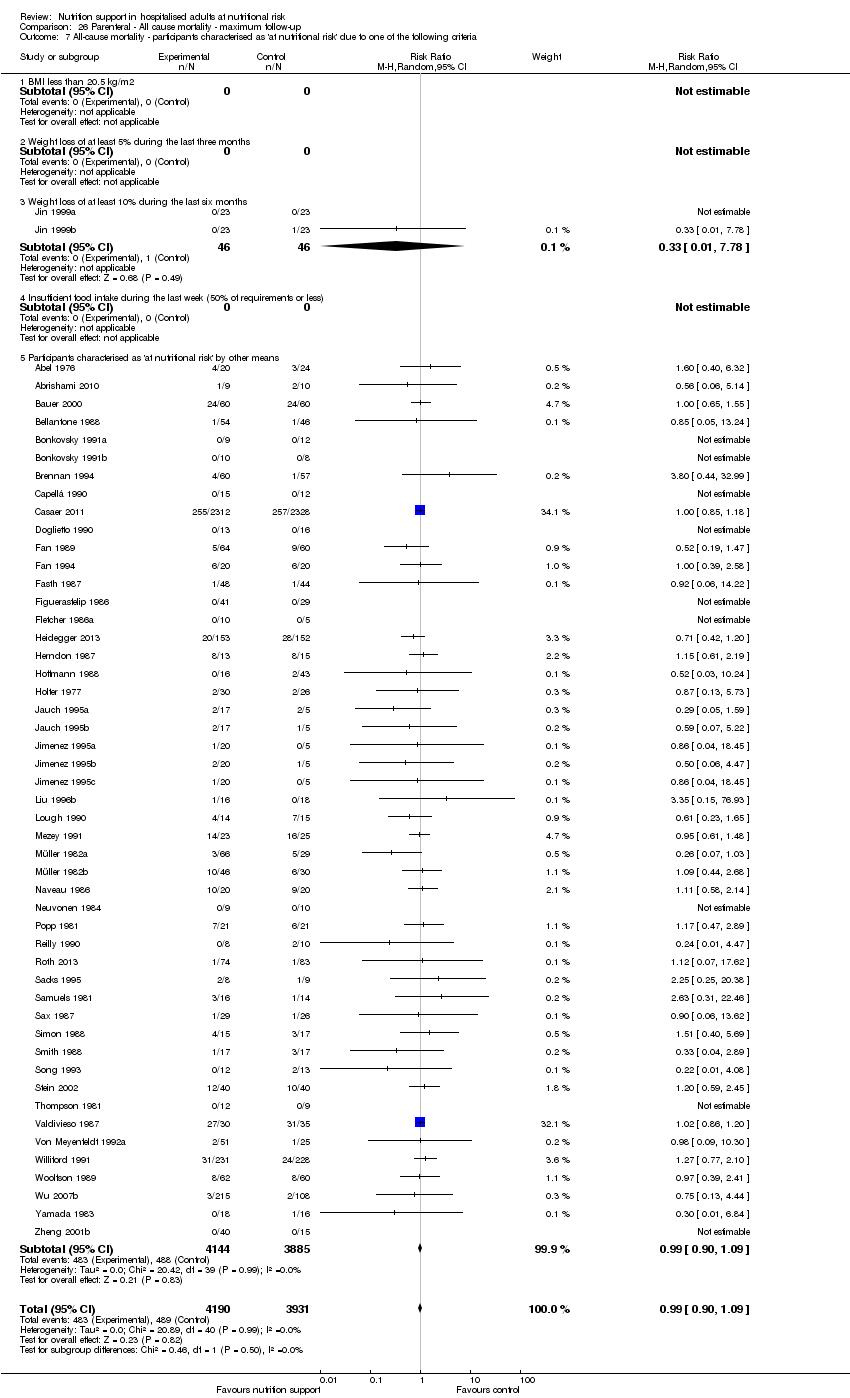
Comparison 26 Parenteral ‐ All cause mortality ‐ maximum follow‐up, Outcome 7 All‐cause mortality ‐ participants characterised as 'at nutritional risk' due to one of the following criteria.

Comparison 26 Parenteral ‐ All cause mortality ‐ maximum follow‐up, Outcome 8 All‐cause mortality ‐ participants characterised as 'at nutritional risk' due to biomarkers or anthropometrics.

Comparison 26 Parenteral ‐ All cause mortality ‐ maximum follow‐up, Outcome 9 All‐cause mortality ‐ randomisation year.
Comparison 26 Parenteral ‐ All cause mortality ‐ maximum follow‐up, Outcome 10 All‐cause mortality ‐ trials where the intervention lasts fewer than three days compared with trials where the intervention lasts three days or more.

Comparison 26 Parenteral ‐ All cause mortality ‐ maximum follow‐up, Outcome 11 All‐cause mortality ‐ 'best‐worst case' scenario.

Comparison 26 Parenteral ‐ All cause mortality ‐ maximum follow‐up, Outcome 12 All‐cause mortality ‐ 'worst‐best case' scenario.

Comparison 26 Parenteral ‐ All cause mortality ‐ maximum follow‐up, Outcome 13 All‐cause mortality co‐interventions.
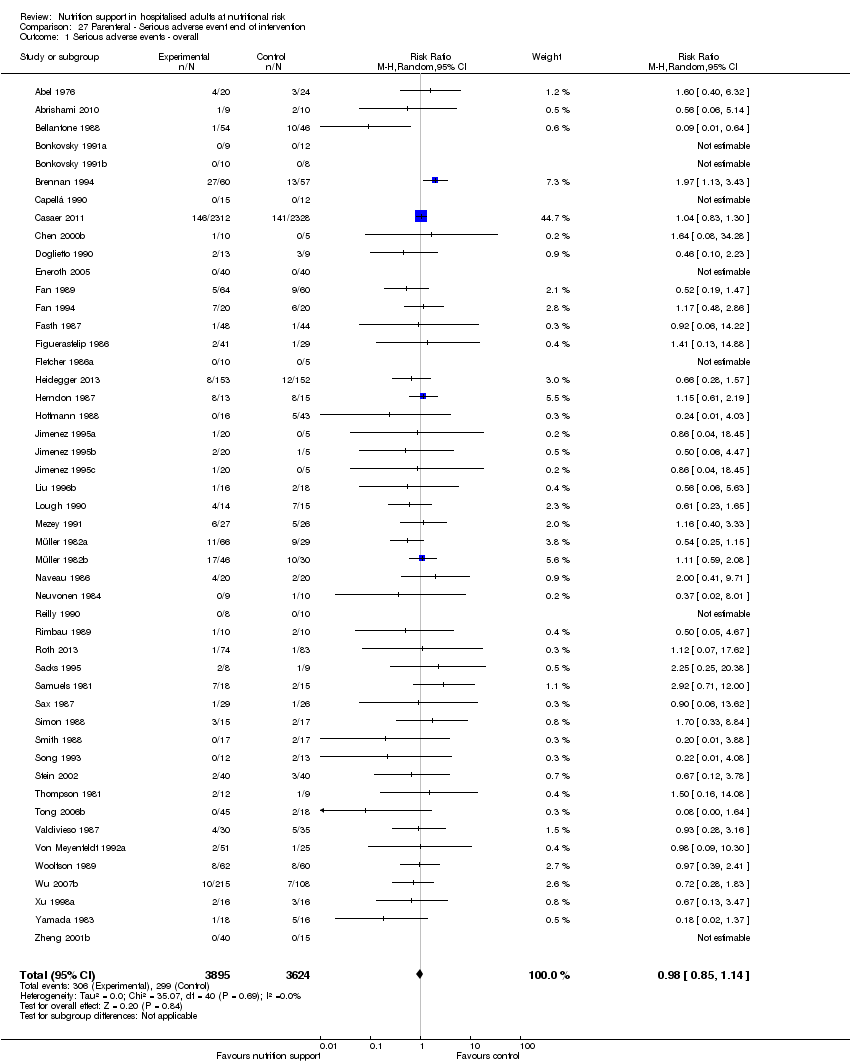
Comparison 27 Parenteral ‐ Serious adverse event end of intervention, Outcome 1 Serious adverse events ‐ overall.

Comparison 27 Parenteral ‐ Serious adverse event end of intervention, Outcome 2 Serious adverse events ‐ bias.

Comparison 27 Parenteral ‐ Serious adverse event end of intervention, Outcome 3 Serious adverse events ‐ by medical specialty.

Comparison 27 Parenteral ‐ Serious adverse event end of intervention, Outcome 4 Serious adverse events ‐ based on adequacy of the amount of calories.

Comparison 27 Parenteral ‐ Serious adverse event end of intervention, Outcome 5 Serious adverse events ‐ different screening tools.

Comparison 27 Parenteral ‐ Serious adverse event end of intervention, Outcome 6 Serious adverse events ‐ participants characterised as 'at nutritional risk' due to one of the following conditions.

Comparison 27 Parenteral ‐ Serious adverse event end of intervention, Outcome 7 Serious adverse events ‐ participants characterised as 'at nutritional risk' due to one of the following criteria.

Comparison 27 Parenteral ‐ Serious adverse event end of intervention, Outcome 8 Serious adverse events ‐ participants characterised as 'at nutritional risk' due to biomarkers or anthropometrics.

Comparison 27 Parenteral ‐ Serious adverse event end of intervention, Outcome 9 Serious adverse events ‐ randomisation year.
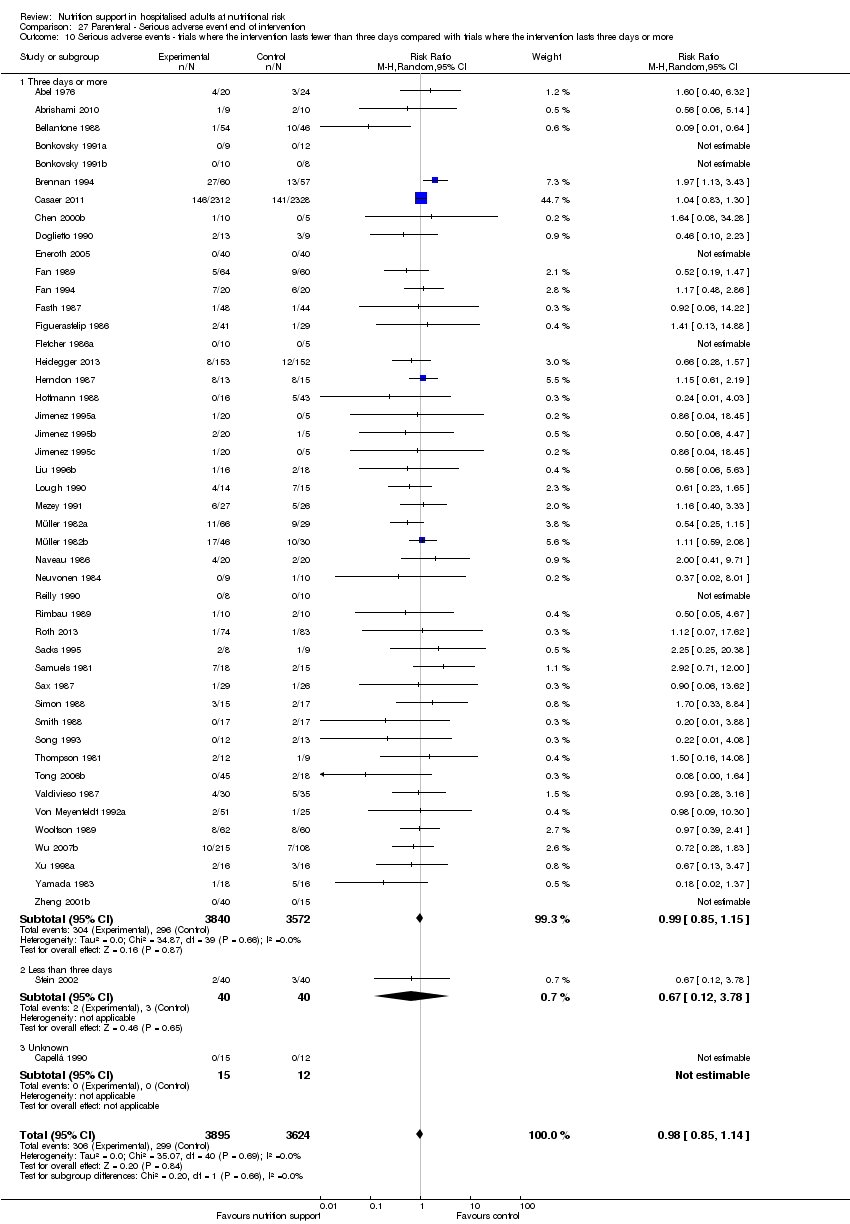
Comparison 27 Parenteral ‐ Serious adverse event end of intervention, Outcome 10 Serious adverse events ‐ trials where the intervention lasts fewer than three days compared with trials where the intervention lasts three days or more.

Comparison 27 Parenteral ‐ Serious adverse event end of intervention, Outcome 11 Serious adverse events ‐ 'best‐worst case' scenario.
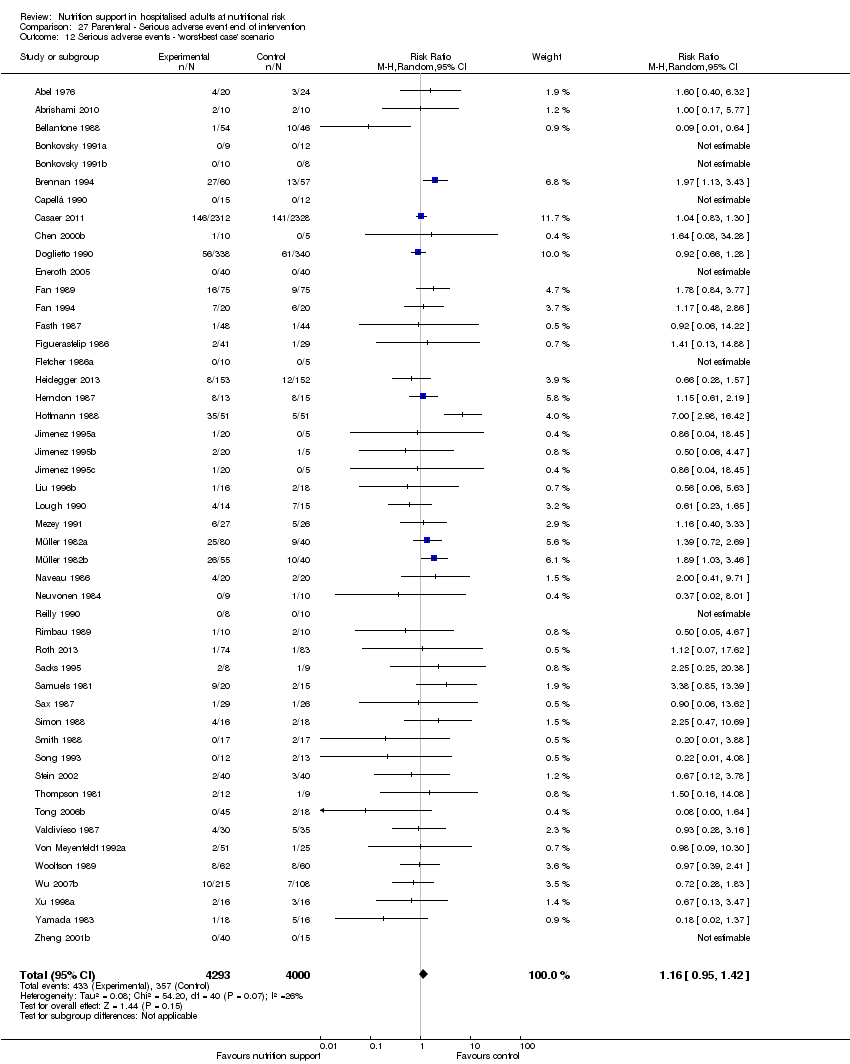
Comparison 27 Parenteral ‐ Serious adverse event end of intervention, Outcome 12 Serious adverse events ‐ 'worst‐best case' scenario.

Comparison 27 Parenteral ‐ Serious adverse event end of intervention, Outcome 13 Serious adverse events co‐interventions.

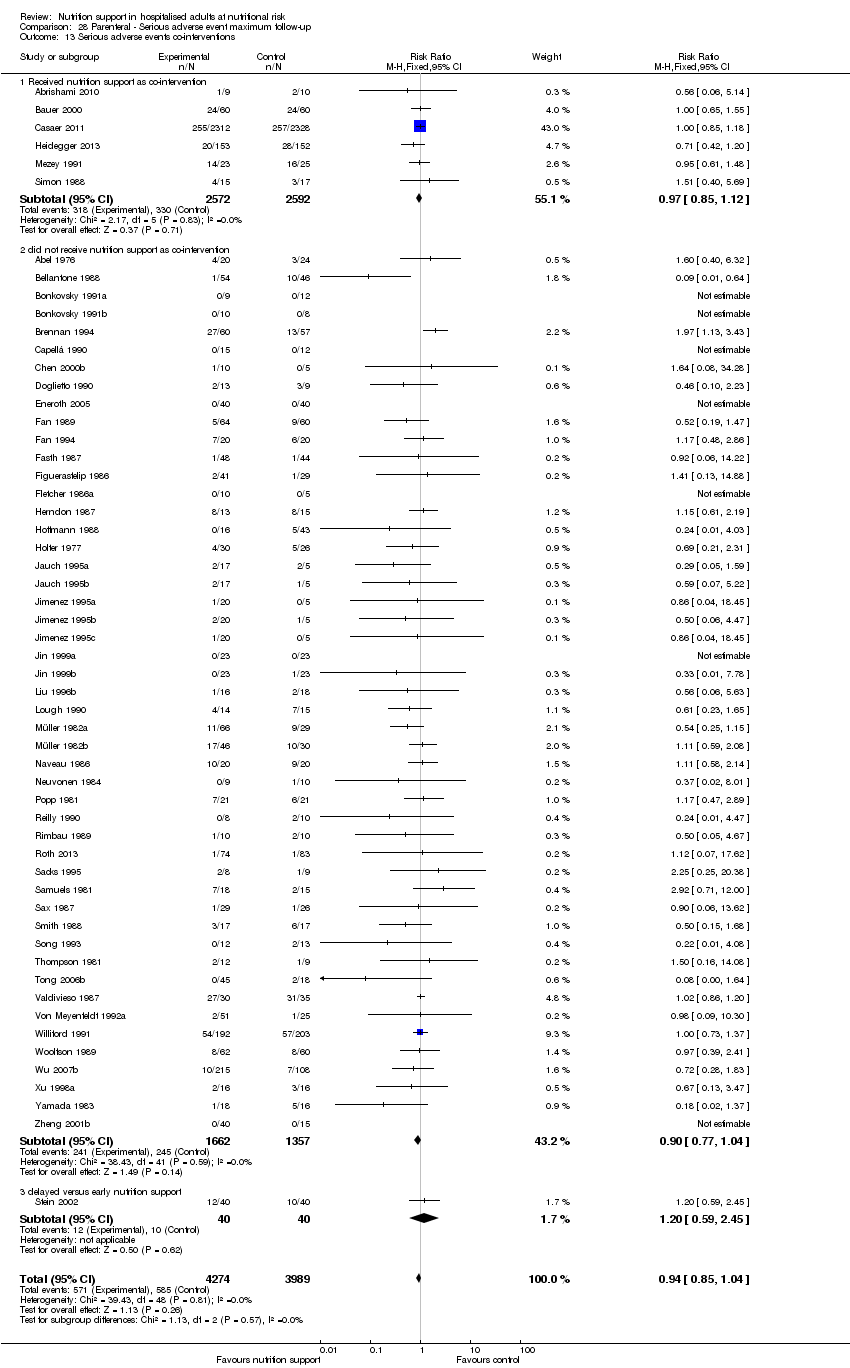
Comparison 28 Parenteral ‐ Serious adverse event maximum follow‐up, Outcome 1 Serious adverse events ‐ overall.
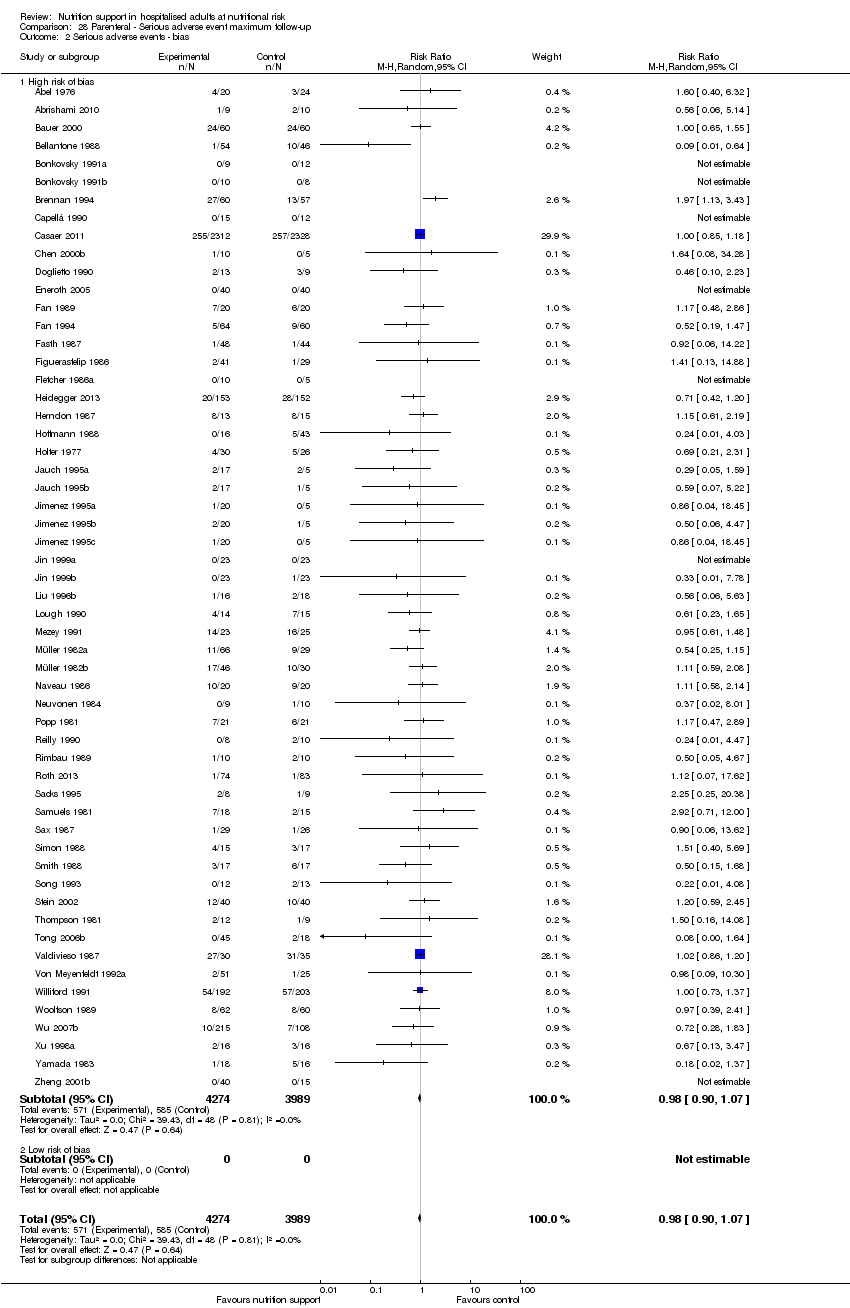
Comparison 28 Parenteral ‐ Serious adverse event maximum follow‐up, Outcome 2 Serious adverse events ‐ bias.

Comparison 28 Parenteral ‐ Serious adverse event maximum follow‐up, Outcome 3 Serious adverse events ‐ by medical speciality.

Comparison 28 Parenteral ‐ Serious adverse event maximum follow‐up, Outcome 4 Serious adverse events ‐ based on adequacy of the amount of calories.

Comparison 28 Parenteral ‐ Serious adverse event maximum follow‐up, Outcome 5 Serious adverse events ‐ different screening tools.
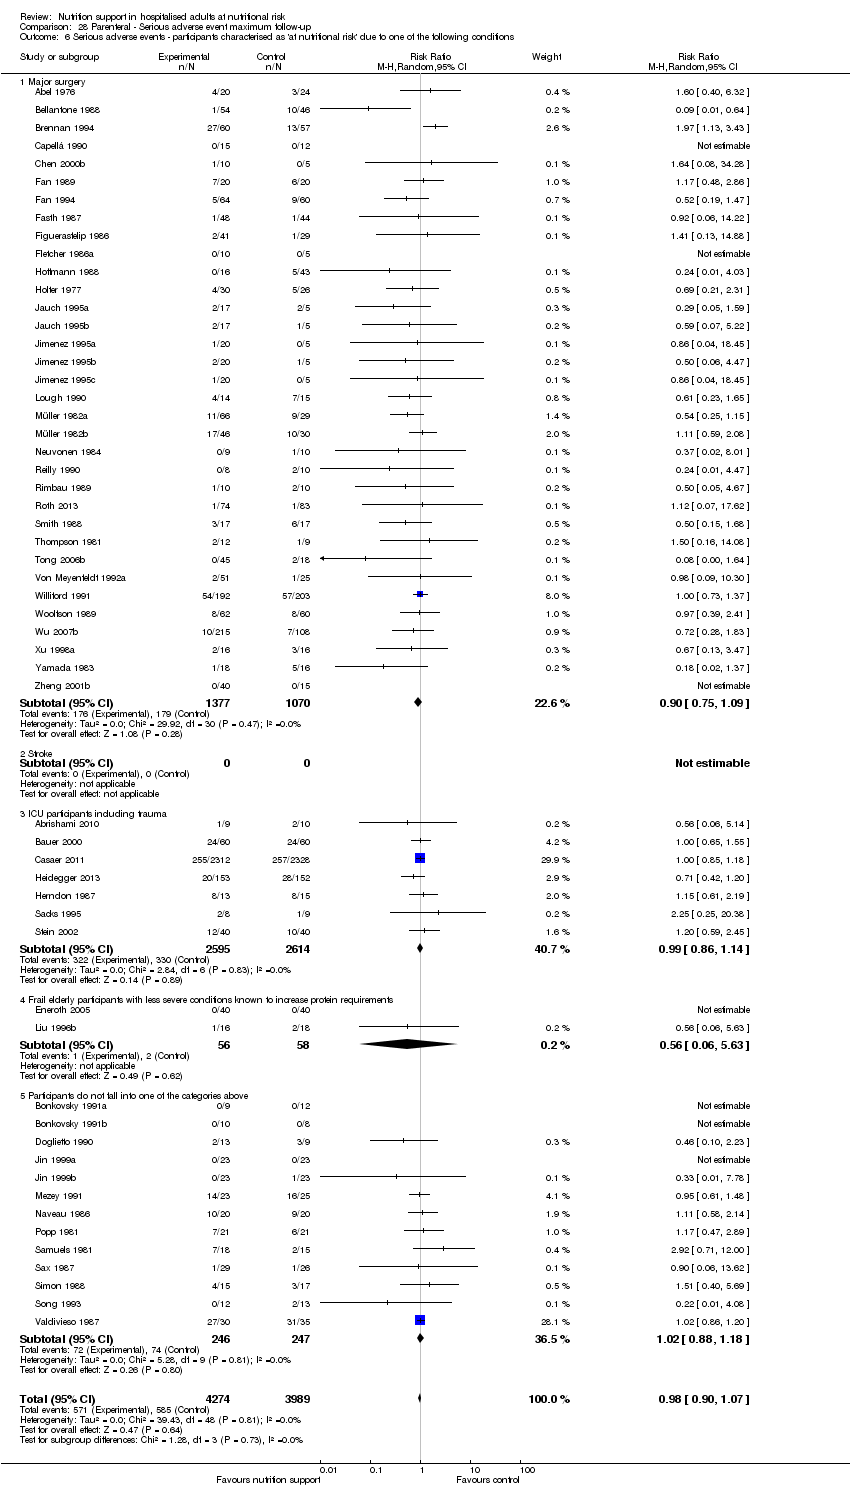
Comparison 28 Parenteral ‐ Serious adverse event maximum follow‐up, Outcome 6 Serious adverse events ‐ participants characterised as 'at nutritional risk' due to one of the following conditions.

Comparison 28 Parenteral ‐ Serious adverse event maximum follow‐up, Outcome 7 Serious adverse events ‐ participants characterised as 'at nutritional risk' due to one of the following criteria.
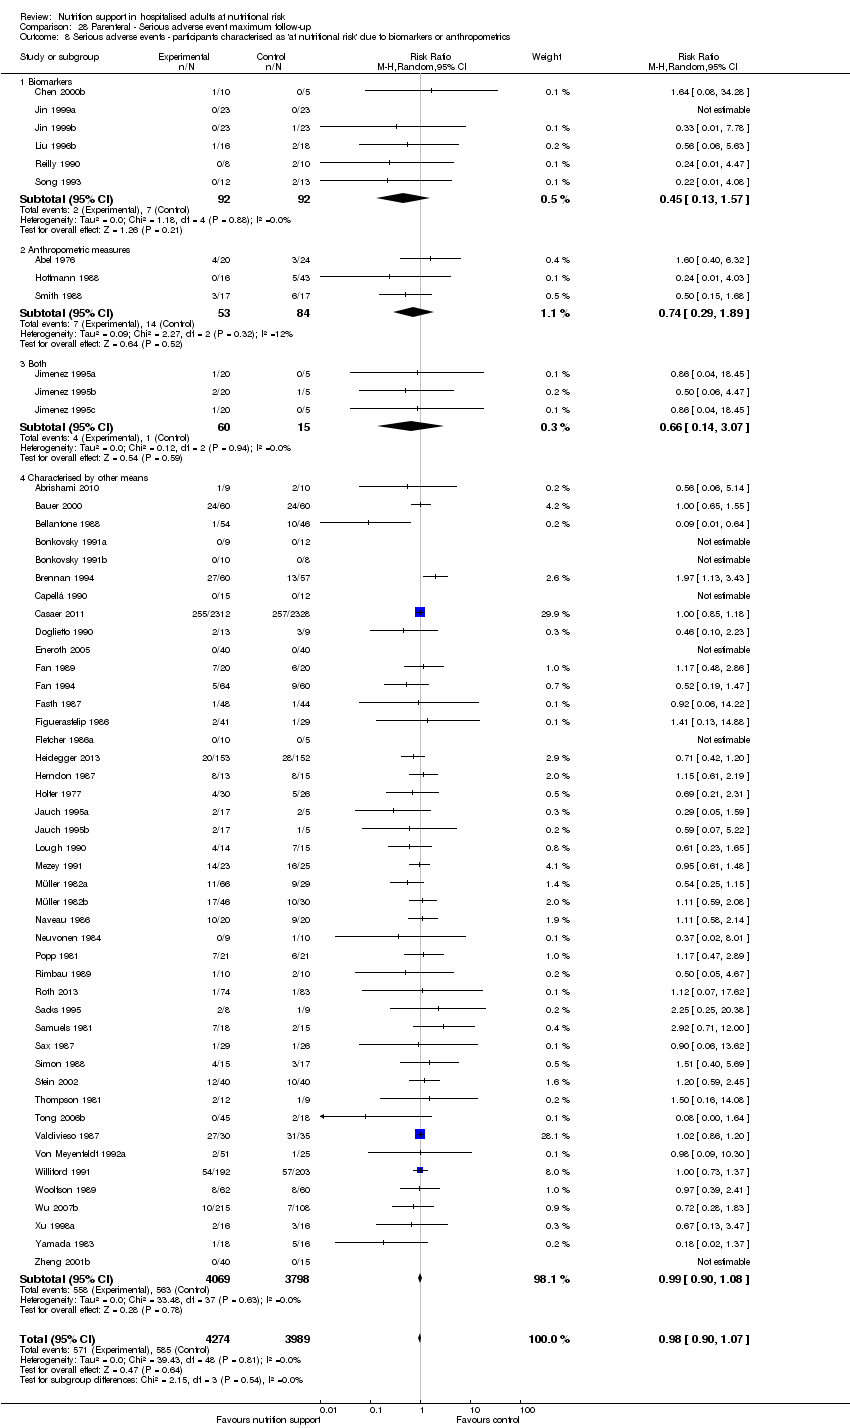
Comparison 28 Parenteral ‐ Serious adverse event maximum follow‐up, Outcome 8 Serious adverse events ‐ participants characterised as 'at nutritional risk' due to biomarkers or anthropometrics.
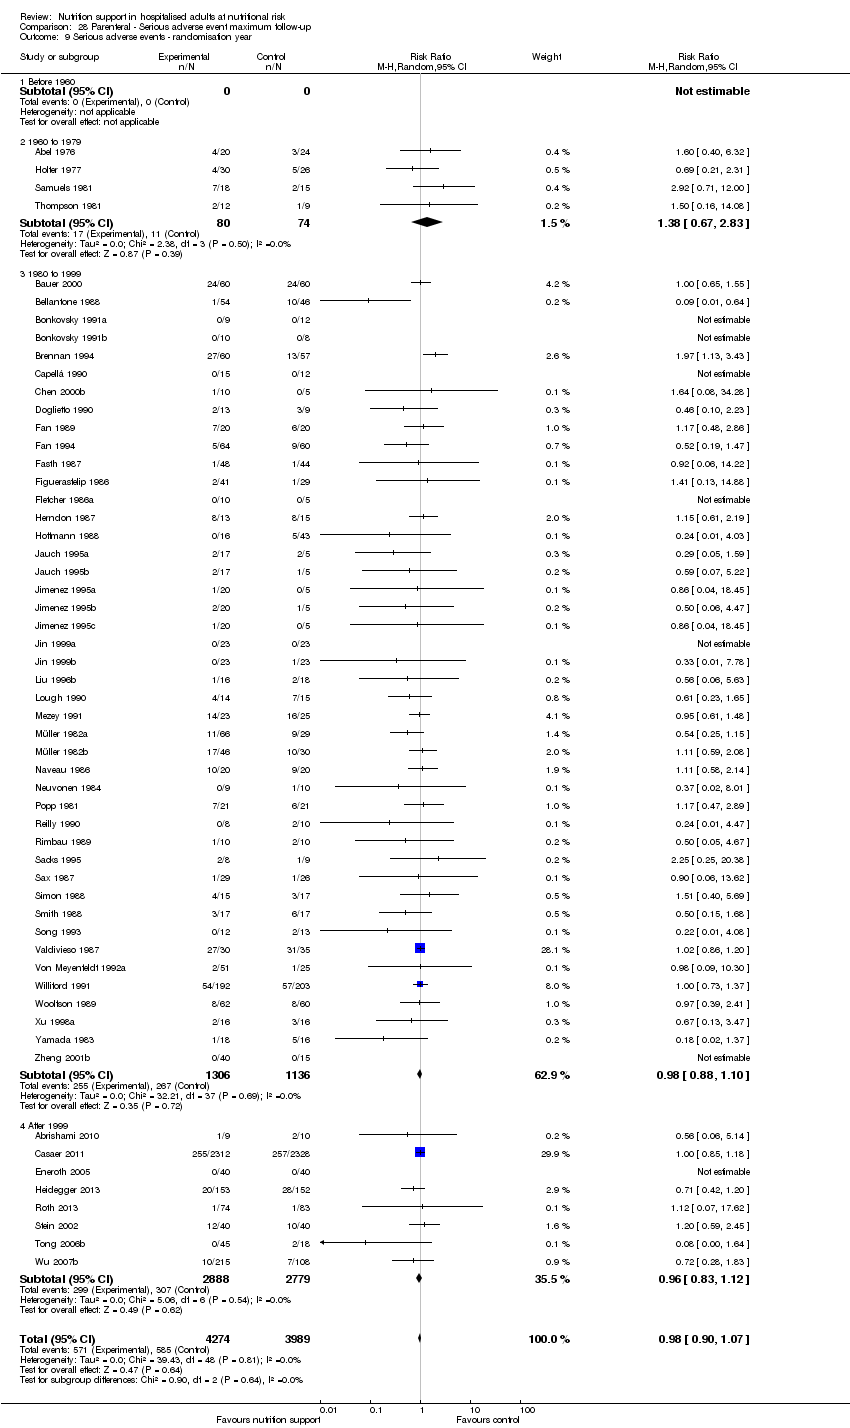
Comparison 28 Parenteral ‐ Serious adverse event maximum follow‐up, Outcome 9 Serious adverse events ‐ randomisation year.

Comparison 28 Parenteral ‐ Serious adverse event maximum follow‐up, Outcome 10 Serious adverse events ‐ trials where the intervention lasts fewer than three days compared with trials where the intervention lasts three days or more.

Comparison 28 Parenteral ‐ Serious adverse event maximum follow‐up, Outcome 11 Serious adverse events ‐ 'best‐worst case' scenario.

Comparison 28 Parenteral ‐ Serious adverse event maximum follow‐up, Outcome 12 Serious adverse events ‐ 'worst‐best case' scenario.
Comparison 28 Parenteral ‐ Serious adverse event maximum follow‐up, Outcome 13 Serious adverse events co‐interventions.

Comparison 29 Morbidity ‐ end of intervention, Outcome 1 Morbidity ‐ overall.

Comparison 30 Morbidity ‐ maximum follow‐up, Outcome 1 Morbidity ‐ overall.

Comparison 31 BMI ‐ end of intervention, Outcome 1 BMI ‐ overall.

Comparison 31 BMI ‐ end of intervention, Outcome 2 BMI ‐ bias.

Comparison 31 BMI ‐ end of intervention, Outcome 3 BMI ‐ mode of administration.

Comparison 31 BMI ‐ end of intervention, Outcome 4 BMI ‐ by medical delivery.
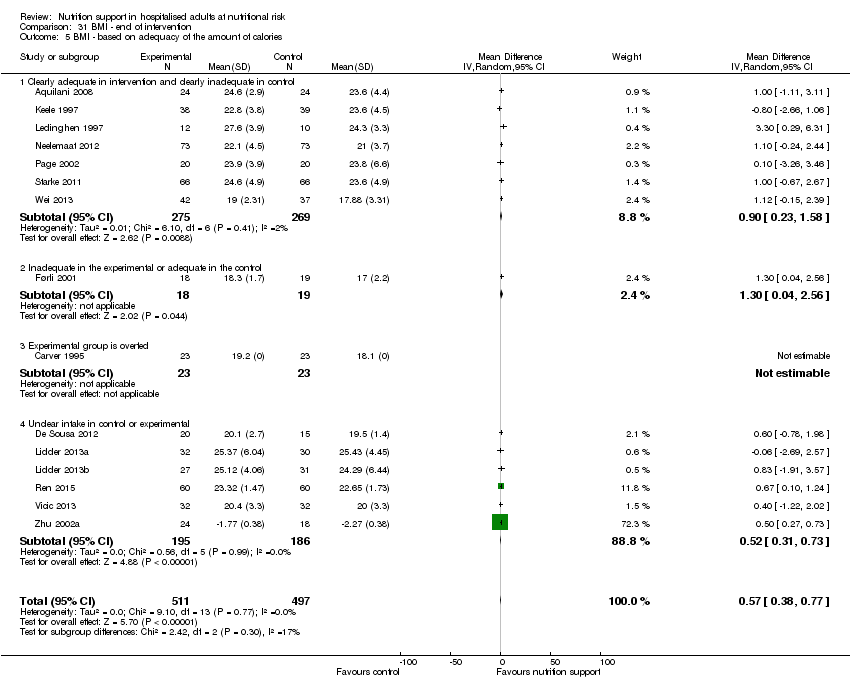
Comparison 31 BMI ‐ end of intervention, Outcome 5 BMI ‐ based on adequacy of the amount of calories.

Comparison 31 BMI ‐ end of intervention, Outcome 6 BMI ‐ different screening tools.
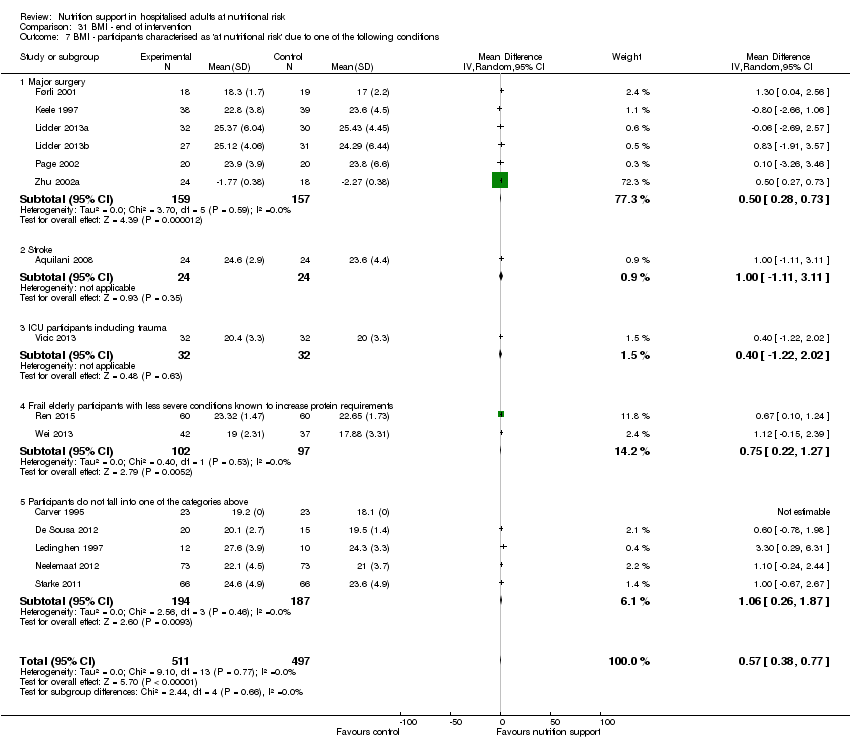
Comparison 31 BMI ‐ end of intervention, Outcome 7 BMI ‐ participants characterised as 'at nutritional risk' due to one of the following conditions.

Comparison 31 BMI ‐ end of intervention, Outcome 8 BMI ‐ participants characterised as 'at nutritional risk' due to one of the following criteria.

Comparison 31 BMI ‐ end of intervention, Outcome 9 BMI ‐ participants characterised as 'at nutritional risk' due to biomarkers of anthropometrics.

Comparison 31 BMI ‐ end of intervention, Outcome 10 BMI ‐ randomisation year.

Comparison 31 BMI ‐ end of intervention, Outcome 11 BMI ‐ trials where the intervention lasts fewer than three days compared with trials where the intervention lasts three days or more.

Comparison 32 BMI ‐ maximum follow‐up, Outcome 1 BMI ‐ overall.

Comparison 32 BMI ‐ maximum follow‐up, Outcome 2 BMI ‐ bias.

Comparison 32 BMI ‐ maximum follow‐up, Outcome 3 BMI ‐ mode of delivery.

Comparison 32 BMI ‐ maximum follow‐up, Outcome 4 BMI ‐ by medical speciality.

Comparison 32 BMI ‐ maximum follow‐up, Outcome 5 BMI ‐ based on adequacy of the amount of calories.

Comparison 32 BMI ‐ maximum follow‐up, Outcome 6 BMI ‐ different screening tools.

Comparison 32 BMI ‐ maximum follow‐up, Outcome 7 BMI ‐ participants characterised as 'at nutritional risk' due to one of the following conditions.

Comparison 32 BMI ‐ maximum follow‐up, Outcome 8 BMI ‐ participants characterised as 'at nutritional risk' due to one of the following criteria.
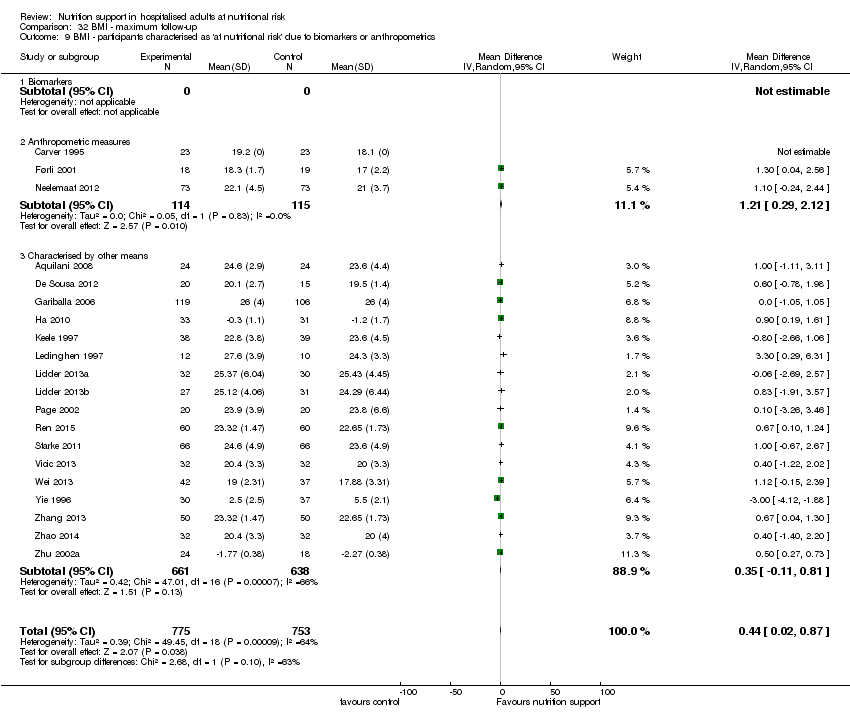
Comparison 32 BMI ‐ maximum follow‐up, Outcome 9 BMI ‐ participants characterised as 'at nutritional risk' due to biomarkers or anthropometrics.

Comparison 32 BMI ‐ maximum follow‐up, Outcome 10 BMI ‐ randomisation year.

Comparison 32 BMI ‐ maximum follow‐up, Outcome 11 BMI ‐ trials where the intervention lasts fewer than three days compared with trials where the intervention lasts three days or more.

Comparison 33 Weight ‐ end of intervention, Outcome 1 Weight ‐ overall.

Comparison 33 Weight ‐ end of intervention, Outcome 2 Weight ‐ bias.

Comparison 33 Weight ‐ end of intervention, Outcome 3 Weight ‐ mode of delivery.

Comparison 33 Weight ‐ end of intervention, Outcome 4 Weight ‐ by medical speciality.

Comparison 33 Weight ‐ end of intervention, Outcome 5 Weight ‐ based on adequacy of the amount of calories.

Comparison 33 Weight ‐ end of intervention, Outcome 6 Weight ‐ different screening tools.

Comparison 33 Weight ‐ end of intervention, Outcome 7 Weight ‐ participants characterised as 'at nutritional risk' due to one of the following conditions.
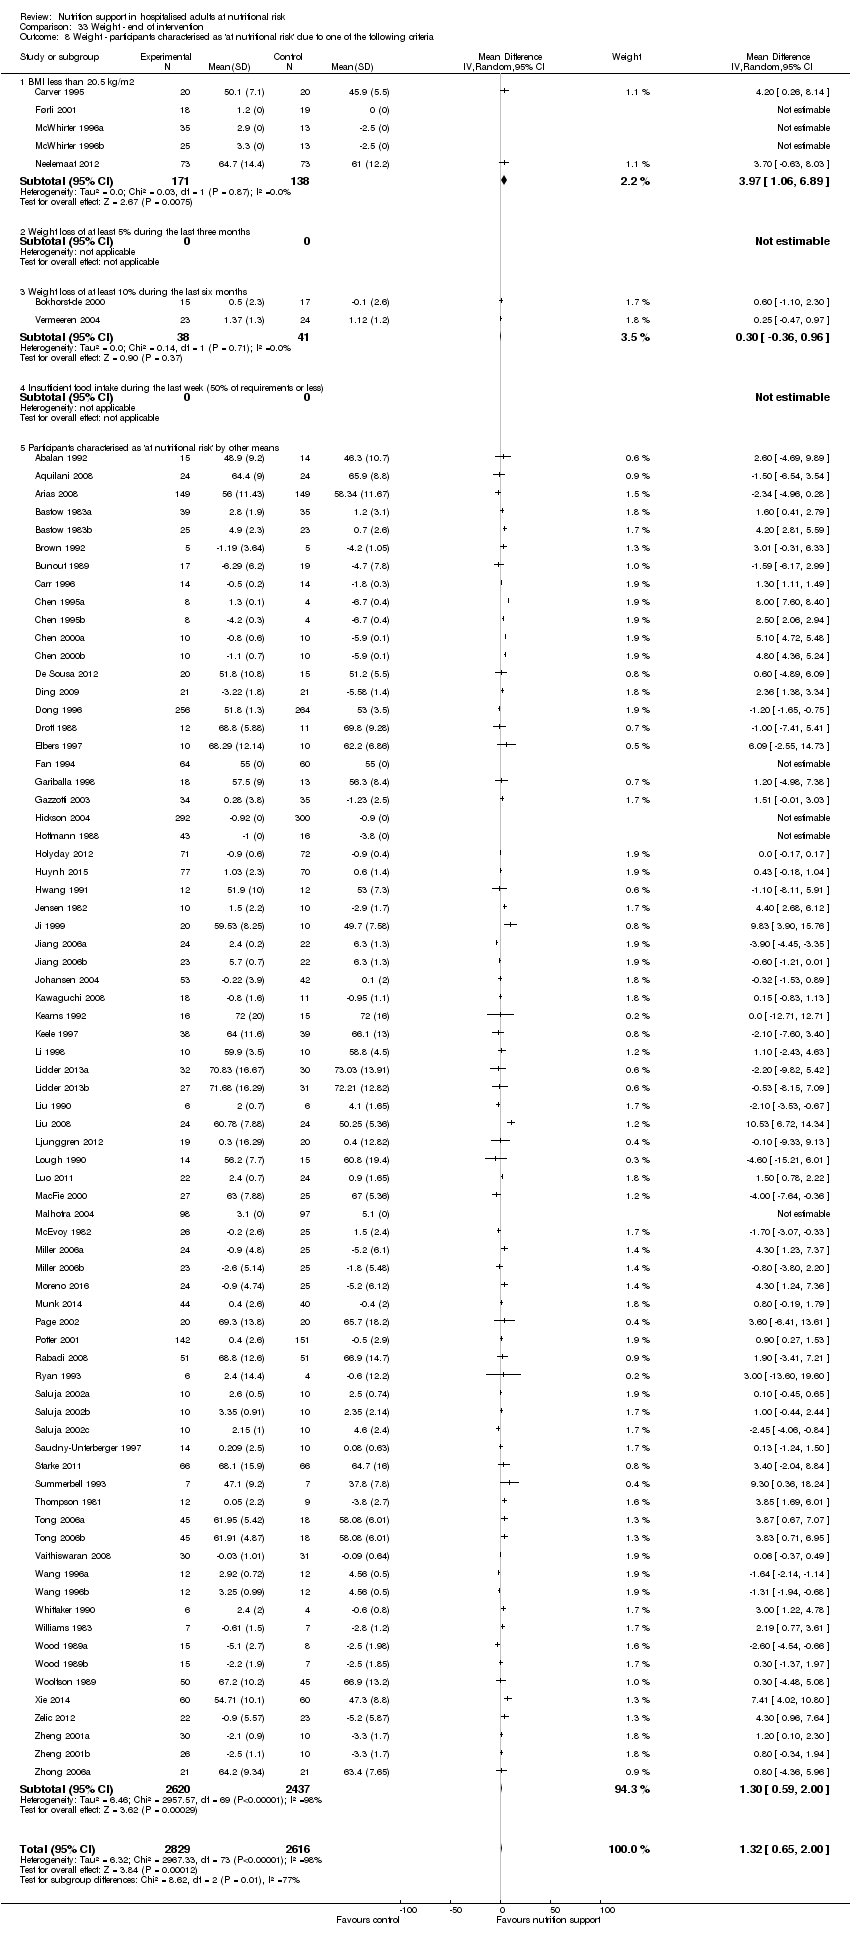
Comparison 33 Weight ‐ end of intervention, Outcome 8 Weight ‐ participants characterised as 'at nutritional risk' due to one of the following criteria.

Comparison 33 Weight ‐ end of intervention, Outcome 9 Weight ‐ participants characterised as 'at nutritional risk' due to biomarkers or anthropometrics.

Comparison 33 Weight ‐ end of intervention, Outcome 10 Weight ‐ randomisation year.
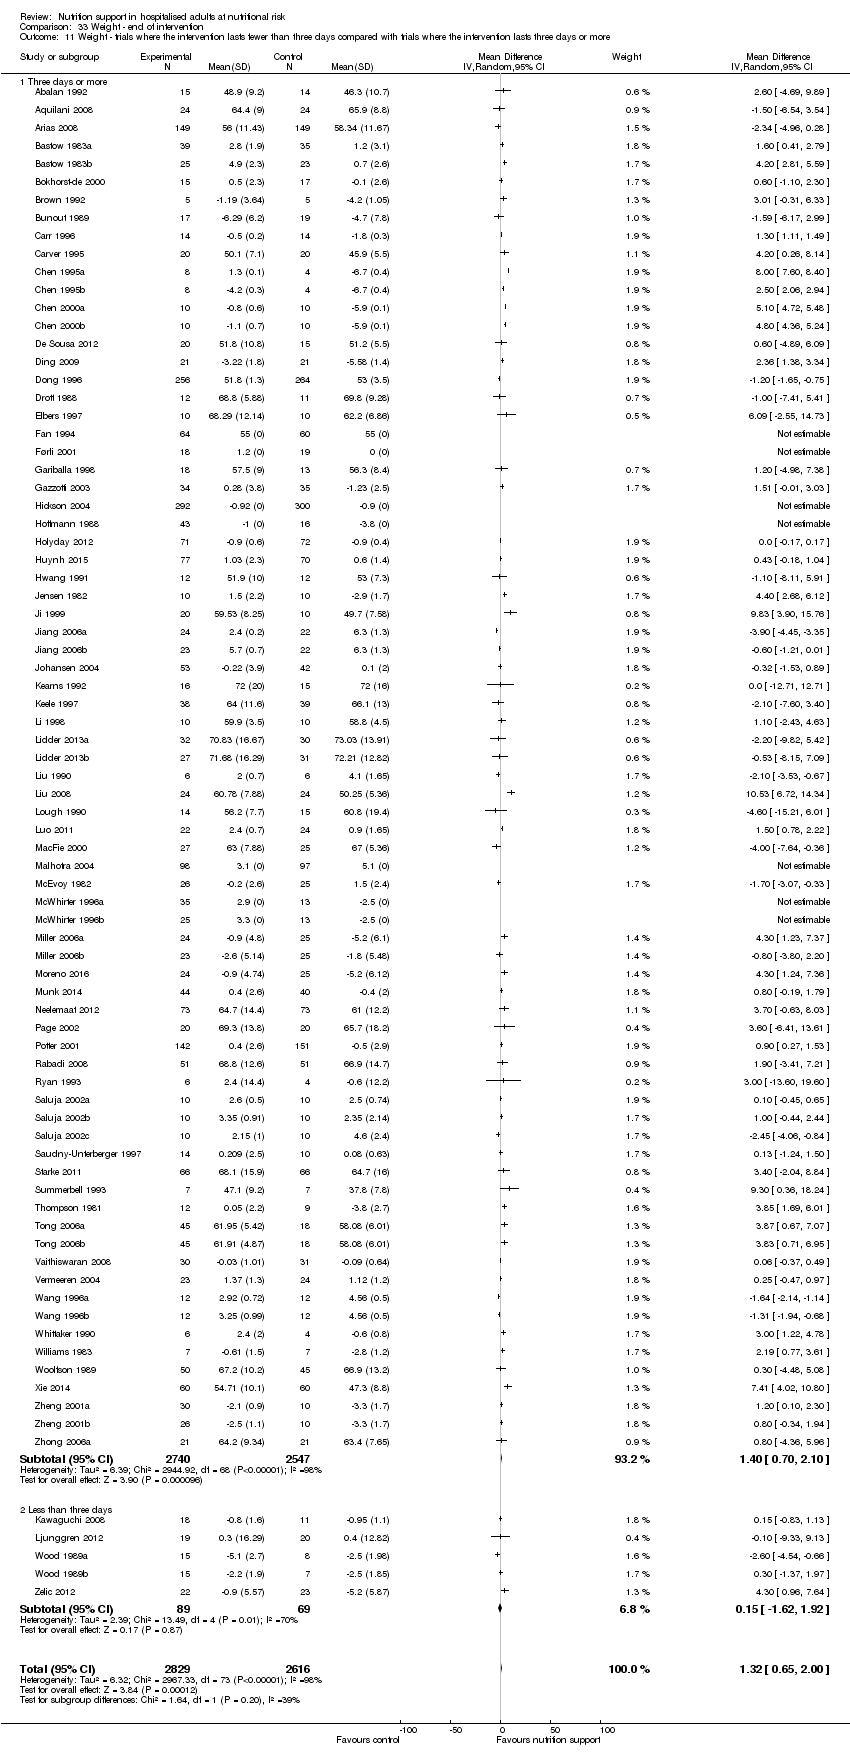
Comparison 33 Weight ‐ end of intervention, Outcome 11 Weight ‐ trials where the intervention lasts fewer than three days compared with trials where the intervention lasts three days or more.

Comparison 33 Weight ‐ end of intervention, Outcome 12 Weight ‐ Missing SDs.

Comparison 34 Weight ‐ maximum follow‐up, Outcome 1 Weight ‐ overall.

Comparison 34 Weight ‐ maximum follow‐up, Outcome 2 Weight ‐ bias.
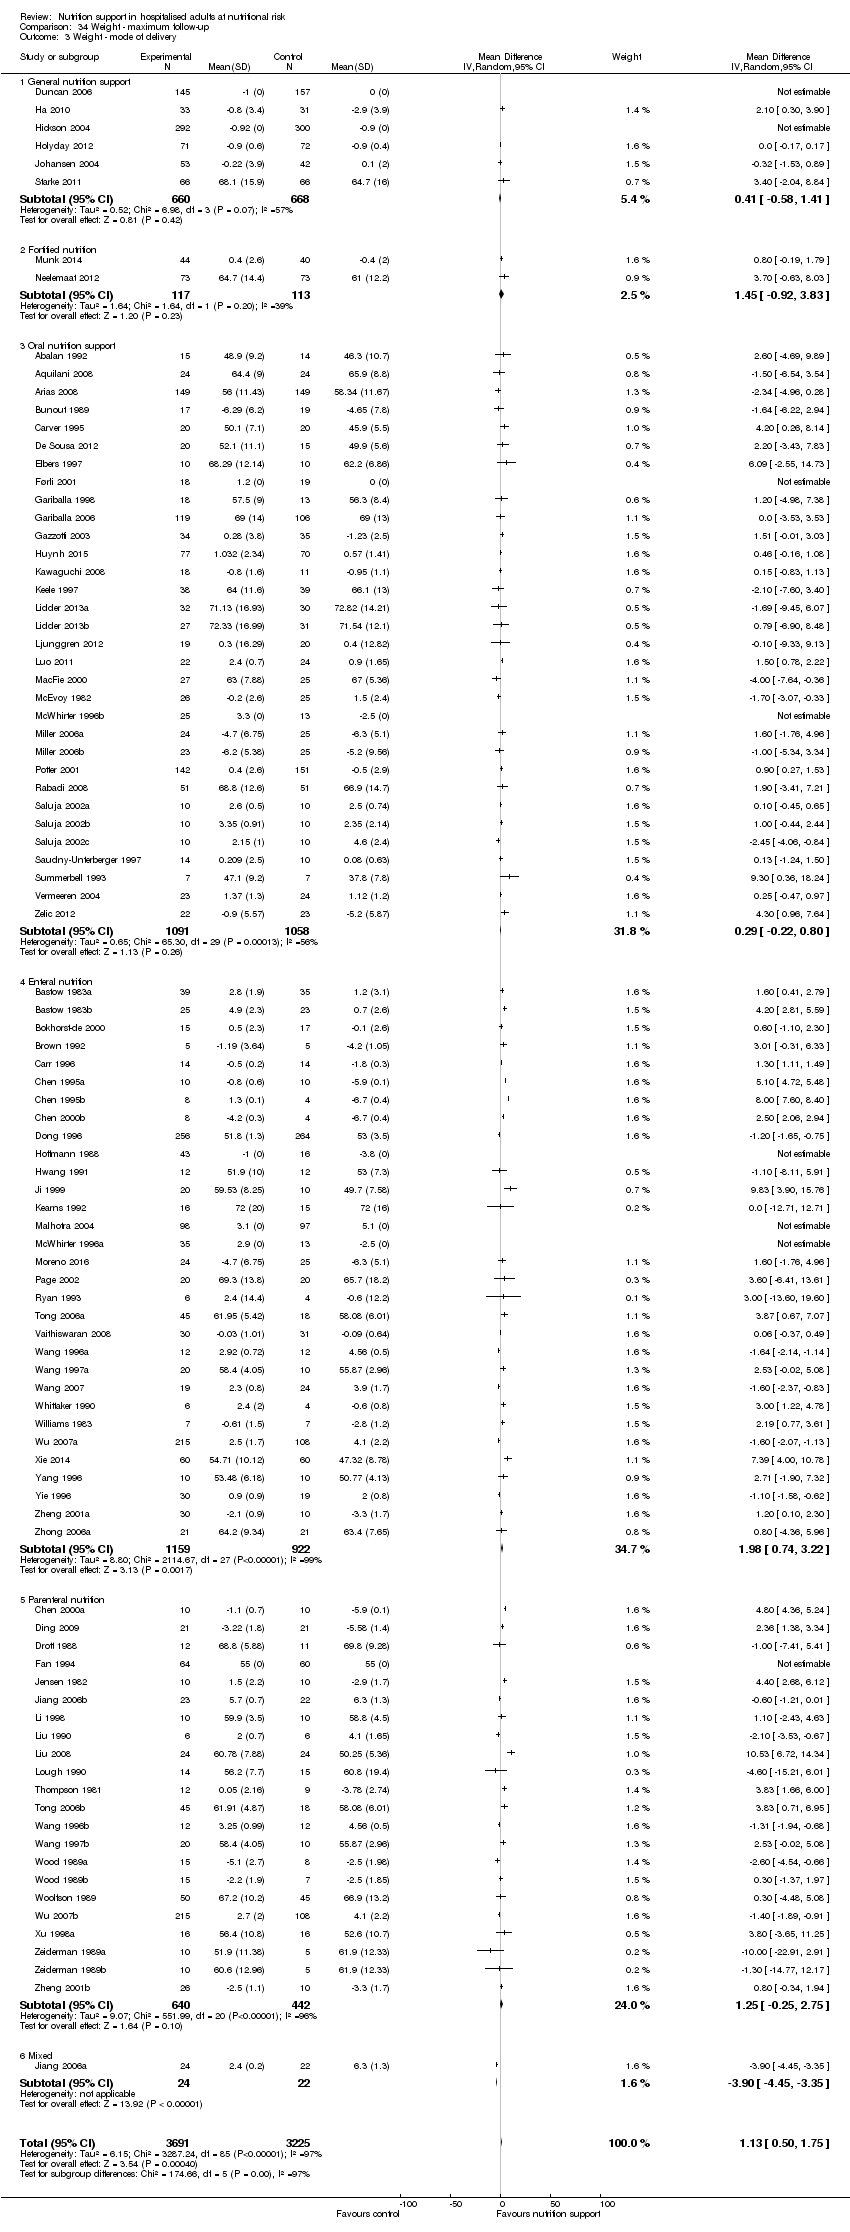
Comparison 34 Weight ‐ maximum follow‐up, Outcome 3 Weight ‐ mode of delivery.

Comparison 34 Weight ‐ maximum follow‐up, Outcome 4 Weight ‐ by medical speciality.

Comparison 34 Weight ‐ maximum follow‐up, Outcome 5 Weight ‐ based on adequacy of the amount of nutrition.

Comparison 34 Weight ‐ maximum follow‐up, Outcome 6 Weight ‐ different screening tools.

Comparison 34 Weight ‐ maximum follow‐up, Outcome 7 Weight ‐ participants characterised as 'at nutritional risk' due to one of the following conditions.

Comparison 34 Weight ‐ maximum follow‐up, Outcome 8 Weight ‐ participants characterised as 'at nutritional risk' due to one of the following criteria.

Comparison 34 Weight ‐ maximum follow‐up, Outcome 9 Weight ‐ participants characterised as 'at nutritional risk' due to biomarkers or anthropometrics.

Comparison 34 Weight ‐ maximum follow‐up, Outcome 10 Weight ‐ randomisation year.
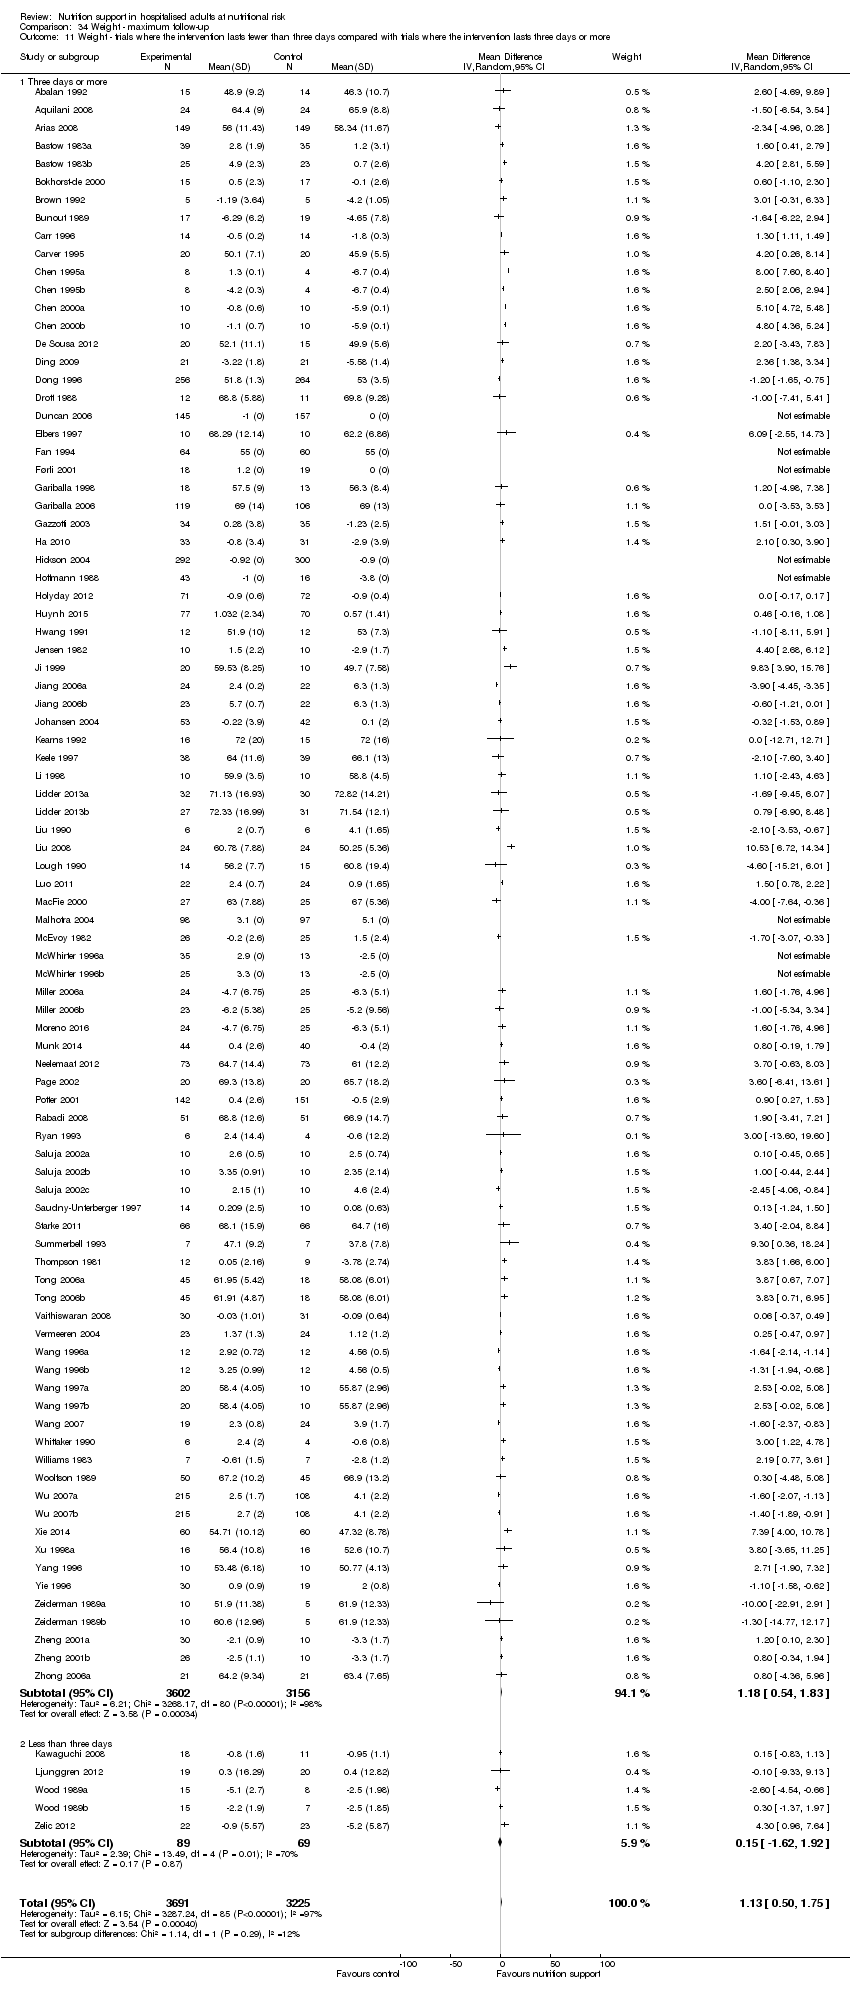
Comparison 34 Weight ‐ maximum follow‐up, Outcome 11 Weight ‐ trials where the intervention lasts fewer than three days compared with trials where the intervention lasts three days or more.

Comparison 35 Hand‐grip strength ‐ end of intervention, Outcome 1 Hand‐grip strength ‐ overall.

Comparison 36 Hand‐grip strength ‐ maximum follow‐up, Outcome 1 Hand‐grip strength ‐ overall.

Comparison 37 Six‐minute walking distance ‐ end of intervention, Outcome 1 Six‐minute walking distance ‐ overall.
| Nutrition support versus no intervention, placebo, or treatment as usual in hospitalised adults at nutritional risk | ||||||
| Patient or population: hospitalised adults at nutritional risk | ||||||
| Outcomes | Anticipated absolute effects* (95% CI) | Relative effect | № of participants | Quality of the evidence | Comments | |
| Risk with no intervention, placebo, or treatment‐as‐usual | Risk with nutrition support | |||||
| All‐cause mortality | ||||||
| ‐ at end of intervention | Study population | RR 0.94 | 21,758 | ⊕⊕⊝⊝ | Trial Sequential Analysis of all nutrition support trials shows that the futility area is reached. This leads us to conclude that the possible intervention effect, if any, is less than 11%. Multiple eligible treatments were used in 9 trials generating a further 13 comparisons (= 127 studies). | |
| 83 per 1.000 | 78 per 1.000 | |||||
| ‐ at maximum follow‐up | Study population | RR 0.93 | 23170 | ⊕⊕⊝⊝ | Trial Sequential Analysis of all nutrition support trials shows that the futility area is reached. This leads us to conclude that any possible intervention effect, if any, is less than 10%. Multiple eligible treatments were used in 10 trials generating a further 14 comparisons (= 141 studies). | |
| 132 per 1.000 | 122 per 1.000 | |||||
| Serious adverse events | ||||||
| ‐ at end of intervention | Study population | RR 0.93 | 22,087 | ⊕⊕⊝⊝ | Trial Sequential Analysis of all nutrition support trials shows that the futility area is reached. This leads us to conclude that any possible intervention effect, if any, is less than 11%. Multiple eligible treatments were used in 10 trials generating a further 14 comparisons (= 137 studies). | |
| 99 per 1.000 | 92 per 1.000 | |||||
| at maximum follow‐up | Study population | RR 0.91 | 23,413 | ⊕⊕⊝⊝ | Trial Sequential Analysis of all nutrition support trials shows that the futility area is reached. This leads us to conclude that any possible intervention effect, if any, is less than 10%. Multiple eligible treatments were used in 11 trials generating a further 15 comparisons (= 152 studies). | |
| 152 per 1.000 | 138 per 1.000 | |||||
| Health‐related quality of life | ||||||
| ‐at end of intervention | We found that nutrition support of any type for participants at nutritional risk (defined by our inclusion criteria, including as defined by the trial investigators) did not show any benefit or harm with regard to quality of life at end of intervention or at maximum follow‐up. Few trials used similar quality‐of‐life questionnaires, and only data from EuroQoL utility score and SF‐36 could be used in a meta‐analysis. Whichever score was used, we found no beneficial or harmful effects. While most trials found no beneficial or harmful effect of nutrition support, only a few trials found a beneficial effect on specific parameters. All included trials assessing health‐related quality of life were at high risk of bias. | ‐ | (16 RCTs) | ‐ | ||
| at maximum follow‐up ((EuroQol) ) | Control group mean quality of life scores were 0.486 and 0.175. | Quality of life was on average 0.01 units lower | ‐ | 3961 | ⊕⊝⊝⊝ | |
| Weight at the end of intervention | Control group weight ranged from 45.9 to 73.03 kg | MD 1.32 kg higher | ‐ | 5445 | ⊕⊝⊝⊝ | |
| *The risk in the intervention group (and its 95% confidence interval) is based on the assumed risk in the comparison group and the relative effect of the intervention (and its 95% CI). | ||||||
| GRADE Working Group grades of evidence | ||||||
| 1Downgraded by 2 levels because of a very serious risk of bias. | ||||||
| Medical speciality | Experimental group | Control group |
| Emergency medicine | 3 trials used enteral nutrition 8 trials used parenteral nutrition | 7 trials used no intervention 4 trials used treatment as usual |
| Endocrinology | 1 trial used parenteral nutrition | 1 trial used no intervention |
| Gastroenterological surgery | 36 trials used enteral nutrition 13 trials used oral nutrition 40 trials used parenteral nutrition 3 trials used mixed nutrition | 32 trials used no intervention 4 trials used placebo 56 trials used treatment as usual |
| General surgery | 2 trials used parenteral nutrition | 1 trial used no intervention 1 trial used treatment as usual |
| Geriatrics | 1 trial used fortified foods 2 trials used general nutrition support 13 trials used oral nutrition | 9 trials used no intervention 2 trials used placebo 5 trials used treatment as usual |
| Gynaecology | 1 trial used parenteral nutrition | 1 trial used treatment as usual |
| Haematology | 1 trial used parenteral nutrition | 1 trial used placebo |
| Infectious diseases | 2 trials used enteral nutrition | 2 trials used treatment as usual |
| Medical gastroenterology and hepatology | 9 trials used enteral nutrition 3 trials used oral nutrition 5 trials used parenteral nutrition 1 trial used mixed nutrition | 9 trials used no intervention 9 trials used treatment as usual |
| Mixed medical speciality | 2 trials used enteral nutrition 1 trial used fortified foods 1 trial used general nutrition 4 trials used oral nutrition 1 trial used mixed nutrition | 5 trials used no intervention 1 trial used placebo 3 trials used treatment as usual |
| Neprohology | 1 trial used general nutrition | 1 trial used treatment as usual |
| Neurological surgery | 1 trial used parenteral nutrition | 1 trial used treatment as usual |
| Neurology | 3 trials used enteral nutrition 1 trial used general nutrition 5 trials used oral nutrition 1 trial used mixed nutrition | 4 trials used no intervention 6 trials used treatment as usual |
| Oncology | 3 trials used enteral nutrition 1 trial used general nutrition 11 trials used parenteral nutrition 1 trial used mixed nutrition | 9 trials used no intervention 7 trials used treatment as usual |
| Oro‐maxillo‐facial surgery | 1 trial used enteral nutrition 1 trial used oral nutrition | 2 trials used no intervention |
| Orthopaedics | 5 trials used enteral nutrition 4 trials used oral nutrition 1 trial used general nutrition 1 trial used parenteral nutrition 3 trials used mixed nutrition | 7 trials used no intervention 2 trials used placebo 5 trials used treatment as usual |
| Pulmonary diseases | 2 trials used enteral nutrition 3 trials used oral nutrition 3 trials used parenteral nutrition | 1 trial used no intervention 3 trials used placebo 4 trials used treatment as usual |
| Thoracic surgery | 2 enteral nutrition 1 parenteral nutrition 1 mixed nutrition | 1 trial used placebo 3 trials used treatment as usual |
| Trauma surgery | 8 trials used enteral nutrition 3 trials used parenteral nutrition | 6 trial used no intervention 5 trial used treatment as usual |
| Transplant surgery | 1 trial used enteral nutrition 1 trial used oral nutrition 2 trials used parenteral nutrition | 4 trials used treatment as usual |
| Vascular surgery | 1 trial used enteral nutrition 3 trials used parenteral nutrition | 4 trials used treatment as usual |
| Trial | Experimental intervention | Type and number of participants with a serious adverse events (Experimental group) | Proportion of participants with a serious adverse event (Experimental group) | Type and number of participants with a serious adverse events (Control group) | Proportion of participants with a serious adverse event (Control group) |
| Parenteral nutrition | 1 sepsis | 1 out of 54 | 10 sepsis | 10 out of 46 | |
| Parenteral nutrition | 1 anastomotic leak, 3 respiratory infections, 2 respiratory insufficiency | 6 out of 43 | 2 anastomotic leaks, 1 renal failure, 2 abdominal abscesses, 4 respiratory infections, 3 respiratory insufficieny | 12 out of 47 | |
| Parenteral nutrition | 7 anastomotic leaks, 5 pneumonias, 1 GI haemorrhages, 8 GI fistula, 4 ileus, 2 myocardial infarction, 12 abscess, 4 deep infection, 7 peritonitis | 50 out of 60 | 3 anastomotic leaks, 6 pneumonias, 1 pulmonary embolism, 2 GI haemorrhages, 5 GI fistula, 1 myocardial infarction, 2 abscess, 4 deep infection, 2 peritonitis | 26 out of 57 | |
| Enteral nutrition | no serious adverse events reported | 0 out of 16 | 1 anastomotic leak | 1 out of 8 | |
| Enteral nutrition | 1 anastomotic leak | 1 out of 10 | no serious adverse events reported | 0 out of 10 | |
| Enteral nutrition | no serious adverse events reported | 0 out of 21 | 1 septic complication | 1 out of 20 | |
| Oral nutrition | 50 strokes, 23 pulmonary embolisms, 43 DVTs, 28 GI haemorrhages, 28 ACS' | 172 out of 2012 | 43 strokes, 18 pulmonary embolism, 29 DVTs, 18 GI haemorrhage, 22 ACS | 130 out of 2000 | |
| Enteral nutrition | 15 strokes, 6 pulmonary embolisms, 11 DVTs, 22 GI haemorrhages, 7 ACS' | 61 out of 429 | 23 strokes, 8 pulmonary embolisms, 13 DVTs, 11 GI haemorrhages, 13 ACS' | 68 out of 428 | |
| Parenteral nutrition | 3 sepsis | 3 out of 9 | 7 sepsis | 7 out of 12 | |
| Oral nutrition | 20 anastomotic leaks, 14 pneumonias, 2 pulmonary embolisms, 2 renal failure, 6 abdominal abscess, 3 unspecific infection, 10 wound dehiscences, 1 pulmonary failure, 11 gastrointestinal complications, 6 cardiovascular complications, 4 haemoperitoneum | 79 out of 338 | 18 anastomotic leaks, 9 pneumonias, 1 pulmonary embolisms, 3 renal failure, 1 abdominal abscess, 2 unspecific infection, 3 wound dehiscences, 2 pulmonary failure, 6 bacteraemia, 23 gastrointestinal complications, 6 cardiovascular complications, 5 haemoperitoneum | 79 out of 340 | |
| Parenteral nutrition | 1 respiratory infection | 1 out of 21 | 2 respiratory infection | 2 out of 21 | |
| Enteral nutrition | no serious adverse events reported | 0 out of 256 | 6 anastomotic leaks | 6 out of 264 | |
| Parenteral nutrition | 4 GI haemorrhages, 4 GI fistulas, 4 hepatic comas | 12 out of 64 | 1 GI haemorrhages, 5 GI fistulas, 4 hepatic comas | 10 out of 60 | |
| Enteral nutrition | 25 pressure sores | 25 out of 48 | 30 pressure sores | 30 out of 53 | |
| Enteral nutrition | no serious adverse events reported | 0 out of 43 | 3 anastomotic leaks, 2 myocardial infarction | 5 out of 16 | |
| Enteral nutrition | 2 abdominal abscess | 2 out of 20 | no serious adverse events reported | 0 out of 10 | |
| General nutrition | 4 pneumonia, 1 DVTs, 4 sepsis, 2 empyemas, 0 gastroenteritis, 1 GI complications, | 12 out of 108 | 4 pneumonia, 1 stroke, 2 sepsis, 1 gastroenteritis, 2 GI complications | 10 out of 104 | |
| Enteral nutrition | 2 renal failures | 2 out of 16 | 2 renal failures | 2 out of 15 | |
| Oral nutrition | no serious adverse events reported | 0 out of 43 | 1 GI perforation | 1 out of 43 | |
| Oral nutrition | 20 pressure sores | 20 out of 197 | 29 pressure sores | 29 out of 328 | |
| Enteral nutrition | 4 variceal bleedings, 1 peritonitis | 5 out of 12 | 1 peritonitis | 1 out of 10 | |
| Parenteral nutrition | no serious adverse events reported | 0 out of 14 | 1 anastomotic leak, 1 GI fistula | 2 out of 15 | |
| Enteral nutrition | 21 Pneumonia, Wound infection 27, Wound dehiscence 4, anastomotic Leak 7, Septicaemia 20 | 27 out of 98 | Pneumonia 30, Wound infection 31, Wound dehiscence 9, Leak 13, Septicaemia 30. | 31 out of 97 | |
| Enteral nutrition | 8 sepsis | 8 out of 27 | 7 sepsis | 7 out of 29 | |
| Parenteral nutrition | no serious adverse events reported | 0 out of 9 | 1 sepsis | 1 out of 12 | |
| Enteral nutrition | no serious adverse events reported | 0 out of 20 | 1 pulmonary embolism | 1 out of 20 | |
| Enteral nutrition | 2 peritonitis | 2 out of 11 | 5 peritonitis | 5 out of 18 | |
| Enteral nutrition | no serious adverse events reported | 0 out of 30 | 4 GI fistulas | 4 out of 30 | |
| Oral nutrition | no serious adverse events reported | 0 out of 80 | 1 anastomotic leak | 1 out of 81 | |
| Parenteral nutrition | 1 pneumonia | 1 out of 10 | 2 pneumonias | 2 out of 10 | |
| Parenteral nutrition | 2 pneumoperitoneum's | 2 out of 40 | 2 anastomotic leaks, 2 pneumoperitoneum's | 4 out of 40 | |
| Parenteral nutrition | 2 pneumonias, 5 sepsis | 7 out of 16 | 2 sepsis | 2 out of 14 | |
| Enteral nutrition | 1 myocardial infarction | 1 out of 16 | 1 myocardial infarction | 1 out of 16 | |
| Parenteral nutrition | no serious adverse events reported | 0 out of 15 | 2 hepatic encephalopathies | 2 out of 17 | |
| Parenteral nutrition | no serious adverse events reported | 0 out of 17 | 2 respiratory infection | 2 out of 17 | |
| General nutrition | no serious adverse events reported | 0 out of 66 | 1 stroke, 1 DVT, 1 septic arthritis, 2 myocardial infarction | 5 out of 66 | |
| Parenteral nutrition | 1 empyema, 1 pelvic abscess | 2 out of 12 | 1 intraabdominal abscess | 1 out of 9 | |
| Mixed nutrition | 1 hepatic encephalopathy | 1 out of 90 | 4 anastomotic leak, 5 hepatic encephalopathies | 9 out of 36 | |
| Enteral nutrition | 2 sepsis, 2 multi organ failure, | 4 out of 52 | 6 sepsis, 3 multi organ failure | 9 out of 49 | |
| Enteral nutrition | 1 anastomotic leak | 1 out of 13 | 3 anastomotic leaks | 3 out of 15 | |
| Mixed nutrition | 11 anastomotic leaks, 6 DVT, 15 sepsis | 32 out of 430 | 10 anastomotic leaks, 15 sepsis | 25 out of 216 | |
| Parenteral nutrition | 1 wound dehiscence | 1 out of 18 | 1 anastomotic leak, 2 pneumonias, 1 sepsis, 1 ileus | 5 out of 16 | |
| Enteral nutrition | 2 GI haemorrhage | 2 out of 50 | 4 GI haemorrhage | 4 out of 50 |
| Trial | Experimental intervention | Type and number of participants with a serious adverse events (Experimental group) | Proportion of participants with a serious adverse event (Experimental group) | Type and number of participants with a serious adverse events (Control group) | Proportion of participants with a serious adverse event (Control group) |
| Enteral nutrition | 2 anastomotic leaks | 2 out of 64 | 7 anastomotic leaks, 2 GI haemorrhage, 1 myocardial infarction | 10 out of 57 | |
| Enteral nutrition | 2 anastomotic leak, 3 wound dehiscence, 1 myocardial infarction, | 6 out of 30 | 4 anastomotic leak, 1 pulmonary failure | 5 out of 30 | |
| Parenteral nutrition | 1 sepsis | 1 out of 54 | 10 sepsis | 10 out of 46 | |
| Parenteral nutrition | 1 anastomotic leak, 3 respiratory infections, 2 respiratory insufficiencies | 6 out of 43 | 2 anastomotic leaks, 1 renal failure, 2 abdominal abscesses, 4 respiratory infections, 3 respiratory insufficiencies | 12 out of 47 | |
| Parenteral nutrition | 7 anastomotic leaks, 5 pneumonias, 1 GI haemorrhages, 8 GI fistula, 4 ileus, 2 myocardial infarction, 12 abscess, 4 deep infection, 7 peritonitis | 50 out of 60 | 3 anastomotic leaks, 6 pneumonias, 1 pulmonary embolism, 2 GI haemorrhages, 5 GI fistula, 1 myocardial infarction, 2 abscess, 4 deep infection, 2 peritonitis | 26 out of 57 | |
| Enteral nutrition | no serious adverse events reported | 0 out of 16 | 1 anastomotic leak | 1 out of 8 | |
| Enteral nutrition | 1 anastomotic leak | 1 out of 10 | no serious adverse events reported | 0 out of 10 | |
| Enteral nutrition | no serious adverse events reported | 0 out of 21 | 1 septic complication | 1 out of 20 | |
| Enteral nutrition | 2 CNS infections, 13 ventilator associated pneumonias | 15 out of 34 | 2 CNS infections, 12 ventilator associated pneumonias | 14 out of 25 | |
| Oral nutrition | 50 strokes, 23 pulmonary embolisms, 43 DVTs, 28 GI haemorrhages, 28 ACS' | 172 out of 2012 | 43 strokes, 18 pulmonary embolism, 29 DVTs, 18 GI haemorrhage, 22 ACS' | 130 out of 2000 | |
| Enteral nutrition | 15 strokes, 6 pulmonary embolisms, 11 DVTs, 22 GI haemorrhages, 7 ACS' | 61 out of 429 | 23 strokes, 8 pulmonary embolisms, 13 DVTs, 11 GI haemorrhages, 13 ACS' | 68 out of 428 | |
| Parenteral nutrition | 1 respiratory infection | 1 out of 21 | 2 respiratory infection | 2 out of 21 | |
| Parenteral nutrition | 3 sepsis | 3 out of 9 | 7 sepsis | 7 out of 12 | |
| Oral nutrition | 20 anastomotic leaks, 14 pneumonias, 2 pulmonary embolisms, 2 renal failure, 6 abdominal abscess, 3 unspecific infection, 10 wound dehiscences, 1 pulmonary failure, 11 gastrointestinal complications, 6 cardiovascular complications, 4 haemoperitoneum | 79 out of 338 | 18 anastomotic leaks, 9 pneumonias, 1 pulmonary embolisms, 3 renal failure, 1 abdominal abscess, 2 unspecific infection, 3 wound dehiscences, 2 pulmonary failure, 6 bacteraemia, 23 gastrointestinal complications, 6 cardiovascular complications, 5 haemoperitoneum | 79 out of 340 | |
| Enteral nutrition | no serious adverse events reported | 0 out of 256 | 6 anastomotic leaks | 6 out of 264 | |
| Parenteral nutrition | 4 GI haemorrhages, 4 GI fistulas, 4 hepatic comas | 12 out of 64 | 1 GI haemorrhages, 5 GI fistulas, 4 hepatic comas | 10 out of 60 | |
| Enteral nutrition | 25 pressure sores | 25 out of 48 | 30 pressure sores | 30 out of 53 | |
| Oral nutrition | 1 anastomotic leak, 2 wound infections, 1 pulmonary embolism | 4 out of 16 | 1 anastomotic leak, | 1 out of 8 | |
| Enteral nutrition | no serious adverse events reported | 0 out of 43 | 3 anastomotic leaks, 2 myocardial infarction | 5 out of 16 | |
| Enteral nutrition | 2 abdominal abscess | 2 out of 20 | no serious adverse events reported | 0 out of 10 | |
| General nutrition | 4 pneumonia, 1 DVTs, 4 sepsis, 2 empyemas, 0 gastroenteritis, 1 GI complications, | 12 out of 108 | 4 pneumonia, 1 stroke, 2 sepsis, 1 gastroenteritis, 2 GI complications | 10 out of 104 | |
| Enteral nutrition | 3 septic complications, 3 wound dehiscence | 6 out of 50 | 8 septic complications, 4 wound dehiscence | 12 out of 50 | |
| Enteral nutrition | 2 renal failures | 2 out of 16 | 2 renal failures | 2 out of 15 | |
| Oral nutrition | no serious adverse events reported | 0 out of 43 | 1 GI perforation | 1 out of 43 | |
| Oral nutrition | 20 pressure sores | 20 out of 197 | 29 pressure sores | 29 out of 328 | |
| Enteral nutrition | 4 variceal bleedings, 1 peritonitis | 5 out of 12 | 1 peritonitis | 1 out of 10 | |
| Oral nutrition | 2 anastomotic leaks, 2 sepsis | 4 out of 59 | 7 anastomotic leaks, 1 stroke, 1 DVT, 3 sepsis, 3 myocardial infarctions | 15 out of 61 | |
| Parenteral nutrition | no serious adverse events reported | 0 out of 14 | 1 anastomotic leak, 1 GI fistula | 2 out of 15 | |
| Enteral nutrition | 8 sepsis | 8 out of 27 | 7 sepsis | 7 out of 29 | |
| Parenteral nutrition | no serious adverse events reported | 0 out of 9 | 1 sepsis | 1 out of 12 | |
| Enteral nutrition | no serious adverse events reported | 0 out of 20 | 1 pulmonary embolism | 1 out of 20 | |
| Enteral nutrition | 2 peritonitis | 2 out of 11 | 5 peritonitis | 5 out of 18 | |
| Enteral nutrition | no serious adverse events reported | 0 out of 30 | 4 GI fistulas | 4 out of 30 | |
| Oral nutrition | no serious adverse events reported | 0 out of 80 | 1 anastomotic leak | 1 out of 81 | |
| Parenteral nutrition | 1 pneumonia | 1 out of 10 | 2 pneumonias | 2 out of 10 | |
| Parenteral nutrition | 2 pneumoperitoneums | 2 out of 40 | 2 anastomotic leaks, 2 pneumoperitoneums | 4 out of 40 | |
| Parenteral nutrition | 2 pneumonias, 5 sepsis | 7 out of 16 | 2 sepsis | 2 out of 14 | |
| Enteral nutrition | 1 myocardial infarction | 1 out of 16 | 1 myocardial infarction | 1 out of 16 | |
| Parenteral nutrition | no serious adverse events reported | 0 out of 15 | 2 hepatic encephalopathies | 2 out of 17 | |
| Parenteral nutrition | 1 anastomotic leak, 1 respiratory infection, 1 pancreatitis | 3 out of 17 | 2 pulmonary embolisms, 1 septic complication, 4 respiratory infections, | 7 out of 17 | |
| Enteral nutrition | 2 wound infections, 1 pneumonia | 3 out of 9 | 1 anastomotic leak, 2 wound infections, 1 pneumonia, 1 peptic ulcer, 1 wound dehiscence, | 6 out of 9 | |
| General nutrition | no serious adverse events reported | 0 out of 66 | 1 stroke, 1 DVT, 1 septic arthritis, 2 myocardial infarction | 5 out of 66 | |
| Parenteral nutrition | 1 empyema, 1 pelvic abscess | 2 out of 12 | 1 intraabdominal abscess | 1 out of 9 | |
| Mixed nutrition | 1 hepatic encephalopathy | 1 out of 90 | 4 anastomotic leak, 5 hepatic encephalopathies | 9 out of 36 | |
| Enteral nutrition | 2 sepsis, 2 multi organ failure, | 4 out of 52 | 6 sepsis, 3 multi organ failure | 9 out of 49 | |
| Enteral nutrition | 1 anastomotic leak | 1 out of 13 | 3 anastomotic leaks | 3 out of 15 | |
| Parenteral nutrition | 6 anastomotic leaks, 16 pneumonias, 1 pressure sore, 2 abdominal abscess, 1 wound dehiscence, 13 pulmonary failure, 7 bacteraemia, 10 GI complications, 15 cardiac complications, 3 bronchopleurocutaneous fistulas | 74 out of 231 | 6 anastomotic leaks, 9 pneumonias, 1 pulmonary embolism, 1 pressure sore, 3 renal failure, 2 abdominal abscess, 1 septic complication, 1 wound dehiscence, 11 pulmonary failure, 5 bacteraemia, 10 GI complications, 15 cardiac complications, 6 bronchopleurocutaneous fistulas | 80 out of 228 | |
| Mixed nutrition | 11 anastomotic leaks, 6 DVT, 15 sepsis | 32 out of 430 | 10 anastomotic leaks, 15 sepsis | 25 out of 216 | |
| Parenteral nutrition | 1 wound dehiscence | 1 out of 18 | 1 anastomotic leak, 2 pneumonias, 1 sepsis, 1 ileus | 5 out of 16 | |
| Enteral nutrition | 2 GI haemorrhage | 2 out of 50 | 4 GI haemorrhage | 4 out of 50 |
| Outcome or subgroup title | No. of studies | No. of participants | Statistical method | Effect size |
| 1 All‐cause mortality ‐ overall Show forest plot | 127 | 21758 | Risk Ratio (M‐H, Random, 95% CI) | 0.94 [0.86, 1.03] |
| 2 All‐cause mortality ‐ bias Show forest plot | 127 | 21758 | Risk Ratio (M‐H, Random, 95% CI) | 0.94 [0.86, 1.03] |
| 2.1 High risk of bias | 127 | 21758 | Risk Ratio (M‐H, Random, 95% CI) | 0.94 [0.86, 1.03] |
| 2.2 Low risk of bias | 0 | 0 | Risk Ratio (M‐H, Random, 95% CI) | 0.0 [0.0, 0.0] |
| 3 All‐cause mortality ‐ mode of delivery Show forest plot | 127 | 21758 | Risk Ratio (M‐H, Random, 95% CI) | 0.94 [0.86, 1.03] |
| 3.1 General nutrition support | 6 | 1420 | Risk Ratio (M‐H, Random, 95% CI) | 1.18 [0.74, 1.87] |
| 3.2 Fortified foods | 2 | 290 | Risk Ratio (M‐H, Random, 95% CI) | 1.24 [0.61, 2.54] |
| 3.3 Oral nutrition | 33 | 8529 | Risk Ratio (M‐H, Random, 95% CI) | 0.94 [0.79, 1.11] |
| 3.4 Enteral nutrition | 36 | 3722 | Risk Ratio (M‐H, Random, 95% CI) | 0.88 [0.75, 1.03] |
| 3.5 Parenteral nutrition | 43 | 7313 | Risk Ratio (M‐H, Random, 95% CI) | 0.98 [0.83, 1.16] |
| 3.6 Mixed | 7 | 484 | Risk Ratio (M‐H, Random, 95% CI) | 0.67 [0.29, 1.55] |
| 4 All‐cause mortality ‐ medical specialty Show forest plot | 127 | 21758 | Risk Ratio (M‐H, Random, 95% CI) | 0.94 [0.86, 1.03] |
| 4.1 Cardiology | 0 | 0 | Risk Ratio (M‐H, Random, 95% CI) | 0.0 [0.0, 0.0] |
| 4.2 Medical gastro‐enterology and hepatology | 13 | 627 | Risk Ratio (M‐H, Random, 95% CI) | 0.90 [0.58, 1.38] |
| 4.3 Geriatrics | 13 | 2554 | Risk Ratio (M‐H, Random, 95% CI) | 0.85 [0.66, 1.08] |
| 4.4 Pulmonary disease | 3 | 118 | Risk Ratio (M‐H, Random, 95% CI) | 0.44 [0.15, 1.28] |
| 4.5 Endocrinology | 0 | 0 | Risk Ratio (M‐H, Random, 95% CI) | 0.0 [0.0, 0.0] |
| 4.6 Infectious diseases | 1 | 56 | Risk Ratio (M‐H, Random, 95% CI) | 1.61 [0.66, 3.92] |
| 4.7 Rheumatology | 0 | 0 | Risk Ratio (M‐H, Random, 95% CI) | 0.0 [0.0, 0.0] |
| 4.8 Haematology | 0 | 0 | Risk Ratio (M‐H, Random, 95% CI) | 0.0 [0.0, 0.0] |
| 4.9 Nephrology | 0 | 0 | Risk Ratio (M‐H, Random, 95% CI) | 0.0 [0.0, 0.0] |
| 4.10 Gastro‐enterologic surgery | 46 | 3943 | Risk Ratio (M‐H, Random, 95% CI) | 0.82 [0.62, 1.09] |
| 4.11 Trauma surgery | 4 | 184 | Risk Ratio (M‐H, Random, 95% CI) | 0.93 [0.55, 1.57] |
| 4.12 Orthopaedics | 12 | 1210 | Risk Ratio (M‐H, Random, 95% CI) | 1.39 [0.87, 2.22] |
| 4.13 Plastic, reconstructive and aesthetic surgery | 0 | 0 | Risk Ratio (M‐H, Random, 95% CI) | 0.0 [0.0, 0.0] |
| 4.14 Vascular surgery | 2 | 28 | Risk Ratio (M‐H, Random, 95% CI) | 0.0 [0.0, 0.0] |
| 4.15 Transplant surgery | 3 | 84 | Risk Ratio (M‐H, Random, 95% CI) | 0.58 [0.23, 1.50] |
| 4.16 Urology | 0 | 0 | Risk Ratio (M‐H, Random, 95% CI) | 0.0 [0.0, 0.0] |
| 4.17 Thoracic surgery | 3 | 592 | Risk Ratio (M‐H, Random, 95% CI) | 0.71 [0.16, 3.22] |
| 4.18 Neurological surgery | 0 | 0 | Risk Ratio (M‐H, Random, 95% CI) | 0.0 [0.0, 0.0] |
| 4.19 Oro‐maxillo‐facial surgery | 1 | 32 | Risk Ratio (M‐H, Random, 95% CI) | 3.38 [0.15, 77.12] |
| 4.20 Anaesthesiology | 0 | 0 | Risk Ratio (M‐H, Random, 95% CI) | 0.0 [0.0, 0.0] |
| 4.21 Emergency medicine | 7 | 5198 | Risk Ratio (M‐H, Random, 95% CI) | 0.99 [0.80, 1.22] |
| 4.22 Psychiatry | 0 | 0 | Risk Ratio (M‐H, Random, 95% CI) | 0.0 [0.0, 0.0] |
| 4.23 Neurology | 7 | 5168 | Risk Ratio (M‐H, Random, 95% CI) | 0.81 [0.60, 1.11] |
| 4.24 Oncology | 5 | 313 | Risk Ratio (M‐H, Random, 95% CI) | 1.19 [0.44, 3.21] |
| 4.25 Dermatology | 0 | 0 | Risk Ratio (M‐H, Random, 95% CI) | 0.0 [0.0, 0.0] |
| 4.26 Gynaecology | 0 | 0 | Risk Ratio (M‐H, Random, 95% CI) | 0.0 [0.0, 0.0] |
| 4.27 Mixed | 7 | 1651 | Risk Ratio (M‐H, Random, 95% CI) | 1.22 [0.88, 1.70] |
| 5 All‐cause mortality ‐ based on adequacy of the amount of calories Show forest plot | 127 | 21758 | Risk Ratio (M‐H, Random, 95% CI) | 0.94 [0.86, 1.03] |
| 5.1 Clearly adequate in experimental group and clearly inadequate in control group | 25 | 7371 | Risk Ratio (M‐H, Random, 95% CI) | 0.97 [0.81, 1.16] |
| 5.2 Inadequate in the experimental group or adequate in the control group | 26 | 6711 | Risk Ratio (M‐H, Random, 95% CI) | 1.00 [0.83, 1.19] |
| 5.3 Experimental group is overfed | 5 | 267 | Risk Ratio (M‐H, Random, 95% CI) | 0.57 [0.27, 1.17] |
| 5.4 Unclear intake in experimental group or control group | 71 | 7409 | Risk Ratio (M‐H, Random, 95% CI) | 0.91 [0.81, 1.03] |
| 6 All‐cause mortality ‐ different screening tools Show forest plot | 127 | 21758 | Risk Ratio (M‐H, Random, 95% CI) | 0.94 [0.86, 1.03] |
| 6.1 NRS 2002 | 4 | 5064 | Risk Ratio (M‐H, Random, 95% CI) | 1.04 [0.84, 1.29] |
| 6.2 MUST | 0 | 0 | Risk Ratio (M‐H, Random, 95% CI) | 0.0 [0.0, 0.0] |
| 6.3 MNA | 2 | 117 | Risk Ratio (M‐H, Random, 95% CI) | 0.61 [0.12, 3.18] |
| 6.4 SGA | 3 | 1171 | Risk Ratio (M‐H, Random, 95% CI) | 1.41 [0.94, 2.10] |
| 6.5 Other means | 118 | 15406 | Risk Ratio (M‐H, Random, 95% CI) | 0.90 [0.81, 0.99] |
| 7 All‐cause mortality ‐ participants characterised as 'at nutritional risk' due to one of the following conditions Show forest plot | 127 | 21758 | Risk Ratio (M‐H, Random, 95% CI) | 0.94 [0.86, 1.03] |
| 7.1 Major surgery | 60 | 5618 | Risk Ratio (M‐H, Random, 95% CI) | 0.81 [0.65, 1.01] |
| 7.2 Stroke | 3 | 4922 | Risk Ratio (M‐H, Random, 95% CI) | 0.97 [0.83, 1.12] |
| 7.3 ICU participants including trauma | 11 | 5382 | Risk Ratio (M‐H, Random, 95% CI) | 0.98 [0.81, 1.19] |
| 7.4 Frail elderly participants with less severe conditions known to increase protein requirements | 19 | 1937 | Risk Ratio (M‐H, Random, 95% CI) | 0.88 [0.56, 1.40] |
| 7.5 Participants do not fall into one of the categories above | 34 | 3899 | Risk Ratio (M‐H, Random, 95% CI) | 1.01 [0.83, 1.22] |
| 8 All‐cause mortality ‐ participants characterised as 'at nutritional risk' due to one of the following criteria Show forest plot | 127 | 21758 | Risk Ratio (M‐H, Random, 95% CI) | 0.94 [0.86, 1.03] |
| 8.1 BMI less than 20.5 kg/m2 | 2 | 247 | Risk Ratio (M‐H, Random, 95% CI) | 1.19 [0.58, 2.45] |
| 8.2 Weight loss of at least 5% during the last three months | 1 | 32 | Risk Ratio (M‐H, Random, 95% CI) | 0.0 [0.0, 0.0] |
| 8.3 Weight loss of at least 10% during the last six months | 1 | 32 | Risk Ratio (M‐H, Random, 95% CI) | 3.38 [0.15, 77.12] |
| 8.4 Insufficient food intake during the last week (50% of requirements or less) | 0 | 0 | Risk Ratio (M‐H, Random, 95% CI) | 0.0 [0.0, 0.0] |
| 8.5 Participants characterised as 'at nutritional risk' by other means | 123 | 21447 | Risk Ratio (M‐H, Random, 95% CI) | 0.93 [0.86, 1.02] |
| 9 All‐cause mortality ‐ participants characterised as 'at nutritional risk' due to biomarkers or anthropometrics Show forest plot | 127 | 21758 | Risk Ratio (M‐H, Random, 95% CI) | 0.94 [0.86, 1.03] |
| 9.1 Biomarkers | 5 | 657 | Risk Ratio (M‐H, Random, 95% CI) | 0.43 [0.16, 1.19] |
| 9.2 Anthropometric measures | 12 | 1402 | Risk Ratio (M‐H, Random, 95% CI) | 0.80 [0.56, 1.15] |
| 9.3 Characterised by other means | 110 | 19699 | Risk Ratio (M‐H, Random, 95% CI) | 0.95 [0.87, 1.05] |
| 10 All‐cause mortality ‐ randomisation year Show forest plot | 127 | 21758 | Risk Ratio (M‐H, Random, 95% CI) | 0.94 [0.86, 1.03] |
| 10.1 Before 1960 | 0 | 0 | Risk Ratio (M‐H, Random, 95% CI) | 0.0 [0.0, 0.0] |
| 10.2 1960 to 1979 | 5 | 181 | Risk Ratio (M‐H, Random, 95% CI) | 1.11 [0.50, 2.46] |
| 10.3 1980 to 1999 | 79 | 11350 | Risk Ratio (M‐H, Random, 95% CI) | 0.91 [0.81, 1.02] |
| 10.4 After 1999 | 43 | 10227 | Risk Ratio (M‐H, Random, 95% CI) | 0.95 [0.80, 1.12] |
| 11 All‐cause mortality ‐ trials where the intervention lasts fewer than three days compared with trials where the intervention lasts three days or more Show forest plot | 127 | 21758 | Risk Ratio (M‐H, Random, 95% CI) | 0.94 [0.86, 1.03] |
| 11.1 Three days or more | 111 | 20434 | Risk Ratio (M‐H, Random, 95% CI) | 0.92 [0.84, 1.01] |
| 11.2 Fewer than three days | 13 | 722 | Risk Ratio (M‐H, Random, 95% CI) | 0.76 [0.39, 1.45] |
| 11.3 Unknown | 3 | 602 | Risk Ratio (M‐H, Random, 95% CI) | 1.16 [0.33, 4.06] |
| 12 All‐cause mortality ‐ 'best‐worst case' scenario Show forest plot | 127 | 22207 | Risk Ratio (M‐H, Random, 95% CI) | 0.74 [0.65, 0.84] |
| 13 All‐cause mortality ‐ 'worst‐best case' scenario Show forest plot | 127 | 22207 | Risk Ratio (M‐H, Random, 95% CI) | 1.13 [0.97, 1.31] |
| 14 All‐cause mortality co‐interventions Show forest plot | 127 | 21758 | Risk Ratio (M‐H, Fixed, 95% CI) | 0.93 [0.86, 1.02] |
| 14.1 received nutrition support as co‐intervention | 12 | 5361 | Risk Ratio (M‐H, Fixed, 95% CI) | 0.94 [0.78, 1.14] |
| 14.2 did not receive nutrition support as co‐intervention | 108 | 15974 | Risk Ratio (M‐H, Fixed, 95% CI) | 0.93 [0.84, 1.03] |
| 14.3 delayed versus early nutrition support | 7 | 423 | Risk Ratio (M‐H, Fixed, 95% CI) | 0.94 [0.53, 1.66] |
| Outcome or subgroup title | No. of studies | No. of participants | Statistical method | Effect size |
| 1 All‐cause mortality ‐ overall Show forest plot | 141 | 23170 | Risk Ratio (M‐H, Random, 95% CI) | 0.93 [0.88, 0.99] |
| 2 All‐cause mortality ‐ bias Show forest plot | 141 | 23170 | Risk Ratio (M‐H, Random, 95% CI) | 0.93 [0.88, 0.99] |
| 2.1 High risk of bias | 141 | 23170 | Risk Ratio (M‐H, Random, 95% CI) | 0.93 [0.88, 0.99] |
| 2.2 Low risk of bias | 0 | 0 | Risk Ratio (M‐H, Random, 95% CI) | 0.0 [0.0, 0.0] |
| 3 All‐cause mortality ‐ mode of delivery Show forest plot | 141 | 23170 | Risk Ratio (M‐H, Random, 95% CI) | 0.93 [0.88, 0.99] |
| 3.1 General nutrition support | 7 | 1566 | Risk Ratio (M‐H, Random, 95% CI) | 0.99 [0.71, 1.36] |
| 3.2 Fortified nutrition | 2 | 290 | Risk Ratio (M‐H, Random, 95% CI) | 1.24 [0.61, 2.54] |
| 3.3 Oral nutrition support | 32 | 8501 | Risk Ratio (M‐H, Random, 95% CI) | 0.94 [0.77, 1.15] |
| 3.4 Enteral nutrition | 42 | 4212 | Risk Ratio (M‐H, Random, 95% CI) | 0.84 [0.75, 0.95] |
| 3.5 Parenteral nutrition | 51 | 8121 | Risk Ratio (M‐H, Random, 95% CI) | 0.99 [0.90, 1.09] |
| 3.6 Mixed | 7 | 480 | Risk Ratio (M‐H, Random, 95% CI) | 0.72 [0.37, 1.37] |
| 4 All‐cause mortality ‐ medical specialty Show forest plot | 141 | 23170 | Risk Ratio (M‐H, Random, 95% CI) | 0.93 [0.88, 0.99] |
| 4.1 Cardiology | 0 | 0 | Risk Ratio (M‐H, Random, 95% CI) | 0.0 [0.0, 0.0] |
| 4.2 Medical gastro‐enterology and hepatology | 13 | 622 | Risk Ratio (M‐H, Random, 95% CI) | 0.96 [0.77, 1.19] |
| 4.3 Geriatrics | 13 | 2547 | Risk Ratio (M‐H, Random, 95% CI) | 0.88 [0.67, 1.17] |
| 4.4 Pulmonary disease | 3 | 118 | Risk Ratio (M‐H, Random, 95% CI) | 0.44 [0.15, 1.28] |
| 4.5 Endocrinology | 0 | 0 | Risk Ratio (M‐H, Random, 95% CI) | 0.0 [0.0, 0.0] |
| 4.6 Infectious diseases | 1 | 56 | Risk Ratio (M‐H, Random, 95% CI) | 1.61 [0.66, 3.92] |
| 4.7 Rheumatology | 0 | 0 | Risk Ratio (M‐H, Random, 95% CI) | 0.0 [0.0, 0.0] |
| 4.8 Haematology | 0 | 0 | Risk Ratio (M‐H, Random, 95% CI) | 0.0 [0.0, 0.0] |
| 4.9 Nephrology | 0 | 0 | Risk Ratio (M‐H, Random, 95% CI) | 0.0 [0.0, 0.0] |
| 4.10 Gastroenterologic surgery | 50 | 4715 | Risk Ratio (M‐H, Random, 95% CI) | 0.89 [0.70, 1.12] |
| 4.11 Trauma surgery | 6 | 249 | Risk Ratio (M‐H, Random, 95% CI) | 0.86 [0.55, 1.34] |
| 4.12 Ortopaedics | 12 | 1196 | Risk Ratio (M‐H, Random, 95% CI) | 1.00 [0.61, 1.62] |
| 4.13 Plastic, reconstructive, and aesthetic surgery | 0 | 0 | Risk Ratio (M‐H, Random, 95% CI) | 0.0 [0.0, 0.0] |
| 4.14 Vascular surgery | 2 | 28 | Risk Ratio (M‐H, Random, 95% CI) | 0.0 [0.0, 0.0] |
| 4.15 Transplant surgery | 3 | 84 | Risk Ratio (M‐H, Random, 95% CI) | 0.54 [0.22, 1.31] |
| 4.16 Urology | 0 | 0 | Risk Ratio (M‐H, Random, 95% CI) | 0.0 [0.0, 0.0] |
| 4.17 Thoracic surgery | 3 | 592 | Risk Ratio (M‐H, Random, 95% CI) | 0.71 [0.16, 3.22] |
| 4.18 Neurological surgery | 0 | 0 | Risk Ratio (M‐H, Random, 95% CI) | 0.0 [0.0, 0.0] |
| 4.19 Oro‐maxillo‐facial surgery | 1 | 32 | Risk Ratio (M‐H, Random, 95% CI) | 3.38 [0.15, 77.12] |
| 4.20 Anaesthesiology | 0 | 0 | Risk Ratio (M‐H, Random, 95% CI) | 0.0 [0.0, 0.0] |
| 4.21 Emergency medicine | 11 | 5421 | Risk Ratio (M‐H, Random, 95% CI) | 0.97 [0.85, 1.12] |
| 4.22 Psychiatry | 0 | 0 | Risk Ratio (M‐H, Random, 95% CI) | 0.0 [0.0, 0.0] |
| 4.23 Neurology | 9 | 5448 | Risk Ratio (M‐H, Random, 95% CI) | 0.77 [0.59, 0.99] |
| 4.24 Oncology | 7 | 411 | Risk Ratio (M‐H, Random, 95% CI) | 1.03 [0.87, 1.21] |
| 4.25 Dermatology | 0 | 0 | Risk Ratio (M‐H, Random, 95% CI) | 0.0 [0.0, 0.0] |
| 4.26 Gynaecology | 0 | 0 | Risk Ratio (M‐H, Random, 95% CI) | 0.0 [0.0, 0.0] |
| 4.27 Mixed | 7 | 1651 | Risk Ratio (M‐H, Random, 95% CI) | 1.28 [0.94, 1.75] |
| 5 All‐cause mortality ‐ based on adequacy of the amount of calories Show forest plot | 141 | 23170 | Risk Ratio (M‐H, Random, 95% CI) | 0.93 [0.88, 0.99] |
| 5.1 Clearly adequate in intervention and clearly inadequate in control | 28 | 7589 | Risk Ratio (M‐H, Random, 95% CI) | 0.98 [0.88, 1.09] |
| 5.2 Inadequate in the experimental or adequate in the control | 27 | 6824 | Risk Ratio (M‐H, Random, 95% CI) | 0.95 [0.82, 1.10] |
| 5.3 Experimental group is overfed | 10 | 974 | Risk Ratio (M‐H, Random, 95% CI) | 0.98 [0.69, 1.41] |
| 5.4 Unclear intake in control or experimental | 76 | 7783 | Risk Ratio (M‐H, Random, 95% CI) | 0.89 [0.81, 0.98] |
| 6 All‐cause mortality ‐ different screening tools Show forest plot | 141 | 23170 | Risk Ratio (M‐H, Random, 95% CI) | 0.93 [0.88, 0.99] |
| 6.1 NRS 2002 | 4 | 5064 | Risk Ratio (M‐H, Random, 95% CI) | 1.02 [0.87, 1.19] |
| 6.2 MUST | 1 | 146 | Risk Ratio (M‐H, Random, 95% CI) | 1.30 [0.60, 2.82] |
| 6.3 MNA | 2 | 117 | Risk Ratio (M‐H, Random, 95% CI) | 0.61 [0.12, 3.18] |
| 6.4 SGA | 3 | 1171 | Risk Ratio (M‐H, Random, 95% CI) | 1.41 [0.94, 2.10] |
| 6.5 Other means | 131 | 16672 | Risk Ratio (M‐H, Random, 95% CI) | 0.91 [0.85, 0.97] |
| 7 All‐cause mortality ‐ participants characterised as 'at nutritional risk' due to one of the following conditions Show forest plot | 141 | 23170 | Risk Ratio (M‐H, Random, 95% CI) | 0.93 [0.88, 0.99] |
| 7.1 Major surgery | 62 | 5712 | Risk Ratio (M‐H, Random, 95% CI) | 0.84 [0.68, 1.04] |
| 7.2 Stroke | 4 | 5056 | Risk Ratio (M‐H, Random, 95% CI) | 0.91 [0.79, 1.05] |
| 7.3 ICU participants including trauma | 15 | 5626 | Risk Ratio (M‐H, Random, 95% CI) | 0.97 [0.85, 1.11] |
| 7.4 Frail elderly participants with less severe conditions known to increase protein requirements | 19 | 2385 | Risk Ratio (M‐H, Random, 95% CI) | 0.85 [0.65, 1.11] |
| 7.5 Participants do not fall into one of the categories above | 41 | 4391 | Risk Ratio (M‐H, Random, 95% CI) | 0.98 [0.84, 1.14] |
| 8 All‐cause mortality ‐ participants characterised as 'at nutritional risk' due to one of the following criteria Show forest plot | 141 | 23170 | Risk Ratio (M‐H, Random, 95% CI) | 0.93 [0.88, 0.99] |
| 8.1 BMI less than 20.5 kg/m2 | 2 | 247 | Risk Ratio (M‐H, Random, 95% CI) | 1.19 [0.58, 2.45] |
| 8.2 Weight loss of at least 5% during the last three months | 1 | 32 | Risk Ratio (M‐H, Random, 95% CI) | 0.0 [0.0, 0.0] |
| 8.3 Weight loss of at least 10% during the last six months | 3 | 124 | Risk Ratio (M‐H, Random, 95% CI) | 1.07 [0.11, 10.33] |
| 8.4 Insufficient food intake during the last week (50% of requirements or less) | 0 | 0 | Risk Ratio (M‐H, Random, 95% CI) | 0.0 [0.0, 0.0] |
| 8.5 Participants characterised as 'at nutritional risk' by other means | 135 | 22767 | Risk Ratio (M‐H, Random, 95% CI) | 0.93 [0.88, 0.99] |
| 9 All‐cause mortality ‐ participants characterised as 'at nutritional risk' due to biomarkers or anthropometrics Show forest plot | 141 | 23170 | Risk Ratio (M‐H, Random, 95% CI) | 0.93 [0.88, 0.99] |
| 9.1 Biomarkers | 7 | 749 | Risk Ratio (M‐H, Random, 95% CI) | 0.40 [0.16, 1.00] |
| 9.2 Anthropometric measures | 12 | 1402 | Risk Ratio (M‐H, Random, 95% CI) | 0.79 [0.55, 1.11] |
| 9.3 Both anthropometrics and biomarkers | 3 | 75 | Risk Ratio (M‐H, Random, 95% CI) | 0.66 [0.14, 3.07] |
| 9.4 Characterised by other means | 119 | 20944 | Risk Ratio (M‐H, Random, 95% CI) | 0.94 [0.89, 1.00] |
| 10 All‐cause mortality ‐ randomisation year Show forest plot | 141 | 23170 | Risk Ratio (M‐H, Random, 95% CI) | 0.93 [0.88, 0.99] |
| 10.1 Before 1960 | 0 | 0 | Risk Ratio (M‐H, Random, 95% CI) | 0.0 [0.0, 0.0] |
| 10.2 1960 to 1979 | 6 | 237 | Risk Ratio (M‐H, Random, 95% CI) | 1.07 [0.52, 2.23] |
| 10.3 1980 to 1999 | 86 | 12055 | Risk Ratio (M‐H, Random, 95% CI) | 0.92 [0.86, 1.00] |
| 10.4 After 1999 | 49 | 10878 | Risk Ratio (M‐H, Random, 95% CI) | 0.93 [0.81, 1.06] |
| 11 All‐cause mortality ‐ trials where the intervention lasts fewer than three days compared with trials where the intervention lasts three days or more Show forest plot | 141 | 23170 | Risk Ratio (M‐H, Random, 95% CI) | 0.93 [0.88, 0.99] |
| 11.1 Three days or more | 127 | 22394 | Risk Ratio (M‐H, Random, 95% CI) | 0.93 [0.88, 0.99] |
| 11.2 Fewer than three days | 12 | 699 | Risk Ratio (M‐H, Random, 95% CI) | 1.05 [0.72, 1.54] |
| 11.3 Unknown | 2 | 77 | Risk Ratio (M‐H, Random, 95% CI) | 0.25 [0.01, 5.00] |
| 12 All‐cause mortality ‐ 'best‐worst case' scenario Show forest plot | 141 | 23700 | Risk Ratio (M‐H, Random, 95% CI) | 0.77 [0.69, 0.85] |
| 13 All‐cause mortality ‐ 'worst‐best case' scenario Show forest plot | 141 | 23700 | Risk Ratio (M‐H, Random, 95% CI) | 1.09 [0.98, 1.23] |
| 14 All‐cause mortality co‐interventions Show forest plot | 141 | 23170 | Risk Ratio (M‐H, Fixed, 95% CI) | 0.92 [0.86, 0.98] |
| 14.1 received nutrition support as co‐intervention | 13 | 5475 | Risk Ratio (M‐H, Fixed, 95% CI) | 0.95 [0.82, 1.08] |
| 14.2 did not receive nutrition support as co‐intervention | 125 | 17462 | Risk Ratio (M‐H, Fixed, 95% CI) | 0.91 [0.85, 0.98] |
| 14.3 delayed versus early nutrition support | 3 | 233 | Risk Ratio (M‐H, Fixed, 95% CI) | 0.99 [0.53, 1.83] |
| Outcome or subgroup title | No. of studies | No. of participants | Statistical method | Effect size |
| 1 Serious adverse events ‐ overall Show forest plot | 137 | 22087 | Risk Ratio (M‐H, Random, 95% CI) | 0.93 [0.86, 1.01] |
| 2 Serious adverse events ‐ bias Show forest plot | 137 | 22087 | Risk Ratio (M‐H, Random, 95% CI) | 0.93 [0.86, 1.01] |
| 2.1 High risk of bias | 137 | 22087 | Risk Ratio (M‐H, Random, 95% CI) | 0.93 [0.86, 1.01] |
| 2.2 Low risk of bias | 0 | 0 | Risk Ratio (M‐H, Random, 95% CI) | 0.0 [0.0, 0.0] |
| 3 Serious adverse events ‐ mode of delivery Show forest plot | 137 | 22087 | Risk Ratio (M‐H, Random, 95% CI) | 0.93 [0.86, 1.01] |
| 3.1 General nutrition support | 6 | 1420 | Risk Ratio (M‐H, Random, 95% CI) | 1.19 [0.79, 1.78] |
| 3.2 Fortified | 2 | 290 | Risk Ratio (M‐H, Random, 95% CI) | 1.24 [0.61, 2.54] |
| 3.3 Oral | 33 | 8569 | Risk Ratio (M‐H, Random, 95% CI) | 0.92 [0.79, 1.06] |
| 3.4 Enteral | 43 | 3935 | Risk Ratio (M‐H, Random, 95% CI) | 0.85 [0.74, 0.98] |
| 3.5 Parenteral | 48 | 7519 | Risk Ratio (M‐H, Random, 95% CI) | 0.98 [0.85, 1.14] |
| 3.6 Mixed | 5 | 354 | Risk Ratio (M‐H, Random, 95% CI) | 0.77 [0.33, 1.76] |
| 4 Serious adverse events ‐ by medical specialty Show forest plot | 137 | 22087 | Risk Ratio (M‐H, Random, 95% CI) | 0.93 [0.86, 1.01] |
| 4.1 Cardiology | 0 | 0 | Risk Ratio (M‐H, Random, 95% CI) | 0.0 [0.0, 0.0] |
| 4.2 Medical gastroenterology and hepatology | 10 | 518 | Risk Ratio (M‐H, Random, 95% CI) | 0.90 [0.60, 1.36] |
| 4.3 High risk | 0 | 0 | Risk Ratio (M‐H, Random, 95% CI) | 0.0 [0.0, 0.0] |
| 4.4 Geriatrics | 13 | 2554 | Risk Ratio (M‐H, Random, 95% CI) | 0.85 [0.66, 1.08] |
| 4.5 Pulmonary disease | 3 | 118 | Risk Ratio (M‐H, Random, 95% CI) | 0.44 [0.15, 1.28] |
| 4.6 Endocrinology | 0 | 0 | Risk Ratio (M‐H, Random, 95% CI) | 0.0 [0.0, 0.0] |
| 4.7 Infectious diseases | 1 | 56 | Risk Ratio (M‐H, Random, 95% CI) | 1.23 [0.52, 2.93] |
| 4.8 Rheumatology | 0 | 0 | Risk Ratio (M‐H, Random, 95% CI) | 0.0 [0.0, 0.0] |
| 4.9 Haematology | 0 | 0 | Risk Ratio (M‐H, Random, 95% CI) | 0.0 [0.0, 0.0] |
| 4.10 Nephrology | 0 | 0 | Risk Ratio (M‐H, Random, 95% CI) | 0.0 [0.0, 0.0] |
| 4.11 Gastroenterologic surgery | 57 | 4320 | Risk Ratio (M‐H, Random, 95% CI) | 0.86 [0.72, 1.02] |
| 4.12 Trauma surgery | 5 | 225 | Risk Ratio (M‐H, Random, 95% CI) | 0.93 [0.55, 1.57] |
| 4.13 Ortopaedics | 12 | 1210 | Risk Ratio (M‐H, Random, 95% CI) | 1.39 [0.90, 2.14] |
| 4.14 Plastic, reconstructive, and aesthetic surgery | 0 | 0 | Risk Ratio (M‐H, Random, 95% CI) | 0.0 [0.0, 0.0] |
| 4.15 Vascular surgery | 3 | 48 | Risk Ratio (M‐H, Random, 95% CI) | 0.5 [0.05, 4.67] |
| 4.16 Transplant surgery | 3 | 84 | Risk Ratio (M‐H, Random, 95% CI) | 0.58 [0.23, 1.50] |
| 4.17 Urology | 0 | 0 | Risk Ratio (M‐H, Random, 95% CI) | 0.0 [0.0, 0.0] |
| 4.18 Thoracic surgery | 3 | 592 | Risk Ratio (M‐H, Random, 95% CI) | 0.47 [0.06, 3.62] |
| 4.19 Neurological surgery | 0 | 0 | Risk Ratio (M‐H, Random, 95% CI) | 0.0 [0.0, 0.0] |
| 4.20 Oro‐maxillo‐facial surgery | 1 | 32 | Risk Ratio (M‐H, Random, 95% CI) | 0.88 [0.44, 1.78] |
| 4.21 Anaesthesiology | 0 | 0 | Risk Ratio (M‐H, Random, 95% CI) | 0.0 [0.0, 0.0] |
| 4.22 Emergency medicine | 7 | 5198 | Risk Ratio (M‐H, Random, 95% CI) | 0.99 [0.80, 1.22] |
| 4.23 Psychiatry | 0 | 0 | Risk Ratio (M‐H, Random, 95% CI) | 0.0 [0.0, 0.0] |
| 4.24 Neurology | 7 | 5168 | Risk Ratio (M‐H, Random, 95% CI) | 0.78 [0.58, 1.06] |
| 4.25 Oncology | 5 | 309 | Risk Ratio (M‐H, Random, 95% CI) | 1.12 [0.51, 2.44] |
| 4.26 Dermatology | 0 | 0 | Risk Ratio (M‐H, Random, 95% CI) | 0.0 [0.0, 0.0] |
| 4.27 Gynaecology | 0 | 0 | Risk Ratio (M‐H, Random, 95% CI) | 0.0 [0.0, 0.0] |
| 4.28 Mixed | 7 | 1655 | Risk Ratio (M‐H, Random, 95% CI) | 1.24 [0.92, 1.67] |
| 5 Serious adverse events ‐ based on adequacy of the amount of calories Show forest plot | 137 | 22087 | Risk Ratio (M‐H, Random, 95% CI) | 0.93 [0.86, 1.01] |
| 5.1 Clearly adequate in intervention and clearly inadequate in control | 28 | 7405 | Risk Ratio (M‐H, Random, 95% CI) | 0.95 [0.80, 1.11] |
| 5.2 Inadequate in the experimental or adequate in the control | 28 | 7335 | Risk Ratio (M‐H, Random, 95% CI) | 0.97 [0.84, 1.13] |
| 5.3 Experimental group is overfed | 6 | 224 | Risk Ratio (M‐H, Random, 95% CI) | 0.85 [0.44, 1.67] |
| 5.4 Unclear intake in control or experimental | 75 | 7123 | Risk Ratio (M‐H, Random, 95% CI) | 0.83 [0.70, 0.98] |
| 6 Serious adverse events ‐ different screening tools Show forest plot | 137 | 22087 | Risk Ratio (M‐H, Random, 95% CI) | 0.93 [0.86, 1.01] |
| 6.1 NRS 2002 | 4 | 5064 | Risk Ratio (M‐H, Random, 95% CI) | 1.06 [0.87, 1.31] |
| 6.2 MUST | 0 | 0 | Risk Ratio (M‐H, Random, 95% CI) | 0.0 [0.0, 0.0] |
| 6.3 MNA | 2 | 117 | Risk Ratio (M‐H, Random, 95% CI) | 0.61 [0.12, 3.18] |
| 6.4 SGA | 3 | 1175 | Risk Ratio (M‐H, Random, 95% CI) | 0.82 [0.35, 1.92] |
| 6.5 Other means | 128 | 15731 | Risk Ratio (M‐H, Random, 95% CI) | 0.90 [0.82, 0.98] |
| 7 Serious adverse events ‐ participants characterised as 'at nutritional risk' due to one of the following conditions Show forest plot | 137 | 22087 | Risk Ratio (M‐H, Random, 95% CI) | 0.93 [0.86, 1.01] |
| 7.1 Major surgery | 65 | 5180 | Risk Ratio (M‐H, Random, 95% CI) | 0.84 [0.71, 0.99] |
| 7.2 Stroke | 6 | 5139 | Risk Ratio (M‐H, Random, 95% CI) | 0.78 [0.58, 1.06] |
| 7.3 ICU participants including trauma | 12 | 5423 | Risk Ratio (M‐H, Random, 95% CI) | 0.98 [0.81, 1.19] |
| 7.4 Frail elderly participants with less severe conditions known to increase protein requirements | 19 | 2406 | Risk Ratio (M‐H, Random, 95% CI) | 0.97 [0.75, 1.26] |
| 7.5 Participants do not fall into one of the categories above | 35 | 3939 | Risk Ratio (M‐H, Random, 95% CI) | 1.01 [0.85, 1.21] |
| 8 Serious adverse events ‐ participants characterised as 'at nutritional risk' due to one of the following criteria Show forest plot | 137 | 22087 | Risk Ratio (M‐H, Random, 95% CI) | 0.93 [0.86, 1.01] |
| 8.1 BMI less than 20.5 kg/m2 | 2 | 247 | Risk Ratio (M‐H, Random, 95% CI) | 1.19 [0.58, 2.45] |
| 8.2 Weight loss of at least 5% during the last three months | 1 | 32 | Risk Ratio (M‐H, Random, 95% CI) | 0.0 [0.0, 0.0] |
| 8.3 Weight loss of at least 10% during the last six months | 1 | 32 | Risk Ratio (M‐H, Random, 95% CI) | 0.88 [0.44, 1.78] |
| 8.4 Insufficient food intake during the last week (50% of requirements or less) | 0 | 0 | Risk Ratio (M‐H, Random, 95% CI) | 0.0 [0.0, 0.0] |
| 8.5 Participants characterised as 'at nutritional risk' by other means | 133 | 21776 | Risk Ratio (M‐H, Random, 95% CI) | 0.93 [0.86, 1.01] |
| 9 Serious adverse events ‐ participants characterised as 'at nutritional risk' due to biomarkers or anthropometrics Show forest plot | 137 | 22087 | Risk Ratio (M‐H, Random, 95% CI) | 0.93 [0.86, 1.01] |
| 9.1 Biomarkers | 8 | 703 | Risk Ratio (M‐H, Random, 95% CI) | 0.39 [0.16, 0.95] |
| 9.2 Anthropometric measures | 15 | 1677 | Risk Ratio (M‐H, Random, 95% CI) | 0.90 [0.68, 1.20] |
| 9.3 Mixed | 0 | 0 | Risk Ratio (M‐H, Random, 95% CI) | 0.0 [0.0, 0.0] |
| 9.4 Characterised by other means | 114 | 19707 | Risk Ratio (M‐H, Random, 95% CI) | 0.94 [0.86, 1.02] |
| 10 Serious adverse events ‐ randomisation year Show forest plot | 137 | 22087 | Risk Ratio (M‐H, Random, 95% CI) | 0.93 [0.86, 1.01] |
| 10.1 Before 1960 | 0 | 0 | Risk Ratio (M‐H, Random, 95% CI) | 0.0 [0.0, 0.0] |
| 10.2 1960 to 1979 | 5 | 184 | Risk Ratio (M‐H, Random, 95% CI) | 1.40 [0.70, 2.78] |
| 10.3 1980 to 1999 | 86 | 11472 | Risk Ratio (M‐H, Random, 95% CI) | 0.91 [0.82, 1.00] |
| 10.4 After 1999 | 46 | 10431 | Risk Ratio (M‐H, Random, 95% CI) | 0.89 [0.75, 1.06] |
| 11 Serious adverse events ‐ trials where the intervention lasts fewer than three days compared with trials where the intervention lasts three days or more Show forest plot | 137 | 22087 | Risk Ratio (M‐H, Random, 95% CI) | 0.93 [0.86, 1.01] |
| 11.1 Three days or more | 125 | 21408 | Risk Ratio (M‐H, Random, 95% CI) | 0.94 [0.86, 1.02] |
| 11.2 Less than three days | 10 | 602 | Risk Ratio (M‐H, Random, 95% CI) | 0.67 [0.39, 1.16] |
| 11.3 Unknown | 2 | 77 | Risk Ratio (M‐H, Random, 95% CI) | 0.25 [0.01, 5.00] |
| 12 Serious adverse events ‐ 'best‐worst case' scenario Show forest plot | 137 | 22557 | Risk Ratio (M‐H, Random, 95% CI) | 0.74 [0.65, 0.83] |
| 13 Serious adverse events ‐ 'worst‐best case' scenario Show forest plot | 137 | 22557 | Risk Ratio (M‐H, Random, 95% CI) | 1.06 [0.92, 1.21] |
| 14 Serious adverse events co‐interventions Show forest plot | 137 | 22087 | Risk Ratio (M‐H, Fixed, 95% CI) | 0.91 [0.84, 0.99] |
| 14.1 received nutrition support as co‐intervention | 11 | 5337 | Risk Ratio (M‐H, Fixed, 95% CI) | 0.95 [0.79, 1.15] |
| 14.2 did not receive nutrition support as co‐intervention | 119 | 16327 | Risk Ratio (M‐H, Fixed, 95% CI) | 0.90 [0.83, 0.99] |
| 14.3 delayed versus early nutrition support | 7 | 423 | Risk Ratio (M‐H, Fixed, 95% CI) | 0.89 [0.51, 1.57] |
| Outcome or subgroup title | No. of studies | No. of participants | Statistical method | Effect size |
| 1 Serious adverse events ‐ overall Show forest plot | 152 | 23413 | Risk Ratio (M‐H, Random, 95% CI) | 0.91 [0.85, 0.97] |
| 2 Serious adverse events ‐ bias Show forest plot | 152 | 23413 | Risk Ratio (M‐H, Random, 95% CI) | 0.91 [0.85, 0.97] |
| 2.1 High risk of bias | 152 | 23413 | Risk Ratio (M‐H, Random, 95% CI) | 0.91 [0.85, 0.97] |
| 2.2 Low risk of bias | 0 | 0 | Risk Ratio (M‐H, Random, 95% CI) | 0.0 [0.0, 0.0] |
| 3 Serious adverse events ‐ mode of delivery Show forest plot | 152 | 23413 | Risk Ratio (M‐H, Random, 95% CI) | 0.91 [0.85, 0.97] |
| 3.1 General nutrition support | 7 | 1544 | Risk Ratio (M‐H, Random, 95% CI) | 1.04 [0.76, 1.44] |
| 3.2 Fortified nutrition | 2 | 290 | Risk Ratio (M‐H, Random, 95% CI) | 1.24 [0.61, 2.54] |
| 3.3 Oral nutrition support | 33 | 8541 | Risk Ratio (M‐H, Random, 95% CI) | 0.89 [0.74, 1.07] |
| 3.4 Enteral nutrition | 49 | 4425 | Risk Ratio (M‐H, Random, 95% CI) | 0.82 [0.73, 0.91] |
| 3.5 Parenteral nutrition | 56 | 8263 | Risk Ratio (M‐H, Random, 95% CI) | 0.98 [0.90, 1.07] |
| 3.6 Mixed | 5 | 350 | Risk Ratio (M‐H, Random, 95% CI) | 0.74 [0.37, 1.48] |
| 4 Serious adverse events ‐ by medical specialty Show forest plot | 152 | 23413 | Risk Ratio (M‐H, Random, 95% CI) | 0.91 [0.85, 0.97] |
| 4.1 Cardiology | 0 | 0 | Risk Ratio (M‐H, Random, 95% CI) | 0.0 [0.0, 0.0] |
| 4.2 Medical gastroenterology and hepatology | 13 | 706 | Risk Ratio (M‐H, Random, 95% CI) | 0.94 [0.75, 1.17] |
| 4.3 Geriatrics | 13 | 2547 | Risk Ratio (M‐H, Random, 95% CI) | 0.88 [0.67, 1.17] |
| 4.4 Pulmonary disease | 3 | 118 | Risk Ratio (M‐H, Random, 95% CI) | 0.44 [0.15, 1.28] |
| 4.5 Endocrinology | 0 | 0 | Risk Ratio (M‐H, Random, 95% CI) | 0.0 [0.0, 0.0] |
| 4.6 Infectious diseases | 1 | 56 | Risk Ratio (M‐H, Random, 95% CI) | 1.23 [0.52, 2.93] |
| 4.7 Rheumatology | 0 | 0 | Risk Ratio (M‐H, Random, 95% CI) | 0.0 [0.0, 0.0] |
| 4.8 Haematology | 0 | 0 | Risk Ratio (M‐H, Random, 95% CI) | 0.0 [0.0, 0.0] |
| 4.9 Nephrology | 0 | 0 | Risk Ratio (M‐H, Random, 95% CI) | 0.0 [0.0, 0.0] |
| 4.10 Gastroenterologic surgery | 59 | 4835 | Risk Ratio (M‐H, Random, 95% CI) | 0.83 [0.71, 0.97] |
| 4.11 Trauma surgery | 7 | 290 | Risk Ratio (M‐H, Random, 95% CI) | 0.86 [0.55, 1.34] |
| 4.12 Ortopaedics | 12 | 1196 | Risk Ratio (M‐H, Random, 95% CI) | 0.98 [0.63, 1.51] |
| 4.13 Plastic, reconstructive, and aesthetic surgery | 0 | 0 | Risk Ratio (M‐H, Random, 95% CI) | 0.0 [0.0, 0.0] |
| 4.14 Vascular surgery | 3 | 48 | Risk Ratio (M‐H, Random, 95% CI) | 0.5 [0.05, 4.67] |
| 4.15 Transplant surgery | 3 | 84 | Risk Ratio (M‐H, Random, 95% CI) | 0.54 [0.22, 1.31] |
| 4.16 Urology | 0 | 0 | Risk Ratio (M‐H, Random, 95% CI) | 0.0 [0.0, 0.0] |
| 4.17 Thoracic surgery | 3 | 592 | Risk Ratio (M‐H, Random, 95% CI) | 0.47 [0.06, 3.62] |
| 4.18 Neurological surgery | 0 | 0 | Risk Ratio (M‐H, Random, 95% CI) | 0.0 [0.0, 0.0] |
| 4.19 Oro‐maxillo‐facial surgery | 1 | 32 | Risk Ratio (M‐H, Random, 95% CI) | 0.88 [0.44, 1.78] |
| 4.20 Anaesthesiology | 0 | 0 | Risk Ratio (M‐H, Random, 95% CI) | 0.0 [0.0, 0.0] |
| 4.21 Emergency medicine | 11 | 5421 | Risk Ratio (M‐H, Random, 95% CI) | 0.96 [0.84, 1.10] |
| 4.22 Psychiatry | 0 | 0 | Risk Ratio (M‐H, Random, 95% CI) | 0.0 [0.0, 0.0] |
| 4.23 Neurology | 9 | 5426 | Risk Ratio (M‐H, Random, 95% CI) | 0.75 [0.58, 0.98] |
| 4.24 Oncology | 7 | 407 | Risk Ratio (M‐H, Random, 95% CI) | 1.02 [0.87, 1.20] |
| 4.25 Dermatology | 0 | 0 | Risk Ratio (M‐H, Random, 95% CI) | 0.0 [0.0, 0.0] |
| 4.26 Gynaecology | 0 | 0 | Risk Ratio (M‐H, Random, 95% CI) | 0.0 [0.0, 0.0] |
| 4.27 Mixed | 7 | 1655 | Risk Ratio (M‐H, Random, 95% CI) | 1.29 [0.97, 1.71] |
| 5 Serious adverse events ‐ based on adequacy of the amount of calories Show forest plot | 152 | 23413 | Risk Ratio (M‐H, Random, 95% CI) | 0.91 [0.85, 0.97] |
| 5.1 Clearly adequate in intervention and clearly inadequate in control | 31 | 7623 | Risk Ratio (M‐H, Random, 95% CI) | 0.95 [0.86, 1.05] |
| 5.2 Inadequate in the experimental or adequate in the control | 29 | 7395 | Risk Ratio (M‐H, Random, 95% CI) | 0.95 [0.85, 1.05] |
| 5.3 Experimental group is overfed | 11 | 867 | Risk Ratio (M‐H, Random, 95% CI) | 0.92 [0.72, 1.19] |
| 5.4 Unclear intake in control or experimental | 81 | 7528 | Risk Ratio (M‐H, Random, 95% CI) | 0.81 [0.70, 0.94] |
| 6 Serious adverse events ‐ different screening tools Show forest plot | 152 | 23413 | Risk Ratio (M‐H, Random, 95% CI) | 0.91 [0.85, 0.97] |
| 6.1 NRS 2002 | 4 | 5064 | Risk Ratio (M‐H, Random, 95% CI) | 1.03 [0.89, 1.21] |
| 6.2 MUST | 1 | 124 | Risk Ratio (M‐H, Random, 95% CI) | 1.37 [0.64, 2.92] |
| 6.3 MNA | 2 | 117 | Risk Ratio (M‐H, Random, 95% CI) | 0.61 [0.12, 3.18] |
| 6.4 SGA | 0 | 0 | Risk Ratio (M‐H, Random, 95% CI) | 0.0 [0.0, 0.0] |
| 6.5 Other means | 145 | 18108 | Risk Ratio (M‐H, Random, 95% CI) | 0.89 [0.82, 0.95] |
| 7 Serious adverse events ‐ participants characterised as 'at nutritional risk' due to one of the following conditions Show forest plot | 152 | 23413 | Risk Ratio (M‐H, Random, 95% CI) | 0.91 [0.85, 0.97] |
| 7.1 Major surgery | 72 | 5936 | Risk Ratio (M‐H, Random, 95% CI) | 0.82 [0.71, 0.94] |
| 7.2 Stroke | 8 | 5397 | Risk Ratio (M‐H, Random, 95% CI) | 0.75 [0.58, 0.98] |
| 7.3 ICU participants including trauma | 16 | 5667 | Risk Ratio (M‐H, Random, 95% CI) | 0.96 [0.84, 1.10] |
| 7.4 Frail elderly participants with less severe conditions known to increase protein requirements | 19 | 2385 | Risk Ratio (M‐H, Random, 95% CI) | 0.82 [0.65, 1.03] |
| 7.5 Participants do not fall into one of the categories above | 37 | 4028 | Risk Ratio (M‐H, Random, 95% CI) | 1.03 [0.92, 1.15] |
| 8 Serious adverse events ‐ participants characterised as 'at nutritional risk' due to one of the following criteria Show forest plot | 152 | 23413 | Risk Ratio (M‐H, Random, 95% CI) | 0.91 [0.85, 0.97] |
| 8.1 BMI less than 20.5 kg/m2 | 2 | 247 | Risk Ratio (M‐H, Random, 95% CI) | 1.19 [0.58, 2.45] |
| 8.2 Weight loss of at least 5% during the last three months | 1 | 32 | Risk Ratio (M‐H, Random, 95% CI) | 0.0 [0.0, 0.0] |
| 8.3 Weight loss of at least 10% during the last six months | 3 | 124 | Risk Ratio (M‐H, Random, 95% CI) | 0.84 [0.42, 1.67] |
| 8.4 Insufficient food intake during the last week (50% of requirements or less) | 0 | 0 | Risk Ratio (M‐H, Random, 95% CI) | 0.0 [0.0, 0.0] |
| 8.5 Participants characterised as 'at nutritional risk' by other means | 146 | 23010 | Risk Ratio (M‐H, Random, 95% CI) | 0.90 [0.84, 0.97] |
| 9 Serious adverse events ‐ participants characterised as 'at nutritional risk' due to biomarkers or anthropometrics Show forest plot | 152 | 23413 | Risk Ratio (M‐H, Random, 95% CI) | 0.91 [0.85, 0.97] |
| 9.1 Biomarkers | 10 | 795 | Risk Ratio (M‐H, Random, 95% CI) | 0.37 [0.16, 0.85] |
| 9.2 Anthropometric measures | 12 | 1402 | Risk Ratio (M‐H, Random, 95% CI) | 0.76 [0.54, 1.08] |
| 9.3 Both | 3 | 75 | Risk Ratio (M‐H, Random, 95% CI) | 0.66 [0.14, 3.07] |
| 9.4 Characterised by other means | 127 | 21141 | Risk Ratio (M‐H, Random, 95% CI) | 0.91 [0.85, 0.98] |
| 10 Serious adverse events ‐ randomisation year Show forest plot | 152 | 23413 | Risk Ratio (M‐H, Random, 95% CI) | 0.91 [0.85, 0.97] |
| 10.1 Before 1960 | 0 | 0 | Risk Ratio (M‐H, Random, 95% CI) | 0.0 [0.0, 0.0] |
| 10.2 1960 to 1979 | 6 | 240 | Risk Ratio (M‐H, Random, 95% CI) | 1.18 [0.65, 2.14] |
| 10.3 1980 to 1999 | 93 | 12128 | Risk Ratio (M‐H, Random, 95% CI) | 0.92 [0.86, 0.99] |
| 10.4 After 1999 | 53 | 11045 | Risk Ratio (M‐H, Random, 95% CI) | 0.83 [0.72, 0.97] |
| 11 Serious adverse events ‐ trials where the intervention lasts fewer than three days compared with trials where the intervention lasts three days or more Show forest plot | 152 | 23413 | Risk Ratio (M‐H, Random, 95% CI) | 0.91 [0.85, 0.97] |
| 11.1 Three days or more | 138 | 22637 | Risk Ratio (M‐H, Random, 95% CI) | 0.90 [0.84, 0.97] |
| 11.2 Less than three days | 12 | 699 | Risk Ratio (M‐H, Random, 95% CI) | 0.90 [0.66, 1.23] |
| 11.3 Unknown | 2 | 77 | Risk Ratio (M‐H, Random, 95% CI) | 0.25 [0.01, 5.00] |
| 12 Serious adverse events ‐ 'best‐worst case' scenario Show forest plot | 152 | 24315 | Risk Ratio (M‐H, Random, 95% CI) | 0.72 [0.65, 0.79] |
| 13 Serious adverse events ‐ 'worst‐best case' scenario Show forest plot | 152 | 24082 | Risk Ratio (M‐H, Random, 95% CI) | 1.05 [0.94, 1.17] |
| 14 Serious adverse events co‐interventions Show forest plot | 152 | 23413 | Risk Ratio (M‐H, Fixed, 95% CI) | 0.89 [0.84, 0.95] |
| 14.1 Received nutrition support as co‐intervention | 12 | 5459 | Risk Ratio (M‐H, Fixed, 95% CI) | 0.93 [0.81, 1.06] |
| 14.2 did not receive nutrition support as co‐intervention | 132 | 17493 | Risk Ratio (M‐H, Fixed, 95% CI) | 0.88 [0.82, 0.94] |
| 14.3 delayed versus early nutrition support | 8 | 461 | Risk Ratio (M‐H, Fixed, 95% CI) | 1.09 [0.75, 1.59] |
| 15 Serious adverse events ‐ 'best‐worse case' scenario (enteral nutrition) Show forest plot | 46 | 4415 | Risk Ratio (M‐H, Random, 95% CI) | 0.62 [0.51, 0.75] |
| 16 Serious adverse events ‐ 'worst‐best case' scenario (enteral nutrition) Show forest plot | 46 | 4415 | Risk Ratio (M‐H, Random, 95% CI) | 0.81 [0.69, 0.96] |
| Outcome or subgroup title | No. of studies | No. of participants | Statistical method | Effect size |
| 1 Quality of life ‐ overall Show forest plot | 2 | 242 | Mean Difference (IV, Random, 95% CI) | 2.35 [‐2.94, 7.65] |
| Outcome or subgroup title | No. of studies | No. of participants | Statistical method | Effect size |
| 1 Quality of life ‐ overall Show forest plot | 3 | 289 | Mean Difference (IV, Random, 95% CI) | 1.54 [‐2.47, 5.55] |
| Outcome or subgroup title | No. of studies | No. of participants | Statistical method | Effect size |
| 1 Quality of life ‐ overall Show forest plot | 2 | 242 | Mean Difference (IV, Random, 95% CI) | ‐0.90 [‐3.92, 2.13] |
| Outcome or subgroup title | No. of studies | No. of participants | Statistical method | Effect size |
| 1 Quality of life ‐ overall Show forest plot | 3 | 289 | Mean Difference (IV, Random, 95% CI) | ‐0.25 [‐3.02, 2.53] |
| Outcome or subgroup title | No. of studies | No. of participants | Statistical method | Effect size |
| 1 Quality of life ‐ overall Show forest plot | 2 | 3961 | Mean Difference (IV, Random, 95% CI) | ‐0.01 [‐0.03, 0.01] |
| Outcome or subgroup title | No. of studies | No. of participants | Statistical method | Effect size |
| 1 Pneumonia Show forest plot | 28 | 12443 | Risk Ratio (M‐H, Random, 95% CI) | 1.06 [0.96, 1.16] |
| Outcome or subgroup title | No. of studies | No. of participants | Statistical method | Effect size |
| 1 Wound dehiscence Show forest plot | 14 | 2280 | Risk Ratio (M‐H, Random, 95% CI) | 0.71 [0.40, 1.24] |
| Outcome or subgroup title | No. of studies | No. of participants | Statistical method | Effect size |
| 1 Renal failure Show forest plot | 5 | 6359 | Risk Ratio (M‐H, Random, 95% CI) | 1.00 [0.83, 1.20] |
| Outcome or subgroup title | No. of studies | No. of participants | Statistical method | Effect size |
| 1 Wound infection Show forest plot | 28 | 8324 | Risk Ratio (M‐H, Random, 95% CI) | 0.81 [0.60, 1.10] |
| Outcome or subgroup title | No. of studies | No. of participants | Statistical method | Effect size |
| 1 Heart failure Show forest plot | 3 | 1041 | Risk Ratio (M‐H, Random, 95% CI) | 1.11 [0.34, 3.61] |
| Outcome or subgroup title | No. of studies | No. of participants | Statistical method | Effect size |
| 1 AcM ‐ EoI Show forest plot | 6 | 5578 | Risk Ratio (M‐H, Fixed, 95% CI) | 1.01 [0.81, 1.25] |
| 2 AcM ‐ MF Show forest plot | 6 | 5578 | Risk Ratio (M‐H, Random, 95% CI) | 1.01 [0.86, 1.18] |
| 3 SaE ‐ EoI Show forest plot | 6 | 5578 | Risk Ratio (M‐H, Fixed, 95% CI) | 0.96 [0.78, 1.19] |
| 4 SaE ‐ MF Show forest plot | 6 | 5578 | Risk Ratio (M‐H, Random, 95% CI) | 0.98 [0.84, 1.14] |
| Outcome or subgroup title | No. of studies | No. of participants | Statistical method | Effect size |
| 1 AcM ‐ EoI Show forest plot | 17 | 6760 | Risk Ratio (M‐H, Random, 95% CI) | 0.99 [0.82, 1.20] |
| 2 AcM ‐ MF Show forest plot | 20 | 6978 | Risk Ratio (M‐H, Random, 95% CI) | 0.95 [0.82, 1.09] |
| 3 SaE ‐ EoI Show forest plot | 20 | 6794 | Risk Ratio (M‐H, Fixed, 95% CI) | 0.96 [0.81, 1.14] |
| 4 SaE ‐ MF Show forest plot | 23 | 7012 | Risk Ratio (M‐H, Random, 95% CI) | 0.91 [0.80, 1.03] |
| Outcome or subgroup title | No. of studies | No. of participants | Statistical method | Effect size |
| 1 All‐cause mortality ‐ overall Show forest plot | 33 | 8529 | Risk Ratio (M‐H, Random, 95% CI) | 0.94 [0.79, 1.11] |
| 2 All‐cause mortality ‐ bias Show forest plot | 33 | 8529 | Risk Ratio (M‐H, Random, 95% CI) | 0.94 [0.79, 1.11] |
| 2.1 High risk of bias | 33 | 8529 | Risk Ratio (M‐H, Random, 95% CI) | 0.94 [0.79, 1.11] |
| 2.2 Low risk of bias | 0 | 0 | Risk Ratio (M‐H, Random, 95% CI) | 0.0 [0.0, 0.0] |
| 3 All‐cause mortality ‐ medical speciality Show forest plot | 33 | 8529 | Risk Ratio (M‐H, Random, 95% CI) | 0.95 [0.80, 1.12] |
| 3.1 Cardiology | 0 | 0 | Risk Ratio (M‐H, Random, 95% CI) | 0.0 [0.0, 0.0] |
| 3.2 Medical gastroenterology and hepatology | 1 | 36 | Risk Ratio (M‐H, Random, 95% CI) | 0.45 [0.10, 2.01] |
| 3.3 Geriatrics | 9 | 1559 | Risk Ratio (M‐H, Random, 95% CI) | 0.75 [0.56, 0.99] |
| 3.4 Pulmonary disease | 2 | 93 | Risk Ratio (M‐H, Random, 95% CI) | 0.49 [0.16, 1.54] |
| 3.5 Endocrinology | 0 | 0 | Risk Ratio (M‐H, Random, 95% CI) | 0.0 [0.0, 0.0] |
| 3.6 Infectious diseases | 0 | 0 | Risk Ratio (M‐H, Random, 95% CI) | 0.0 [0.0, 0.0] |
| 3.7 Rheumatology | 0 | 0 | Risk Ratio (M‐H, Random, 95% CI) | 0.0 [0.0, 0.0] |
| 3.8 Haematology | 0 | 0 | Risk Ratio (M‐H, Random, 95% CI) | 0.0 [0.0, 0.0] |
| 3.9 Nephrology | 0 | 0 | Risk Ratio (M‐H, Random, 95% CI) | 0.0 [0.0, 0.0] |
| 3.10 Gastroenterologic surgery | 11 | 1267 | Risk Ratio (M‐H, Random, 95% CI) | 1.24 [0.65, 2.38] |
| 3.11 Trauma surgery | 0 | 0 | Risk Ratio (M‐H, Random, 95% CI) | 0.0 [0.0, 0.0] |
| 3.12 Orthopaedics | 4 | 371 | Risk Ratio (M‐H, Random, 95% CI) | 1.69 [0.53, 5.36] |
| 3.13 Plastic, reconstructive and aesthetic surgery | 0 | 0 | Risk Ratio (M‐H, Random, 95% CI) | 0.0 [0.0, 0.0] |
| 3.14 Vascular surgery | 0 | 0 | Risk Ratio (M‐H, Random, 95% CI) | 0.0 [0.0, 0.0] |
| 3.15 Transplant surgery | 1 | 37 | Risk Ratio (M‐H, Random, 95% CI) | 0.35 [0.02, 8.09] |
| 3.16 Urology | 0 | 0 | Risk Ratio (M‐H, Random, 95% CI) | 0.0 [0.0, 0.0] |
| 3.17 Thoracic surgery | 0 | 0 | Risk Ratio (M‐H, Random, 95% CI) | 0.0 [0.0, 0.0] |
| 3.18 Neurological surgery | 0 | 0 | Risk Ratio (M‐H, Random, 95% CI) | 0.0 [0.0, 0.0] |
| 3.19 Oro‐maxillo‐facial surgery | 0 | 0 | Risk Ratio (M‐H, Random, 95% CI) | 0.0 [0.0, 0.0] |
| 3.20 Anaesthesiology | 0 | 0 | Risk Ratio (M‐H, Random, 95% CI) | 0.0 [0.0, 0.0] |
| 3.21 Emergency medicine | 0 | 0 | Risk Ratio (M‐H, Random, 95% CI) | 0.0 [0.0, 0.0] |
| 3.22 Psychiatry | 0 | 0 | Risk Ratio (M‐H, Random, 95% CI) | 0.0 [0.0, 0.0] |
| 3.23 Neurology | 3 | 4092 | Risk Ratio (M‐H, Random, 95% CI) | 0.99 [0.76, 1.27] |
| 3.24 Oncology | 0 | 0 | Risk Ratio (M‐H, Random, 95% CI) | 0.0 [0.0, 0.0] |
| 3.25 Dermatology | 0 | 0 | Risk Ratio (M‐H, Random, 95% CI) | 0.0 [0.0, 0.0] |
| 3.26 Gynaecology | 0 | 0 | Risk Ratio (M‐H, Random, 95% CI) | 0.0 [0.0, 0.0] |
| 3.27 Mixed | 2 | 1074 | Risk Ratio (M‐H, Random, 95% CI) | 1.24 [0.73, 2.12] |
| 4 All‐cause mortality ‐ based on adequacy of the amount of calories Show forest plot | 33 | 8529 | Risk Ratio (M‐H, Random, 95% CI) | 0.94 [0.79, 1.11] |
| 4.1 Clearly adequate in experimental group and clearly inadequate in control group | 4 | 260 | Risk Ratio (M‐H, Random, 95% CI) | 1.08 [0.34, 3.47] |
| 4.2 Inadequate in the experimental group or adequate in the control group | 12 | 5540 | Risk Ratio (M‐H, Random, 95% CI) | 0.94 [0.76, 1.17] |
| 4.3 Experimental group is overfed | 2 | 69 | Risk Ratio (M‐H, Random, 95% CI) | 0.53 [0.14, 1.98] |
| 4.4 Unclear intake in experimental group or control group | 15 | 2660 | Risk Ratio (M‐H, Random, 95% CI) | 0.93 [0.62, 1.38] |
| 5 All‐cause mortality ‐ different screening tools Show forest plot | 33 | 8529 | Risk Ratio (M‐H, Random, 95% CI) | 0.94 [0.79, 1.11] |
| 5.1 NRS 2002 | 0 | 0 | Risk Ratio (M‐H, Random, 95% CI) | 0.0 [0.0, 0.0] |
| 5.2 MUST | 0 | 0 | Risk Ratio (M‐H, Random, 95% CI) | 0.0 [0.0, 0.0] |
| 5.3 MNA | 2 | 117 | Risk Ratio (M‐H, Random, 95% CI) | 0.61 [0.12, 3.18] |
| 5.4 SGA | 1 | 525 | Risk Ratio (M‐H, Random, 95% CI) | 1.51 [0.99, 2.31] |
| 5.5 Other means | 30 | 7887 | Risk Ratio (M‐H, Random, 95% CI) | 0.87 [0.73, 1.04] |
| 6 All‐cause mortality ‐ participants characterised as 'at nutritional risk' due to one of the following conditions Show forest plot | 33 | 8529 | Risk Ratio (M‐H, Random, 95% CI) | 0.94 [0.79, 1.11] |
| 6.1 Major surgery | 13 | 1364 | Risk Ratio (M‐H, Random, 95% CI) | 0.92 [0.49, 1.72] |
| 6.2 Stroke | 2 | 4063 | Risk Ratio (M‐H, Random, 95% CI) | 0.96 [0.74, 1.24] |
| 6.3 ICU participants including trauma | 0 | 0 | Risk Ratio (M‐H, Random, 95% CI) | 0.0 [0.0, 0.0] |
| 6.4 Frail elderly participants with less severe conditions known to increase protein requirements | 9 | 953 | Risk Ratio (M‐H, Random, 95% CI) | 0.85 [0.55, 1.30] |
| 6.5 Participants do not fall into one of the categories above | 9 | 2149 | Risk Ratio (M‐H, Random, 95% CI) | 0.93 [0.62, 1.39] |
| 7 All‐cause mortality ‐ participants characterised as 'at nutritional risk' due to one of the following criteria Show forest plot | 33 | 8529 | Risk Ratio (M‐H, Random, 95% CI) | 0.94 [0.79, 1.11] |
| 7.1 BMI less than 20.5 kg/m2 | 1 | 37 | Risk Ratio (M‐H, Random, 95% CI) | 0.35 [0.02, 8.09] |
| 7.2 Weight loss of at least 5% during the last three months | 0 | 0 | Risk Ratio (M‐H, Random, 95% CI) | 0.0 [0.0, 0.0] |
| 7.3 Weight loss of at least 10% during the last six months | 0 | 0 | Risk Ratio (M‐H, Random, 95% CI) | 0.0 [0.0, 0.0] |
| 7.4 Insufficient food intake during the last week (50% of requirements or less) | 0 | 0 | Risk Ratio (M‐H, Random, 95% CI) | 0.0 [0.0, 0.0] |
| 7.5 Participants characterised as 'at nutritional risk' by other means | 32 | 8492 | Risk Ratio (M‐H, Random, 95% CI) | 0.94 [0.79, 1.12] |
| 8 All‐cause mortality ‐ participants characterised as 'at nutritional risk' due to biomarkers or anthropometrics Show forest plot | 33 | 8529 | Risk Ratio (M‐H, Random, 95% CI) | 0.94 [0.79, 1.11] |
| 8.1 Biomarkers | 1 | 60 | Risk Ratio (M‐H, Random, 95% CI) | 0.43 [0.12, 1.50] |
| 8.2 Anthropometric measures | 6 | 1111 | Risk Ratio (M‐H, Random, 95% CI) | 0.78 [0.52, 1.16] |
| 8.3 Characterised by other means | 26 | 7358 | Risk Ratio (M‐H, Random, 95% CI) | 1.00 [0.80, 1.25] |
| 9 All‐cause mortality ‐ randomisation year Show forest plot | 33 | 8529 | Risk Ratio (M‐H, Random, 95% CI) | 0.94 [0.79, 1.11] |
| 9.1 Before 1960 | 0 | 0 | Risk Ratio (M‐H, Random, 95% CI) | 0.0 [0.0, 0.0] |
| 9.2 1960‐1979 | 1 | 60 | Risk Ratio (M‐H, Random, 95% CI) | 0.76 [0.24, 2.43] |
| 9.3 1980‐1999 | 18 | 7002 | Risk Ratio (M‐H, Random, 95% CI) | 0.87 [0.72, 1.04] |
| 9.4 After 1999 | 14 | 1467 | Risk Ratio (M‐H, Random, 95% CI) | 1.11 [0.64, 1.92] |
| 10 All‐cause mortality ‐ trials where the intervention lasts fewer than three days compared with trials where the intervention lasts three days or more Show forest plot | 33 | 8529 | Risk Ratio (M‐H, Random, 95% CI) | 0.94 [0.79, 1.11] |
| 10.1 Three days or more | 26 | 7797 | Risk Ratio (M‐H, Random, 95% CI) | 0.87 [0.74, 1.04] |
| 10.2 Less than three days | 6 | 207 | Risk Ratio (M‐H, Random, 95% CI) | 0.18 [0.01, 3.91] |
| 10.3 Unknown | 1 | 525 | Risk Ratio (M‐H, Random, 95% CI) | 1.51 [0.99, 2.31] |
| 11 All‐cause mortality ‐ 'best‐worst case' scenario Show forest plot | 33 | 8793 | Risk Ratio (M‐H, Random, 95% CI) | 0.72 [0.55, 0.95] |
| 12 All‐cause mortality ‐ 'worst‐best case' scenario Show forest plot | 33 | 8793 | Risk Ratio (M‐H, Random, 95% CI) | 1.33 [0.95, 1.86] |
| 13 All‐cause mortality co‐interventions Show forest plot | 33 | 8529 | Risk Ratio (M‐H, Random, 95% CI) | 0.94 [0.79, 1.11] |
| 13.1 received nutrition support as co‐intervention | 1 | 60 | Risk Ratio (M‐H, Random, 95% CI) | 0.43 [0.12, 1.50] |
| 13.2 did not receive nutrition support as co‐intervention | 32 | 8469 | Risk Ratio (M‐H, Random, 95% CI) | 0.95 [0.81, 1.12] |
| 13.3 delayed versus early nutrition support | 0 | 0 | Risk Ratio (M‐H, Random, 95% CI) | 0.0 [0.0, 0.0] |
| Outcome or subgroup title | No. of studies | No. of participants | Statistical method | Effect size |
| 1 All‐cause mortality ‐ overall Show forest plot | 32 | 8501 | Risk Ratio (M‐H, Random, 95% CI) | 0.94 [0.77, 1.15] |
| 2 All‐cause mortality ‐ bias Show forest plot | 32 | 8501 | Risk Ratio (M‐H, Random, 95% CI) | 0.94 [0.77, 1.15] |
| 2.1 High risk of bias | 32 | 8501 | Risk Ratio (M‐H, Random, 95% CI) | 0.94 [0.77, 1.15] |
| 2.2 Low risk of bias | 0 | 0 | Risk Ratio (M‐H, Random, 95% CI) | 0.0 [0.0, 0.0] |
| 3 All‐cause mortality ‐ medical speciality Show forest plot | 32 | 8501 | Risk Ratio (M‐H, Random, 95% CI) | 0.94 [0.77, 1.15] |
| 3.1 Cardiology | 0 | 0 | Risk Ratio (M‐H, Random, 95% CI) | 0.0 [0.0, 0.0] |
| 3.2 Medical gastroenterology and hepatology | 1 | 36 | Risk Ratio (M‐H, Random, 95% CI) | 0.45 [0.10, 2.01] |
| 3.3 Geriatrics | 9 | 1552 | Risk Ratio (M‐H, Random, 95% CI) | 0.81 [0.55, 1.19] |
| 3.4 Pulmonary disease | 2 | 93 | Risk Ratio (M‐H, Random, 95% CI) | 0.49 [0.16, 1.54] |
| 3.5 Endocrinology | 0 | 0 | Risk Ratio (M‐H, Random, 95% CI) | 0.0 [0.0, 0.0] |
| 3.6 Infectious diseases | 0 | 0 | Risk Ratio (M‐H, Random, 95% CI) | 0.0 [0.0, 0.0] |
| 3.7 Rheumatology | 0 | 0 | Risk Ratio (M‐H, Random, 95% CI) | 0.0 [0.0, 0.0] |
| 3.8 Haematology | 0 | 0 | Risk Ratio (M‐H, Random, 95% CI) | 0.0 [0.0, 0.0] |
| 3.9 Nephrology | 0 | 0 | Risk Ratio (M‐H, Random, 95% CI) | 0.0 [0.0, 0.0] |
| 3.10 Gastroenterologic surgery | 10 | 1267 | Risk Ratio (M‐H, Random, 95% CI) | 1.14 [0.61, 2.12] |
| 3.11 Trauma surgery | 0 | 0 | Risk Ratio (M‐H, Random, 95% CI) | 0.0 [0.0, 0.0] |
| 3.12 Ortopaedics | 4 | 361 | Risk Ratio (M‐H, Random, 95% CI) | 1.80 [0.92, 3.52] |
| 3.13 Plastic, reconstructive, and aesthetic surgery | 0 | 0 | Risk Ratio (M‐H, Random, 95% CI) | 0.0 [0.0, 0.0] |
| 3.14 Vascular surgery | 0 | 0 | Risk Ratio (M‐H, Random, 95% CI) | 0.0 [0.0, 0.0] |
| 3.15 Transplant surgery | 1 | 37 | Risk Ratio (M‐H, Random, 95% CI) | 0.35 [0.02, 8.09] |
| 3.16 Urology | 0 | 0 | Risk Ratio (M‐H, Random, 95% CI) | 0.0 [0.0, 0.0] |
| 3.17 Thoracic surgery | 0 | 0 | Risk Ratio (M‐H, Random, 95% CI) | 0.0 [0.0, 0.0] |
| 3.18 Neurological surgery | 0 | 0 | Risk Ratio (M‐H, Random, 95% CI) | 0.0 [0.0, 0.0] |
| 3.19 Oro‐maxillo‐facial surgery | 0 | 0 | Risk Ratio (M‐H, Random, 95% CI) | 0.0 [0.0, 0.0] |
| 3.20 Anaesthesiology | 0 | 0 | Risk Ratio (M‐H, Random, 95% CI) | 0.0 [0.0, 0.0] |
| 3.21 Emergency medicine | 0 | 0 | Risk Ratio (M‐H, Random, 95% CI) | 0.0 [0.0, 0.0] |
| 3.22 Psychiatry | 0 | 0 | Risk Ratio (M‐H, Random, 95% CI) | 0.0 [0.0, 0.0] |
| 3.23 Neurology | 3 | 4081 | Risk Ratio (M‐H, Random, 95% CI) | 0.65 [0.22, 1.93] |
| 3.24 Oncology | 0 | 0 | Risk Ratio (M‐H, Random, 95% CI) | 0.0 [0.0, 0.0] |
| 3.25 Dermatology | 0 | 0 | Risk Ratio (M‐H, Random, 95% CI) | 0.0 [0.0, 0.0] |
| 3.26 Gynaecology | 0 | 0 | Risk Ratio (M‐H, Random, 95% CI) | 0.0 [0.0, 0.0] |
| 3.27 Mixed | 2 | 1074 | Risk Ratio (M‐H, Random, 95% CI) | 1.24 [0.73, 2.12] |
| 4 All‐cause mortality ‐ based on adequacy of the amount of calories Show forest plot | 32 | 8501 | Risk Ratio (M‐H, Random, 95% CI) | 0.94 [0.77, 1.15] |
| 4.1 Clearly adequate in intervention and clearly inadequate in control | 4 | 260 | Risk Ratio (M‐H, Random, 95% CI) | 0.80 [0.17, 3.70] |
| 4.2 Inadequate in the experimental or adequate in the control | 12 | 5512 | Risk Ratio (M‐H, Random, 95% CI) | 0.94 [0.76, 1.17] |
| 4.3 Experimental group is overfed | 2 | 69 | Risk Ratio (M‐H, Random, 95% CI) | 0.53 [0.14, 1.98] |
| 4.4 Unclear intake in control or experimental | 14 | 2660 | Risk Ratio (M‐H, Random, 95% CI) | 0.95 [0.65, 1.38] |
| 5 All‐cause mortality ‐ different screening tools Show forest plot | 32 | 8501 | Risk Ratio (M‐H, Random, 95% CI) | 0.94 [0.77, 1.15] |
| 5.1 NRS 2002 | 0 | 0 | Risk Ratio (M‐H, Random, 95% CI) | 0.0 [0.0, 0.0] |
| 5.2 MUST | 0 | 0 | Risk Ratio (M‐H, Random, 95% CI) | 0.0 [0.0, 0.0] |
| 5.3 MNA | 2 | 117 | Risk Ratio (M‐H, Random, 95% CI) | 0.61 [0.12, 3.18] |
| 5.4 SGA | 1 | 525 | Risk Ratio (M‐H, Random, 95% CI) | 1.51 [0.99, 2.31] |
| 5.5 Other means | 29 | 7859 | Risk Ratio (M‐H, Random, 95% CI) | 0.89 [0.73, 1.09] |
| 6 All‐cause mortality ‐ participants characterised as 'at nutritional risk' due to one of the following conditions Show forest plot | 32 | 8501 | Risk Ratio (M‐H, Random, 95% CI) | 0.94 [0.77, 1.15] |
| 6.1 Major surgery | 11 | 1304 | Risk Ratio (M‐H, Random, 95% CI) | 1.09 [0.59, 2.00] |
| 6.2 Stroke | 2 | 4052 | Risk Ratio (M‐H, Random, 95% CI) | 0.65 [0.22, 1.93] |
| 6.3 ICU participants including trauma | 0 | 0 | Risk Ratio (M‐H, Random, 95% CI) | 0.0 [0.0, 0.0] |
| 6.4 Frail elderly participants with less severe conditions known to increase protein requirements | 10 | 996 | Risk Ratio (M‐H, Random, 95% CI) | 0.87 [0.57, 1.34] |
| 6.5 Participants do not fall into one of the categories above | 9 | 2149 | Risk Ratio (M‐H, Random, 95% CI) | 0.96 [0.64, 1.46] |
| 7 All‐cause mortality ‐ participants characterised as 'at nutritional risk' due to one of the following criteria Show forest plot | 32 | 8501 | Risk Ratio (M‐H, Random, 95% CI) | 0.94 [0.77, 1.15] |
| 7.1 BMI less than 20.5 kg/m2 | 1 | 37 | Risk Ratio (M‐H, Random, 95% CI) | 0.35 [0.02, 8.09] |
| 7.2 Weight loss of at least 5% during the last three months | 0 | 0 | Risk Ratio (M‐H, Random, 95% CI) | 0.0 [0.0, 0.0] |
| 7.3 Weight loss of at least 10% during the last six months | 0 | 0 | Risk Ratio (M‐H, Random, 95% CI) | 0.0 [0.0, 0.0] |
| 7.4 Insufficient food intake during the last week (50% of requirements or less) | 0 | 0 | Risk Ratio (M‐H, Random, 95% CI) | 0.0 [0.0, 0.0] |
| 7.5 Participants characterised as 'at nutritional risk' by other means | 31 | 8464 | Risk Ratio (M‐H, Random, 95% CI) | 0.94 [0.77, 1.16] |
| 8 All‐cause mortality ‐ participants characterised as 'at nutritional risk' due to biomarkers or anthropometrics Show forest plot | 32 | 8501 | Risk Ratio (M‐H, Random, 95% CI) | 0.94 [0.77, 1.15] |
| 8.1 Biomarkers | 1 | 60 | Risk Ratio (M‐H, Random, 95% CI) | 0.43 [0.12, 1.50] |
| 8.2 Anthropometric measures | 6 | 1111 | Risk Ratio (M‐H, Random, 95% CI) | 0.78 [0.52, 1.16] |
| 8.3 Both anthropometrics and biomarkers | 0 | 0 | Risk Ratio (M‐H, Random, 95% CI) | 0.0 [0.0, 0.0] |
| 8.4 Characterised by other means | 25 | 7330 | Risk Ratio (M‐H, Random, 95% CI) | 0.99 [0.77, 1.26] |
| 9 All‐cause mortality ‐ randomisation year Show forest plot | 32 | 8501 | Risk Ratio (M‐H, Random, 95% CI) | 0.94 [0.77, 1.15] |
| 9.1 Before 1960 | 0 | 0 | Risk Ratio (M‐H, Random, 95% CI) | 0.0 [0.0, 0.0] |
| 9.2 1960 to 1979 | 1 | 60 | Risk Ratio (M‐H, Random, 95% CI) | 0.76 [0.24, 2.43] |
| 9.3 1980 to 1999 | 18 | 6974 | Risk Ratio (M‐H, Random, 95% CI) | 0.86 [0.71, 1.05] |
| 9.4 After 1999 | 13 | 1467 | Risk Ratio (M‐H, Random, 95% CI) | 1.19 [0.77, 1.83] |
| 10 All‐cause mortality ‐ trials where the intervention lasts fewer than three days compared with trials where the intervention lasts three days or more Show forest plot | 32 | 8501 | Risk Ratio (M‐H, Random, 95% CI) | 0.94 [0.77, 1.15] |
| 10.1 Three days or more | 31 | 8462 | Risk Ratio (M‐H, Random, 95% CI) | 0.94 [0.77, 1.15] |
| 10.2 Less than three days | 1 | 39 | Risk Ratio (M‐H, Random, 95% CI) | 0.0 [0.0, 0.0] |
| 10.3 Unknown | 0 | 0 | Risk Ratio (M‐H, Random, 95% CI) | 0.0 [0.0, 0.0] |
| 11 All‐cause mortality ‐ 'best‐worst case' scenario Show forest plot | 32 | 8793 | Risk Ratio (M‐H, Random, 95% CI) | 0.70 [0.54, 0.91] |
| 12 All‐cause mortality ‐ 'worst‐best case' scenario Show forest plot | 32 | 8793 | Risk Ratio (M‐H, Random, 95% CI) | 1.27 [0.93, 1.73] |
| 13 All‐cause mortality co‐interventions Show forest plot | 131 | 22435 | Risk Ratio (M‐H, Fixed, 95% CI) | 0.91 [0.86, 0.98] |
| 13.1 received nutrition support as co‐intervention | 8 | 5185 | Risk Ratio (M‐H, Fixed, 95% CI) | 0.93 [0.80, 1.08] |
| 13.2 did not receive nutrition support as co‐intervention | 120 | 17017 | Risk Ratio (M‐H, Fixed, 95% CI) | 0.91 [0.84, 0.98] |
| 13.3 delayed versus early nutrition support | 3 | 233 | Risk Ratio (M‐H, Fixed, 95% CI) | 0.99 [0.53, 1.83] |
| Outcome or subgroup title | No. of studies | No. of participants | Statistical method | Effect size |
| 1 Serious adverse events ‐ overall Show forest plot | 33 | 8569 | Risk Ratio (M‐H, Random, 95% CI) | 0.92 [0.79, 1.06] |
| 2 Serious adverse events ‐ bias Show forest plot | 33 | 8569 | Risk Ratio (M‐H, Random, 95% CI) | 0.92 [0.79, 1.06] |
| 2.1 High risk of bias | 33 | 8569 | Risk Ratio (M‐H, Random, 95% CI) | 0.92 [0.79, 1.06] |
| 2.2 Low risk of bias | 0 | 0 | Risk Ratio (M‐H, Random, 95% CI) | 0.0 [0.0, 0.0] |
| 3 Serious adverse events ‐ by medical specialty Show forest plot | 33 | 8569 | Risk Ratio (M‐H, Random, 95% CI) | 0.92 [0.79, 1.06] |
| 3.1 Cardiology | 0 | 0 | Risk Ratio (M‐H, Random, 95% CI) | 0.0 [0.0, 0.0] |
| 3.2 Medical gastroenterology and hepatology | 1 | 36 | Risk Ratio (M‐H, Random, 95% CI) | 0.45 [0.10, 2.01] |
| 3.3 Geriatrics | 10 | 1609 | Risk Ratio (M‐H, Random, 95% CI) | 0.74 [0.56, 0.97] |
| 3.4 Pulmonary disease | 2 | 93 | Risk Ratio (M‐H, Random, 95% CI) | 0.49 [0.16, 1.54] |
| 3.5 Endocrinology | 0 | 0 | Risk Ratio (M‐H, Random, 95% CI) | 0.0 [0.0, 0.0] |
| 3.6 Infectious diseases | 0 | 0 | Risk Ratio (M‐H, Random, 95% CI) | 0.0 [0.0, 0.0] |
| 3.7 Rheumatology | 0 | 0 | Risk Ratio (M‐H, Random, 95% CI) | 0.0 [0.0, 0.0] |
| 3.8 Haematology | 0 | 0 | Risk Ratio (M‐H, Random, 95% CI) | 0.0 [0.0, 0.0] |
| 3.9 Nephrology | 0 | 0 | Risk Ratio (M‐H, Random, 95% CI) | 0.0 [0.0, 0.0] |
| 3.10 Gastroenterologic surgery | 10 | 1253 | Risk Ratio (M‐H, Random, 95% CI) | 0.91 [0.66, 1.25] |
| 3.11 Trauma surgery | 0 | 0 | Risk Ratio (M‐H, Random, 95% CI) | 0.0 [0.0, 0.0] |
| 3.12 Ortopaedics | 4 | 371 | Risk Ratio (M‐H, Random, 95% CI) | 1.69 [0.53, 5.36] |
| 3.13 Plastic, reconstructive, and aesthetic surgery | 0 | 0 | Risk Ratio (M‐H, Random, 95% CI) | 0.0 [0.0, 0.0] |
| 3.14 Vascular surgery | 0 | 0 | Risk Ratio (M‐H, Random, 95% CI) | 0.0 [0.0, 0.0] |
| 3.15 Transplant surgery | 1 | 37 | Risk Ratio (M‐H, Random, 95% CI) | 0.35 [0.02, 8.09] |
| 3.16 Urology | 0 | 0 | Risk Ratio (M‐H, Random, 95% CI) | 0.0 [0.0, 0.0] |
| 3.17 Thoracic surgery | 0 | 0 | Risk Ratio (M‐H, Random, 95% CI) | 0.0 [0.0, 0.0] |
| 3.18 Neurological surgery | 0 | 0 | Risk Ratio (M‐H, Random, 95% CI) | 0.0 [0.0, 0.0] |
| 3.19 Oro‐maxillo‐facial surgery | 0 | 0 | Risk Ratio (M‐H, Random, 95% CI) | 0.0 [0.0, 0.0] |
| 3.20 Anaesthesiology | 0 | 0 | Risk Ratio (M‐H, Random, 95% CI) | 0.0 [0.0, 0.0] |
| 3.21 Emergency medicine | 0 | 0 | Risk Ratio (M‐H, Random, 95% CI) | 0.0 [0.0, 0.0] |
| 3.22 Psychiatry | 0 | 0 | Risk Ratio (M‐H, Random, 95% CI) | 0.0 [0.0, 0.0] |
| 3.23 Neurology | 3 | 4092 | Risk Ratio (M‐H, Random, 95% CI) | 0.96 [0.74, 1.24] |
| 3.24 Oncology | 0 | 0 | Risk Ratio (M‐H, Random, 95% CI) | 0.0 [0.0, 0.0] |
| 3.25 Dermatology | 0 | 0 | Risk Ratio (M‐H, Random, 95% CI) | 0.0 [0.0, 0.0] |
| 3.26 Gynaecology | 0 | 0 | Risk Ratio (M‐H, Random, 95% CI) | 0.0 [0.0, 0.0] |
| 3.27 Mixed | 2 | 1078 | Risk Ratio (M‐H, Random, 95% CI) | 1.24 [0.73, 2.12] |
| 4 Serious adverse events ‐ based on adequacy of the amount of calories Show forest plot | 33 | 8569 | Risk Ratio (M‐H, Random, 95% CI) | 0.92 [0.79, 1.06] |
| 4.1 Clearly adequate in intervention and clearly inadequate in control | 4 | 246 | Risk Ratio (M‐H, Random, 95% CI) | 0.99 [0.33, 3.02] |
| 4.2 Inadequate in the experimental or adequate in the control | 13 | 5590 | Risk Ratio (M‐H, Random, 95% CI) | 0.91 [0.76, 1.10] |
| 4.3 Experimental group is overfed | 2 | 69 | Risk Ratio (M‐H, Random, 95% CI) | 0.53 [0.14, 1.98] |
| 4.4 Unclear intake in control or experimental | 14 | 2664 | Risk Ratio (M‐H, Random, 95% CI) | 0.92 [0.63, 1.34] |
| 5 Serious adverse events ‐ different screening tools Show forest plot | 33 | 8569 | Risk Ratio (M‐H, Random, 95% CI) | 0.92 [0.79, 1.06] |
| 5.1 NRS 2002 | 0 | 0 | Risk Ratio (M‐H, Random, 95% CI) | 0.0 [0.0, 0.0] |
| 5.2 MUST | 0 | 0 | Risk Ratio (M‐H, Random, 95% CI) | 0.0 [0.0, 0.0] |
| 5.3 MNA | 2 | 117 | Risk Ratio (M‐H, Random, 95% CI) | 0.61 [0.12, 3.18] |
| 5.4 SGA | 1 | 529 | Risk Ratio (M‐H, Random, 95% CI) | 1.51 [0.99, 2.31] |
| 5.5 Other means | 30 | 7923 | Risk Ratio (M‐H, Random, 95% CI) | 0.86 [0.74, 1.01] |
| 6 Serious adverse events ‐ participants characterised as 'at nutritional risk' due to one of the following conditions Show forest plot | 33 | 8569 | Risk Ratio (M‐H, Random, 95% CI) | 0.92 [0.79, 1.06] |
| 6.1 Major surgery | 10 | 612 | Risk Ratio (M‐H, Random, 95% CI) | 0.67 [0.22, 2.08] |
| 6.2 Stroke | 2 | 4063 | Risk Ratio (M‐H, Random, 95% CI) | 0.96 [0.74, 1.24] |
| 6.3 ICU participants including trauma | 0 | 0 | Risk Ratio (M‐H, Random, 95% CI) | 0.0 [0.0, 0.0] |
| 6.4 Frail elderly participants with less severe conditions known to increase protein requirements | 11 | 1063 | Risk Ratio (M‐H, Random, 95% CI) | 0.77 [0.52, 1.15] |
| 6.5 Participants do not fall into one of the categories above | 10 | 2831 | Risk Ratio (M‐H, Random, 95% CI) | 0.94 [0.70, 1.26] |
| 7 Serious adverse events ‐ participants characterised as 'at nutritional risk' due to one of the following criteria Show forest plot | 33 | 8569 | Risk Ratio (M‐H, Random, 95% CI) | 0.92 [0.79, 1.06] |
| 7.1 BMI less than 20.5 kg/m2 | 1 | 37 | Risk Ratio (M‐H, Random, 95% CI) | 0.35 [0.02, 8.09] |
| 7.2 Weight loss of at least 5% during the last three months | 0 | 0 | Risk Ratio (M‐H, Random, 95% CI) | 0.0 [0.0, 0.0] |
| 7.3 Weight loss of at least 10% during the last six months | 0 | 0 | Risk Ratio (M‐H, Random, 95% CI) | 0.0 [0.0, 0.0] |
| 7.4 Insufficient food intake during the last week (50% of requirements or less) | 0 | 0 | Risk Ratio (M‐H, Random, 95% CI) | 0.0 [0.0, 0.0] |
| 7.5 Participants characterised as 'at nutritional risk' by other means | 32 | 8532 | Risk Ratio (M‐H, Random, 95% CI) | 0.92 [0.79, 1.06] |
| 8 Serious adverse events ‐ participants characterised as 'at nutritional risk' due to biomarkers or anthropometrics Show forest plot | 33 | 8569 | Risk Ratio (M‐H, Random, 95% CI) | 0.92 [0.79, 1.06] |
| 8.1 Biomarkers | 1 | 60 | Risk Ratio (M‐H, Random, 95% CI) | 0.43 [0.12, 1.50] |
| 8.2 Anthropometric measures | 6 | 1111 | Risk Ratio (M‐H, Random, 95% CI) | 0.78 [0.52, 1.16] |
| 8.3 Mixed | 0 | 0 | Risk Ratio (M‐H, Random, 95% CI) | 0.0 [0.0, 0.0] |
| 8.4 Characterised by other means | 26 | 7398 | Risk Ratio (M‐H, Random, 95% CI) | 0.95 [0.81, 1.12] |
| 9 Serious adverse events ‐ randomisation year Show forest plot | 33 | 8569 | Risk Ratio (M‐H, Random, 95% CI) | 0.92 [0.79, 1.06] |
| 9.1 Before 1960 | 0 | 0 | Risk Ratio (M‐H, Random, 95% CI) | 0.0 [0.0, 0.0] |
| 9.2 1960 to 1979 | 1 | 60 | Risk Ratio (M‐H, Random, 95% CI) | 0.76 [0.24, 2.43] |
| 9.3 1980 to 1999 | 18 | 6988 | Risk Ratio (M‐H, Random, 95% CI) | 0.86 [0.73, 1.01] |
| 9.4 After 1999 | 14 | 1521 | Risk Ratio (M‐H, Random, 95% CI) | 1.05 [0.61, 1.82] |
| 10 Serious adverse events ‐ trials where the intervention lasts fewer than three days compared with trials where the intervention lasts three days or more Show forest plot | 33 | 8569 | Risk Ratio (M‐H, Random, 95% CI) | 0.92 [0.79, 1.06] |
| 10.1 Three days or more | 31 | 8480 | Risk Ratio (M‐H, Random, 95% CI) | 0.92 [0.80, 1.06] |
| 10.2 Less than three days | 1 | 39 | Risk Ratio (M‐H, Random, 95% CI) | 0.0 [0.0, 0.0] |
| 10.3 Unknown | 1 | 50 | Risk Ratio (M‐H, Random, 95% CI) | 0.25 [0.01, 5.00] |
| 11 Serious adverse events ‐ 'best‐worst case' scenario Show forest plot | 33 | 8844 | Risk Ratio (M‐H, Random, 95% CI) | 0.67 [0.52, 0.86] |
| 12 Serious adverse events ‐ 'worst‐best case' scenario Show forest plot | 33 | 8844 | Risk Ratio (M‐H, Random, 95% CI) | 1.27 [0.92, 1.75] |
| 13 Serious adverse events co‐interventions Show forest plot | 134 | 21960 | Risk Ratio (M‐H, Fixed, 95% CI) | 0.91 [0.84, 0.99] |
| 13.1 received nutrition support as co‐intervention | 8 | 5178 | Risk Ratio (M‐H, Fixed, 95% CI) | 0.96 [0.79, 1.17] |
| 13.2 did not receive nutrition support as co‐intervention | 119 | 16359 | Risk Ratio (M‐H, Fixed, 95% CI) | 0.90 [0.83, 0.99] |
| 13.3 delayed versus early nutrition support | 7 | 423 | Risk Ratio (M‐H, Fixed, 95% CI) | 0.89 [0.51, 1.57] |
| Outcome or subgroup title | No. of studies | No. of participants | Statistical method | Effect size |
| 1 Serious adverse events ‐ overall Show forest plot | 33 | 8541 | Risk Ratio (M‐H, Random, 95% CI) | 0.89 [0.74, 1.07] |
| 2 Serious adverse events ‐ bias Show forest plot | 33 | 8541 | Risk Ratio (M‐H, Random, 95% CI) | 0.89 [0.74, 1.07] |
| 2.1 High risk of bias | 33 | 8541 | Risk Ratio (M‐H, Random, 95% CI) | 0.89 [0.74, 1.07] |
| 2.2 Low risk of bias | 0 | 0 | Risk Ratio (M‐H, Random, 95% CI) | 0.0 [0.0, 0.0] |
| 3 Serious adverse events ‐ by medical speciality Show forest plot | 33 | 8541 | Risk Ratio (M‐H, Random, 95% CI) | 0.89 [0.74, 1.07] |
| 3.1 Cardiology | 0 | 0 | Risk Ratio (M‐H, Random, 95% CI) | 0.0 [0.0, 0.0] |
| 3.2 Medical gastroenterology and hepatology | 1 | 36 | Risk Ratio (M‐H, Random, 95% CI) | 0.45 [0.10, 2.01] |
| 3.3 Geriatrics | 10 | 1602 | Risk Ratio (M‐H, Random, 95% CI) | 0.80 [0.55, 1.15] |
| 3.4 Pulmonary disease | 2 | 93 | Risk Ratio (M‐H, Random, 95% CI) | 0.49 [0.16, 1.54] |
| 3.5 Endocrinology | 0 | 0 | Risk Ratio (M‐H, Random, 95% CI) | 0.0 [0.0, 0.0] |
| 3.6 Infectious diseases | 0 | 0 | Risk Ratio (M‐H, Random, 95% CI) | 0.0 [0.0, 0.0] |
| 3.7 Rheumatology | 0 | 0 | Risk Ratio (M‐H, Random, 95% CI) | 0.0 [0.0, 0.0] |
| 3.8 Haematology | 0 | 0 | Risk Ratio (M‐H, Random, 95% CI) | 0.0 [0.0, 0.0] |
| 3.9 Nephrology | 0 | 0 | Risk Ratio (M‐H, Random, 95% CI) | 0.0 [0.0, 0.0] |
| 3.10 Gastroenterologic surgery | 10 | 1253 | Risk Ratio (M‐H, Random, 95% CI) | 0.83 [0.61, 1.12] |
| 3.11 Trauma surgery | 0 | 0 | Risk Ratio (M‐H, Random, 95% CI) | 0.0 [0.0, 0.0] |
| 3.12 Ortopaedics | 4 | 361 | Risk Ratio (M‐H, Random, 95% CI) | 1.80 [0.92, 3.52] |
| 3.13 Plastic, reconstructive, and aesthetic surgery | 0 | 0 | Risk Ratio (M‐H, Random, 95% CI) | 0.0 [0.0, 0.0] |
| 3.14 Vascular surgery | 0 | 0 | Risk Ratio (M‐H, Random, 95% CI) | 0.0 [0.0, 0.0] |
| 3.15 Transplant surgery | 1 | 37 | Risk Ratio (M‐H, Random, 95% CI) | 0.35 [0.02, 8.09] |
| 3.16 Urology | 0 | 0 | Risk Ratio (M‐H, Random, 95% CI) | 0.0 [0.0, 0.0] |
| 3.17 Thoracic surgery | 0 | 0 | Risk Ratio (M‐H, Random, 95% CI) | 0.0 [0.0, 0.0] |
| 3.18 Neurological surgery | 0 | 0 | Risk Ratio (M‐H, Random, 95% CI) | 0.0 [0.0, 0.0] |
| 3.19 Oro‐maxillo‐facial surgery | 0 | 0 | Risk Ratio (M‐H, Random, 95% CI) | 0.0 [0.0, 0.0] |
| 3.20 Anaesthesiology | 0 | 0 | Risk Ratio (M‐H, Random, 95% CI) | 0.0 [0.0, 0.0] |
| 3.21 Emergency medicine | 0 | 0 | Risk Ratio (M‐H, Random, 95% CI) | 0.0 [0.0, 0.0] |
| 3.22 Psychiatry | 0 | 0 | Risk Ratio (M‐H, Random, 95% CI) | 0.0 [0.0, 0.0] |
| 3.23 Neurology | 3 | 4081 | Risk Ratio (M‐H, Random, 95% CI) | 0.65 [0.22, 1.93] |
| 3.24 Oncology | 0 | 0 | Risk Ratio (M‐H, Random, 95% CI) | 0.0 [0.0, 0.0] |
| 3.25 Dermatology | 0 | 0 | Risk Ratio (M‐H, Random, 95% CI) | 0.0 [0.0, 0.0] |
| 3.26 Gynaecology | 0 | 0 | Risk Ratio (M‐H, Random, 95% CI) | 0.0 [0.0, 0.0] |
| 3.27 Mixed | 2 | 1078 | Risk Ratio (M‐H, Random, 95% CI) | 1.24 [0.73, 2.12] |
| 4 Serious adverse events ‐ based on adequacy of the amount of calories Show forest plot | 33 | 8541 | Risk Ratio (M‐H, Random, 95% CI) | 0.89 [0.74, 1.07] |
| 4.1 Clearly adequate in intervention and clearly inadequate in control | 4 | 246 | Risk Ratio (M‐H, Random, 95% CI) | 0.64 [0.20, 2.00] |
| 4.2 Inadequate in the experimental or adequate in the control | 13 | 5562 | Risk Ratio (M‐H, Random, 95% CI) | 0.93 [0.81, 1.06] |
| 4.3 Experimental group is overfed | 2 | 69 | Risk Ratio (M‐H, Random, 95% CI) | 0.53 [0.14, 1.98] |
| 4.4 Unclear intake in control or experimental | 14 | 2664 | Risk Ratio (M‐H, Random, 95% CI) | 0.83 [0.56, 1.23] |
| 5 Serious adverse events ‐ different screening tools Show forest plot | 33 | 8541 | Risk Ratio (M‐H, Random, 95% CI) | 0.89 [0.74, 1.07] |
| 5.1 NRS 2002 | 0 | 0 | Risk Ratio (M‐H, Random, 95% CI) | 0.0 [0.0, 0.0] |
| 5.2 MUST | 0 | 0 | Risk Ratio (M‐H, Random, 95% CI) | 0.0 [0.0, 0.0] |
| 5.3 MNA | 2 | 117 | Risk Ratio (M‐H, Random, 95% CI) | 0.61 [0.12, 3.18] |
| 5.4 SGA | 0 | 0 | Risk Ratio (M‐H, Random, 95% CI) | 0.0 [0.0, 0.0] |
| 5.5 Other means | 31 | 8424 | Risk Ratio (M‐H, Random, 95% CI) | 0.89 [0.74, 1.08] |
| 6 Serious adverse events ‐ participants characterised as 'at nutritional risk' due to one of the following conditions Show forest plot | 33 | 8541 | Risk Ratio (M‐H, Random, 95% CI) | 0.89 [0.74, 1.07] |
| 6.1 Major surgery | 11 | 1290 | Risk Ratio (M‐H, Random, 95% CI) | 0.82 [0.61, 1.11] |
| 6.2 Stroke | 2 | 4052 | Risk Ratio (M‐H, Random, 95% CI) | 0.65 [0.22, 1.93] |
| 6.3 ICU participants including trauma | 0 | 0 | Risk Ratio (M‐H, Random, 95% CI) | 0.0 [0.0, 0.0] |
| 6.4 Frail elderly participants with less severe conditions known to increase protein requirements | 11 | 1046 | Risk Ratio (M‐H, Random, 95% CI) | 0.85 [0.57, 1.27] |
| 6.5 Participants do not fall into one of the categories above | 9 | 2153 | Risk Ratio (M‐H, Random, 95% CI) | 0.96 [0.64, 1.46] |
| 7 Serious adverse events ‐ participants characterised as 'at nutritional risk' due to one of the following criteria Show forest plot | 33 | 8541 | Risk Ratio (M‐H, Random, 95% CI) | 0.89 [0.74, 1.07] |
| 7.1 BMI less than 20.5 kg/m2 | 1 | 37 | Risk Ratio (M‐H, Random, 95% CI) | 0.35 [0.02, 8.09] |
| 7.2 Weight loss of at least 5% during the last three months | 0 | 0 | Risk Ratio (M‐H, Random, 95% CI) | 0.0 [0.0, 0.0] |
| 7.3 Weight loss of at least 10% during the last six months | 0 | 0 | Risk Ratio (M‐H, Random, 95% CI) | 0.0 [0.0, 0.0] |
| 7.4 Insufficient food intake during the last week (50% of requirements or less) | 0 | 0 | Risk Ratio (M‐H, Random, 95% CI) | 0.0 [0.0, 0.0] |
| 7.5 Participants characterised as 'at nutritional risk' by other means | 32 | 8504 | Risk Ratio (M‐H, Random, 95% CI) | 0.89 [0.74, 1.07] |
| 8 Serious adverse events ‐ participants characterised as 'at nutritional risk' due to biomarkers or anthropometrics Show forest plot | 33 | 8541 | Risk Ratio (M‐H, Random, 95% CI) | 0.89 [0.74, 1.07] |
| 8.1 Biomarkers | 1 | 60 | Risk Ratio (M‐H, Random, 95% CI) | 0.43 [0.12, 1.50] |
| 8.2 Anthropometric measures | 6 | 1111 | Risk Ratio (M‐H, Random, 95% CI) | 0.78 [0.52, 1.16] |
| 8.3 Both | 0 | 0 | Risk Ratio (M‐H, Random, 95% CI) | 0.0 [0.0, 0.0] |
| 8.4 Characterised by other means | 26 | 7370 | Risk Ratio (M‐H, Random, 95% CI) | 0.91 [0.72, 1.13] |
| 9 Serious adverse events ‐ randomisation year Show forest plot | 33 | 8541 | Risk Ratio (M‐H, Random, 95% CI) | 0.89 [0.74, 1.07] |
| 9.1 Before 1960 | 0 | 0 | Risk Ratio (M‐H, Random, 95% CI) | 0.0 [0.0, 0.0] |
| 9.2 1960 to 1979 | 1 | 60 | Risk Ratio (M‐H, Random, 95% CI) | 0.76 [0.24, 2.43] |
| 9.3 1980 to 1999 | 18 | 6960 | Risk Ratio (M‐H, Random, 95% CI) | 0.88 [0.78, 1.00] |
| 9.4 After 1999 | 14 | 1521 | Risk Ratio (M‐H, Random, 95% CI) | 0.79 [0.45, 1.39] |
| 10 Serious adverse events ‐ trials where the intervention lasts fewer than three days compared with trials where the intervention lasts three days or more Show forest plot | 32 | 8501 | Risk Ratio (M‐H, Random, 95% CI) | 0.89 [0.74, 1.07] |
| 10.1 Three days or more | 30 | 8412 | Risk Ratio (M‐H, Random, 95% CI) | 0.89 [0.74, 1.07] |
| 10.2 Less than three days | 1 | 39 | Risk Ratio (M‐H, Random, 95% CI) | 0.0 [0.0, 0.0] |
| 10.3 Unknown | 1 | 50 | Risk Ratio (M‐H, Random, 95% CI) | 0.25 [0.01, 5.00] |
| 11 Serious adverse events ‐ 'best‐worst case' scenario Show forest plot | 33 | 8844 | Risk Ratio (M‐H, Random, 95% CI) | 0.64 [0.50, 0.81] |
| 12 Serious adverse events ‐ 'worst‐best case' scenario Show forest plot | 33 | 8844 | Risk Ratio (M‐H, Random, 95% CI) | 1.15 [0.86, 1.55] |
| 13 Serious adverse events co‐interventions Show forest plot | 33 | 8541 | Risk Ratio (M‐H, Fixed, 95% CI) | 0.92 [0.82, 1.03] |
| 13.1 Received nutrition support as co‐intervention | 1 | 60 | Risk Ratio (M‐H, Fixed, 95% CI) | 0.43 [0.12, 1.50] |
| 13.2 did not receive nutrition support as co‐intervention | 32 | 8481 | Risk Ratio (M‐H, Fixed, 95% CI) | 0.92 [0.82, 1.04] |
| 13.3 delayed versus early nutrition support | 0 | 0 | Risk Ratio (M‐H, Fixed, 95% CI) | 0.0 [0.0, 0.0] |
| Outcome or subgroup title | No. of studies | No. of participants | Statistical method | Effect size |
| 1 All‐cause mortality ‐ overall Show forest plot | 36 | 3722 | Risk Ratio (M‐H, Random, 95% CI) | 0.88 [0.75, 1.03] |
| 2 All‐cause mortality ‐ bias Show forest plot | 36 | 3722 | Risk Ratio (M‐H, Random, 95% CI) | 0.88 [0.75, 1.03] |
| 2.1 High risk of bias | 36 | 3722 | Risk Ratio (M‐H, Random, 95% CI) | 0.88 [0.75, 1.03] |
| 2.2 Low risk of bias | 0 | 0 | Risk Ratio (M‐H, Random, 95% CI) | 0.0 [0.0, 0.0] |
| 3 All‐cause mortality ‐ medical speciality Show forest plot | 36 | 3722 | Risk Ratio (M‐H, Random, 95% CI) | 0.88 [0.75, 1.03] |
| 3.1 Cardiology | 0 | 0 | Risk Ratio (M‐H, Random, 95% CI) | 0.0 [0.0, 0.0] |
| 3.2 Medical gastroenterology and hepatology | 4 | 289 | Risk Ratio (M‐H, Random, 95% CI) | 0.75 [0.40, 1.42] |
| 3.3 Geriatrics | 0 | 0 | Risk Ratio (M‐H, Random, 95% CI) | 0.0 [0.0, 0.0] |
| 3.4 Pulmonary disease | 0 | 0 | Risk Ratio (M‐H, Random, 95% CI) | 0.0 [0.0, 0.0] |
| 3.5 Endocrinology | 0 | 0 | Risk Ratio (M‐H, Random, 95% CI) | 0.0 [0.0, 0.0] |
| 3.6 Infectious diseases | 1 | 56 | Risk Ratio (M‐H, Random, 95% CI) | 1.61 [0.66, 3.92] |
| 3.7 Rheumatology | 0 | 0 | Risk Ratio (M‐H, Random, 95% CI) | 0.0 [0.0, 0.0] |
| 3.8 Haematology | 0 | 0 | Risk Ratio (M‐H, Random, 95% CI) | 0.0 [0.0, 0.0] |
| 3.9 Nephrology | 0 | 0 | Risk Ratio (M‐H, Random, 95% CI) | 0.0 [0.0, 0.0] |
| 3.10 Gastroenterologic surgery | 13 | 1063 | Risk Ratio (M‐H, Random, 95% CI) | 0.72 [0.44, 1.18] |
| 3.11 Trauma surgery | 2 | 139 | Risk Ratio (M‐H, Random, 95% CI) | 0.50 [0.20, 1.28] |
| 3.12 Orthopaedics | 4 | 248 | Risk Ratio (M‐H, Random, 95% CI) | 0.89 [0.21, 3.81] |
| 3.13 Plastic, reconstructive and aesthetic surgery | 0 | 0 | Risk Ratio (M‐H, Random, 95% CI) | 0.0 [0.0, 0.0] |
| 3.14 Vascular surgery | 1 | 13 | Risk Ratio (M‐H, Random, 95% CI) | 0.0 [0.0, 0.0] |
| 3.15 Transplant surgery | 0 | 0 | Risk Ratio (M‐H, Random, 95% CI) | 0.0 [0.0, 0.0] |
| 3.16 Urology | 0 | 0 | Risk Ratio (M‐H, Random, 95% CI) | 0.0 [0.0, 0.0] |
| 3.17 Thoracic surgery | 2 | 548 | Risk Ratio (M‐H, Random, 95% CI) | 0.22 [0.03, 1.86] |
| 3.18 Neurological surgery | 0 | 0 | Risk Ratio (M‐H, Random, 95% CI) | 0.0 [0.0, 0.0] |
| 3.19 Oro‐maxillo‐facial surgery | 1 | 32 | Risk Ratio (M‐H, Random, 95% CI) | 3.38 [0.15, 77.12] |
| 3.20 Anaesthesiology | 0 | 0 | Risk Ratio (M‐H, Random, 95% CI) | 0.0 [0.0, 0.0] |
| 3.21 Emergency medicine | 3 | 154 | Risk Ratio (M‐H, Random, 95% CI) | 0.77 [0.31, 1.94] |
| 3.22 Psychiatry | 0 | 0 | Risk Ratio (M‐H, Random, 95% CI) | 0.0 [0.0, 0.0] |
| 3.23 Neurology | 3 | 1027 | Risk Ratio (M‐H, Random, 95% CI) | 0.67 [0.33, 1.37] |
| 3.24 Oncology | 0 | 0 | Risk Ratio (M‐H, Random, 95% CI) | 0.0 [0.0, 0.0] |
| 3.25 Dermatology | 0 | 0 | Risk Ratio (M‐H, Random, 95% CI) | 0.0 [0.0, 0.0] |
| 3.26 Gynaecology | 0 | 0 | Risk Ratio (M‐H, Random, 95% CI) | 0.0 [0.0, 0.0] |
| 3.27 Mixed | 2 | 153 | Risk Ratio (M‐H, Random, 95% CI) | 0.32 [0.03, 2.99] |
| 4 All‐cause mortality ‐ based on adequacy of the amount of calories Show forest plot | 36 | 3722 | Risk Ratio (M‐H, Random, 95% CI) | 0.88 [0.75, 1.03] |
| 4.1 Clearly adequate in experimental group and clearly inadequate in control group | 7 | 736 | Risk Ratio (M‐H, Random, 95% CI) | 0.70 [0.40, 1.25] |
| 4.2 Inadequate in the experimental group or adequate in the control group | 7 | 410 | Risk Ratio (M‐H, Random, 95% CI) | 0.72 [0.28, 1.85] |
| 4.3 Experimental group is overfed | 2 | 74 | Risk Ratio (M‐H, Random, 95% CI) | 0.76 [0.15, 3.79] |
| 4.4 Unclear intake in experimental group or control group | 20 | 2502 | Risk Ratio (M‐H, Random, 95% CI) | 0.89 [0.73, 1.08] |
| 5 All‐cause mortality ‐ different screening tools Show forest plot | 36 | 3722 | Risk Ratio (M‐H, Random, 95% CI) | 0.88 [0.75, 1.03] |
| 5.1 NRS 2002 | 0 | 0 | Risk Ratio (M‐H, Random, 95% CI) | 0.0 [0.0, 0.0] |
| 5.2 MUST | 0 | 0 | Risk Ratio (M‐H, Random, 95% CI) | 0.0 [0.0, 0.0] |
| 5.3 MNA | 0 | 0 | Risk Ratio (M‐H, Random, 95% CI) | 0.0 [0.0, 0.0] |
| 5.4 SGA | 1 | 323 | Risk Ratio (M‐H, Random, 95% CI) | 0.75 [0.13, 4.44] |
| 5.5 Other means | 35 | 3399 | Risk Ratio (M‐H, Random, 95% CI) | 0.88 [0.75, 1.03] |
| 6 All‐cause mortality ‐ participants characterised as 'at nutritional risk' due to one of the following conditions Show forest plot | 36 | 3722 | Risk Ratio (M‐H, Random, 95% CI) | 0.88 [0.75, 1.03] |
| 6.1 Major surgery | 18 | 1746 | Risk Ratio (M‐H, Random, 95% CI) | 0.69 [0.45, 1.06] |
| 6.2 Stroke | 3 | 1027 | Risk Ratio (M‐H, Random, 95% CI) | 0.67 [0.33, 1.37] |
| 6.3 ICU participants including trauma | 5 | 293 | Risk Ratio (M‐H, Random, 95% CI) | 0.62 [0.32, 1.21] |
| 6.4 Frail elderly participants with less severe conditions known to increase protein requirements | 2 | 126 | Risk Ratio (M‐H, Random, 95% CI) | 1.59 [0.02, 125.73] |
| 6.5 Participants do not fall into one of the categories above | 8 | 530 | Risk Ratio (M‐H, Random, 95% CI) | 0.95 [0.58, 1.56] |
| 7 All‐cause mortality ‐ participants characterised as 'at nutritional risk' due to one of the following criteria Show forest plot | 36 | 3722 | Risk Ratio (M‐H, Random, 95% CI) | 0.88 [0.75, 1.03] |
| 7.1 BMI less than 20.5 kg/m2 | 0 | 0 | Risk Ratio (M‐H, Random, 95% CI) | 0.0 [0.0, 0.0] |
| 7.2 Weight loss of at least 5% during the last three months | 0 | 0 | Risk Ratio (M‐H, Random, 95% CI) | 0.0 [0.0, 0.0] |
| 7.3 Weight loss of at least 10% during the last six months | 1 | 32 | Risk Ratio (M‐H, Random, 95% CI) | 3.38 [0.15, 77.12] |
| 7.4 Insufficient food intake during the last week (50% of requirements or less) | 0 | 0 | Risk Ratio (M‐H, Random, 95% CI) | 0.0 [0.0, 0.0] |
| 7.5 Participants characterised as 'at nutritional risk' by other means | 35 | 3690 | Risk Ratio (M‐H, Random, 95% CI) | 0.88 [0.75, 1.02] |
| 8 All‐cause mortality ‐ participants characterised as 'at nutritional risk' due to biomarkers or anthropometrics Show forest plot | 36 | 3722 | Risk Ratio (M‐H, Random, 95% CI) | 0.88 [0.75, 1.03] |
| 8.1 Biomarkers | 1 | 520 | Risk Ratio (M‐H, Random, 95% CI) | 0.15 [0.01, 2.84] |
| 8.2 Anthropometric measures | 2 | 122 | Risk Ratio (M‐H, Random, 95% CI) | 0.71 [0.24, 2.08] |
| 8.3 Characterised by other means | 33 | 3080 | Risk Ratio (M‐H, Random, 95% CI) | 0.89 [0.76, 1.04] |
| 9 All‐cause mortality ‐ randomisation year Show forest plot | 36 | 3722 | Risk Ratio (M‐H, Random, 95% CI) | 0.88 [0.75, 1.03] |
| 9.1 Before 1960 | 0 | 0 | Risk Ratio (M‐H, Random, 95% CI) | 0.0 [0.0, 0.0] |
| 9.2 1960‐1979 | 1 | 26 | Risk Ratio (M‐H, Random, 95% CI) | 0.44 [0.02, 9.98] |
| 9.3 1980‐1999 | 23 | 2463 | Risk Ratio (M‐H, Random, 95% CI) | 0.93 [0.78, 1.11] |
| 9.4 After 1999 | 12 | 1233 | Risk Ratio (M‐H, Random, 95% CI) | 0.73 [0.52, 1.00] |
| 10 All‐cause mortality ‐ trials where the intervention lasts fewer than three days compared with trials where the intervention lasts three days or more Show forest plot | 36 | 3722 | Risk Ratio (M‐H, Random, 95% CI) | 0.88 [0.75, 1.03] |
| 10.1 Three days or more | 30 | 3287 | Risk Ratio (M‐H, Random, 95% CI) | 0.88 [0.75, 1.03] |
| 10.2 Less than three days | 6 | 435 | Risk Ratio (M‐H, Random, 95% CI) | 0.68 [0.28, 1.65] |
| 10.3 Unknown | 0 | 0 | Risk Ratio (M‐H, Random, 95% CI) | 0.0 [0.0, 0.0] |
| 11 All‐cause mortality ‐ 'best‐worst case' scenario Show forest plot | 36 | 3759 | Risk Ratio (M‐H, Random, 95% CI) | 0.84 [0.72, 0.98] |
| 12 All‐cause mortality ‐ 'worst‐best case' scenario Show forest plot | 36 | 3759 | Risk Ratio (M‐H, Fixed, 95% CI) | 0.92 [0.79, 1.06] |
| 13 All‐cause mortality co‐interventions Show forest plot | 36 | 3722 | Risk Ratio (M‐H, Random, 95% CI) | 0.88 [0.75, 1.03] |
| 13.1 received nutrition support as co‐intervention | 3 | 126 | Risk Ratio (M‐H, Random, 95% CI) | 0.60 [0.28, 1.28] |
| 13.2 did not receive nutrition support as co‐intervention | 27 | 3253 | Risk Ratio (M‐H, Random, 95% CI) | 0.79 [0.62, 1.02] |
| 13.3 delayed versus early nutrition support | 6 | 343 | Risk Ratio (M‐H, Random, 95% CI) | 1.06 [0.57, 1.97] |
| Outcome or subgroup title | No. of studies | No. of participants | Statistical method | Effect size |
| 1 All‐cause mortality ‐ overall Show forest plot | 42 | 4212 | Risk Ratio (M‐H, Random, 95% CI) | 0.84 [0.75, 0.95] |
| 2 All‐cause mortality ‐ bias Show forest plot | 42 | 4212 | Risk Ratio (M‐H, Random, 95% CI) | 0.84 [0.75, 0.95] |
| 2.1 High risk of bias | 42 | 4212 | Risk Ratio (M‐H, Random, 95% CI) | 0.84 [0.75, 0.95] |
| 2.2 Low risk of bias | 0 | 0 | Risk Ratio (M‐H, Random, 95% CI) | 0.0 [0.0, 0.0] |
| 3 All‐cause mortality ‐ medical speciality Show forest plot | 42 | 4212 | Risk Ratio (M‐H, Random, 95% CI) | 0.84 [0.75, 0.95] |
| 3.1 Cardiology | 0 | 0 | Risk Ratio (M‐H, Random, 95% CI) | 0.0 [0.0, 0.0] |
| 3.2 Medical gastroenterology and hepatology | 4 | 289 | Risk Ratio (M‐H, Random, 95% CI) | 0.88 [0.63, 1.21] |
| 3.3 Geriatrics | 0 | 0 | Risk Ratio (M‐H, Random, 95% CI) | 0.0 [0.0, 0.0] |
| 3.4 Pulmonary disease | 0 | 0 | Risk Ratio (M‐H, Random, 95% CI) | 0.0 [0.0, 0.0] |
| 3.5 Endocrinology | 0 | 0 | Risk Ratio (M‐H, Random, 95% CI) | 0.0 [0.0, 0.0] |
| 3.6 Infectious diseases | 1 | 56 | Risk Ratio (M‐H, Random, 95% CI) | 1.61 [0.66, 3.92] |
| 3.7 Rheumatology | 0 | 0 | Risk Ratio (M‐H, Random, 95% CI) | 0.0 [0.0, 0.0] |
| 3.8 Haematology | 0 | 0 | Risk Ratio (M‐H, Random, 95% CI) | 0.0 [0.0, 0.0] |
| 3.9 Nephrology | 0 | 0 | Risk Ratio (M‐H, Random, 95% CI) | 0.0 [0.0, 0.0] |
| 3.10 Gastroenterologic surgery | 15 | 1284 | Risk Ratio (M‐H, Random, 95% CI) | 0.75 [0.48, 1.16] |
| 3.11 Trauma surgery | 4 | 204 | Risk Ratio (M‐H, Random, 95% CI) | 0.58 [0.30, 1.11] |
| 3.12 Ortopaedics | 4 | 248 | Risk Ratio (M‐H, Random, 95% CI) | 0.82 [0.18, 3.75] |
| 3.13 Plastic, reconstructive, and aesthetic surgery | 0 | 0 | Risk Ratio (M‐H, Random, 95% CI) | 0.0 [0.0, 0.0] |
| 3.14 Vascular surgery | 1 | 13 | Risk Ratio (M‐H, Random, 95% CI) | 0.0 [0.0, 0.0] |
| 3.15 Transplant surgery | 0 | 0 | Risk Ratio (M‐H, Random, 95% CI) | 0.0 [0.0, 0.0] |
| 3.16 Urology | 0 | 0 | Risk Ratio (M‐H, Random, 95% CI) | 0.0 [0.0, 0.0] |
| 3.17 Thoracic surgery | 2 | 548 | Risk Ratio (M‐H, Random, 95% CI) | 0.22 [0.03, 1.86] |
| 3.18 Neurological surgery | 0 | 0 | Risk Ratio (M‐H, Random, 95% CI) | 0.0 [0.0, 0.0] |
| 3.19 Oro‐maxillo‐facial surgery | 1 | 32 | Risk Ratio (M‐H, Random, 95% CI) | 3.38 [0.15, 77.12] |
| 3.20 Anaesthesiology | 0 | 0 | Risk Ratio (M‐H, Random, 95% CI) | 0.0 [0.0, 0.0] |
| 3.21 Emergency medicine | 4 | 213 | Risk Ratio (M‐H, Random, 95% CI) | 1.07 [0.61, 1.89] |
| 3.22 Psychiatry | 0 | 0 | Risk Ratio (M‐H, Random, 95% CI) | 0.0 [0.0, 0.0] |
| 3.23 Neurology | 4 | 1172 | Risk Ratio (M‐H, Random, 95% CI) | 0.57 [0.31, 1.05] |
| 3.24 Oncology | 0 | 0 | Risk Ratio (M‐H, Random, 95% CI) | 0.0 [0.0, 0.0] |
| 3.25 Dermatology | 0 | 0 | Risk Ratio (M‐H, Random, 95% CI) | 0.0 [0.0, 0.0] |
| 3.26 Gynaecology | 0 | 0 | Risk Ratio (M‐H, Random, 95% CI) | 0.0 [0.0, 0.0] |
| 3.27 Mixed | 2 | 153 | Risk Ratio (M‐H, Random, 95% CI) | 0.63 [0.18, 2.21] |
| 4 All‐cause mortality ‐ based on adequacy of the amount of calories Show forest plot | 42 | 4212 | Risk Ratio (M‐H, Random, 95% CI) | 0.84 [0.75, 0.95] |
| 4.1 Clearly adequate in intervention and clearly inadequate in control | 10 | 954 | Risk Ratio (M‐H, Random, 95% CI) | 0.75 [0.46, 1.23] |
| 4.2 Inadequate in the experimental or adequate in the control | 7 | 410 | Risk Ratio (M‐H, Random, 95% CI) | 0.72 [0.28, 1.85] |
| 4.3 Experimental group is overfed | 3 | 174 | Risk Ratio (M‐H, Random, 95% CI) | 1.01 [0.49, 2.08] |
| 4.4 Unclear intake in control or experimental | 22 | 2674 | Risk Ratio (M‐H, Random, 95% CI) | 0.82 [0.67, 0.99] |
| 5 All‐cause mortality ‐ different screening tools Show forest plot | 42 | 4212 | Risk Ratio (M‐H, Random, 95% CI) | 0.84 [0.75, 0.95] |
| 5.1 NRS 2002 | 0 | 0 | Risk Ratio (M‐H, Random, 95% CI) | 0.0 [0.0, 0.0] |
| 5.2 MUST | 0 | 0 | Risk Ratio (M‐H, Random, 95% CI) | 0.0 [0.0, 0.0] |
| 5.3 MNA | 0 | 0 | Risk Ratio (M‐H, Random, 95% CI) | 0.0 [0.0, 0.0] |
| 5.4 SGA | 1 | 323 | Risk Ratio (M‐H, Random, 95% CI) | 0.75 [0.13, 4.44] |
| 5.5 Other means | 41 | 3889 | Risk Ratio (M‐H, Random, 95% CI) | 0.84 [0.75, 0.95] |
| 6 All‐cause mortality ‐ participants characterised as 'at nutritional risk' due to one of the following conditions Show forest plot | 42 | 4212 | Risk Ratio (M‐H, Random, 95% CI) | 0.84 [0.75, 0.95] |
| 6.1 Major surgery | 20 | 1967 | Risk Ratio (M‐H, Random, 95% CI) | 0.71 [0.48, 1.06] |
| 6.2 Stroke | 4 | 1172 | Risk Ratio (M‐H, Random, 95% CI) | 0.57 [0.31, 1.05] |
| 6.3 ICU participants including trauma | 8 | 417 | Risk Ratio (M‐H, Random, 95% CI) | 0.82 [0.54, 1.26] |
| 6.4 Frail elderly participants with less severe conditions known to increase protein requirements | 2 | 126 | Risk Ratio (M‐H, Random, 95% CI) | 1.25 [0.01, 150.42] |
| 6.5 Participants do not fall into one of the categories above | 8 | 530 | Risk Ratio (M‐H, Random, 95% CI) | 0.93 [0.69, 1.25] |
| 7 All‐cause mortality ‐ participants characterised as 'at nutritional risk' due to one of the following criteria Show forest plot | 42 | 4212 | Risk Ratio (M‐H, Random, 95% CI) | 0.84 [0.75, 0.95] |
| 7.1 BMI less than 20.5 kg/m2 | 0 | 0 | Risk Ratio (M‐H, Random, 95% CI) | 0.0 [0.0, 0.0] |
| 7.2 Weight loss of at least 5% during the last three months | 0 | 0 | Risk Ratio (M‐H, Random, 95% CI) | 0.0 [0.0, 0.0] |
| 7.3 Weight loss of at least 10% during the last six months | 1 | 32 | Risk Ratio (M‐H, Random, 95% CI) | 3.38 [0.15, 77.12] |
| 7.4 Insufficient food intake during the last week (50% of requirements or less) | 0 | 0 | Risk Ratio (M‐H, Random, 95% CI) | 0.0 [0.0, 0.0] |
| 7.5 Participants characterised as 'at nutritional risk' by other means | 41 | 4180 | Risk Ratio (M‐H, Random, 95% CI) | 0.84 [0.75, 0.95] |
| 8 All‐cause mortality ‐ participants characterised as 'at nutritional risk' due to biomarkers or anthropometrics Show forest plot | 42 | 4212 | Risk Ratio (M‐H, Random, 95% CI) | 0.84 [0.75, 0.95] |
| 8.1 Biomarkers | 1 | 520 | Risk Ratio (M‐H, Random, 95% CI) | 0.15 [0.01, 2.84] |
| 8.2 Anthropometric measures | 2 | 122 | Risk Ratio (M‐H, Random, 95% CI) | 0.71 [0.24, 2.08] |
| 8.3 Both anthropometrics and biomarkers | 0 | 0 | Risk Ratio (M‐H, Random, 95% CI) | 0.0 [0.0, 0.0] |
| 8.4 Characterised by other means | 39 | 3570 | Risk Ratio (M‐H, Random, 95% CI) | 0.85 [0.75, 0.96] |
| 9 All‐cause mortality ‐ randomisation year Show forest plot | 42 | 4212 | Risk Ratio (M‐H, Random, 95% CI) | 0.84 [0.75, 0.95] |
| 9.1 Before 1960 | 0 | 0 | Risk Ratio (M‐H, Random, 95% CI) | 0.0 [0.0, 0.0] |
| 9.2 1960 to 1979 | 1 | 26 | Risk Ratio (M‐H, Random, 95% CI) | 0.44 [0.02, 9.98] |
| 9.3 1980 to 1999 | 24 | 2500 | Risk Ratio (M‐H, Random, 95% CI) | 0.87 [0.69, 1.08] |
| 9.4 After 1999 | 17 | 1686 | Risk Ratio (M‐H, Random, 95% CI) | 0.76 [0.60, 0.96] |
| 10 All‐cause mortality ‐ trials where the intervention lasts fewer than three days compared with trials where the intervention lasts three days or more Show forest plot | 42 | 4212 | Risk Ratio (M‐H, Random, 95% CI) | 0.84 [0.75, 0.95] |
| 10.1 Three days or more | 34 | 3680 | Risk Ratio (M‐H, Random, 95% CI) | 0.82 [0.71, 0.94] |
| 10.2 Less than three days | 8 | 532 | Risk Ratio (M‐H, Random, 95% CI) | 1.03 [0.66, 1.63] |
| 10.3 Unknown | 0 | 0 | Risk Ratio (M‐H, Random, 95% CI) | 0.0 [0.0, 0.0] |
| 11 All‐cause mortality ‐ 'best‐worst case' scenario Show forest plot | 42 | 4269 | Risk Ratio (M‐H, Random, 95% CI) | 0.75 [0.63, 0.89] |
| 12 All‐cause mortality ‐ 'worst‐best case' scenario Show forest plot | 42 | 4269 | Risk Ratio (M‐H, Random, 95% CI) | 0.84 [0.68, 1.03] |
| 13 All‐cause mortality co‐interventions Show forest plot | 42 | 4212 | Risk Ratio (M‐H, Fixed, 95% CI) | 0.82 [0.73, 0.92] |
| 13.1 received nutrition support as co‐intervention | 5 | 262 | Risk Ratio (M‐H, Fixed, 95% CI) | 1.03 [0.66, 1.60] |
| 13.2 did not receive nutrition support as co‐intervention | 35 | 3797 | Risk Ratio (M‐H, Fixed, 95% CI) | 0.81 [0.71, 0.91] |
| 13.3 delayed versus early nutrition support | 2 | 153 | Risk Ratio (M‐H, Fixed, 95% CI) | 0.61 [0.17, 2.12] |
| Outcome or subgroup title | No. of studies | No. of participants | Statistical method | Effect size |
| 1 Serious adverse events ‐ overall Show forest plot | 43 | 3935 | Risk Ratio (M‐H, Random, 95% CI) | 0.85 [0.74, 0.98] |
| 2 Serious adverse events ‐ bias Show forest plot | 43 | 3935 | Risk Ratio (M‐H, Random, 95% CI) | 0.85 [0.74, 0.98] |
| 2.1 High risk of bias | 43 | 3935 | Risk Ratio (M‐H, Random, 95% CI) | 0.85 [0.74, 0.98] |
| 2.2 Low risk of bias | 0 | 0 | Risk Ratio (M‐H, Random, 95% CI) | 0.0 [0.0, 0.0] |
| 3 Serious adverse events ‐ by medical specialty Show forest plot | 43 | 3935 | Risk Ratio (M‐H, Random, 95% CI) | 0.85 [0.74, 0.98] |
| 3.1 Cardiology | 0 | 0 | Risk Ratio (M‐H, Random, 95% CI) | 0.0 [0.0, 0.0] |
| 3.2 Medical gastroenterology and hepatology | 4 | 289 | Risk Ratio (M‐H, Random, 95% CI) | 0.79 [0.32, 1.96] |
| 3.3 High risk | 0 | 0 | Risk Ratio (M‐H, Random, 95% CI) | 0.0 [0.0, 0.0] |
| 3.4 Geriatrics | 0 | 0 | Risk Ratio (M‐H, Random, 95% CI) | 0.0 [0.0, 0.0] |
| 3.5 Pulmonary disease | 0 | 0 | Risk Ratio (M‐H, Random, 95% CI) | 0.0 [0.0, 0.0] |
| 3.6 Endocrinology | 0 | 0 | Risk Ratio (M‐H, Random, 95% CI) | 0.0 [0.0, 0.0] |
| 3.7 Infectious diseases | 1 | 56 | Risk Ratio (M‐H, Random, 95% CI) | 1.23 [0.52, 2.93] |
| 3.8 Rheumatology | 0 | 0 | Risk Ratio (M‐H, Random, 95% CI) | 0.0 [0.0, 0.0] |
| 3.9 Haematology | 0 | 0 | Risk Ratio (M‐H, Random, 95% CI) | 0.0 [0.0, 0.0] |
| 3.10 Nephrology | 0 | 0 | Risk Ratio (M‐H, Random, 95% CI) | 0.0 [0.0, 0.0] |
| 3.11 Gastroenterologic surgery | 19 | 1235 | Risk Ratio (M‐H, Random, 95% CI) | 0.75 [0.54, 1.03] |
| 3.12 Trauma surgery | 3 | 180 | Risk Ratio (M‐H, Random, 95% CI) | 0.50 [0.20, 1.28] |
| 3.13 Ortopaedics | 4 | 248 | Risk Ratio (M‐H, Random, 95% CI) | 1.05 [0.34, 3.26] |
| 3.14 Plastic, reconstructive, and aesthetic surgery | 0 | 0 | Risk Ratio (M‐H, Random, 95% CI) | 0.0 [0.0, 0.0] |
| 3.15 Vascular surgery | 1 | 13 | Risk Ratio (M‐H, Random, 95% CI) | 0.0 [0.0, 0.0] |
| 3.16 Transplant surgery | 0 | 0 | Risk Ratio (M‐H, Random, 95% CI) | 0.0 [0.0, 0.0] |
| 3.17 Urology | 0 | 0 | Risk Ratio (M‐H, Random, 95% CI) | 0.0 [0.0, 0.0] |
| 3.18 Thoracic surgery | 2 | 548 | Risk Ratio (M‐H, Random, 95% CI) | 0.15 [0.02, 1.27] |
| 3.19 Neurological surgery | 0 | 0 | Risk Ratio (M‐H, Random, 95% CI) | 0.0 [0.0, 0.0] |
| 3.20 Oro‐maxillo‐facial surgery | 1 | 32 | Risk Ratio (M‐H, Random, 95% CI) | 0.88 [0.44, 1.78] |
| 3.21 Anaesthesiology | 0 | 0 | Risk Ratio (M‐H, Random, 95% CI) | 0.0 [0.0, 0.0] |
| 3.22 Emergency medicine | 3 | 154 | Risk Ratio (M‐H, Random, 95% CI) | 0.77 [0.31, 1.94] |
| 3.23 Psychiatry | 0 | 0 | Risk Ratio (M‐H, Random, 95% CI) | 0.0 [0.0, 0.0] |
| 3.24 Neurology | 3 | 1027 | Risk Ratio (M‐H, Random, 95% CI) | 0.67 [0.37, 1.24] |
| 3.25 Oncology | 0 | 0 | Risk Ratio (M‐H, Random, 95% CI) | 0.0 [0.0, 0.0] |
| 3.26 Dermatology | 0 | 0 | Risk Ratio (M‐H, Random, 95% CI) | 0.0 [0.0, 0.0] |
| 3.27 Gynaecology | 0 | 0 | Risk Ratio (M‐H, Random, 95% CI) | 0.0 [0.0, 0.0] |
| 3.28 Mixed | 2 | 153 | Risk Ratio (M‐H, Random, 95% CI) | 0.32 [0.03, 2.99] |
| 4 Serious adverse events ‐ based on adequacy of the amount of calories Show forest plot | 43 | 3935 | Risk Ratio (M‐H, Random, 95% CI) | 0.85 [0.74, 0.98] |
| 4.1 Clearly adequate in intervention and clearly inadequate in control | 9 | 769 | Risk Ratio (M‐H, Random, 95% CI) | 0.77 [0.54, 1.10] |
| 4.2 Inadequate in the experimental or adequate in the control | 8 | 411 | Risk Ratio (M‐H, Random, 95% CI) | 0.86 [0.55, 1.35] |
| 4.3 Experimental group is overfed | 3 | 115 | Risk Ratio (M‐H, Random, 95% CI) | 0.64 [0.13, 3.12] |
| 4.4 Unclear intake in control or experimental | 23 | 2640 | Risk Ratio (M‐H, Random, 95% CI) | 0.73 [0.55, 0.98] |
| 5 Serious adverse events ‐ different screening tools Show forest plot | 43 | 3935 | Risk Ratio (M‐H, Random, 95% CI) | 0.85 [0.74, 0.98] |
| 5.1 NRS 2002 | 0 | 0 | Risk Ratio (M‐H, Random, 95% CI) | 0.0 [0.0, 0.0] |
| 5.2 MUST | 0 | 0 | Risk Ratio (M‐H, Random, 95% CI) | 0.0 [0.0, 0.0] |
| 5.3 MNA | 0 | 0 | Risk Ratio (M‐H, Random, 95% CI) | 0.0 [0.0, 0.0] |
| 5.4 SGA | 1 | 323 | Risk Ratio (M‐H, Random, 95% CI) | 0.38 [0.13, 1.06] |
| 5.5 Other means | 42 | 3612 | Risk Ratio (M‐H, Random, 95% CI) | 0.87 [0.75, 1.00] |
| 6 Serious adverse events ‐ participants characterised as 'at nutritional risk' due to one of the following conditions Show forest plot | 43 | 3935 | Risk Ratio (M‐H, Random, 95% CI) | 0.85 [0.74, 0.98] |
| 6.1 Major surgery | 24 | 1918 | Risk Ratio (M‐H, Random, 95% CI) | 0.72 [0.53, 0.97] |
| 6.2 Stroke | 3 | 1027 | Risk Ratio (M‐H, Random, 95% CI) | 0.67 [0.37, 1.24] |
| 6.3 ICU participants including trauma | 6 | 334 | Risk Ratio (M‐H, Random, 95% CI) | 0.62 [0.32, 1.21] |
| 6.4 Frail elderly participants with less severe conditions known to increase protein requirements | 2 | 126 | Risk Ratio (M‐H, Random, 95% CI) | 2.84 [0.12, 66.14] |
| 6.5 Participants do not fall into one of the categories above | 8 | 530 | Risk Ratio (M‐H, Random, 95% CI) | 0.87 [0.58, 1.30] |
| 7 Serious adverse events ‐ participants characterised as 'at nutritional risk' due to one of the following criteria Show forest plot | 43 | 3935 | Risk Ratio (M‐H, Random, 95% CI) | 0.85 [0.74, 0.98] |
| 7.1 BMI less than 20.5 kg/m2 | 0 | 0 | Risk Ratio (M‐H, Random, 95% CI) | 0.0 [0.0, 0.0] |
| 7.2 Weight loss of at least 5% during the last three months | 0 | 0 | Risk Ratio (M‐H, Random, 95% CI) | 0.0 [0.0, 0.0] |
| 7.3 Weight loss of at least 10% during the last six months | 1 | 32 | Risk Ratio (M‐H, Random, 95% CI) | 0.88 [0.44, 1.78] |
| 7.4 Insufficient food intake during the last week (50% of requirements or less) | 0 | 0 | Risk Ratio (M‐H, Random, 95% CI) | 0.0 [0.0, 0.0] |
| 7.5 Participants characterised as 'at nutritional risk' by other means | 42 | 3903 | Risk Ratio (M‐H, Random, 95% CI) | 0.85 [0.74, 0.98] |
| 8 Serious adverse events ‐ participants characterised as 'at nutritional risk' due to biomarkers or anthropometrics Show forest plot | 43 | 3935 | Risk Ratio (M‐H, Random, 95% CI) | 0.85 [0.74, 0.98] |
| 8.1 Biomarkers | 3 | 551 | Risk Ratio (M‐H, Random, 95% CI) | 0.16 [0.02, 1.26] |
| 8.2 Anthropometric measures | 2 | 122 | Risk Ratio (M‐H, Random, 95% CI) | 0.71 [0.24, 2.08] |
| 8.3 Mixed | 0 | 0 | Risk Ratio (M‐H, Random, 95% CI) | 0.0 [0.0, 0.0] |
| 8.4 Characterised by other means | 38 | 3262 | Risk Ratio (M‐H, Random, 95% CI) | 0.86 [0.75, 1.00] |
| 9 Serious adverse events ‐ randomisation year Show forest plot | 43 | 3935 | Risk Ratio (M‐H, Random, 95% CI) | 0.85 [0.74, 0.98] |
| 9.1 Before 1960 | 0 | 0 | Risk Ratio (M‐H, Random, 95% CI) | 0.0 [0.0, 0.0] |
| 9.2 1960 to 1979 | 1 | 26 | Risk Ratio (M‐H, Random, 95% CI) | 1.36 [0.10, 19.50] |
| 9.3 1980 to 1999 | 28 | 2749 | Risk Ratio (M‐H, Random, 95% CI) | 0.92 [0.79, 1.08] |
| 9.4 After 1999 | 14 | 1160 | Risk Ratio (M‐H, Random, 95% CI) | 0.60 [0.43, 0.83] |
| 10 Serious adverse events ‐ trials where the intervention lasts fewer than three days compared with trials where the intervention lasts three days or more Show forest plot | 43 | 3935 | Risk Ratio (M‐H, Random, 95% CI) | 0.85 [0.74, 0.98] |
| 10.1 Three days or more | 37 | 3500 | Risk Ratio (M‐H, Random, 95% CI) | 0.86 [0.75, 1.00] |
| 10.2 Less than three days | 6 | 435 | Risk Ratio (M‐H, Random, 95% CI) | 0.71 [0.39, 1.27] |
| 10.3 Unknown | 0 | 0 | Risk Ratio (M‐H, Random, 95% CI) | 0.0 [0.0, 0.0] |
| 11 Serious adverse events ‐ 'best‐worst case' scenario Show forest plot | 43 | 3977 | Risk Ratio (M‐H, Random, 95% CI) | 0.82 [0.72, 0.94] |
| 12 Serious adverse events ‐ 'worst‐best case' scenario Show forest plot | 43 | 3977 | Risk Ratio (M‐H, Random, 95% CI) | 0.83 [0.70, 0.99] |
| 13 Serious adverse events co‐interventions Show forest plot | 43 | 3935 | Risk Ratio (M‐H, Fixed, 95% CI) | 0.83 [0.72, 0.95] |
| 13.1 received nutrition support as co‐intervention | 3 | 126 | Risk Ratio (M‐H, Fixed, 95% CI) | 0.66 [0.39, 1.12] |
| 13.2 did not receive nutrition support as co‐intervention | 34 | 3466 | Risk Ratio (M‐H, Fixed, 95% CI) | 0.83 [0.72, 0.96] |
| 13.3 delayed versus early nutrition support | 6 | 343 | Risk Ratio (M‐H, Fixed, 95% CI) | 0.93 [0.51, 1.69] |
| Outcome or subgroup title | No. of studies | No. of participants | Statistical method | Effect size |
| 1 Serious adverse events ‐ overall Show forest plot | 49 | 4425 | Risk Ratio (M‐H, Random, 95% CI) | 0.82 [0.73, 0.91] |
| 2 Serious adverse events ‐ bias Show forest plot | 49 | 4425 | Risk Ratio (M‐H, Random, 95% CI) | 0.82 [0.73, 0.91] |
| 2.1 High risk of bias | 49 | 4425 | Risk Ratio (M‐H, Random, 95% CI) | 0.82 [0.73, 0.91] |
| 2.2 Low risk of bias | 0 | 0 | Risk Ratio (M‐H, Random, 95% CI) | 0.0 [0.0, 0.0] |
| 3 Serious adverse events ‐ by medical speciality Show forest plot | 49 | 4425 | Risk Ratio (M‐H, Random, 95% CI) | 0.82 [0.73, 0.91] |
| 3.1 Cardiology | 0 | 0 | Risk Ratio (M‐H, Random, 95% CI) | 0.0 [0.0, 0.0] |
| 3.2 Medical gastroenterology and hepatology | 4 | 289 | Risk Ratio (M‐H, Random, 95% CI) | 0.89 [0.65, 1.23] |
| 3.3 Geriatrics | 0 | 0 | Risk Ratio (M‐H, Random, 95% CI) | 0.0 [0.0, 0.0] |
| 3.4 Pulmonary disease | 0 | 0 | Risk Ratio (M‐H, Random, 95% CI) | 0.0 [0.0, 0.0] |
| 3.5 Endocrinology | 0 | 0 | Risk Ratio (M‐H, Random, 95% CI) | 0.0 [0.0, 0.0] |
| 3.6 Infectious diseases | 1 | 56 | Risk Ratio (M‐H, Random, 95% CI) | 1.23 [0.52, 2.93] |
| 3.7 Rheumatology | 0 | 0 | Risk Ratio (M‐H, Random, 95% CI) | 0.0 [0.0, 0.0] |
| 3.8 Haematology | 0 | 0 | Risk Ratio (M‐H, Random, 95% CI) | 0.0 [0.0, 0.0] |
| 3.9 Nephrology | 0 | 0 | Risk Ratio (M‐H, Random, 95% CI) | 0.0 [0.0, 0.0] |
| 3.10 Gastroenterologic surgery | 21 | 1456 | Risk Ratio (M‐H, Random, 95% CI) | 0.68 [0.51, 0.91] |
| 3.11 Trauma surgery | 5 | 245 | Risk Ratio (M‐H, Random, 95% CI) | 0.58 [0.30, 1.11] |
| 3.12 Ortopaedics | 4 | 248 | Risk Ratio (M‐H, Random, 95% CI) | 0.91 [0.28, 2.96] |
| 3.13 Plastic, reconstructive, and aesthetic surgery | 0 | 0 | Risk Ratio (M‐H, Random, 95% CI) | 0.0 [0.0, 0.0] |
| 3.14 Vascular surgery | 1 | 13 | Risk Ratio (M‐H, Random, 95% CI) | 0.0 [0.0, 0.0] |
| 3.15 Transplant surgery | 0 | 0 | Risk Ratio (M‐H, Random, 95% CI) | 0.0 [0.0, 0.0] |
| 3.16 Urology | 0 | 0 | Risk Ratio (M‐H, Random, 95% CI) | 0.0 [0.0, 0.0] |
| 3.17 Thoracic surgery | 2 | 548 | Risk Ratio (M‐H, Random, 95% CI) | 0.15 [0.02, 1.27] |
| 3.18 Neurological surgery | 0 | 0 | Risk Ratio (M‐H, Random, 95% CI) | 0.0 [0.0, 0.0] |
| 3.19 Oro‐maxillo‐facial surgery | 1 | 32 | Risk Ratio (M‐H, Random, 95% CI) | 0.88 [0.44, 1.78] |
| 3.20 Anaesthesiology | 0 | 0 | Risk Ratio (M‐H, Random, 95% CI) | 0.0 [0.0, 0.0] |
| 3.21 Emergency medicine | 4 | 213 | Risk Ratio (M‐H, Random, 95% CI) | 0.92 [0.60, 1.40] |
| 3.22 Psychiatry | 0 | 0 | Risk Ratio (M‐H, Random, 95% CI) | 0.0 [0.0, 0.0] |
| 3.23 Neurology | 4 | 1172 | Risk Ratio (M‐H, Random, 95% CI) | 0.58 [0.34, 1.00] |
| 3.24 Oncology | 0 | 0 | Risk Ratio (M‐H, Random, 95% CI) | 0.0 [0.0, 0.0] |
| 3.25 Dermatology | 0 | 0 | Risk Ratio (M‐H, Random, 95% CI) | 0.0 [0.0, 0.0] |
| 3.26 Gynaecology | 0 | 0 | Risk Ratio (M‐H, Random, 95% CI) | 0.0 [0.0, 0.0] |
| 3.27 Mixed | 2 | 153 | Risk Ratio (M‐H, Random, 95% CI) | 0.63 [0.18, 2.21] |
| 4 Serious adverse events ‐ based on adequacy of the amount of calories Show forest plot | 49 | 4425 | Risk Ratio (M‐H, Random, 95% CI) | 0.82 [0.73, 0.91] |
| 4.1 Clearly adequate in intervention and clearly inadequate in control | 12 | 987 | Risk Ratio (M‐H, Random, 95% CI) | 0.72 [0.54, 0.96] |
| 4.2 Inadequate in the experimental or adequate in the control | 8 | 411 | Risk Ratio (M‐H, Random, 95% CI) | 0.86 [0.55, 1.35] |
| 4.3 Experimental group is overfed | 4 | 215 | Risk Ratio (M‐H, Random, 95% CI) | 0.77 [0.42, 1.42] |
| 4.4 Unclear intake in control or experimental | 25 | 2812 | Risk Ratio (M‐H, Random, 95% CI) | 0.75 [0.60, 0.94] |
| 5 Serious adverse events ‐ different screening tools Show forest plot | 49 | 4425 | Risk Ratio (M‐H, Random, 95% CI) | 0.82 [0.73, 0.91] |
| 5.1 NRS 2002 | 0 | 0 | Risk Ratio (M‐H, Random, 95% CI) | 0.0 [0.0, 0.0] |
| 5.2 MUST | 0 | 0 | Risk Ratio (M‐H, Random, 95% CI) | 0.0 [0.0, 0.0] |
| 5.3 MNA | 0 | 0 | Risk Ratio (M‐H, Random, 95% CI) | 0.0 [0.0, 0.0] |
| 5.4 SGA | 1 | 323 | Risk Ratio (M‐H, Random, 95% CI) | 0.38 [0.13, 1.06] |
| 5.5 Other means | 48 | 4102 | Risk Ratio (M‐H, Random, 95% CI) | 0.82 [0.74, 0.92] |
| 6 Serious adverse events ‐ participants characterised as 'at nutritional risk' due to one of the following conditions Show forest plot | 49 | 4425 | Risk Ratio (M‐H, Random, 95% CI) | 0.82 [0.73, 0.91] |
| 6.1 Major surgery | 26 | 2139 | Risk Ratio (M‐H, Random, 95% CI) | 0.67 [0.51, 0.88] |
| 6.2 Stroke | 4 | 1172 | Risk Ratio (M‐H, Random, 95% CI) | 0.58 [0.34, 1.00] |
| 6.3 ICU participants including trauma | 9 | 458 | Risk Ratio (M‐H, Random, 95% CI) | 0.80 [0.56, 1.14] |
| 6.4 Frail elderly participants with less severe conditions known to increase protein requirements | 2 | 126 | Risk Ratio (M‐H, Random, 95% CI) | 2.24 [0.05, 95.92] |
| 6.5 Participants do not fall into one of the categories above | 8 | 530 | Risk Ratio (M‐H, Random, 95% CI) | 0.90 [0.69, 1.19] |
| 7 Serious adverse events ‐ participants characterised as 'at nutritional risk' due to one of the following criteria Show forest plot | 49 | 4425 | Risk Ratio (M‐H, Random, 95% CI) | 0.82 [0.73, 0.91] |
| 7.1 BMI less than 20.5 kg/m2 | 0 | 0 | Risk Ratio (M‐H, Random, 95% CI) | 0.0 [0.0, 0.0] |
| 7.2 Weight loss of at least 5% during the last three months | 0 | 0 | Risk Ratio (M‐H, Random, 95% CI) | 0.0 [0.0, 0.0] |
| 7.3 Weight loss of at least 10% during the last six months | 1 | 32 | Risk Ratio (M‐H, Random, 95% CI) | 0.88 [0.44, 1.78] |
| 7.4 Insufficient food intake during the last week (50% of requirements or less) | 0 | 0 | Risk Ratio (M‐H, Random, 95% CI) | 0.0 [0.0, 0.0] |
| 7.5 Participants characterised as 'at nutritional risk' by other means | 48 | 4393 | Risk Ratio (M‐H, Random, 95% CI) | 0.81 [0.72, 0.91] |
| 8 Serious adverse events ‐ participants characterised as 'at nutritional risk' due to biomarkers or anthropometrics Show forest plot | 49 | 4425 | Risk Ratio (M‐H, Random, 95% CI) | 0.82 [0.73, 0.91] |
| 8.1 Biomarkers | 3 | 551 | Risk Ratio (M‐H, Random, 95% CI) | 0.16 [0.02, 1.26] |
| 8.2 Anthropometric measures | 2 | 122 | Risk Ratio (M‐H, Random, 95% CI) | 0.71 [0.24, 2.08] |
| 8.3 Both | 0 | 0 | Risk Ratio (M‐H, Random, 95% CI) | 0.0 [0.0, 0.0] |
| 8.4 Characterised by other means | 44 | 3752 | Risk Ratio (M‐H, Random, 95% CI) | 0.82 [0.74, 0.92] |
| 9 Serious adverse events ‐ randomisation year Show forest plot | 49 | 4425 | Risk Ratio (M‐H, Random, 95% CI) | 0.82 [0.73, 0.91] |
| 9.1 Before 1960 | 0 | 0 | Risk Ratio (M‐H, Random, 95% CI) | 0.0 [0.0, 0.0] |
| 9.2 1960 to 1979 | 1 | 26 | Risk Ratio (M‐H, Random, 95% CI) | 1.36 [0.10, 19.50] |
| 9.3 1980 to 1999 | 28 | 2591 | Risk Ratio (M‐H, Random, 95% CI) | 0.88 [0.77, 1.00] |
| 9.4 After 1999 | 20 | 1808 | Risk Ratio (M‐H, Random, 95% CI) | 0.70 [0.58, 0.85] |
| 10 Serious adverse events ‐ trials where the intervention lasts fewer than three days compared with trials where the intervention lasts three days or more Show forest plot | 49 | 4425 | Risk Ratio (M‐H, Random, 95% CI) | 0.82 [0.73, 0.91] |
| 10.1 Three days or more | 41 | 3893 | Risk Ratio (M‐H, Random, 95% CI) | 0.77 [0.66, 0.89] |
| 10.2 Less than three days | 8 | 532 | Risk Ratio (M‐H, Random, 95% CI) | 0.86 [0.60, 1.22] |
| 10.3 Unknown | 0 | 0 | Risk Ratio (M‐H, Random, 95% CI) | 0.0 [0.0, 0.0] |
| 11 Serious adverse events co‐interventions Show forest plot | 49 | 4425 | Risk Ratio (M‐H, Fixed, 95% CI) | 0.78 [0.70, 0.87] |
| 11.1 Received nutrition support as co‐intervention | 3 | 126 | Risk Ratio (M‐H, Fixed, 95% CI) | 0.66 [0.39, 1.12] |
| 11.2 did not receive nutrition support as co‐intervention | 39 | 3918 | Risk Ratio (M‐H, Fixed, 95% CI) | 0.77 [0.68, 0.86] |
| 11.3 delayed versus early nutrition support | 7 | 381 | Risk Ratio (M‐H, Fixed, 95% CI) | 1.06 [0.68, 1.64] |
| 12 Serious adverse events ‐ 'best‐worse case' scenario (enteral nutrition) Show forest plot | 48 | 4489 | Risk Ratio (M‐H, Random, 95% CI) | 0.62 [0.51, 0.75] |
| 13 Serious adverse events ‐ 'worst‐best case' scenario (enteral nutrition) Show forest plot | 48 | 4489 | Risk Ratio (M‐H, Random, 95% CI) | 0.81 [0.69, 0.95] |
| Outcome or subgroup title | No. of studies | No. of participants | Statistical method | Effect size |
| 1 All‐cause mortality ‐ overall Show forest plot | 43 | 7313 | Risk Ratio (M‐H, Random, 95% CI) | 0.98 [0.83, 1.16] |
| 2 All‐cause mortality ‐ bias Show forest plot | 43 | 7313 | Risk Ratio (M‐H, Random, 95% CI) | 0.98 [0.83, 1.16] |
| 2.1 High risk of bias | 43 | 7313 | Risk Ratio (M‐H, Random, 95% CI) | 0.98 [0.83, 1.16] |
| 2.2 Low risk of bias | 0 | 0 | Risk Ratio (M‐H, Random, 95% CI) | 0.0 [0.0, 0.0] |
| 3 All‐cause mortality ‐ medical speciality Show forest plot | 43 | 7313 | Risk Ratio (M‐H, Random, 95% CI) | 0.98 [0.83, 1.16] |
| 3.1 Cardiology | 0 | 0 | Risk Ratio (M‐H, Random, 95% CI) | 0.0 [0.0, 0.0] |
| 3.2 Medical gastroenterology and hepatology | 7 | 259 | Risk Ratio (M‐H, Random, 95% CI) | 1.17 [0.58, 2.37] |
| 3.3 Geriatrics | 0 | 0 | Risk Ratio (M‐H, Random, 95% CI) | 0.0 [0.0, 0.0] |
| 3.4 Pulmonary disease | 1 | 25 | Risk Ratio (M‐H, Random, 95% CI) | 0.22 [0.01, 4.08] |
| 3.5 Endocrinology | 0 | 0 | Risk Ratio (M‐H, Random, 95% CI) | 0.0 [0.0, 0.0] |
| 3.6 Infectious diseases | 0 | 0 | Risk Ratio (M‐H, Random, 95% CI) | 0.0 [0.0, 0.0] |
| 3.7 Rheumatology | 0 | 0 | Risk Ratio (M‐H, Random, 95% CI) | 0.0 [0.0, 0.0] |
| 3.8 Haematology | 0 | 0 | Risk Ratio (M‐H, Random, 95% CI) | 0.0 [0.0, 0.0] |
| 3.9 Nephrology | 0 | 0 | Risk Ratio (M‐H, Random, 95% CI) | 0.0 [0.0, 0.0] |
| 3.10 Gastroenterologic surgery | 21 | 1553 | Risk Ratio (M‐H, Random, 95% CI) | 0.79 [0.52, 1.20] |
| 3.11 Trauma surgery | 2 | 45 | Risk Ratio (M‐H, Random, 95% CI) | 1.22 [0.66, 2.25] |
| 3.12 Orthopaedics | 0 | 0 | Risk Ratio (M‐H, Random, 95% CI) | 0.0 [0.0, 0.0] |
| 3.13 Plastic, reconstructive and aesthetic surgery | 0 | 0 | Risk Ratio (M‐H, Random, 95% CI) | 0.0 [0.0, 0.0] |
| 3.14 Vascular surgery | 1 | 15 | Risk Ratio (M‐H, Random, 95% CI) | 0.0 [0.0, 0.0] |
| 3.15 Transplant surgery | 2 | 47 | Risk Ratio (M‐H, Random, 95% CI) | 0.61 [0.23, 1.65] |
| 3.16 Urology | 0 | 0 | Risk Ratio (M‐H, Random, 95% CI) | 0.0 [0.0, 0.0] |
| 3.17 Thoracic surgery | 1 | 44 | Risk Ratio (M‐H, Random, 95% CI) | 1.6 [0.40, 6.32] |
| 3.18 Neurological surgery | 0 | 0 | Risk Ratio (M‐H, Random, 95% CI) | 0.0 [0.0, 0.0] |
| 3.19 Oro‐maxillo‐facial surgery | 0 | 0 | Risk Ratio (M‐H, Random, 95% CI) | 0.0 [0.0, 0.0] |
| 3.20 Anaesthesiology | 0 | 0 | Risk Ratio (M‐H, Random, 95% CI) | 0.0 [0.0, 0.0] |
| 3.21 Emergency medicine | 4 | 5044 | Risk Ratio (M‐H, Random, 95% CI) | 1.00 [0.81, 1.24] |
| 3.22 Psychiatry | 0 | 0 | Risk Ratio (M‐H, Random, 95% CI) | 0.0 [0.0, 0.0] |
| 3.23 Neurology | 0 | 0 | Risk Ratio (M‐H, Random, 95% CI) | 0.0 [0.0, 0.0] |
| 3.24 Oncology | 4 | 281 | Risk Ratio (M‐H, Random, 95% CI) | 1.19 [0.44, 3.21] |
| 3.25 Dermatology | 0 | 0 | Risk Ratio (M‐H, Random, 95% CI) | 0.0 [0.0, 0.0] |
| 3.26 Gynaecology | 0 | 0 | Risk Ratio (M‐H, Random, 95% CI) | 0.0 [0.0, 0.0] |
| 3.27 Mixed | 0 | 0 | Risk Ratio (M‐H, Random, 95% CI) | 0.0 [0.0, 0.0] |
| 4 All‐cause mortality ‐ based on adequacy of the amount of calories Show forest plot | 43 | 7313 | Risk Ratio (M‐H, Random, 95% CI) | 0.98 [0.83, 1.16] |
| 4.1 Clearly adequate in experimental group and clearly inadequate in control group | 7 | 5641 | Risk Ratio (M‐H, Random, 95% CI) | 0.98 [0.80, 1.20] |
| 4.2 Inadequate in the experimental group or adequate in the control group | 1 | 53 | Risk Ratio (M‐H, Random, 95% CI) | 1.16 [0.40, 3.33] |
| 4.3 Experimental group is overfed | 0 | 0 | Risk Ratio (M‐H, Random, 95% CI) | 0.0 [0.0, 0.0] |
| 4.4 Unclear intake in experimental group or control group | 35 | 1619 | Risk Ratio (M‐H, Random, 95% CI) | 0.95 [0.68, 1.32] |
| 5 All‐cause mortality ‐ different screening tools Show forest plot | 43 | 7313 | Risk Ratio (M‐H, Random, 95% CI) | 0.98 [0.83, 1.16] |
| 5.1 NRS 2002 | 1 | 4640 | Risk Ratio (M‐H, Random, 95% CI) | 1.04 [0.83, 1.30] |
| 5.2 MUST | 0 | 0 | Risk Ratio (M‐H, Random, 95% CI) | 0.0 [0.0, 0.0] |
| 5.3 MNA | 0 | 0 | Risk Ratio (M‐H, Random, 95% CI) | 0.0 [0.0, 0.0] |
| 5.4 SGA | 1 | 323 | Risk Ratio (M‐H, Random, 95% CI) | 0.75 [0.13, 4.44] |
| 5.5 Other means | 41 | 2350 | Risk Ratio (M‐H, Random, 95% CI) | 0.90 [0.69, 1.17] |
| 6 All‐cause mortality ‐ participants characterised as 'at nutritional risk' due to one of the following conditions Show forest plot | 43 | 7313 | Risk Ratio (M‐H, Random, 95% CI) | 0.98 [0.83, 1.16] |
| 6.1 Major surgery | 26 | 1822 | Risk Ratio (M‐H, Random, 95% CI) | 0.80 [0.56, 1.15] |
| 6.2 Stroke | 0 | 0 | Risk Ratio (M‐H, Random, 95% CI) | 0.0 [0.0, 0.0] |
| 6.3 ICU participants including trauma | 6 | 5089 | Risk Ratio (M‐H, Random, 95% CI) | 1.02 [0.84, 1.25] |
| 6.4 Frail elderly participants with less severe conditions known to increase protein requirements | 1 | 34 | Risk Ratio (M‐H, Random, 95% CI) | 3.35 [0.15, 76.93] |
| 6.5 Participants do not fall into one of the categories above | 10 | 368 | Risk Ratio (M‐H, Random, 95% CI) | 1.12 [0.60, 2.10] |
| 7 All‐cause mortality ‐ participants characterised as 'at nutritional risk' due to one of the following criteria Show forest plot | 43 | 7313 | Risk Ratio (M‐H, Random, 95% CI) | 0.98 [0.83, 1.16] |
| 7.1 BMI less than 20.5 kg/m2 | 0 | 0 | Risk Ratio (M‐H, Random, 95% CI) | 0.0 [0.0, 0.0] |
| 7.2 Weight loss of at least 5% during the last three months | 0 | 0 | Risk Ratio (M‐H, Random, 95% CI) | 0.0 [0.0, 0.0] |
| 7.3 Weight loss of at least 10% during the last six months | 0 | 0 | Risk Ratio (M‐H, Random, 95% CI) | 0.0 [0.0, 0.0] |
| 7.4 Insufficient food intake during the last week (50% of requirements or less) | 0 | 0 | Risk Ratio (M‐H, Random, 95% CI) | 0.0 [0.0, 0.0] |
| 7.5 Participants characterised as 'at nutritional risk' by other means | 43 | 7313 | Risk Ratio (M‐H, Random, 95% CI) | 0.98 [0.83, 1.16] |
| 8 All‐cause mortality ‐ participants characterised as 'at nutritional risk' due to biomarkers or anthropometrics Show forest plot | 43 | 7313 | Risk Ratio (M‐H, Random, 95% CI) | 0.98 [0.83, 1.16] |
| 8.1 Biomarkers | 2 | 43 | Risk Ratio (M‐H, Random, 95% CI) | 0.22 [0.01, 4.08] |
| 8.2 Anthropometric measures | 3 | 137 | Risk Ratio (M‐H, Random, 95% CI) | 1.31 [0.38, 4.58] |
| 8.3 Both | 3 | 75 | Risk Ratio (M‐H, Random, 95% CI) | 0.66 [0.14, 3.07] |
| 8.4 Characterised by other means | 35 | 7058 | Risk Ratio (M‐H, Random, 95% CI) | 0.98 [0.83, 1.17] |
| 9 All‐cause mortality ‐ randomisation year Show forest plot | 43 | 7313 | Risk Ratio (M‐H, Random, 95% CI) | 0.98 [0.83, 1.16] |
| 9.1 Before 1960 | 0 | 0 | Risk Ratio (M‐H, Random, 95% CI) | 0.0 [0.0, 0.0] |
| 9.2 1960‐1979 | 3 | 95 | Risk Ratio (M‐H, Random, 95% CI) | 1.85 [0.58, 5.88] |
| 9.3 1980‐1999 | 34 | 1694 | Risk Ratio (M‐H, Random, 95% CI) | 0.91 [0.68, 1.21] |
| 9.4 After 1999 | 6 | 5524 | Risk Ratio (M‐H, Random, 95% CI) | 1.00 [0.81, 1.23] |
| 10 All‐cause mortality ‐ trials where the intervention lasts fewer than three days compared with trials where the intervention lasts three days or more Show forest plot | 43 | 7313 | Risk Ratio (M‐H, Random, 95% CI) | 0.98 [0.83, 1.16] |
| 10.1 Three days or more | 41 | 7206 | Risk Ratio (M‐H, Random, 95% CI) | 0.98 [0.83, 1.16] |
| 10.2 Less than three days | 1 | 80 | Risk Ratio (M‐H, Random, 95% CI) | 0.67 [0.12, 3.78] |
| 10.3 Unknown | 1 | 27 | Risk Ratio (M‐H, Random, 95% CI) | 0.0 [0.0, 0.0] |
| 11 All‐cause mortality ‐ 'best‐worst case' scenario Show forest plot | 43 | 7432 | Risk Ratio (M‐H, Random, 95% CI) | 0.73 [0.56, 0.97] |
| 12 All‐cause mortality ‐ 'worst‐best case' scenario Show forest plot | 43 | 7432 | Risk Ratio (M‐H, Random, 95% CI) | 1.20 [0.98, 1.47] |
| 13 All‐cause mortality co‐interventions Show forest plot | 43 | 7313 | Risk Ratio (M‐H, Fixed, 95% CI) | 0.98 [0.82, 1.16] |
| 13.1 received nutrition support as co‐intervention | 6 | 5066 | Risk Ratio (M‐H, Fixed, 95% CI) | 1.03 [0.83, 1.26] |
| 13.2 did not receive nutrition support as co‐intervention | 36 | 2167 | Risk Ratio (M‐H, Fixed, 95% CI) | 0.88 [0.66, 1.18] |
| 13.3 delayed versus early nutrition support | 1 | 80 | Risk Ratio (M‐H, Fixed, 95% CI) | 0.67 [0.12, 3.78] |
| Outcome or subgroup title | No. of studies | No. of participants | Statistical method | Effect size |
| 1 All‐cause mortality ‐ overall Show forest plot | 51 | 8121 | Risk Ratio (M‐H, Random, 95% CI) | 0.99 [0.90, 1.09] |
| 2 All‐cause mortality ‐ bias Show forest plot | 51 | 8121 | Risk Ratio (M‐H, Random, 95% CI) | 0.99 [0.90, 1.09] |
| 2.1 High risk of bias | 51 | 8121 | Risk Ratio (M‐H, Random, 95% CI) | 0.99 [0.90, 1.09] |
| 2.2 Low risk of bias | 0 | 0 | Risk Ratio (M‐H, Random, 95% CI) | 0.0 [0.0, 0.0] |
| 3 All‐cause mortality ‐ medical speciality Show forest plot | 51 | 8121 | Risk Ratio (M‐H, Random, 95% CI) | 0.99 [0.90, 1.09] |
| 3.1 Cardiology | 0 | 0 | Risk Ratio (M‐H, Random, 95% CI) | 0.0 [0.0, 0.0] |
| 3.2 Medical gastroenterology and hepatology | 7 | 254 | Risk Ratio (M‐H, Random, 95% CI) | 1.02 [0.74, 1.42] |
| 3.3 Geriatrics | 0 | 0 | Risk Ratio (M‐H, Random, 95% CI) | 0.0 [0.0, 0.0] |
| 3.4 Pulmonary disease | 1 | 25 | Risk Ratio (M‐H, Random, 95% CI) | 0.22 [0.01, 4.08] |
| 3.5 Endocrinology | 0 | 0 | Risk Ratio (M‐H, Random, 95% CI) | 0.0 [0.0, 0.0] |
| 3.6 Infectious diseases | 0 | 0 | Risk Ratio (M‐H, Random, 95% CI) | 0.0 [0.0, 0.0] |
| 3.7 Rheumatology | 0 | 0 | Risk Ratio (M‐H, Random, 95% CI) | 0.0 [0.0, 0.0] |
| 3.8 Haematology | 0 | 0 | Risk Ratio (M‐H, Random, 95% CI) | 0.0 [0.0, 0.0] |
| 3.9 Nephrology | 0 | 0 | Risk Ratio (M‐H, Random, 95% CI) | 0.0 [0.0, 0.0] |
| 3.10 Gastroenterologic surgery | 24 | 2104 | Risk Ratio (M‐H, Random, 95% CI) | 0.93 [0.68, 1.28] |
| 3.11 Trauma surgery | 2 | 45 | Risk Ratio (M‐H, Random, 95% CI) | 1.22 [0.66, 2.25] |
| 3.12 Ortopaedics | 0 | 0 | Risk Ratio (M‐H, Random, 95% CI) | 0.0 [0.0, 0.0] |
| 3.13 Plastic, reconstructive, and aesthetic surgery | 0 | 0 | Risk Ratio (M‐H, Random, 95% CI) | 0.0 [0.0, 0.0] |
| 3.14 Vascular surgery | 1 | 15 | Risk Ratio (M‐H, Random, 95% CI) | 0.0 [0.0, 0.0] |
| 3.15 Transplant surgery | 2 | 47 | Risk Ratio (M‐H, Random, 95% CI) | 0.56 [0.22, 1.42] |
| 3.16 Urology | 0 | 0 | Risk Ratio (M‐H, Random, 95% CI) | 0.0 [0.0, 0.0] |
| 3.17 Thoracic surgery | 1 | 44 | Risk Ratio (M‐H, Random, 95% CI) | 1.6 [0.40, 6.32] |
| 3.18 Neurological surgery | 0 | 0 | Risk Ratio (M‐H, Random, 95% CI) | 0.0 [0.0, 0.0] |
| 3.19 Oro‐maxillo‐facial surgery | 0 | 0 | Risk Ratio (M‐H, Random, 95% CI) | 0.0 [0.0, 0.0] |
| 3.20 Anaesthesiology | 0 | 0 | Risk Ratio (M‐H, Random, 95% CI) | 0.0 [0.0, 0.0] |
| 3.21 Emergency medicine | 7 | 5208 | Risk Ratio (M‐H, Random, 95% CI) | 0.97 [0.84, 1.12] |
| 3.22 Psychiatry | 0 | 0 | Risk Ratio (M‐H, Random, 95% CI) | 0.0 [0.0, 0.0] |
| 3.23 Neurology | 0 | 0 | Risk Ratio (M‐H, Random, 95% CI) | 0.0 [0.0, 0.0] |
| 3.24 Oncology | 6 | 379 | Risk Ratio (M‐H, Random, 95% CI) | 1.03 [0.87, 1.21] |
| 3.25 Dermatology | 0 | 0 | Risk Ratio (M‐H, Random, 95% CI) | 0.0 [0.0, 0.0] |
| 3.26 Gynaecology | 0 | 0 | Risk Ratio (M‐H, Random, 95% CI) | 0.0 [0.0, 0.0] |
| 3.27 Mixed | 0 | 0 | Risk Ratio (M‐H, Random, 95% CI) | 0.0 [0.0, 0.0] |
| 4 All‐cause mortality ‐ based on adequacy of the amount of calories Show forest plot | 51 | 8121 | Risk Ratio (M‐H, Random, 95% CI) | 0.99 [0.90, 1.09] |
| 4.1 Clearly adequate in intervention and clearly inadequate in control | 7 | 5641 | Risk Ratio (M‐H, Random, 95% CI) | 0.98 [0.88, 1.10] |
| 4.2 Inadequate in the experimental or adequate in the control | 4 | 165 | Risk Ratio (M‐H, Random, 95% CI) | 1.17 [0.80, 1.72] |
| 4.3 Experimental group is overfed | 4 | 272 | Risk Ratio (M‐H, Random, 95% CI) | 0.56 [0.23, 1.34] |
| 4.4 Unclear intake in control or experimental | 36 | 2043 | Risk Ratio (M‐H, Random, 95% CI) | 0.99 [0.80, 1.22] |
| 5 All‐cause mortality ‐ different screening tools Show forest plot | 51 | 8121 | Risk Ratio (M‐H, Random, 95% CI) | 0.99 [0.90, 1.09] |
| 5.1 NRS 2002 | 1 | 4640 | Risk Ratio (M‐H, Random, 95% CI) | 1.00 [0.85, 1.18] |
| 5.2 MUST | 0 | 0 | Risk Ratio (M‐H, Random, 95% CI) | 0.0 [0.0, 0.0] |
| 5.3 MNA | 0 | 0 | Risk Ratio (M‐H, Random, 95% CI) | 0.0 [0.0, 0.0] |
| 5.4 SGA | 1 | 323 | Risk Ratio (M‐H, Random, 95% CI) | 0.75 [0.13, 4.44] |
| 5.5 Other means | 49 | 3158 | Risk Ratio (M‐H, Random, 95% CI) | 0.98 [0.88, 1.11] |
| 6 All‐cause mortality ‐ participants characterised as 'at nutritional risk' due to one of the following conditions Show forest plot | 51 | 8121 | Risk Ratio (M‐H, Random, 95% CI) | 0.99 [0.90, 1.09] |
| 6.1 Major surgery | 30 | 2381 | Risk Ratio (M‐H, Random, 95% CI) | 0.88 [0.67, 1.15] |
| 6.2 Stroke | 0 | 0 | Risk Ratio (M‐H, Random, 95% CI) | 0.0 [0.0, 0.0] |
| 6.3 ICU participants including trauma | 7 | 5209 | Risk Ratio (M‐H, Random, 95% CI) | 0.99 [0.86, 1.14] |
| 6.4 Frail elderly participants with less severe conditions known to increase protein requirements | 1 | 34 | Risk Ratio (M‐H, Random, 95% CI) | 3.35 [0.15, 76.93] |
| 6.5 Participants do not fall into one of the categories above | 13 | 497 | Risk Ratio (M‐H, Random, 95% CI) | 1.02 [0.88, 1.18] |
| 7 All‐cause mortality ‐ participants characterised as 'at nutritional risk' due to one of the following criteria Show forest plot | 51 | 8121 | Risk Ratio (M‐H, Random, 95% CI) | 0.99 [0.90, 1.09] |
| 7.1 BMI less than 20.5 kg/m2 | 0 | 0 | Risk Ratio (M‐H, Random, 95% CI) | 0.0 [0.0, 0.0] |
| 7.2 Weight loss of at least 5% during the last three months | 0 | 0 | Risk Ratio (M‐H, Random, 95% CI) | 0.0 [0.0, 0.0] |
| 7.3 Weight loss of at least 10% during the last six months | 2 | 92 | Risk Ratio (M‐H, Random, 95% CI) | 0.33 [0.01, 7.78] |
| 7.4 Insufficient food intake during the last week (50% of requirements or less) | 0 | 0 | Risk Ratio (M‐H, Random, 95% CI) | 0.0 [0.0, 0.0] |
| 7.5 Participants characterised as 'at nutritional risk' by other means | 49 | 8029 | Risk Ratio (M‐H, Random, 95% CI) | 0.99 [0.90, 1.09] |
| 8 All‐cause mortality ‐ participants characterised as 'at nutritional risk' due to biomarkers or anthropometrics Show forest plot | 51 | 8121 | Risk Ratio (M‐H, Random, 95% CI) | 0.99 [0.90, 1.09] |
| 8.1 Biomarkers | 5 | 169 | Risk Ratio (M‐H, Random, 95% CI) | 0.47 [0.10, 2.12] |
| 8.2 Anthropometric measures | 3 | 137 | Risk Ratio (M‐H, Random, 95% CI) | 0.93 [0.32, 2.75] |
| 8.3 Both anthropometrics and biomarkers | 3 | 75 | Risk Ratio (M‐H, Random, 95% CI) | 0.66 [0.14, 3.07] |
| 8.4 Characterised by other means | 40 | 7740 | Risk Ratio (M‐H, Random, 95% CI) | 0.99 [0.90, 1.09] |
| 9 All‐cause mortality ‐ randomisation year Show forest plot | 51 | 8121 | Risk Ratio (M‐H, Random, 95% CI) | 0.99 [0.90, 1.09] |
| 9.1 Before 1960 | 0 | 0 | Risk Ratio (M‐H, Random, 95% CI) | 0.0 [0.0, 0.0] |
| 9.2 1960 to 1979 | 4 | 151 | Risk Ratio (M‐H, Random, 95% CI) | 1.50 [0.56, 4.03] |
| 9.3 1980 to 1999 | 41 | 2446 | Risk Ratio (M‐H, Random, 95% CI) | 0.99 [0.88, 1.12] |
| 9.4 After 1999 | 6 | 5524 | Risk Ratio (M‐H, Random, 95% CI) | 0.98 [0.84, 1.13] |
| 10 All‐cause mortality ‐ trials where the intervention lasts fewer than three days compared with trials where the intervention lasts three days or more Show forest plot | 51 | 8121 | Risk Ratio (M‐H, Random, 95% CI) | 0.99 [0.90, 1.09] |
| 10.1 Three days or more | 49 | 8014 | Risk Ratio (M‐H, Random, 95% CI) | 0.99 [0.89, 1.08] |
| 10.2 Less than three days | 1 | 80 | Risk Ratio (M‐H, Random, 95% CI) | 1.2 [0.59, 2.45] |
| 10.3 Unknown | 1 | 27 | Risk Ratio (M‐H, Random, 95% CI) | 0.0 [0.0, 0.0] |
| 11 All‐cause mortality ‐ 'best‐worst case' scenario Show forest plot | 51 | 8240 | Risk Ratio (M‐H, Random, 95% CI) | 0.87 [0.74, 1.02] |
| 12 All‐cause mortality ‐ 'worst‐best case' scenario Show forest plot | 51 | 8240 | Risk Ratio (M‐H, Random, 95% CI) | 1.06 [0.95, 1.19] |
| 13 All‐cause mortality co‐interventions Show forest plot | 51 | 8121 | Risk Ratio (M‐H, Fixed, 95% CI) | 0.97 [0.87, 1.09] |
| 13.1 received nutrition support as co‐intervention | 5 | 5044 | Risk Ratio (M‐H, Fixed, 95% CI) | 0.97 [0.84, 1.13] |
| 13.2 did not receive nutrition support as co‐intervention | 45 | 2997 | Risk Ratio (M‐H, Fixed, 95% CI) | 0.96 [0.81, 1.14] |
| 13.3 delayed versus early nutrition support | 1 | 80 | Risk Ratio (M‐H, Fixed, 95% CI) | 1.2 [0.59, 2.45] |
| Outcome or subgroup title | No. of studies | No. of participants | Statistical method | Effect size |
| 1 Serious adverse events ‐ overall Show forest plot | 48 | 7519 | Risk Ratio (M‐H, Random, 95% CI) | 0.98 [0.85, 1.14] |
| 2 Serious adverse events ‐ bias Show forest plot | 48 | 7519 | Risk Ratio (M‐H, Random, 95% CI) | 0.98 [0.85, 1.14] |
| 2.1 High risk of bias | 48 | 7519 | Risk Ratio (M‐H, Random, 95% CI) | 0.98 [0.85, 1.14] |
| 2.2 Low risk of bias | 0 | 0 | Risk Ratio (M‐H, Random, 95% CI) | 0.0 [0.0, 0.0] |
| 3 Serious adverse events ‐ by medical specialty Show forest plot | 48 | 7519 | Risk Ratio (M‐H, Random, 95% CI) | 0.98 [0.85, 1.14] |
| 3.1 Cardiology | 0 | 0 | Risk Ratio (M‐H, Random, 95% CI) | 0.0 [0.0, 0.0] |
| 3.2 Medical gastroenterology and hepatology | 7 | 259 | Risk Ratio (M‐H, Random, 95% CI) | 1.29 [0.73, 2.29] |
| 3.3 High risk | 0 | 0 | Risk Ratio (M‐H, Random, 95% CI) | 0.0 [0.0, 0.0] |
| 3.4 Geriatrics | 0 | 0 | Risk Ratio (M‐H, Random, 95% CI) | 0.0 [0.0, 0.0] |
| 3.5 Pulmonary disease | 1 | 25 | Risk Ratio (M‐H, Random, 95% CI) | 0.22 [0.01, 4.08] |
| 3.6 Endocrinology | 0 | 0 | Risk Ratio (M‐H, Random, 95% CI) | 0.0 [0.0, 0.0] |
| 3.7 Infectious diseases | 0 | 0 | Risk Ratio (M‐H, Random, 95% CI) | 0.0 [0.0, 0.0] |
| 3.8 Rheumatology | 0 | 0 | Risk Ratio (M‐H, Random, 95% CI) | 0.0 [0.0, 0.0] |
| 3.9 Haematology | 0 | 0 | Risk Ratio (M‐H, Random, 95% CI) | 0.0 [0.0, 0.0] |
| 3.10 Nephrology | 0 | 0 | Risk Ratio (M‐H, Random, 95% CI) | 0.0 [0.0, 0.0] |
| 3.11 Gastroenterologic surgery | 24 | 1663 | Risk Ratio (M‐H, Random, 95% CI) | 0.78 [0.56, 1.10] |
| 3.12 Trauma surgery | 2 | 45 | Risk Ratio (M‐H, Random, 95% CI) | 1.22 [0.66, 2.25] |
| 3.13 Ortopaedics | 1 | 80 | Risk Ratio (M‐H, Random, 95% CI) | 0.0 [0.0, 0.0] |
| 3.14 Plastic, reconstructive, and aesthetic surgery | 0 | 0 | Risk Ratio (M‐H, Random, 95% CI) | 0.0 [0.0, 0.0] |
| 3.15 Vascular surgery | 2 | 35 | Risk Ratio (M‐H, Random, 95% CI) | 0.5 [0.05, 4.67] |
| 3.16 Transplant surgery | 2 | 47 | Risk Ratio (M‐H, Random, 95% CI) | 0.61 [0.23, 1.65] |
| 3.17 Urology | 0 | 0 | Risk Ratio (M‐H, Random, 95% CI) | 0.0 [0.0, 0.0] |
| 3.18 Thoracic surgery | 1 | 44 | Risk Ratio (M‐H, Random, 95% CI) | 1.6 [0.40, 6.32] |
| 3.19 Neurological surgery | 0 | 0 | Risk Ratio (M‐H, Random, 95% CI) | 0.0 [0.0, 0.0] |
| 3.20 Oro‐maxillo‐facial surgery | 0 | 0 | Risk Ratio (M‐H, Random, 95% CI) | 0.0 [0.0, 0.0] |
| 3.21 Anaesthesiology | 0 | 0 | Risk Ratio (M‐H, Random, 95% CI) | 0.0 [0.0, 0.0] |
| 3.22 Emergency medicine | 4 | 5044 | Risk Ratio (M‐H, Random, 95% CI) | 1.00 [0.81, 1.24] |
| 3.23 Psychiatry | 0 | 0 | Risk Ratio (M‐H, Random, 95% CI) | 0.0 [0.0, 0.0] |
| 3.24 Neurology | 0 | 0 | Risk Ratio (M‐H, Random, 95% CI) | 0.0 [0.0, 0.0] |
| 3.25 Oncology | 4 | 277 | Risk Ratio (M‐H, Random, 95% CI) | 1.12 [0.51, 2.44] |
| 3.26 Dermatology | 0 | 0 | Risk Ratio (M‐H, Random, 95% CI) | 0.0 [0.0, 0.0] |
| 3.27 Gynaecology | 0 | 0 | Risk Ratio (M‐H, Random, 95% CI) | 0.0 [0.0, 0.0] |
| 3.28 Mixed | 0 | 0 | Risk Ratio (M‐H, Random, 95% CI) | 0.0 [0.0, 0.0] |
| 4 Serious adverse events ‐ based on adequacy of the amount of calories Show forest plot | 48 | 7519 | Risk Ratio (M‐H, Random, 95% CI) | 0.98 [0.85, 1.14] |
| 4.1 Clearly adequate in intervention and clearly inadequate in control | 9 | 5736 | Risk Ratio (M‐H, Random, 95% CI) | 0.98 [0.80, 1.19] |
| 4.2 Inadequate in the experimental or adequate in the control | 5 | 218 | Risk Ratio (M‐H, Random, 95% CI) | 1.20 [0.74, 1.95] |
| 4.3 Experimental group is overfed | 1 | 124 | Risk Ratio (M‐H, Random, 95% CI) | 0.52 [0.19, 1.47] |
| 4.4 Unclear intake in control or experimental | 33 | 1441 | Risk Ratio (M‐H, Random, 95% CI) | 0.89 [0.65, 1.23] |
| 5 Serious adverse events ‐ different screening tools Show forest plot | 48 | 7519 | Risk Ratio (M‐H, Random, 95% CI) | 0.98 [0.85, 1.14] |
| 5.1 NRS 2002 | 1 | 4640 | Risk Ratio (M‐H, Random, 95% CI) | 1.04 [0.83, 1.30] |
| 5.2 MUST | 0 | 0 | Risk Ratio (M‐H, Random, 95% CI) | 0.0 [0.0, 0.0] |
| 5.3 MNA | 0 | 0 | Risk Ratio (M‐H, Random, 95% CI) | 0.0 [0.0, 0.0] |
| 5.4 SGA | 1 | 323 | Risk Ratio (M‐H, Random, 95% CI) | 0.72 [0.28, 1.83] |
| 5.5 Other means | 46 | 2556 | Risk Ratio (M‐H, Random, 95% CI) | 0.95 [0.77, 1.17] |
| 6 Serious adverse events ‐ participants characterised as 'at nutritional risk' due to one of the following conditions Show forest plot | 48 | 7519 | Risk Ratio (M‐H, Random, 95% CI) | 0.98 [0.85, 1.14] |
| 6.1 Major surgery | 30 | 1952 | Risk Ratio (M‐H, Random, 95% CI) | 0.86 [0.66, 1.13] |
| 6.2 Stroke | 0 | 0 | Risk Ratio (M‐H, Random, 95% CI) | 0.0 [0.0, 0.0] |
| 6.3 ICU participants including trauma | 6 | 5089 | Risk Ratio (M‐H, Random, 95% CI) | 1.02 [0.84, 1.25] |
| 6.4 Frail elderly participants with less severe conditions known to increase protein requirements | 2 | 114 | Risk Ratio (M‐H, Random, 95% CI) | 0.56 [0.06, 5.63] |
| 6.5 Participants do not fall into one of the categories above | 10 | 364 | Risk Ratio (M‐H, Random, 95% CI) | 1.18 [0.69, 2.02] |
| 7 Serious adverse events ‐ participants characterised as 'at nutritional risk' due to one of the following criteria Show forest plot | 48 | 7519 | Risk Ratio (M‐H, Random, 95% CI) | 0.98 [0.85, 1.14] |
| 7.1 BMI less than 20.5 kg/m2 | 0 | 0 | Risk Ratio (M‐H, Random, 95% CI) | 0.0 [0.0, 0.0] |
| 7.2 Weight loss of at least 5% during the last three months | 0 | 0 | Risk Ratio (M‐H, Random, 95% CI) | 0.0 [0.0, 0.0] |
| 7.3 Weight loss of at least 10% during the last six months | 0 | 0 | Risk Ratio (M‐H, Random, 95% CI) | 0.0 [0.0, 0.0] |
| 7.4 Insufficient food intake during the last week (50% of requirements or less) | 0 | 0 | Risk Ratio (M‐H, Random, 95% CI) | 0.0 [0.0, 0.0] |
| 7.5 Participants characterised as 'at nutritional risk' by other means | 48 | 7519 | Risk Ratio (M‐H, Random, 95% CI) | 0.98 [0.85, 1.14] |
| 8 Serious adverse events ‐ participants characterised as 'at nutritional risk' due to biomarkers or anthropometrics Show forest plot | 48 | 7519 | Risk Ratio (M‐H, Random, 95% CI) | 0.98 [0.85, 1.14] |
| 8.1 Biomarkers | 3 | 77 | Risk Ratio (M‐H, Random, 95% CI) | 0.39 [0.06, 2.39] |
| 8.2 Anthropometric measures | 3 | 137 | Risk Ratio (M‐H, Random, 95% CI) | 0.69 [0.16, 3.01] |
| 8.3 Mixed | 3 | 75 | Risk Ratio (M‐H, Random, 95% CI) | 0.66 [0.14, 3.07] |
| 8.4 Characterised by other means | 39 | 7230 | Risk Ratio (M‐H, Random, 95% CI) | 1.00 [0.86, 1.16] |
| 9 Serious adverse events ‐ randomisation year Show forest plot | 48 | 7519 | Risk Ratio (M‐H, Random, 95% CI) | 0.98 [0.85, 1.14] |
| 9.1 Before 1960 | 0 | 0 | Risk Ratio (M‐H, Random, 95% CI) | 0.0 [0.0, 0.0] |
| 9.2 1960 to 1979 | 3 | 98 | Risk Ratio (M‐H, Random, 95% CI) | 2.02 [0.82, 4.98] |
| 9.3 1980 to 1999 | 37 | 1754 | Risk Ratio (M‐H, Random, 95% CI) | 0.95 [0.76, 1.19] |
| 9.4 After 1999 | 8 | 5667 | Risk Ratio (M‐H, Random, 95% CI) | 0.97 [0.79, 1.20] |
| 10 Serious adverse events ‐ trials where the intervention lasts fewer than three days compared with trials where the intervention lasts three days or more Show forest plot | 48 | 7519 | Risk Ratio (M‐H, Random, 95% CI) | 0.98 [0.85, 1.14] |
| 10.1 Three days or more | 46 | 7412 | Risk Ratio (M‐H, Random, 95% CI) | 0.99 [0.85, 1.15] |
| 10.2 Less than three days | 1 | 80 | Risk Ratio (M‐H, Random, 95% CI) | 0.67 [0.12, 3.78] |
| 10.3 Unknown | 1 | 27 | Risk Ratio (M‐H, Random, 95% CI) | 0.0 [0.0, 0.0] |
| 11 Serious adverse events ‐ 'best‐worst case' scenario Show forest plot | 48 | 8293 | Risk Ratio (M‐H, Random, 95% CI) | 0.78 [0.63, 0.98] |
| 12 Serious adverse events ‐ 'worst‐best case' scenario Show forest plot | 48 | 8293 | Risk Ratio (M‐H, Random, 95% CI) | 1.16 [0.95, 1.42] |
| 13 Serious adverse events co‐interventions Show forest plot | 48 | 7519 | Risk Ratio (M‐H, Fixed, 95% CI) | 0.94 [0.81, 1.09] |
| 13.1 received nutrition support as co‐intervention | 5 | 5049 | Risk Ratio (M‐H, Fixed, 95% CI) | 1.02 [0.83, 1.26] |
| 13.2 did not receive nutrition support as co‐intervention | 42 | 2390 | Risk Ratio (M‐H, Fixed, 95% CI) | 0.87 [0.70, 1.07] |
| 13.3 delayed versus early nutrition support | 1 | 80 | Risk Ratio (M‐H, Fixed, 95% CI) | 0.67 [0.12, 3.78] |
| Outcome or subgroup title | No. of studies | No. of participants | Statistical method | Effect size |
| 1 Serious adverse events ‐ overall Show forest plot | 56 | 8263 | Risk Ratio (M‐H, Random, 95% CI) | 0.98 [0.90, 1.07] |
| 2 Serious adverse events ‐ bias Show forest plot | 56 | 8263 | Risk Ratio (M‐H, Random, 95% CI) | 0.98 [0.90, 1.07] |
| 2.1 High risk of bias | 56 | 8263 | Risk Ratio (M‐H, Random, 95% CI) | 0.98 [0.90, 1.07] |
| 2.2 Low risk of bias | 0 | 0 | Risk Ratio (M‐H, Random, 95% CI) | 0.0 [0.0, 0.0] |
| 3 Serious adverse events ‐ by medical speciality Show forest plot | 56 | 8263 | Risk Ratio (M‐H, Random, 95% CI) | 0.98 [0.90, 1.07] |
| 3.1 Cardiology | 0 | 0 | Risk Ratio (M‐H, Random, 95% CI) | 0.0 [0.0, 0.0] |
| 3.2 Medical gastroenterology and hepatology | 7 | 338 | Risk Ratio (M‐H, Random, 95% CI) | 0.96 [0.69, 1.33] |
| 3.3 Geriatrics | 0 | 0 | Risk Ratio (M‐H, Random, 95% CI) | 0.0 [0.0, 0.0] |
| 3.4 Pulmonary disease | 1 | 25 | Risk Ratio (M‐H, Random, 95% CI) | 0.22 [0.01, 4.08] |
| 3.5 Endocrinology | 0 | 0 | Risk Ratio (M‐H, Random, 95% CI) | 0.0 [0.0, 0.0] |
| 3.6 Infectious diseases | 0 | 0 | Risk Ratio (M‐H, Random, 95% CI) | 0.0 [0.0, 0.0] |
| 3.7 Rheumatology | 0 | 0 | Risk Ratio (M‐H, Random, 95% CI) | 0.0 [0.0, 0.0] |
| 3.8 Haematology | 0 | 0 | Risk Ratio (M‐H, Random, 95% CI) | 0.0 [0.0, 0.0] |
| 3.9 Nephrology | 0 | 0 | Risk Ratio (M‐H, Random, 95% CI) | 0.0 [0.0, 0.0] |
| 3.10 Gastroenterologic surgery | 27 | 2066 | Risk Ratio (M‐H, Random, 95% CI) | 0.91 [0.72, 1.16] |
| 3.11 Trauma surgery | 2 | 45 | Risk Ratio (M‐H, Random, 95% CI) | 1.22 [0.66, 2.25] |
| 3.12 Ortopaedics | 1 | 80 | Risk Ratio (M‐H, Random, 95% CI) | 0.0 [0.0, 0.0] |
| 3.13 Plastic, reconstructive, and aesthetic surgery | 0 | 0 | Risk Ratio (M‐H, Random, 95% CI) | 0.0 [0.0, 0.0] |
| 3.14 Vascular surgery | 2 | 35 | Risk Ratio (M‐H, Random, 95% CI) | 0.5 [0.05, 4.67] |
| 3.15 Transplant surgery | 2 | 47 | Risk Ratio (M‐H, Random, 95% CI) | 0.56 [0.22, 1.42] |
| 3.16 Urology | 0 | 0 | Risk Ratio (M‐H, Random, 95% CI) | 0.0 [0.0, 0.0] |
| 3.17 Thoracic surgery | 1 | 44 | Risk Ratio (M‐H, Random, 95% CI) | 1.6 [0.40, 6.32] |
| 3.18 Neurological surgery | 0 | 0 | Risk Ratio (M‐H, Random, 95% CI) | 0.0 [0.0, 0.0] |
| 3.19 Oro‐maxillo‐facial surgery | 0 | 0 | Risk Ratio (M‐H, Random, 95% CI) | 0.0 [0.0, 0.0] |
| 3.20 Anaesthesiology | 0 | 0 | Risk Ratio (M‐H, Random, 95% CI) | 0.0 [0.0, 0.0] |
| 3.21 Emergency medicine | 7 | 5208 | Risk Ratio (M‐H, Random, 95% CI) | 0.97 [0.84, 1.12] |
| 3.22 Psychiatry | 0 | 0 | Risk Ratio (M‐H, Random, 95% CI) | 0.0 [0.0, 0.0] |
| 3.23 Neurology | 0 | 0 | Risk Ratio (M‐H, Random, 95% CI) | 0.0 [0.0, 0.0] |
| 3.24 Oncology | 6 | 375 | Risk Ratio (M‐H, Random, 95% CI) | 1.02 [0.87, 1.20] |
| 3.25 Dermatology | 0 | 0 | Risk Ratio (M‐H, Random, 95% CI) | 0.0 [0.0, 0.0] |
| 3.26 Gynaecology | 0 | 0 | Risk Ratio (M‐H, Random, 95% CI) | 0.0 [0.0, 0.0] |
| 3.27 Mixed | 0 | 0 | Risk Ratio (M‐H, Random, 95% CI) | 0.0 [0.0, 0.0] |
| 4 Serious adverse events ‐ based on adequacy of the amount of calories Show forest plot | 56 | 8263 | Risk Ratio (M‐H, Random, 95% CI) | 0.98 [0.90, 1.07] |
| 4.1 Clearly adequate in intervention and clearly inadequate in control | 9 | 5736 | Risk Ratio (M‐H, Random, 95% CI) | 0.98 [0.88, 1.10] |
| 4.2 Inadequate in the experimental or adequate in the control | 4 | 165 | Risk Ratio (M‐H, Random, 95% CI) | 1.17 [0.80, 1.72] |
| 4.3 Experimental group is overfed | 5 | 583 | Risk Ratio (M‐H, Random, 95% CI) | 0.99 [0.74, 1.32] |
| 4.4 Unclear intake in control or experimental | 38 | 1779 | Risk Ratio (M‐H, Random, 95% CI) | 0.90 [0.73, 1.11] |
| 5 Serious adverse events ‐ different screening tools Show forest plot | 56 | 8263 | Risk Ratio (M‐H, Random, 95% CI) | 0.98 [0.90, 1.07] |
| 5.1 NRS 2002 | 1 | 4640 | Risk Ratio (M‐H, Random, 95% CI) | 1.00 [0.85, 1.18] |
| 5.2 MUST | 0 | 0 | Risk Ratio (M‐H, Random, 95% CI) | 0.0 [0.0, 0.0] |
| 5.3 MNA | 0 | 0 | Risk Ratio (M‐H, Random, 95% CI) | 0.0 [0.0, 0.0] |
| 5.4 SGA | 1 | 323 | Risk Ratio (M‐H, Random, 95% CI) | 0.72 [0.28, 1.83] |
| 5.5 Other means | 54 | 3300 | Risk Ratio (M‐H, Random, 95% CI) | 0.97 [0.88, 1.08] |
| 6 Serious adverse events ‐ participants characterised as 'at nutritional risk' due to one of the following conditions Show forest plot | 56 | 8263 | Risk Ratio (M‐H, Random, 95% CI) | 0.98 [0.90, 1.07] |
| 6.1 Major surgery | 34 | 2447 | Risk Ratio (M‐H, Random, 95% CI) | 0.90 [0.75, 1.09] |
| 6.2 Stroke | 0 | 0 | Risk Ratio (M‐H, Random, 95% CI) | 0.0 [0.0, 0.0] |
| 6.3 ICU participants including trauma | 7 | 5209 | Risk Ratio (M‐H, Random, 95% CI) | 0.99 [0.86, 1.14] |
| 6.4 Frail elderly participants with less severe conditions known to increase protein requirements | 2 | 114 | Risk Ratio (M‐H, Random, 95% CI) | 0.56 [0.06, 5.63] |
| 6.5 Participants do not fall into one of the categories above | 13 | 493 | Risk Ratio (M‐H, Random, 95% CI) | 1.02 [0.88, 1.18] |
| 7 Serious adverse events ‐ participants characterised as 'at nutritional risk' due to one of the following criteria Show forest plot | 56 | 8263 | Risk Ratio (M‐H, Random, 95% CI) | 0.98 [0.90, 1.07] |
| 7.1 BMI less than 20.5 kg/m2 | 0 | 0 | Risk Ratio (M‐H, Random, 95% CI) | 0.0 [0.0, 0.0] |
| 7.2 Weight loss of at least 5% during the last three months | 0 | 0 | Risk Ratio (M‐H, Random, 95% CI) | 0.0 [0.0, 0.0] |
| 7.3 Weight loss of at least 10% during the last six months | 2 | 92 | Risk Ratio (M‐H, Random, 95% CI) | 0.33 [0.01, 7.78] |
| 7.4 Insufficient food intake during the last week (50% of requirements or less) | 0 | 0 | Risk Ratio (M‐H, Random, 95% CI) | 0.0 [0.0, 0.0] |
| 7.5 Participants characterised as 'at nutritional risk' by other means | 54 | 8171 | Risk Ratio (M‐H, Random, 95% CI) | 0.98 [0.90, 1.07] |
| 8 Serious adverse events ‐ participants characterised as 'at nutritional risk' due to biomarkers or anthropometrics Show forest plot | 56 | 8263 | Risk Ratio (M‐H, Random, 95% CI) | 0.98 [0.90, 1.07] |
| 8.1 Biomarkers | 6 | 184 | Risk Ratio (M‐H, Random, 95% CI) | 0.45 [0.13, 1.57] |
| 8.2 Anthropometric measures | 3 | 137 | Risk Ratio (M‐H, Random, 95% CI) | 0.74 [0.29, 1.89] |
| 8.3 Both | 3 | 75 | Risk Ratio (M‐H, Random, 95% CI) | 0.66 [0.14, 3.07] |
| 8.4 Characterised by other means | 44 | 7867 | Risk Ratio (M‐H, Random, 95% CI) | 0.99 [0.90, 1.08] |
| 9 Serious adverse events ‐ randomisation year Show forest plot | 56 | 8263 | Risk Ratio (M‐H, Random, 95% CI) | 0.98 [0.90, 1.07] |
| 9.1 Before 1960 | 0 | 0 | Risk Ratio (M‐H, Random, 95% CI) | 0.0 [0.0, 0.0] |
| 9.2 1960 to 1979 | 4 | 154 | Risk Ratio (M‐H, Random, 95% CI) | 1.38 [0.67, 2.83] |
| 9.3 1980 to 1999 | 44 | 2442 | Risk Ratio (M‐H, Random, 95% CI) | 0.98 [0.88, 1.10] |
| 9.4 After 1999 | 8 | 5667 | Risk Ratio (M‐H, Random, 95% CI) | 0.96 [0.83, 1.12] |
| 10 Serious adverse events ‐ trials where the intervention lasts fewer than three days compared with trials where the intervention lasts three days or more Show forest plot | 56 | 8263 | Risk Ratio (M‐H, Random, 95% CI) | 0.98 [0.90, 1.07] |
| 10.1 Three days or more | 54 | 8156 | Risk Ratio (M‐H, Random, 95% CI) | 0.98 [0.89, 1.07] |
| 10.2 Less than three days | 1 | 80 | Risk Ratio (M‐H, Random, 95% CI) | 1.2 [0.59, 2.45] |
| 10.3 Unknown | 1 | 27 | Risk Ratio (M‐H, Random, 95% CI) | 0.0 [0.0, 0.0] |
| 11 Serious adverse events ‐ 'best‐worst case' scenario Show forest plot | 56 | 8452 | Risk Ratio (M‐H, Random, 95% CI) | 0.80 [0.68, 0.94] |
| 12 Serious adverse events ‐ 'worst‐best case' scenario Show forest plot | 56 | 8452 | Risk Ratio (M‐H, Random, 95% CI) | 1.12 [0.96, 1.30] |
| 13 Serious adverse events co‐interventions Show forest plot | 56 | 8263 | Risk Ratio (M‐H, Fixed, 95% CI) | 0.94 [0.85, 1.04] |
| 13.1 Received nutrition support as co‐intervention | 6 | 5164 | Risk Ratio (M‐H, Fixed, 95% CI) | 0.97 [0.85, 1.12] |
| 13.2 did not receive nutrition support as co‐intervention | 49 | 3019 | Risk Ratio (M‐H, Fixed, 95% CI) | 0.90 [0.77, 1.04] |
| 13.3 delayed versus early nutrition support | 1 | 80 | Risk Ratio (M‐H, Fixed, 95% CI) | 1.2 [0.59, 2.45] |
| Outcome or subgroup title | No. of studies | No. of participants | Statistical method | Effect size |
| 1 Morbidity ‐ overall Show forest plot | 1 | 124 | Risk Ratio (M‐H, Random, 95% CI) | 0.63 [0.42, 0.94] |
| Outcome or subgroup title | No. of studies | No. of participants | Statistical method | Effect size |
| 1 Morbidity ‐ overall Show forest plot | 2 | 245 | Risk Ratio (M‐H, Random, 95% CI) | 0.71 [0.53, 0.95] |
| Outcome or subgroup title | No. of studies | No. of participants | Statistical method | Effect size |
| 1 BMI ‐ overall Show forest plot | 15 | 1008 | Mean Difference (IV, Random, 95% CI) | 0.57 [0.38, 0.77] |
| 2 BMI ‐ bias Show forest plot | 15 | 1008 | Mean Difference (IV, Random, 95% CI) | 0.57 [0.38, 0.77] |
| 2.1 High risk of bias | 15 | 1008 | Mean Difference (IV, Random, 95% CI) | 0.57 [0.38, 0.77] |
| 2.2 Low risk of bias | 0 | 0 | Mean Difference (IV, Random, 95% CI) | 0.0 [0.0, 0.0] |
| 3 BMI ‐ mode of administration Show forest plot | 15 | 1008 | Mean Difference (IV, Random, 95% CI) | 0.57 [0.38, 0.77] |
| 3.1 General nutrition support | 1 | 132 | Mean Difference (IV, Random, 95% CI) | 1.0 [‐0.67, 2.67] |
| 3.2 Fortified nutrition | 1 | 146 | Mean Difference (IV, Random, 95% CI) | 1.10 [‐0.24, 2.44] |
| 3.3 Oral nutrition support | 7 | 363 | Mean Difference (IV, Random, 95% CI) | 0.63 [‐0.09, 1.35] |
| 3.4 Enteral nutrition | 5 | 288 | Mean Difference (IV, Random, 95% CI) | 0.53 [0.32, 0.75] |
| 3.5 Parenteral nutrition | 0 | 0 | Mean Difference (IV, Random, 95% CI) | 0.0 [0.0, 0.0] |
| 3.6 Mixed nutrition support | 1 | 79 | Mean Difference (IV, Random, 95% CI) | 1.12 [‐0.15, 2.39] |
| 4 BMI ‐ by medical delivery Show forest plot | 15 | 1008 | Mean Difference (IV, Random, 95% CI) | 0.57 [0.38, 0.77] |
| 4.1 Cardiology | 0 | 0 | Mean Difference (IV, Random, 95% CI) | 0.0 [0.0, 0.0] |
| 4.2 Medical gastroenterology and hepatology | 2 | 101 | Mean Difference (IV, Random, 95% CI) | 1.77 [‐0.19, 3.72] |
| 4.3 Geriatrics | 3 | 227 | Mean Difference (IV, Random, 95% CI) | 0.86 [‐0.10, 1.82] |
| 4.4 Pulmonary disease | 0 | 0 | Mean Difference (IV, Random, 95% CI) | 0.0 [0.0, 0.0] |
| 4.5 Endocrinology | 0 | 0 | Mean Difference (IV, Random, 95% CI) | 0.0 [0.0, 0.0] |
| 4.6 Infectious diseases | 0 | 0 | Mean Difference (IV, Random, 95% CI) | 0.0 [0.0, 0.0] |
| 4.7 Rheumatology | 0 | 0 | Mean Difference (IV, Random, 95% CI) | 0.0 [0.0, 0.0] |
| 4.8 Haematology | 0 | 0 | Mean Difference (IV, Random, 95% CI) | 0.0 [0.0, 0.0] |
| 4.9 Nephrology | 0 | 0 | Mean Difference (IV, Random, 95% CI) | 0.0 [0.0, 0.0] |
| 4.10 Gastroenterologic surgery | 5 | 279 | Mean Difference (IV, Random, 95% CI) | 0.48 [0.25, 0.70] |
| 4.11 Trauma surgery | 2 | 184 | Mean Difference (IV, Random, 95% CI) | 0.64 [0.10, 1.18] |
| 4.12 Ortopaedics | 0 | 0 | Mean Difference (IV, Random, 95% CI) | 0.0 [0.0, 0.0] |
| 4.13 Plastic, reconstructive, and aesthetic surgery | 1 | 37 | Mean Difference (IV, Random, 95% CI) | 1.30 [0.04, 2.56] |
| 4.14 Vascular surgery | 0 | 0 | Mean Difference (IV, Random, 95% CI) | 0.0 [0.0, 0.0] |
| 4.15 Transplant surgery | 0 | 0 | Mean Difference (IV, Random, 95% CI) | 0.0 [0.0, 0.0] |
| 4.16 Urology | 0 | 0 | Mean Difference (IV, Random, 95% CI) | 0.0 [0.0, 0.0] |
| 4.17 Thoracic surgery | 0 | 0 | Mean Difference (IV, Random, 95% CI) | 0.0 [0.0, 0.0] |
| 4.18 Neurological surgery | 0 | 0 | Mean Difference (IV, Random, 95% CI) | 0.0 [0.0, 0.0] |
| 4.19 Oro‐maxillo‐facial surgery | 0 | 0 | Mean Difference (IV, Random, 95% CI) | 0.0 [0.0, 0.0] |
| 4.20 Anaesthesiology | 0 | 0 | Mean Difference (IV, Random, 95% CI) | 0.0 [0.0, 0.0] |
| 4.21 Emergency medicine | 0 | 0 | Mean Difference (IV, Random, 95% CI) | 0.0 [0.0, 0.0] |
| 4.22 Psychiatry | 0 | 0 | Mean Difference (IV, Random, 95% CI) | 0.0 [0.0, 0.0] |
| 4.23 Neurology | 1 | 48 | Mean Difference (IV, Random, 95% CI) | 1.0 [‐1.11, 3.11] |
| 4.24 Oncology | 0 | 0 | Mean Difference (IV, Random, 95% CI) | 0.0 [0.0, 0.0] |
| 4.25 Dermatology | 0 | 0 | Mean Difference (IV, Random, 95% CI) | 0.0 [0.0, 0.0] |
| 4.26 Gynaecology | 0 | 0 | Mean Difference (IV, Random, 95% CI) | 0.0 [0.0, 0.0] |
| 4.27 Mixed | 1 | 132 | Mean Difference (IV, Random, 95% CI) | 1.0 [‐0.67, 2.67] |
| 5 BMI ‐ based on adequacy of the amount of calories Show forest plot | 15 | 1008 | Mean Difference (IV, Random, 95% CI) | 0.57 [0.38, 0.77] |
| 5.1 Clearly adequate in intervention and clearly inadequate in control | 7 | 544 | Mean Difference (IV, Random, 95% CI) | 0.90 [0.23, 1.58] |
| 5.2 Inadequate in the experimental or adequate in the control | 1 | 37 | Mean Difference (IV, Random, 95% CI) | 1.30 [0.04, 2.56] |
| 5.3 Experimental group is overfed | 1 | 46 | Mean Difference (IV, Random, 95% CI) | 0.0 [0.0, 0.0] |
| 5.4 Unclear intake in control or experimental | 6 | 381 | Mean Difference (IV, Random, 95% CI) | 0.52 [0.31, 0.73] |
| 6 BMI ‐ different screening tools Show forest plot | 15 | 1008 | Mean Difference (IV, Random, 95% CI) | 0.57 [0.38, 0.77] |
| 6.1 NRS 2002 | 2 | 211 | Mean Difference (IV, Random, 95% CI) | 1.08 [0.06, 2.09] |
| 6.2 MUST | 0 | 0 | Mean Difference (IV, Random, 95% CI) | 0.0 [0.0, 0.0] |
| 6.3 MNA | 1 | 35 | Mean Difference (IV, Random, 95% CI) | 0.60 [‐0.78, 1.98] |
| 6.4 SGA | 0 | 0 | Mean Difference (IV, Random, 95% CI) | 0.0 [0.0, 0.0] |
| 6.5 Other means | 12 | 762 | Mean Difference (IV, Random, 95% CI) | 0.55 [0.35, 0.76] |
| 7 BMI ‐ participants characterised as 'at nutritional risk' due to one of the following conditions Show forest plot | 15 | 1008 | Mean Difference (IV, Random, 95% CI) | 0.57 [0.38, 0.77] |
| 7.1 Major surgery | 6 | 316 | Mean Difference (IV, Random, 95% CI) | 0.50 [0.28, 0.73] |
| 7.2 Stroke | 1 | 48 | Mean Difference (IV, Random, 95% CI) | 1.0 [‐1.11, 3.11] |
| 7.3 ICU participants including trauma | 1 | 64 | Mean Difference (IV, Random, 95% CI) | 0.40 [‐1.22, 2.02] |
| 7.4 Frail elderly participants with less severe conditions known to increase protein requirements | 2 | 199 | Mean Difference (IV, Random, 95% CI) | 0.75 [0.22, 1.27] |
| 7.5 Participants do not fall into one of the categories above | 5 | 381 | Mean Difference (IV, Random, 95% CI) | 1.06 [0.26, 1.87] |
| 8 BMI ‐ participants characterised as 'at nutritional risk' due to one of the following criteria Show forest plot | 15 | 1008 | Mean Difference (IV, Random, 95% CI) | 0.57 [0.38, 0.77] |
| 8.1 BMI less than 20.5 kg/m2 | 3 | 229 | Mean Difference (IV, Random, 95% CI) | 1.21 [0.29, 2.12] |
| 8.2 Weight loss of at least 5% during the last three months | 0 | 0 | Mean Difference (IV, Random, 95% CI) | 0.0 [0.0, 0.0] |
| 8.3 Weight loss of at least 10% during the last six months | 0 | 0 | Mean Difference (IV, Random, 95% CI) | 0.0 [0.0, 0.0] |
| 8.4 Insufficient food intake during the last week (50% of requirements or less) | 0 | 0 | Mean Difference (IV, Random, 95% CI) | 0.0 [0.0, 0.0] |
| 8.5 Participants characterised as 'at nutritional risk' by other means | 12 | 779 | Mean Difference (IV, Random, 95% CI) | 0.54 [0.34, 0.75] |
| 9 BMI ‐ participants characterised as 'at nutritional risk' due to biomarkers of anthropometrics Show forest plot | 15 | 1008 | Mean Difference (IV, Random, 95% CI) | 0.57 [0.38, 0.77] |
| 9.1 Biomarkers | 0 | 0 | Mean Difference (IV, Random, 95% CI) | 0.0 [0.0, 0.0] |
| 9.2 Anthropometric measures | 3 | 229 | Mean Difference (IV, Random, 95% CI) | 1.21 [0.29, 2.12] |
| 9.3 Characterised by other means | 12 | 779 | Mean Difference (IV, Random, 95% CI) | 0.54 [0.34, 0.75] |
| 10 BMI ‐ randomisation year Show forest plot | 15 | 1008 | Mean Difference (IV, Random, 95% CI) | 0.57 [0.38, 0.77] |
| 10.1 Before 1960 | 0 | 0 | Mean Difference (IV, Random, 95% CI) | 0.0 [0.0, 0.0] |
| 10.2 1960 to 1979 | 0 | 0 | Mean Difference (IV, Random, 95% CI) | 0.0 [0.0, 0.0] |
| 10.3 1980 to 1999 | 4 | 182 | Mean Difference (IV, Random, 95% CI) | 1.03 [‐0.91, 2.97] |
| 10.4 After 1999 | 11 | 826 | Mean Difference (IV, Random, 95% CI) | 0.56 [0.36, 0.76] |
| 11 BMI ‐ trials where the intervention lasts fewer than three days compared with trials where the intervention lasts three days or more Show forest plot | 15 | 1008 | Mean Difference (IV, Random, 95% CI) | 0.57 [0.38, 0.77] |
| 11.1 Three days or more | 15 | 1008 | Mean Difference (IV, Random, 95% CI) | 0.57 [0.38, 0.77] |
| 11.2 Less than three days | 0 | 0 | Mean Difference (IV, Random, 95% CI) | 0.0 [0.0, 0.0] |
| Outcome or subgroup title | No. of studies | No. of participants | Statistical method | Effect size |
| 1 BMI ‐ overall Show forest plot | 20 | 1528 | Mean Difference (IV, Random, 95% CI) | 0.40 [‐0.02, 0.83] |
| 2 BMI ‐ bias Show forest plot | 20 | 1528 | Mean Difference (IV, Random, 95% CI) | 0.44 [0.02, 0.87] |
| 2.1 High risk of bias | 20 | 1528 | Mean Difference (IV, Random, 95% CI) | 0.44 [0.02, 0.87] |
| 2.2 Low risk of bias | 0 | 0 | Mean Difference (IV, Random, 95% CI) | 0.0 [0.0, 0.0] |
| 3 BMI ‐ mode of delivery Show forest plot | 20 | 1528 | Mean Difference (IV, Random, 95% CI) | 0.44 [0.02, 0.87] |
| 3.1 General nutrition support | 2 | 196 | Mean Difference (IV, Random, 95% CI) | 0.92 [0.26, 1.57] |
| 3.2 Fortified nutrition | 1 | 146 | Mean Difference (IV, Random, 95% CI) | 1.10 [‐0.24, 2.44] |
| 3.3 Oral nutrition support | 8 | 588 | Mean Difference (IV, Random, 95% CI) | 0.43 [‐0.16, 1.02] |
| 3.4 Enteral nutrition | 8 | 519 | Mean Difference (IV, Random, 95% CI) | 0.17 [‐0.60, 0.93] |
| 3.5 Parenteral nutrition | 0 | 0 | Mean Difference (IV, Random, 95% CI) | 0.0 [0.0, 0.0] |
| 3.6 Mixed nutrition support | 1 | 79 | Mean Difference (IV, Random, 95% CI) | 1.12 [‐0.15, 2.39] |
| 4 BMI ‐ by medical speciality Show forest plot | 20 | 1528 | Mean Difference (IV, Random, 95% CI) | 0.44 [0.02, 0.87] |
| 4.1 Cardiology | 0 | 0 | Mean Difference (IV, Random, 95% CI) | 0.0 [0.0, 0.0] |
| 4.2 Medical gastroenterology and hepatology | 3 | 201 | Mean Difference (IV, Random, 95% CI) | 1.02 [0.13, 1.90] |
| 4.3 Geriatrics | 4 | 452 | Mean Difference (IV, Random, 95% CI) | 0.47 [‐0.24, 1.17] |
| 4.4 Pulmonary disease | 0 | 0 | Mean Difference (IV, Random, 95% CI) | 0.0 [0.0, 0.0] |
| 4.5 Endocrinology | 0 | 0 | Mean Difference (IV, Random, 95% CI) | 0.0 [0.0, 0.0] |
| 4.6 Infectious diseases | 0 | 0 | Mean Difference (IV, Random, 95% CI) | 0.0 [0.0, 0.0] |
| 4.7 Rheumatology | 0 | 0 | Mean Difference (IV, Random, 95% CI) | 0.0 [0.0, 0.0] |
| 4.8 Haematology | 0 | 0 | Mean Difference (IV, Random, 95% CI) | 0.0 [0.0, 0.0] |
| 4.9 Nephrology | 0 | 0 | Mean Difference (IV, Random, 95% CI) | 0.0 [0.0, 0.0] |
| 4.10 Gastroenterologic surgery | 6 | 346 | Mean Difference (IV, Random, 95% CI) | ‐0.52 [‐2.16, 1.11] |
| 4.11 Trauma surgery | 2 | 184 | Mean Difference (IV, Random, 95% CI) | 0.64 [0.10, 1.18] |
| 4.12 Ortopaedics | 0 | 0 | Mean Difference (IV, Random, 95% CI) | 0.0 [0.0, 0.0] |
| 4.13 Plastic, reconstructive, and aesthetic surgery | 1 | 37 | Mean Difference (IV, Random, 95% CI) | 1.30 [0.04, 2.56] |
| 4.14 Vascular surgery | 0 | 0 | Mean Difference (IV, Random, 95% CI) | 0.0 [0.0, 0.0] |
| 4.15 Transplant surgery | 0 | 0 | Mean Difference (IV, Random, 95% CI) | 0.0 [0.0, 0.0] |
| 4.16 Urology | 0 | 0 | Mean Difference (IV, Random, 95% CI) | 0.0 [0.0, 0.0] |
| 4.17 Thoracic surgery | 0 | 0 | Mean Difference (IV, Random, 95% CI) | 0.0 [0.0, 0.0] |
| 4.18 Neurological surgery | 0 | 0 | Mean Difference (IV, Random, 95% CI) | 0.0 [0.0, 0.0] |
| 4.19 Oro‐maxillo‐facial surgery | 0 | 0 | Mean Difference (IV, Random, 95% CI) | 0.0 [0.0, 0.0] |
| 4.20 Anaesthesiology | 0 | 0 | Mean Difference (IV, Random, 95% CI) | 0.0 [0.0, 0.0] |
| 4.21 Emergency medicine | 0 | 0 | Mean Difference (IV, Random, 95% CI) | 0.0 [0.0, 0.0] |
| 4.22 Psychiatry | 0 | 0 | Mean Difference (IV, Random, 95% CI) | 0.0 [0.0, 0.0] |
| 4.23 Neurology | 2 | 112 | Mean Difference (IV, Random, 95% CI) | 0.91 [0.24, 1.58] |
| 4.24 Oncology | 1 | 64 | Mean Difference (IV, Random, 95% CI) | 0.40 [‐1.40, 2.20] |
| 4.25 Dermatology | 0 | 0 | Mean Difference (IV, Random, 95% CI) | 0.0 [0.0, 0.0] |
| 4.26 Gynaecology | 0 | 0 | Mean Difference (IV, Random, 95% CI) | 0.0 [0.0, 0.0] |
| 4.27 Mixed | 1 | 132 | Mean Difference (IV, Random, 95% CI) | 1.0 [‐0.67, 2.67] |
| 5 BMI ‐ based on adequacy of the amount of calories Show forest plot | 20 | 1528 | Mean Difference (IV, Random, 95% CI) | 0.40 [‐0.02, 0.83] |
| 5.1 Clearly adequate in intervention and clearly inadequate in control | 9 | 686 | Mean Difference (IV, Random, 95% CI) | 0.54 [0.33, 0.74] |
| 5.2 Inadequate in the experimental or adequate in the control | 2 | 101 | Mean Difference (IV, Random, 95% CI) | 1.00 [0.38, 1.61] |
| 5.3 Experimental group is overfed | 1 | 46 | Mean Difference (IV, Random, 95% CI) | 0.0 [0.0, 0.0] |
| 5.4 Unclear intake in control or experimental | 8 | 695 | Mean Difference (IV, Random, 95% CI) | ‐0.04 [‐1.11, 1.03] |
| 6 BMI ‐ different screening tools Show forest plot | 20 | 1528 | Mean Difference (IV, Random, 95% CI) | 0.44 [0.02, 0.87] |
| 6.1 NRS 2002 | 2 | 211 | Mean Difference (IV, Random, 95% CI) | 1.08 [0.06, 2.09] |
| 6.2 MUST | 1 | 64 | Mean Difference (IV, Random, 95% CI) | 0.90 [0.19, 1.61] |
| 6.3 MNA | 1 | 35 | Mean Difference (IV, Random, 95% CI) | 0.60 [‐0.78, 1.98] |
| 6.4 SGA | 0 | 0 | Mean Difference (IV, Random, 95% CI) | 0.0 [0.0, 0.0] |
| 6.5 Other means | 16 | 1218 | Mean Difference (IV, Random, 95% CI) | 0.30 [‐0.22, 0.83] |
| 7 BMI ‐ participants characterised as 'at nutritional risk' due to one of the following conditions Show forest plot | 20 | 1528 | Mean Difference (IV, Random, 95% CI) | 0.44 [0.02, 0.87] |
| 7.1 Major surgery | 7 | 383 | Mean Difference (IV, Random, 95% CI) | ‐0.23 [‐1.55, 1.09] |
| 7.2 Stroke | 2 | 112 | Mean Difference (IV, Random, 95% CI) | 0.91 [0.24, 1.58] |
| 7.3 ICU participants including trauma | 1 | 64 | Mean Difference (IV, Random, 95% CI) | 0.40 [‐1.22, 2.02] |
| 7.4 Frail elderly participants with less severe conditions known to increase protein requirements | 2 | 199 | Mean Difference (IV, Random, 95% CI) | 0.75 [0.22, 1.27] |
| 7.5 Participants do not fall into one of the categories above | 8 | 770 | Mean Difference (IV, Random, 95% CI) | 0.65 [0.22, 1.09] |
| 8 BMI ‐ participants characterised as 'at nutritional risk' due to one of the following criteria Show forest plot | 20 | 1528 | Mean Difference (IV, Random, 95% CI) | 0.44 [0.02, 0.87] |
| 8.1 BMI less than 20.5 kg/m2 | 3 | 229 | Mean Difference (IV, Random, 95% CI) | 1.21 [0.29, 2.12] |
| 8.2 Weight loss of at least 5% during the last three months | 0 | 0 | Mean Difference (IV, Random, 95% CI) | 0.0 [0.0, 0.0] |
| 8.3 Weight loss of at least 10% during the last six months | 0 | 0 | Mean Difference (IV, Random, 95% CI) | 0.0 [0.0, 0.0] |
| 8.4 Insufficient food intake during the last week (50% of requirements or less) | 0 | 0 | Mean Difference (IV, Random, 95% CI) | 0.0 [0.0, 0.0] |
| 8.5 Participants characterised as 'at nutritional risk' by other means | 17 | 1299 | Mean Difference (IV, Random, 95% CI) | 0.35 [‐0.11, 0.81] |
| 9 BMI ‐ participants characterised as 'at nutritional risk' due to biomarkers or anthropometrics Show forest plot | 20 | 1528 | Mean Difference (IV, Random, 95% CI) | 0.44 [0.02, 0.87] |
| 9.1 Biomarkers | 0 | 0 | Mean Difference (IV, Random, 95% CI) | 0.0 [0.0, 0.0] |
| 9.2 Anthropometric measures | 3 | 229 | Mean Difference (IV, Random, 95% CI) | 1.21 [0.29, 2.12] |
| 9.3 Characterised by other means | 17 | 1299 | Mean Difference (IV, Random, 95% CI) | 0.35 [‐0.11, 0.81] |
| 10 BMI ‐ randomisation year Show forest plot | 20 | 1528 | Mean Difference (IV, Random, 95% CI) | 0.44 [0.02, 0.87] |
| 10.1 Before 1960 | 0 | 0 | Mean Difference (IV, Random, 95% CI) | 0.0 [0.0, 0.0] |
| 10.2 1960 to 1979 | 0 | 0 | Mean Difference (IV, Random, 95% CI) | 0.0 [0.0, 0.0] |
| 10.3 1980 to 1999 | 5 | 249 | Mean Difference (IV, Random, 95% CI) | 0.02 [‐2.62, 2.67] |
| 10.4 After 1999 | 15 | 1279 | Mean Difference (IV, Random, 95% CI) | 0.57 [0.39, 0.75] |
| 11 BMI ‐ trials where the intervention lasts fewer than three days compared with trials where the intervention lasts three days or more Show forest plot | 20 | 1528 | Mean Difference (IV, Random, 95% CI) | 0.44 [0.02, 0.87] |
| 11.1 Three days or more | 20 | 1528 | Mean Difference (IV, Random, 95% CI) | 0.44 [0.02, 0.87] |
| 11.2 Less than three days | 0 | 0 | Mean Difference (IV, Random, 95% CI) | 0.0 [0.0, 0.0] |
| Outcome or subgroup title | No. of studies | No. of participants | Statistical method | Effect size |
| 1 Weight ‐ overall Show forest plot | 81 | 5445 | Mean Difference (IV, Random, 95% CI) | 1.32 [0.65, 2.00] |
| 2 Weight ‐ bias Show forest plot | 81 | 5445 | Mean Difference (IV, Random, 95% CI) | 1.32 [0.65, 2.00] |
| 2.1 High risk of bias | 81 | 5445 | Mean Difference (IV, Random, 95% CI) | 1.32 [0.65, 2.00] |
| 2.2 Low risk of bias | 0 | 0 | Mean Difference (IV, Random, 95% CI) | 0.0 [0.0, 0.0] |
| 3 Weight ‐ mode of delivery Show forest plot | 81 | 5445 | Mean Difference (IV, Random, 95% CI) | 1.32 [0.65, 2.00] |
| 3.1 General nutrition support | 4 | 962 | Mean Difference (IV, Random, 95% CI) | ‐0.00 [‐0.17, 0.16] |
| 3.2 Fortified nutrition | 2 | 230 | Mean Difference (IV, Random, 95% CI) | 1.45 [‐0.92, 3.83] |
| 3.3 Oral nutrition support | 31 | 1924 | Mean Difference (IV, Random, 95% CI) | 0.33 [‐0.21, 0.87] |
| 3.4 Enteral nutrition | 26 | 1616 | Mean Difference (IV, Random, 95% CI) | 2.62 [1.23, 4.01] |
| 3.5 Parenteral nutrition | 17 | 667 | Mean Difference (IV, Random, 95% CI) | 1.48 [‐0.20, 3.15] |
| 3.6 Mixed nutrition support | 1 | 46 | Mean Difference (IV, Random, 95% CI) | ‐3.90 [‐4.45, ‐3.35] |
| 4 Weight ‐ by medical speciality Show forest plot | 81 | 5445 | Mean Difference (IV, Random, 95% CI) | 1.32 [0.65, 2.00] |
| 4.1 Cardiology | 0 | 0 | Mean Difference (IV, Random, 95% CI) | 0.0 [0.0, 0.0] |
| 4.2 Medical gastroenterology and hepatology | 7 | 345 | Mean Difference (IV, Random, 95% CI) | 0.88 [‐0.03, 1.79] |
| 4.3 Geriatrics | 10 | 1422 | Mean Difference (IV, Random, 95% CI) | 0.62 [‐0.30, 1.54] |
| 4.4 Pulmonary disease | 4 | 91 | Mean Difference (IV, Random, 95% CI) | 0.95 [‐0.43, 2.33] |
| 4.5 Endocrinology | 0 | 0 | Mean Difference (IV, Random, 95% CI) | 0.0 [0.0, 0.0] |
| 4.6 Infectious diseases | 0 | 0 | Mean Difference (IV, Random, 95% CI) | 0.0 [0.0, 0.0] |
| 4.7 Rheumatology | 0 | 0 | Mean Difference (IV, Random, 95% CI) | 0.0 [0.0, 0.0] |
| 4.8 Haematology | 0 | 0 | Mean Difference (IV, Random, 95% CI) | 0.0 [0.0, 0.0] |
| 4.9 Nephrology | 0 | 0 | Mean Difference (IV, Random, 95% CI) | 0.0 [0.0, 0.0] |
| 4.10 Gastroenterologic surgery | 35 | 1423 | Mean Difference (IV, Random, 95% CI) | 1.26 [‐0.12, 2.63] |
| 4.11 Trauma surgery | 0 | 0 | Mean Difference (IV, Random, 95% CI) | 0.0 [0.0, 0.0] |
| 4.12 Ortopaedics | 7 | 395 | Mean Difference (IV, Random, 95% CI) | 2.79 [1.36, 4.23] |
| 4.13 Plastic, reconstructive, and aesthetic surgery | 0 | 0 | Mean Difference (IV, Random, 95% CI) | 0.0 [0.0, 0.0] |
| 4.14 Vascular surgery | 0 | 0 | Mean Difference (IV, Random, 95% CI) | 0.0 [0.0, 0.0] |
| 4.15 Transplant surgery | 1 | 29 | Mean Difference (IV, Random, 95% CI) | ‐4.60 [‐15.21, 6.01] |
| 4.16 Urology | 0 | 0 | Mean Difference (IV, Random, 95% CI) | 0.0 [0.0, 0.0] |
| 4.17 Thoracic surgery | 2 | 548 | Mean Difference (IV, Random, 95% CI) | 0.06 [‐2.39, 2.51] |
| 4.18 Neurological surgery | 1 | 48 | Mean Difference (IV, Random, 95% CI) | 10.53 [6.72, 14.34] |
| 4.19 Oro‐maxillo‐facial surgery | 1 | 32 | Mean Difference (IV, Random, 95% CI) | 0.6 [‐1.10, 2.30] |
| 4.20 Anaesthesiology | 0 | 0 | Mean Difference (IV, Random, 95% CI) | 0.0 [0.0, 0.0] |
| 4.21 Emergency medicine | 0 | 0 | Mean Difference (IV, Random, 95% CI) | 0.0 [0.0, 0.0] |
| 4.22 Psychiatry | 0 | 0 | Mean Difference (IV, Random, 95% CI) | 0.0 [0.0, 0.0] |
| 4.23 Neurology | 5 | 247 | Mean Difference (IV, Random, 95% CI) | 0.74 [‐2.15, 3.63] |
| 4.24 Oncology | 1 | 23 | Mean Difference (IV, Random, 95% CI) | ‐1.0 [‐7.41, 5.41] |
| 4.25 Dermatology | 0 | 0 | Mean Difference (IV, Random, 95% CI) | 0.0 [0.0, 0.0] |
| 4.26 Gynaecology | 0 | 0 | Mean Difference (IV, Random, 95% CI) | 0.0 [0.0, 0.0] |
| 4.27 Mixed | 7 | 842 | Mean Difference (IV, Random, 95% CI) | 0.21 [‐0.58, 1.00] |
| 5 Weight ‐ based on adequacy of the amount of calories Show forest plot | 81 | 5445 | Mean Difference (IV, Random, 95% CI) | 1.32 [0.65, 2.00] |
| 5.1 Clearly adequate in intervention and clearly inadequate in control | 20 | 1287 | Mean Difference (IV, Random, 95% CI) | 1.46 [‐0.19, 3.12] |
| 5.2 Inadequate in the experimental or adequate in the control | 19 | 1626 | Mean Difference (IV, Random, 95% CI) | 0.79 [0.06, 1.51] |
| 5.3 Experimental group is overfed | 5 | 151 | Mean Difference (IV, Random, 95% CI) | 0.64 [‐0.86, 2.13] |
| 5.4 Unclear intake in control or experimental | 37 | 2381 | Mean Difference (IV, Random, 95% CI) | 1.61 [0.50, 2.72] |
| 6 Weight ‐ different screening tools Show forest plot | 81 | 5445 | Mean Difference (IV, Random, 95% CI) | 1.32 [0.65, 2.00] |
| 6.1 NRS 2002 | 4 | 353 | Mean Difference (IV, Random, 95% CI) | 1.12 [‐0.29, 2.53] |
| 6.2 MUST | 0 | 0 | Mean Difference (IV, Random, 95% CI) | 0.0 [0.0, 0.0] |
| 6.3 MNA | 2 | 104 | Mean Difference (IV, Random, 95% CI) | 1.45 [‐0.02, 2.91] |
| 6.4 SGA | 2 | 445 | Mean Difference (IV, Random, 95% CI) | ‐0.65 [‐3.30, 2.00] |
| 6.5 Other means | 73 | 4543 | Mean Difference (IV, Random, 95% CI) | 1.41 [0.68, 2.15] |
| 7 Weight ‐ participants characterised as 'at nutritional risk' due to one of the following conditions Show forest plot | 81 | 5445 | Mean Difference (IV, Random, 95% CI) | 1.32 [0.65, 2.00] |
| 7.1 Major surgery | 40 | 2213 | Mean Difference (IV, Random, 95% CI) | 1.24 [0.11, 2.37] |
| 7.2 Stroke | 3 | 181 | Mean Difference (IV, Random, 95% CI) | 0.39 [‐2.75, 3.54] |
| 7.3 ICU participants including trauma | 0 | 0 | Mean Difference (IV, Random, 95% CI) | 0.0 [0.0, 0.0] |
| 7.4 Frail elderly participants with less severe conditions known to increase protein requirements | 8 | 1256 | Mean Difference (IV, Random, 95% CI) | 1.83 [0.71, 2.96] |
| 7.5 Participants do not fall into one of the categories above | 30 | 1795 | Mean Difference (IV, Random, 95% CI) | 0.93 [0.38, 1.48] |
| 8 Weight ‐ participants characterised as 'at nutritional risk' due to one of the following criteria Show forest plot | 81 | 5445 | Mean Difference (IV, Random, 95% CI) | 1.32 [0.65, 2.00] |
| 8.1 BMI less than 20.5 kg/m2 | 5 | 309 | Mean Difference (IV, Random, 95% CI) | 3.97 [1.06, 6.89] |
| 8.2 Weight loss of at least 5% during the last three months | 0 | 0 | Mean Difference (IV, Random, 95% CI) | 0.0 [0.0, 0.0] |
| 8.3 Weight loss of at least 10% during the last six months | 2 | 79 | Mean Difference (IV, Random, 95% CI) | 0.30 [‐0.36, 0.96] |
| 8.4 Insufficient food intake during the last week (50% of requirements or less) | 0 | 0 | Mean Difference (IV, Random, 95% CI) | 0.0 [0.0, 0.0] |
| 8.5 Participants characterised as 'at nutritional risk' by other means | 74 | 5057 | Mean Difference (IV, Random, 95% CI) | 1.30 [0.59, 2.00] |
| 9 Weight ‐ participants characterised as 'at nutritional risk' due to biomarkers or anthropometrics Show forest plot | 81 | 5445 | Mean Difference (IV, Random, 95% CI) | 1.32 [0.65, 2.00] |
| 9.1 Biomarkers | 9 | 750 | Mean Difference (IV, Random, 95% CI) | 4.37 [2.16, 6.58] |
| 9.2 Anthropometric measures | 15 | 996 | Mean Difference (IV, Random, 95% CI) | 1.04 [‐0.15, 2.23] |
| 9.3 Characterised by other means | 54 | 3639 | Mean Difference (IV, Random, 95% CI) | 0.66 [0.13, 1.20] |
| 9.4 Mixed | 3 | 60 | Mean Difference (IV, Random, 95% CI) | ‐0.37 [‐1.95, 1.22] |
| 10 Weight ‐ randomisation year Show forest plot | 81 | 5445 | Mean Difference (IV, Random, 95% CI) | 1.32 [0.65, 2.00] |
| 10.1 Before 1960 | 0 | 0 | Mean Difference (IV, Random, 95% CI) | 0.0 [0.0, 0.0] |
| 10.2 1960 to 1979 | 1 | 21 | Mean Difference (IV, Random, 95% CI) | 3.85 [1.69, 6.01] |
| 10.3 1980 to 1999 | 48 | 2365 | Mean Difference (IV, Random, 95% CI) | 1.23 [0.24, 2.22] |
| 10.4 After 1999 | 32 | 3059 | Mean Difference (IV, Random, 95% CI) | 1.07 [0.35, 1.79] |
| 11 Weight ‐ trials where the intervention lasts fewer than three days compared with trials where the intervention lasts three days or more Show forest plot | 81 | 5445 | Mean Difference (IV, Random, 95% CI) | 1.32 [0.65, 2.00] |
| 11.1 Three days or more | 76 | 5287 | Mean Difference (IV, Random, 95% CI) | 1.40 [0.70, 2.10] |
| 11.2 Less than three days | 5 | 158 | Mean Difference (IV, Random, 95% CI) | 0.15 [‐1.62, 1.92] |
| 12 Weight ‐ Missing SDs Show forest plot | 81 | 5445 | Mean Difference (IV, Random, 95% CI) | 1.40 [0.76, 2.03] |
| 12.1 missing SDs imputed from all trials | 81 | 5445 | Mean Difference (IV, Random, 95% CI) | 1.40 [0.76, 2.03] |
| Outcome or subgroup title | No. of studies | No. of participants | Statistical method | Effect size |
| 1 Weight ‐ overall Show forest plot | 94 | 6916 | Mean Difference (IV, Random, 95% CI) | 1.13 [0.50, 1.75] |
| 2 Weight ‐ bias Show forest plot | 94 | 6916 | Mean Difference (IV, Random, 95% CI) | 1.13 [0.50, 1.75] |
| 2.1 High risk of bias | 94 | 6916 | Mean Difference (IV, Random, 95% CI) | 1.13 [0.50, 1.75] |
| 2.2 Low risk of bias | 0 | 0 | Mean Difference (IV, Random, 95% CI) | 0.0 [0.0, 0.0] |
| 3 Weight ‐ mode of delivery Show forest plot | 94 | 6916 | Mean Difference (IV, Random, 95% CI) | 1.13 [0.50, 1.75] |
| 3.1 General nutrition support | 6 | 1328 | Mean Difference (IV, Random, 95% CI) | 0.41 [‐0.58, 1.41] |
| 3.2 Fortified nutrition | 2 | 230 | Mean Difference (IV, Random, 95% CI) | 1.45 [‐0.92, 3.83] |
| 3.3 Oral nutrition support | 32 | 2149 | Mean Difference (IV, Random, 95% CI) | 0.29 [‐0.22, 0.80] |
| 3.4 Enteral nutrition | 31 | 2081 | Mean Difference (IV, Random, 95% CI) | 1.98 [0.74, 3.22] |
| 3.5 Parenteral nutrition | 22 | 1082 | Mean Difference (IV, Random, 95% CI) | 1.25 [‐0.25, 2.75] |
| 3.6 Mixed | 1 | 46 | Mean Difference (IV, Random, 95% CI) | ‐3.90 [‐4.45, ‐3.35] |
| 4 Weight ‐ by medical speciality Show forest plot | 94 | 6916 | Mean Difference (IV, Random, 95% CI) | 1.13 [0.50, 1.75] |
| 4.1 Cardiology | 0 | 0 | Mean Difference (IV, Random, 95% CI) | 0.0 [0.0, 0.0] |
| 4.2 Medical gastroenterology and hepatology | 8 | 388 | Mean Difference (IV, Random, 95% CI) | 0.13 [‐1.05, 1.30] |
| 4.3 Geriatrics | 11 | 1647 | Mean Difference (IV, Random, 95% CI) | 0.61 [‐0.27, 1.50] |
| 4.4 Pulmonary disease | 4 | 91 | Mean Difference (IV, Random, 95% CI) | 0.95 [‐0.43, 2.33] |
| 4.5 Endocrinology | 0 | 0 | Mean Difference (IV, Random, 95% CI) | 0.0 [0.0, 0.0] |
| 4.6 Infectious diseases | 0 | 0 | Mean Difference (IV, Random, 95% CI) | 0.0 [0.0, 0.0] |
| 4.7 Rheumatology | 0 | 0 | Mean Difference (IV, Random, 95% CI) | 0.0 [0.0, 0.0] |
| 4.8 Haematology | 0 | 0 | Mean Difference (IV, Random, 95% CI) | 0.0 [0.0, 0.0] |
| 4.9 Nephrology | 0 | 0 | Mean Difference (IV, Random, 95% CI) | 0.0 [0.0, 0.0] |
| 4.10 Gastroenterologic surgery | 44 | 2260 | Mean Difference (IV, Random, 95% CI) | 1.09 [‐0.11, 2.29] |
| 4.11 Trauma surgery | 0 | 0 | Mean Difference (IV, Random, 95% CI) | 0.0 [0.0, 0.0] |
| 4.12 Ortopaedics | 8 | 697 | Mean Difference (IV, Random, 95% CI) | 2.62 [1.21, 4.02] |
| 4.13 Plastic, reconstructive, and aesthetic surgery | 0 | 0 | Mean Difference (IV, Random, 95% CI) | 0.0 [0.0, 0.0] |
| 4.14 Vascular surgery | 0 | 0 | Mean Difference (IV, Random, 95% CI) | 0.0 [0.0, 0.0] |
| 4.15 Transplant surgery | 1 | 29 | Mean Difference (IV, Random, 95% CI) | ‐4.60 [‐15.21, 6.01] |
| 4.16 Urology | 0 | 0 | Mean Difference (IV, Random, 95% CI) | 0.0 [0.0, 0.0] |
| 4.17 Thoracic surgery | 2 | 548 | Mean Difference (IV, Random, 95% CI) | 0.06 [‐2.39, 2.51] |
| 4.18 Neurological surgery | 1 | 48 | Mean Difference (IV, Random, 95% CI) | 10.53 [6.72, 14.34] |
| 4.19 Oro‐maxillo‐facial surgery | 1 | 32 | Mean Difference (IV, Random, 95% CI) | 0.6 [‐1.10, 2.30] |
| 4.20 Anaesthesiology | 0 | 0 | Mean Difference (IV, Random, 95% CI) | 0.0 [0.0, 0.0] |
| 4.21 Emergency medicine | 0 | 0 | Mean Difference (IV, Random, 95% CI) | 0.0 [0.0, 0.0] |
| 4.22 Psychiatry | 0 | 0 | Mean Difference (IV, Random, 95% CI) | 0.0 [0.0, 0.0] |
| 4.23 Neurology | 6 | 311 | Mean Difference (IV, Random, 95% CI) | 1.72 [0.19, 3.25] |
| 4.24 Oncology | 1 | 23 | Mean Difference (IV, Random, 95% CI) | ‐1.0 [‐7.41, 5.41] |
| 4.25 Dermatology | 0 | 0 | Mean Difference (IV, Random, 95% CI) | 0.0 [0.0, 0.0] |
| 4.26 Gynaecology | 0 | 0 | Mean Difference (IV, Random, 95% CI) | 0.0 [0.0, 0.0] |
| 4.27 Mixed | 7 | 842 | Mean Difference (IV, Random, 95% CI) | 0.22 [‐0.58, 1.02] |
| 5 Weight ‐ based on adequacy of the amount of nutrition Show forest plot | 94 | 6916 | Mean Difference (IV, Random, 95% CI) | 1.13 [0.50, 1.75] |
| 5.1 Clearly adequate in intervention and clearly inadequate in control | 22 | 1933 | Mean Difference (IV, Random, 95% CI) | 1.03 [‐0.41, 2.46] |
| 5.2 Inadequate in the experimental or adequate in the control | 21 | 1992 | Mean Difference (IV, Random, 95% CI) | 0.86 [0.16, 1.57] |
| 5.3 Experimental group is overfed | 5 | 151 | Mean Difference (IV, Random, 95% CI) | 0.64 [‐0.87, 2.14] |
| 5.4 Unclear intake in control or experimental | 46 | 2840 | Mean Difference (IV, Random, 95% CI) | 1.34 [0.35, 2.33] |
| 6 Weight ‐ different screening tools Show forest plot | 94 | 6916 | Mean Difference (IV, Random, 95% CI) | 1.13 [0.50, 1.75] |
| 6.1 NRS 2002 | 4 | 353 | Mean Difference (IV, Random, 95% CI) | 1.12 [‐0.29, 2.53] |
| 6.2 MUST | 1 | 64 | Mean Difference (IV, Random, 95% CI) | 2.10 [0.30, 3.90] |
| 6.3 MNA | 2 | 104 | Mean Difference (IV, Random, 95% CI) | 1.56 [0.09, 3.03] |
| 6.4 SGA | 4 | 1091 | Mean Difference (IV, Random, 95% CI) | ‐1.03 [‐2.12, 0.06] |
| 6.5 Other means | 83 | 5304 | Mean Difference (IV, Random, 95% CI) | 1.26 [0.56, 1.95] |
| 7 Weight ‐ participants characterised as 'at nutritional risk' due to one of the following conditions Show forest plot | 94 | 6916 | Mean Difference (IV, Random, 95% CI) | 1.13 [0.50, 1.75] |
| 7.1 Major surgery | 49 | 3050 | Mean Difference (IV, Random, 95% CI) | 1.08 [0.08, 2.09] |
| 7.2 Stroke | 4 | 245 | Mean Difference (IV, Random, 95% CI) | 1.68 [0.12, 3.24] |
| 7.3 ICU participants including trauma | 1 | 43 | Mean Difference (IV, Random, 95% CI) | ‐1.6 [‐2.37, ‐0.83] |
| 7.4 Frail elderly participants with less severe conditions known to increase protein requirements | 9 | 1558 | Mean Difference (IV, Random, 95% CI) | 1.61 [0.59, 2.64] |
| 7.5 Participants do not fall into one of the categories above | 31 | 2020 | Mean Difference (IV, Random, 95% CI) | 0.85 [0.33, 1.38] |
| 8 Weight ‐ participants characterised as 'at nutritional risk' due to one of the following criteria Show forest plot | 94 | 6916 | Mean Difference (IV, Random, 95% CI) | 1.13 [0.50, 1.75] |
| 8.1 BMI less than 20.5 kg/m2 | 5 | 309 | Mean Difference (IV, Random, 95% CI) | 3.97 [1.06, 6.89] |
| 8.2 Weight loss of at least 5% during the last three months | 2 | 30 | Mean Difference (IV, Random, 95% CI) | ‐5.83 [‐15.15, 3.48] |
| 8.3 Weight loss of at least 10% during the last six months | 2 | 79 | Mean Difference (IV, Random, 95% CI) | 0.30 [‐0.36, 0.96] |
| 8.4 Insufficient food intake during the last week (50% of requirements or less) | 0 | 0 | Mean Difference (IV, Random, 95% CI) | 0.0 [0.0, 0.0] |
| 8.5 Participants characterised as 'at nutritional risk' by other means | 85 | 6498 | Mean Difference (IV, Random, 95% CI) | 1.12 [0.48, 1.77] |
| 9 Weight ‐ participants characterised as 'at nutritional risk' due to biomarkers or anthropometrics Show forest plot | 94 | 6916 | Mean Difference (IV, Random, 95% CI) | 1.13 [0.50, 1.75] |
| 9.1 Biomarkers | 9 | 750 | Mean Difference (IV, Random, 95% CI) | 4.37 [2.16, 6.58] |
| 9.2 Anthropometric measures | 15 | 996 | Mean Difference (IV, Random, 95% CI) | 0.87 [‐0.30, 2.04] |
| 9.3 Characterised by other means | 67 | 5110 | Mean Difference (IV, Random, 95% CI) | 0.49 [0.01, 0.96] |
| 9.4 Mixed | 3 | 60 | Mean Difference (IV, Random, 95% CI) | ‐0.37 [‐1.95, 1.22] |
| 10 Weight ‐ randomisation year Show forest plot | 23 | 1940 | Mean Difference (IV, Random, 95% CI) | 0.48 [‐0.44, 1.39] |
| 10.1 Before 1960 | 0 | 0 | Mean Difference (IV, Random, 95% CI) | 0.0 [0.0, 0.0] |
| 10.2 1960 to 1979 | 1 | 21 | Mean Difference (IV, Random, 95% CI) | 3.83 [1.66, 6.00] |
| 10.3 1980 to 1999 | 14 | 372 | Mean Difference (IV, Random, 95% CI) | 0.34 [‐0.95, 1.64] |
| 10.4 After 1999 | 8 | 1547 | Mean Difference (IV, Random, 95% CI) | 0.01 [‐1.09, 1.12] |
| 11 Weight ‐ trials where the intervention lasts fewer than three days compared with trials where the intervention lasts three days or more Show forest plot | 94 | 6916 | Mean Difference (IV, Random, 95% CI) | 1.13 [0.50, 1.75] |
| 11.1 Three days or more | 89 | 6758 | Mean Difference (IV, Random, 95% CI) | 1.18 [0.54, 1.83] |
| 11.2 Less than three days | 5 | 158 | Mean Difference (IV, Random, 95% CI) | 0.15 [‐1.62, 1.92] |
| Outcome or subgroup title | No. of studies | No. of participants | Statistical method | Effect size |
| 1 Hand‐grip strength ‐ overall Show forest plot | 14 | 783 | Mean Difference (IV, Random, 95% CI) | 1.47 [0.58, 2.37] |
| Outcome or subgroup title | No. of studies | No. of participants | Statistical method | Effect size |
| 1 Hand‐grip strength ‐ overall Show forest plot | 18 | 1240 | Mean Difference (IV, Random, 95% CI) | 0.96 [0.15, 1.76] |
| Outcome or subgroup title | No. of studies | No. of participants | Statistical method | Effect size |
| 1 Six‐minute walking distance ‐ overall Show forest plot | 1 | 102 | Mean Difference (IV, Random, 95% CI) | 133.27 [24.32, 242.22] |