Le soutien nutritionnel pour les adultes hospitalisés à risque nutritionnel
Résumé scientifique
Contexte
La prévalence de la malnutrition liée à des maladies dans les hôpitaux d'Europe occidentale est estimée à environ 30 %. Il n'existe pas de consensus concernant la question de savoir si un mauvais état nutritionnel provoque de moins bons résultats cliniques ou si cela représente seulement une association. L'intention avec toutes les formes de soutien nutritionnel est d'augmenter l'apport en nutriments essentiels et d'améliorer les résultats cliniques. Les précédentes revues ont montré des résultats contradictoires en ce qui concerne les effets du soutien nutritionnel.
Objectifs
Évaluer les bénéfices et les inconvénients du soutien nutritionnel par rapport à l'absence d'intervention, le traitement habituel, ou un placebo chez les adultes hospitalisés à risque nutritionnel.
Stratégie de recherche documentaire
Nous avons effectué des recherches dans le registre Cochrane des essais contrôlés (CENTRAL) dans la Bibliothèque Cochrane, sur MEDLINE (Ovid SP), EMBASE (Ovid SP), LILACS (BIREME), et Science Citation Index Expanded (Web of Science). Nous avons également consulté le World Health Organization International Clinical Trials Registry Platform (www.who.int/ictrp) ; ClinicalTrials.gov ; Turning Research Into Practice (TRIP) ; Google Scholar ; et BIOSIS, ainsi que les références bibliographiques des articles de revue pertinents et les documents personnels. Les recherches sont à jour jusqu'en février 2016.
Critères de sélection
Nous avons inclus les essais cliniques randomisés, indépendamment du type de publication, de la date de publication, et de la langue, comparant le soutien nutritionnel par rapport à un groupe de contrôle chez les adultes hospitalisés à risque nutritionnel. Nous avons exclu les essais évaluant un soutien nutritionnel non‐standard.
Recueil et analyse des données
Nous avons utilisé les procédures méthodologiques standard prévues par Cochrane et le groupe Cochrane sur les affections hépato‐biliaires. Nous avons utilisé les domaines des essais pour évaluer les risques d'erreurs systématiques (biais). Nous avons réalisé des analyses séquentielles d'essais pour contrôler les risques d'erreurs aléatoires. Nous avons considéré une valeur P de 0,025 ou moins comme étant statistiquement significative. Nous avons utilisé la méthodologie GRADE. Nos critères de jugement principaux étaient la mortalité toutes causes confondues, les événements indésirables graves, et la qualité de vie liée à la santé.
Résultats principaux
Nous avons inclus 244 essais cliniques randomisés avec 28 619 participants qui répondaient à nos critères d'inclusion. Nous avons jugé que tous les essais étaient à risque élevé de biais. Deux essais ont pris en compte un tiers de tous les participants inclus. Les participants inclus étaient hétérogènes en ce qui concerne la maladie (20 affections médicales différentes). Les interventions expérimentales comprenaient la nutrition parentérale (86 essais) ; la nutrition entérale (alimentation par sonde) (80 essais) ; le soutien nutritionnel par voie orale (55 essais) ; les interventions mixtes (12 essais) ; le soutien nutritionnel général (9 essais) ; et l'alimentation enrichie (2 essais). Les interventions de contrôle comprenaient le traitement habituel (122 essais) ; l'absence d'intervention (107 essais) ; et un placebo (15 essais). Dans 204 des 244 essais, l'intervention durait trois jours ou plus.
Nous n'avons trouvé aucune preuve indiquant une différence entre le soutien nutritionnel et les groupes de contrôle concernant la mortalité à court terme (à la fin de l'intervention). Le risque absolu était de 8,3 % dans les groupes témoins par rapport à 7,8 % (7,1 % à 8,5 %) dans les groupes d'intervention, sur la base d'un risque relatif (RR) de 0,94 (intervalle de confiance à 95 % (IC) 0,86 à 1,03, P = 0,16, 21 758 participants, 114 essais, preuves de faible qualité). Nous n'avons trouvé aucune preuve indiquant une différence entre le soutien nutritionnel et les groupes de contrôle concernant la mortalité à long terme (lors du suivi le plus long). La réduction absolue du risque était de 13,2 % dans le groupe témoin, par rapport à 12,2 % (11,6 % à 13 %) après les interventions nutritionnelles, sur la base d'un RR de 0,93 (IC à 95 % 0,88 à 0,99, P = 0,03, 23 170 participants, 127 essais, preuves de faible qualité). L'analyse séquentielle des essais a montré que nous avons suffisamment d'informations pour évaluer une réduction du risque relatif d'environ 10 % ou plus seulement. Une réduction du risque relatif de 10 % ou plus pourrait être réfutée.
Nous n'avons trouvé aucune preuve indiquant une différence entre le soutien nutritionnel à court terme et les groupes de contrôle au niveau des événements indésirables graves. Le risque absolu était de 9,9 % dans les groupes témoins contre 9,2 % (8,5 % à 10 %), avec la nutrition, sur la base d'un RR de 0,93 (IC à 95 % 0,86 à 1,01, P = 0,07, 22 087 participants, 123 essais, preuves de faible qualité). Lors du suivi à long terme, la réduction du risque d'événements indésirables graves était de 1,5 %, à partir de 15,2 % dans les groupes de contrôle jusqu'à 13,8 % (12,9 % à 14,7 %) après le soutien nutritionnel (RR 0,91, IC à 95 % 0,85 à 0,97, P = 0,004, 23 413 participants, 137 essais, preuves de faible qualité). Cependant, l'analyse séquentielle des essais a montré que nous avons suffisamment d'informations pour évaluer une réduction du risque relatif d'environ 10 % ou plus seulement. Une réduction du risque relatif de 10 % ou plus pourrait être réfutée.
Les analyses séquentielles des essais portant sur la nutrition entérale seule ont montré que la nutrition entérale pourrait réduire les événements indésirables graves lors du suivi le plus long chez les personnes ayant différentes maladies. Nous n'avons identifié aucun effet bénéfique du soutien nutritionnel par voie orale ou parentérale sur la mortalité toutes causes confondues et les événements indésirables graves dans les sous‐groupes.
Seuls 16 essais évaluaient la qualité de vie liée à la santé. Nous avons réalisé une méta‐analyse de deux essais rapportant le score d'utilité EuroQoL lors du suivi à long terme et nous avons trouvé des preuves de très faible qualité indiquant des effets du soutien nutritionnel sur la qualité de vie (différence moyenne (DM) ‐0,01, IC à 95 % ‐0,03 à 0,01 ; 3961 participants, deux essais). L'analyse séquentielle des essais a montré que nous n'avons pas suffisamment d'informations pour confirmer ou réfuter des effets cliniquement pertinents de l'intervention sur la qualité de vie.
Le soutien nutritionnel peut augmenter le poids lors du suivi à court terme (DM de 1,32 kg, IC à 95 % 0,65 à 2,00, 5445 participants, 68 essais, preuves de très faible qualité).
Conclusions des auteurs
Il existe des preuves de faible qualité concernant les effets du soutien nutritionnel sur la mortalité et les événements indésirables graves. Sur la base des résultats de notre revue, il ne semble pas entraîner une réduction du risque relatif d'environ 10 % ou plus de mortalité toutes causes confondues ou des événements indésirables graves lors d'un suivi à court et long terme.
Il existe des preuves de très faible qualité indiquant une prise de poids avec le soutien nutritionnel à la fin du traitement chez les adultes hospitalisés déterminés comme étant à risque nutritionnel. Les effets du soutien nutritionnel sur tous les autres critères de jugement ne sont pas clairs.
Malgré la population cliniquement hétérogène et le risque élevé de biais dans tous les essais inclus, nos analyses ont montré peu de signes d'hétérogénéité statistique. Des essais supplémentaires évaluant la nutrition entérale (alimentation par sonde) pour différents groupes de personnes pourraient être justifiés. Les futurs essais devraient être menés avec de faibles risques d'erreurs systématiques et de faibles risques d'erreurs aléatoires, et ils devraient également évaluer la qualité de vie liée à la santé.
PICO
Résumé simplifié
Le soutien à l'alimentation pour les adultes hospitalisés présentant un risque de malnutrition
Question de la revue
Nous avons examiné les bénéfices et les inconvénients du soutien à l'alimentation fourni aux adultes hospitalisés présentant un risque de malnutrition tel que défini par différentes méthodes, allant des évaluations formellement confirmées à « l'opinion des auteurs de l'étude ».
Contexte
Les personnes malnutries lors de leur admission à l'hôpital pourraient présenter un risque accru de décès ou être plus susceptibles de développer des complications graves. Fournir un soutien à l'alimentation pourrait les aider, bien que la malnutrition puisse être associée à une grave maladie sous‐jacente. Dans ce cas, des interventions spécifiques visant à améliorer leur état nutritionnel ne serait pas bénéfique, car il est possible que ce ne soit pas l'état nutritionnel en soi qui augmente le risque de décès ou de développer des complications graves.
Date de la recherche
Février 2016.
Caractéristiques de l'étude
Nous avons inclus 244 études ayant un total de 28 619 participants. Les études incluses ont évalué les effets de différents types de soutien nutritionnel (par exemple des conseils diététiques, l'enrichissement régulier de l'alimentation avec des protéines et des calories supplémentaires, les boissons protéinées, l'alimentation au moyen d'un cathéter directement dans une veine ou d'un tube directement dans l'estomac ou dans les intestins). Le soutien nutritionnel fourni dans les études a été offert à des personnes ayant de nombreux types différents de maladies et subissant des procédures variées. Leur point commun était le risque de malnutrition, défini par au moins une méthode, telle que le jugement clinique des auteurs de l'étude.
Principaux résultats
Nous n'avons trouvé aucune preuve indiquant une différence entre le soutien nutritionnel et les groupes de comparaison pour le risques de décès. Nous avons trouvé que 8,3 % des personnes étaient décédées lors d'un suivi à court terme dans les groupes de comparaison par rapport à 7,8 % chez celles ayant reçu un soutien nutritionnel (preuves de faible qualité). Au moment du suivi le plus long, 13,2 % des participants dans les groupes de comparaison sont décédés comparé à 12,2 % chez ceux ayant reçu un soutien nutritionnel (preuves de faible qualité). Nous n'avons trouvé aucune preuve d'une différence entre le soutien nutritionnel et le groupe de comparaison concernant le risque de complications graves à court terme. Les personnes dans les groupes témoins avaient un taux de complications graves de 9,9 % lors d'un suivi à court terme par rapport à 9,2 % avec la nutrition (preuves de faible qualité). Lors du suivi à long terme, 15,2 % des participants dans les groupes témoins avaient une complication grave par rapport à 13,8 % dans les groupes recevant le soutien nutritionnel (preuves de faible qualité). Ces résultats sont basés sur un peu plus de 21 000 participants. Le soutien nutritionnel peut augmenter le poids d'environ 1,32 kg par rapport aux personnes dans les groupes témoins. Le bénéfice d'augmenter en moyenne le poids de 1,32 kg est incertain. Nous n'avons pas pu évaluer de manière fiable les effets sur la qualité de vie en raison des diverses manières dont les auteurs ont rapporté cette information. Lorsque nous avons examiné les différents types de soutien nutritionnel, une analyse secondaire a suggéré que l'alimentation par sonde pourrait être bénéfique, et réduire les complications graves lors du suivi le plus long, mais les preuves concernant ce résultat sont limitées.
Qualité des preuves
Les preuves pour nos conclusions concernant les décès et les complications graves sont de faible qualité et de très faible qualité pour les modifications du poids. Tous les essais présentaient un risque élevé de biais (par exemple, les essais ont tous été réalisés d'une manière qui surestime les bénéfices et sous‐estime les risques du soutien nutritionnel). Les résultats étaient cohérents concernant les décès et les complications graves, mais les effets sur le poids variaient largement entre les études.
Authors' conclusions
Summary of findings
| Nutrition support versus no intervention, placebo, or treatment as usual in hospitalised adults at nutritional risk | ||||||
| Patient or population: hospitalised adults at nutritional risk | ||||||
| Outcomes | Anticipated absolute effects* (95% CI) | Relative effect | № of participants | Quality of the evidence | Comments | |
| Risk with no intervention, placebo, or treatment‐as‐usual | Risk with nutrition support | |||||
| All‐cause mortality | ||||||
| ‐ at end of intervention | Study population | RR 0.94 | 21,758 | ⊕⊕⊝⊝ | Trial Sequential Analysis of all nutrition support trials shows that the futility area is reached. This leads us to conclude that the possible intervention effect, if any, is less than 11%. Multiple eligible treatments were used in 9 trials generating a further 13 comparisons (= 127 studies). | |
| 83 per 1.000 | 78 per 1.000 | |||||
| ‐ at maximum follow‐up | Study population | RR 0.93 | 23170 | ⊕⊕⊝⊝ | Trial Sequential Analysis of all nutrition support trials shows that the futility area is reached. This leads us to conclude that any possible intervention effect, if any, is less than 10%. Multiple eligible treatments were used in 10 trials generating a further 14 comparisons (= 141 studies). | |
| 132 per 1.000 | 122 per 1.000 | |||||
| Serious adverse events | ||||||
| ‐ at end of intervention | Study population | RR 0.93 | 22,087 | ⊕⊕⊝⊝ | Trial Sequential Analysis of all nutrition support trials shows that the futility area is reached. This leads us to conclude that any possible intervention effect, if any, is less than 11%. Multiple eligible treatments were used in 10 trials generating a further 14 comparisons (= 137 studies). | |
| 99 per 1.000 | 92 per 1.000 | |||||
| at maximum follow‐up | Study population | RR 0.91 | 23,413 | ⊕⊕⊝⊝ | Trial Sequential Analysis of all nutrition support trials shows that the futility area is reached. This leads us to conclude that any possible intervention effect, if any, is less than 10%. Multiple eligible treatments were used in 11 trials generating a further 15 comparisons (= 152 studies). | |
| 152 per 1.000 | 138 per 1.000 | |||||
| Health‐related quality of life | ||||||
| ‐at end of intervention | We found that nutrition support of any type for participants at nutritional risk (defined by our inclusion criteria, including as defined by the trial investigators) did not show any benefit or harm with regard to quality of life at end of intervention or at maximum follow‐up. Few trials used similar quality‐of‐life questionnaires, and only data from EuroQoL utility score and SF‐36 could be used in a meta‐analysis. Whichever score was used, we found no beneficial or harmful effects. While most trials found no beneficial or harmful effect of nutrition support, only a few trials found a beneficial effect on specific parameters. All included trials assessing health‐related quality of life were at high risk of bias. | ‐ | (16 RCTs) | ‐ | ||
| at maximum follow‐up ((EuroQol) ) | Control group mean quality of life scores were 0.486 and 0.175. | Quality of life was on average 0.01 units lower | ‐ | 3961 | ⊕⊝⊝⊝ | |
| Weight at the end of intervention | Control group weight ranged from 45.9 to 73.03 kg | MD 1.32 kg higher | ‐ | 5445 | ⊕⊝⊝⊝ | |
| *The risk in the intervention group (and its 95% confidence interval) is based on the assumed risk in the comparison group and the relative effect of the intervention (and its 95% CI). | ||||||
| GRADE Working Group grades of evidence | ||||||
| 1Downgraded by 2 levels because of a very serious risk of bias. | ||||||
Background
Description of the condition
The prevalence of disease‐related malnutrition in Western European hospitals is estimated to be about 30% (Norman 2008a). To date, there is no consensus whether poor nutritional status causes poorer clinical outcome or if it is merely associated with it. A poor nutritional status might be a consequence of the underlying disease rather than a cause of poor clinical outcome.
The aetiology of malnutrition may be divided into three entities:
1. insufficient delivery of nutrients that may be due to low consumption, low absorption of nutrients through the gastrointestinal tract, failure to use the absorbed nutrients, or an increase in excretion of nutrients which may be termed starvation‐related malnutrition;
2. increased catabolism that may be due to an underlying chronic disease or a consequent treatment which may be termed chronic disease‐related malnutrition;
3. acute disease or injury states with marked inflammatory response (such as major infections, burn, and trauma) (Jensen 2010).
It may be that provision of nutrition support may benefit people with starvation‐related malnutrition and not benefit adults with chronic disease‐related malnutrition. The many adverse outcomes associated with malnutrition include malfunctioning of the immune system, impaired wound healing, muscle wasting, longer lengths of hospital stay, higher treatment costs, and increased mortality (Barker 2011).
Many screening tools, anthropometric measurements, biomarkers, and conditions have been proposed to identify people at nutritional risk. Three of the main screening tools devised are the Nutritional Risk Screening 2002 (NRS 2002) (Kondrup 2003), the Malnutrition Universal Screening Tool (MUST) (Elia 2003), and the Mini Nutritional Assessment (MNA) (Vellas 1999). The Subjective Global Assessment (SGA) (Detsky 1987) is an assessment tool that aims at predicting clinical outcome (Van Bokhorst 2014). The NRS, MUST, and MNA screening tools do not distinguish between being at risk of malnutrition and being malnourished, whereas the SGA aims only at identifying people who are malnourished. Although not entirely similar, the screening tools, including the SGA, use many of the same questions and focus on identifying 'people at nutritional risk'.
The screening tools look at two aspects of being at nutritional risk. The first aspect is whether the person is currently malnourished, and the second is whether the person might become malnourished in the future. Body mass index (BMI), weight loss during the last three or six months, and food intake during the last week are all variables assessed when determining if a person is currently malnourished. The assumption that a person might become malnourished in the future is based on an association between certain conditions and nutritional requirements. The mechanism of action is thought to be a high rate of catabolism either directly associated with the condition or the consequent treatment leading to an increased protein requirement. A low intake of food might contribute. Examples of such conditions and interventions are open major abdominal surgery (Morlion 1998); stroke (Chalela 2004); severe infections, defined as sepsis with organ dysfunction (Shaw 1987); people in intensive care units with organ failure (Larsson 1990b); and sick elderly people (Hickson 2006; Norman 2008a). In these conditions, the protein requirement to maintain nitrogen balance, if possible at all, is approximately 1.2 g/kg a day or more.
Biomarkers and anthropometric measures have also been used to define nutritional risk (Van Bokhorst 2014). The biomarkers include low levels of albumin, low levels of other plasma proteins, and low lymphocyte counts (Van Bokhorst 2014). It is questionable if the biomarkers are directly related to being at nutritional risk (Van Bokhorst 2014). The anthropometric measures include, in addition to body weight and height or BMI, triceps skinfold and arm muscle circumference.
Description of the intervention
The intention with all forms of nutrition support is to increase uptake of essential nutrients. The nutrition support can come in many different forms.
The five main ways of administration may be classified as 'general nutrition support', 'fortified foods', 'oral nutrition supplements', 'enteral nutrition', and 'parenteral nutrition' (Lochs 2006). 'General nutrition support' aims at increasing normal food consumption. It includes, but is not limited to, dietary counselling and usually involves an estimation of the person's requirements and guidance of the person as to which food items might be suitable. 'Fortified foods' are normal food enriched with specific nutrients, in particular with energy and proteins with or without additional vitamins, minerals, and trace elements (Lochs 2006). 'Oral nutrition supplements' are supplementary oral intake of food for special medical purposes in addition to the normal food, but may replace normal oral intake entirely. Oral nutrition supplements are usually liquid, but they are also available in other forms such as powder, dessert‐style, or bars (Lochs 2006). 'Enteral nutrition' is the infusion of a standard liquid formulation through a tube into either the stomach or the small intestine. 'Parenteral nutrition' is intravenous fluids containing both a source of nitrogen and a non‐protein calorie source as well as all essential nutrients.
One special type of nutrition support is immuno‐nutrition which contains nutrients believed to possess specific properties (e.g. immune‐modulating). Examples of such nutrients are enhanced amounts of glutamine, arginine, fish oil, and branched chain amino acids‐enriched formulas (Calder 2003; Tan 2014).
How the intervention might work
Being nutritionally at risk consists of two complex components (see Description of the condition). The result is that the cells and organs of the body are thought to function sub‐optimally. The main focus of nutrition support is to provide essential nutrients in order to preserve or restore normal functions of a variety of cells and organs, which might improve clinical outcomes (i.e. fewer complications, fewer infections, earlier mobilisation), and improved quality of life (Stratton 2003).
Why it is important to do this review
The prevalence of disease‐related malnutrition in hospitals is considerable. A substantial disease burden and healthcare cost can be alleviated by nutrition support if it is effective and, reciprocally, a considerable cost and a number of complications associated with nutrition support may occur if it is ineffective or even harmful.
One meta‐analysis from 2003 analysing randomised clinical trials of enteral nutrition (tube‐feeding or oral supplements) found a 50% reduction in complications when trials including diverse participant groups were aggregated in a single analysis (Stratton 2003). However, this analysis did not assess the risks of bias in the included trials. One systematic review assessing the effect of enteral or oral nutrition support versus untreated controls assessed risk of bias in the included trials in terms of allocation concealment and blinding (Koretz 2007). However, this review did not assess incomplete outcome data, selective outcome reporting, or for‐profit bias (Chan 2004; Higgins 2011; Lundh 2017). In spite of these caveats, this systematic review showed that oral nutrition support did not seem to benefit any subgroup of people except geriatric participants (Koretz 2007). There was no aggregated analysis of all the trials (Higgins 2011). Another meta‐analysis looked at adults having abdominal surgery (Stratton 2007). Despite the fact that both Koretz 2007 and Stratton 2007 included people having abdominal surgery they reached opposing conclusions. The first meta‐analysis showed no benefit of enteral nutrition in people having abdominal surgery for total complications nor for mortality. The second meta‐analysis showed benefit of both oral and enteral nutrition support. Yet another systematic review assessed the effects of parenteral nutrition support versus no nutrient intake (Koretz 2001). This review concluded that there were not enough data to assess whether parenteral nutrition had any effect in people being either severely malnourished or with a high rate of catabolism (i.e. in people at nutritional risk). The overall results showed no significant beneficial effect of parenteral nutrition, except in a subgroup assessing preoperative participants (Koretz 2001). One more recent systematic review and meta‐analysis looking at enteral nutrition for people in intensive care units concluded that only trials with a high risk of bias showed reduced mortality (Koretz 2014). A meta‐analysis including malnourished medical inpatients found no effect on clinical outcomes such as mortality or infection, but found that nutrition support increased weight (Bally 2016).
Nutrition support might have beneficial effects in adults at risk of malnutrition, but previous meta‐analyses have shown conflicting results (Stratton 2003; Koretz 2007; Stratton 2007; Koretz 2014; Bally 2016) and they have not exclusively included participants with an indication for nutrition support (Koretz 2007). No prior systematic review has been conducted that fully takes into account the risk of systematic errors due to bias, the risks of design errors, and risks of random errors ('play of chance') (Keus 2010; Garattini 2016). We chose to focus on hospitalised adults with malnutrition or at risk of malnutrition because this population seemed to have the largest potential to benefit from nutrition support.
Objectives
To assess the benefits and harms of nutrition support versus no intervention, treatment as usual, or placebo in hospitalised adults at nutritional risk.
Methods
Criteria for considering studies for this review
Types of studies
We included all randomised clinical trials, irrespective of publication type, publication status, publication date, and language. We excluded cluster‐randomised and quasi‐randomised studies. In line with our protocol, we plan to assess observational data of harms in a separate review.
Types of participants
Adult participants, defined as people of 18 or more years of age, hospitalised at the beginning of the intervention period, and fulfilling one or more of the following inclusion criteria and none of the exclusion criteria:
Inclusion criteria
-
Participants characterised as at nutritional risk according to the NRS 2002, MUST, MNA, or SGA criteria (see Background).
-
Participants characterised as at least moderately at risk of malnutrition according to the screening tool NRS 2002 (i.e. BMI less than 20.5 kg/m2, weight loss of at least 5% during the last three months, weight loss of at least 10% during the last six months, or insufficient food intake during the last week (50% of requirement or less) (Kondrup 2003)).
-
Participants theoretically known to be at nutritional risk either due to increased nutritional requirements or decreased food intake. We accepted the following conditions and procedures: major surgery such as open abdominal (liver, pancreas, gastro‐oesophageal, small intestine, colorectal) surgery; stroke; adults in intensive care units; adults with severe infections, and frail elderly people (defined by trialists) with pulmonary disease, oncology, or minor surgery (e.g. hip fracture) (Shaw 1987; Larsson 1990b; Morlion 1998; Chalela 2004; Norman 2008a).
-
Participants characterised as nutritionally at risk due to surrogate biomarkers such as low levels of albumin, low levels of other plasma proteins, or low lymphocyte counts or anthropometric markers (BMI, triceps skinfold, arm muscle circumference).
-
Participants characterised by the trialists as malnourished, undernourished, at nutritional risk, or similar terms, using a classification not mentioned above.
-
Participants characterised by the trialists as malnourished, undernourished, at nutritional risk, or similar terms, without specifying how this classification was made.
Exclusion criteria
-
Children or adolescents.
-
Pregnant or lactating women.
-
People receiving dialysis.
Traditionally, trials with participants below 18 years old, pregnant and lactating women, and participants receiving dialysis are investigated in separate reviews. We therefore did not include trials with such participants in this systematic review. If trials contained a mix of participants planned by our protocol to be excluded and included, we contacted authors for specific data for the participants we planned to include. We excluded trials when we did not receive data on the relevant trial participants, noting the reason for our exclusion.
Types of interventions
Nutrition support (experimental group)
We accepted any intervention that the trialists defined as nutrition support or similar terms. As mentioned in the Description of the intervention (Background), nutrition support may include general nutrition support, fortified foods, oral supplements, enteral nutrition, and parenteral nutrition.
We did not include the following interventions: immuno‐nutrition, elemental diets, glutamine only as the primary intervention, micronutrients only, or similar non‐standard nutrition support interventions (i.e. modified in a way intended to provide other properties than the purely nutritional).
Control group
We defined 'no intervention', placebo, or 'treatment as usual' as control interventions. We classified the control intervention as 'no intervention' if the control group received no intervention other than a co‐intervention, planned to be delivered similarly to both the experimental and control groups. 'Treatment as usual' referred to any type of non‐specific supportive intervention such as 'treatment as usual', 'standard care', or 'clinical management' as control interventions (Jakobsen 2011). We did not accept enteral nutrition and parenteral nutrition (unless the parenteral nutrition was standard fluids 5% to 10% glucose/dextrose) as control interventions.
Co‐interventions
We allowed co‐interventions, but only if a co‐intervention was intended to be delivered similarly to both the experimental group and the control group (Jakobsen 2013).
Types of outcome measures
Primary outcomes
-
All‐cause mortality.
-
Serious adverse events. We used the International Conference on Harmonisation (ICH) Guidelines for Good Clinical Practice's definition of a serious adverse event (ICH‐GCP 1997), that is, any untoward medical occurrence that results in death, is life‐threatening, requires hospitalisation or prolongation of existing hospitalisation, or results in persistent or significant disability or incapacity, or is a congenital anomaly or birth defect. In contrast to the term 'adverse reaction', the serious adverse events do not have to be related to the intervention.
-
Health‐related quality of life measured on any validated scale, such as the 36‐item Short Form (SF‐36) (Ware 1992) (continuous outcome).
Secondary outcomes
-
Time to death (survival data).
-
Morbidity (as defined by the trialists) (dichotomous outcome). If trial investigators did not use the term 'morbidity', we did not include these data within our analysis outcome.
-
BMI (continuous outcome).
-
Weight (continuous outcome).
-
Hand‐grip strength (continuous outcome).
-
Six‐minute walking distance (continuous outcome).
We estimated all continuous and dichotomous outcomes at two time points: at the end of the trial intervention period as defined by the trialists (the most important outcome measure time point in this review) and at maximum follow‐up.
Search methods for identification of studies
Electronic searches
We searched Cochrane Central Register of Controlled Trials (CENTRAL) in the Cochrane Library, MEDLINE (Ovid SP), Embase (Ovid SP), LILACS (BIREME), BIOSIS (Web of Science) and Science Citation Index Expanded (Web of Science) (Royle 2003), from conception till February 2016, in order to identify relevant trials. The search strategies with the time spans of the searches are given in Appendix 1. We also searched the World Health Organization International Clinical Trials Registry Platform (www.who.int/ictrp); clinicaltrials.gov; Turning Research Into Practice (TRIP); and Google Scholar.
Searching other resources
We identified and included where relevant the bibliographies of review articles and identified trials by searching personal files. We also looked through conference proceedings from the American Society for Parenteral and Enteral Nutrition and the European Society for Parenteral and Enteral Nutrition meetings. We also contacted pharmaceutical companies (Abbott Nutrition, Nutricia Research, Fresenius Kabi, Bioscrip, Novartis, Nestlé, GlaxoSmithKline plc, Bristol‐Meyer‐Squibb, Ross Laboratories, ThriveRx, and New England Life Care) as well as national nutrition industry collaborations (please see Appendix 2).
Data collection and analysis
We performed the review following the Cochrane Handbook for Systematic Reviews of Interventions (Higgins 2011) and the Cochrane Hepato‐Biliary Group Module (Gluud 2016). We performed the analyses using Review Manager 5 (RevMan 2014), STATA 13 (Stata 2013), and Trial Sequential Analysis (Thorlund 2011; TSA 2011).
Selection of studies
We divided the work of evaluating the identified trials among 16 review authors. Two independent review authors evaluated each trial. If one identified the trial as relevant but the other did not, the two review authors discussed the reasoning behind their decision. If they still disagreed, a third review author (JCJ) resolved the issue.
Data extraction and management
Two review authors independently extracted and validated data using data extraction forms that were designed for the purpose. The two review authors discussed any disagreement concerning the extracted data. If they still disagreed, a third review author (JCJ) resolved the issue. In case of relevant data not being available, we attempted to contact the trial authors. All articles were data‐extracted by review authors who spoke the language fluently.
Assessment of risk of bias in included studies
Because of the risk of overestimation of beneficial intervention effects in randomised clinical trials with unclear or inadequate methodological quality (Schulz 1995; Moher 1998; Sutton 2000; Kjaergard 2001; Gluud 2006; Wood 2008; Hrobjartsson 2012; Lundh 2017; Savović 2012a; Savović 2012b; Hrobjartsson 2013; Hrobjartsson 2014a; Hrobjartsson 2014b), two review authors independently assessed the risks of bias for each trial and outcome. We used the following domains: allocation sequence generation, allocation concealment, blinding, incomplete outcome data, selective outcome reporting, industry bias, and other apparent biases (Higgins 2011; Gluud 2015), using the following definitions:
Allocation sequence generation
-
Low risk of bias: sequence generation was achieved using computer random‐number generation or a random‐number table. Drawing lots, tossing a coin, shuffling cards, and throwing dice were adequate if performed by an independent person not otherwise involved in the trial.
-
Unclear risk of bias: the method of sequence generation was not specified.
-
High risk of bias: the sequence generation method was not random or only quasi‐randomised. We will only use these studies for the assessments of harms and not for benefits.
Allocation concealment
-
Low risk of bias: the participant allocations could not have been foreseen in advance of, or during, enrolment. Allocation was controlled by a central and independent randomisation unit, on‐site locked computer, identical‐looking numbered sealed opaque envelopes, drug bottles or containers prepared by an independent pharmacist or investigator. The allocation sequence was unknown to the investigators.
-
Unclear risk of bias: the method used to conceal the allocation was not described so that intervention allocations may have been foreseen in advance of or during enrolment.
-
High risk of bias: the allocation sequence was likely to be known to the investigators who assigned the participants. We will only use these studies for the assessments of harms and not for benefits.
Blinding of participants and treatment providers
-
Low risk of bias: it was mentioned that both participants and personnel providing the interventions were blinded and this was described.
-
Uncertain risk of bias: it was not mentioned if the trial was blinded, or the extent of blinding was insufficiently described.
-
High risk of bias: no blinding or incomplete blinding was performed.
Blinding of outcome assessment
-
Low risk of bias: it was mentioned that outcome assessors were blinded and this was described.
-
Uncertain risk of bias: it was not mentioned if the trial was blinded, or the extent of blinding was insufficiently described.
-
High risk of bias: no blinding or incomplete blinding was performed.
Incomplete outcome data
-
Low risk of bias: missing data were unlikely to make treatment effects depart from plausible values. This could either be that there were no dropouts or withdrawals for all outcomes, or the numbers and reasons for the withdrawals and dropouts for all outcomes were clearly stated, could be described as being similar in both groups, and the trial handled missing data appropriately in an intention‐to‐treat analysis using proper methods (e.g. multiple imputations)*. Generally, we judged the trial to be at a low risk of bias due to incomplete outcome data if dropouts are less than 5%. However, the 5% cut‐off is not definitive.
-
Unclear risk of bias: there was insufficient information to assess whether missing data were likely to introduce bias into the results.
-
High risk of bias: the results were likely to be biased due to missing data, either because the pattern of dropouts could be described as being different in the two intervention groups or the trial used improper methods to deal with the missing data (e.g. last observation carried forward).
* "Multiple imputation is a general approach to the problem of missing data. It aims to allow for the uncertainty about the missing data by creating several different plausible imputed data sets and appropriately combining results obtained from each of them. The first stage is to create multiple copies of the data set, with the missing values replaced by imputed values. These are sampled from their predictive distribution based on the observed data ‐ thus multiple imputation is based on a Bayesian approach. The imputation procedure must fully account for all uncertainty in predicting the missing values by injecting appropriate variability into the multiple imputed values. The second stage is to use standard statistical methods to fit the model of interest to each of the imputed data sets. The estimated associations from the imputed data sets will differ and are only useful when a mean is used to give overall estimated associations. Valid inferences are obtained because we obtain a mean over the distribution of the missing data given the observed data" (Sterne 2009).
Selective outcome reporting
-
Low risk of bias: a protocol was published before or at the start of the trial, and the outcomes set out in the protocol were reported. If there is no protocol or the protocol was published after the trial had begun, reporting of all‐cause mortality and serious adverse events gives the trial a grade of low risk of bias.
-
Unclear risk of bias: no protocol was published and the outcomes all‐cause mortality and serious adverse events were not reported.
-
High risk of bias: the outcomes in the protocol were not reported.
For‐profit bias
-
Low risk of bias: the trial appeared to be free of industry sponsorship or other type of for‐profit support that may lead to manipulation of the trial design, conduct, or results.
-
Unclear risk of bias: it was unclear whether the trial was free of for‐profit bias as no information on clinical trial support or sponsorship was provided.
-
High risk of bias: the trial was sponsored by industry or received other type of for‐profit support.
Other bias
-
Low risk of bias: the trial appeared to be free of other bias domains (e.g. academic) that could put it at risk of bias.
-
Unclear risk of bias: the trial may or may not have been free of other domains that could put it at risk of bias.
-
High risk of bias: there were other factors in the trial that could put it at risk of bias (e.g. authors have conducted trials on the same topic).
Overall risk of bias
We judged trials to be at a low risk of bias if we rated them at a low risk of bias in all the above domains. We judged trials to be at a high risk of bias if we assessed them as having an unclear risk of bias or a high risk of bias in one or more of the above domains.
We assessed the domains 'blinding of outcome assessment' and 'incomplete outcome data' for each outcome. Thus, we were able to assess the bias risk for each outcome in addition to each trial.
We planned to consider outcome analysis of trials at low risk of bias as our primary analyses on which to base our review conclusions; however, we found no trials at low overall risk of bias.
Measures of treatment effect
Dichotomous outcomes
We calculated risk ratios (RRs) with 95% confidence intervals (CI) for dichotomous outcomes. We, however, considered 97.5% CI as the significance level for our primary outcomes, but this is not possible using the review manager software, see Data synthesis for details.
Continuous outcomes
We included both follow‐up values and change values in the analyses. We used follow‐up values in our analyses if both were reported. We calculated the mean difference (MD) and the standardised mean difference (SMD) with CI for continuous outcomes.
Survival data
We planned to analyse survival data using estimates of log hazard ratios and standard errors; however, no trials reported data suitable for survival analysis. We planned to calculate the log hazard ratios and standard error from any Kaplan‐Meier graph if possible (Higgins 2011). We intended to use the generic inverse‐variance method to meta‐analyse survival data in Review Manager 5.
Unit of analysis issues
Where multiple trial arms were reported in a single trial, we only included the relevant arms. If two comparisons (e.g. parenteral nutrition and enteral nutrition versus standard care) were included in the same trial, we halved the control group to avoid double‐counting.
We included trials with a factorial design. In case of, e.g. a 2 X 2 factorially‐designed trial, we considered the two groups receiving nutrition support as experimental groups and the two groups receiving no nutrition support as control groups.
Dealing with missing data
Dichotomous outcomes
If the trialists used proper methodology (e.g. multiple imputation) to deal with missing data and we judged the dropouts in the groups to be equal, we conducted our primary analysis using these data. We only imputed data for outcomes in our sensitivity analyses.
Continuous outcomes
If trialists used proper methodology (e.g. multiple imputation) to deal with missing data and we judged the dropouts in the groups to be equal, we conducted our primary analysis using these data. We used follow‐up values for all continuous outcomes. If only change values were reported, we analysed the results together with follow‐up values (Higgins 2011). If standard deviations (SDs) were not reported, we calculated the SDs using data from the trial whenever possible. We only used imputed data in our sensitivity analyses.
Sensitivity analysis
To assess the potential impact of missing dichotomous outcomes data, we performed the following two sensitivity analyses (also see Effects of interventions):
-
'Best‐worst‐case' scenario: we assumed that all participants lost to follow‐up in the experimental group survived and had no serious adverse event; and all those participants with missing outcomes in the control group did not survive and had a serious adverse event;
-
'Worst‐best‐case' scenario: we assumed that all participants lost to follow‐up in the experimental group did not survive and had a serious adverse event; and that all those participants lost to follow‐up in the control group survived and had no serious adverse event.
We present results from both scenarios in our review.
To assess the potential impact of missing SDs for continuous outcomes, we performed the following sensitivity analysis (also see Effects of interventions):
-
Where SDs were missing and it was not possible to calculate them, we planned to impute SDs from trials with similar populations and low risk of bias. If we found no trials at low risk of bias, we imputed SDs from trials with a similar population. As the final option, we imputed SDs from all trials.
Assessment of heterogeneity
We assessed the presence of statistical heterogeneity using the Chi2 test with significance set at P value < 0.10 and measured the quantities of heterogeneity using the I2 statistic (Higgins 2002; Higgins 2003). We also produced a forest plot to illustrate any heterogeneity visually.
Assessment of reporting biases
We used a funnel plot to assess reporting bias if 10 or more trials were included in the analysis. Using the asymmetry of the funnel plot, we assessed the risk of bias. For dichotomous outcomes, we used Harbord's test (Harbord 2006) using STATA. For continuous outcomes, we planned to use the regression asymmetry test (Egger 1997) and the adjusted rank correlation (Begg 1994) using STATA (Stata 2013).
Data synthesis
We based our primary conclusions on the results of the primary outcomes with a low risk of bias at the end of intervention. As there are currently no such trials, we considered the results of our primary outcomes with high risk of bias, results of secondary outcomes, results of outcomes at maximum follow‐up, sensitivity analyses, and subgroup analyses as hypothesis‐generating analyses (Jakobsen 2014).
Meta‐analysis
We undertook this meta‐analysis according to the recommendations stated in the Cochrane Handbook for Systematic Reviews of Interventions (Higgins 2011) and the Cochrane Hepato‐Biliary Group web site (hbg.cochrane.org). We used the statistical software Review Manager 5 provided by Cochrane to analyse data (RevMan 2014).
Where data were only available from one trial, we used Fisher's exact test for dichotomous data (Fisher 1922) and Student's t‐test for continuous data (Student 1908).
Assessment of significance
We assessed our intervention effects with both random‐effects model meta‐analyses (DerSimonian 1986) and fixed‐effect model meta‐analyses (DeMets 1987). We used the more conservative point estimate of the two (Jakobsen 2014). We considered as 'the more conservative point estimate', the estimate closest to zero effect (Jakobsen 2014). If the two estimates were equal, we used the estimate with the widest CI (Jakobsen 2014). We used three primary outcomes, and therefore considered a P value of 0.025 or less as statistically significant (Jakobsen 2014). We used the eight‐step procedure to assess whether the thresholds for significance were crossed (Jakobsen 2014).
Secondary outcomes were not adjusted, as we viewed these as hypothesis‐generating.
Trial Sequential Analysis
Traditional meta‐analysis runs the risk of random errors due to sparse data and repetitive testing of accumulating data when updating reviews. Therefore, we performed Trial Sequential Analyses on the primary outcomes in order to calculate the required information size and the breach of the cumulative Z‐curve of the relevant trial sequential monitoring boundaries (www.ctu.dk/tsa/); (TSA 2011; Thorlund 2011; Brok 2008; Wetterslev 2008; Brok 2009; Thorlund 2009; Wetterslev 2009; Thorlund 2010). Hereby, we wished to control the risks of type I errors and type II errors (Thorlund 2011).
For dichotomous outcomes, we estimated the required information size based on the proportion of participants with an event in the control group, a risk ratio reduction of 20%, an alpha of 2.5% because of three primary outcomes (Jakobsen 2014), a beta of 20% (power of 80%), and the diversity calculated from the included trials in the meta‐analysis. A 20% risk ratio reduction would yield a number needed to treat of 50 people at nutritional risk if the mortality in the control group is about 10%. As we could reject a risk ratio reduction of 20% we also performed a post‐hoc TSA for a risk ratio reduction of 10%, to see how small a risk ratio reduction we could reject (see also Effects of interventions). For continuous outcomes, we planned to estimate the required information size, based on the SD observed in the control group of trials at low risk of bias and a minimal relevant difference of 50% of this SD, an alpha of 2.5%, a beta of 20%, and the diversity suggested by the trials in the meta‐analysis.
Zero events were handled in all Trial Sequential Analyses by replacing any zeros with a value of 0.001.
Bayes factor
Bayes factor is the ratio between the probability of the meta‐analysis result, given the null hypothesis (H0) is true, divided by the probability of the meta‐analysis result, given the alternative hypothesis (HA) is true (Jakobsen 2014). We calculated Bayes factor using the Excel sheet provided at the website of the Copenhagen Trial Unit (ctu.dk/tools‐and‐links/bayes‐factor‐calculation.aspx). We calculated Bayes factor using an anticipated risk ratio of 80%. A further explanation of Bayes factor is given in Jakobsen 2014.
Subgroup analysis and investigation of heterogeneity
Below, we list our very large number of preplanned subgroup analyses. Such a large number creates risks for type I errors. Accordingly, we interpreted our subgroup findings conservatively (see 'Data synthesis' for details). We tested for subgroup differences using the formal test for subgroup differences in Review Manager 5 (Borenstein 2009; RevMan 2014).
-
Outcomes at a low risk of bias compared with outcomes at a high risk of bias.
-
Comparison of trials assessing the effects of the following interventions:
-
general nutrition support;
-
fortified foods;
-
oral nutrition support;
-
enteral nutrition;
-
parenteral nutrition.
-
-
Comparison of trials assessing the effects of nutrition support in the following medical specialties:
-
cardiology;
-
medical gastroenterology and hepatology;
-
geriatrics;
-
pulmonary disease;
-
endocrinology;
-
infectious diseases;
-
rheumatology;
-
haematology;
-
nephrology;
-
gastro‐enterological surgery;
-
trauma surgery;
-
orthopaedics;
-
plastic, reconstructive, and aesthetic surgery;
-
vascular surgery;
-
transplant surgery;
-
urology;
-
thoracic surgery;
-
neurological surgery;
-
oro‐maxillo‐facial surgery;
-
anaesthesiology;
-
emergency medicine (for intensive care unit (ICU) participants, see subgroup conditions known to increase nutritional demands);
-
psychiatry;
-
neurology;
-
oncology;
-
dermatology;
-
gynaecology;
-
mixed.
-
-
Comparison of trials where the experimental and control groups received the following (see definitions of 'adequate' and 'inadequate' in the paragraphs below):
-
trials where the experimental group received clearly adequate nutrition and the control group received clearly inadequate nutrition;
-
trials where the experimental group did not receive an inadequate amount of nutrition or the control group received an adequate amount of nutrition, or both;
-
trials where the experimental group was overfed;
-
trials where the calorie and protein intake in the experimental and the control groups could not be obtained from the publications or the study authors.
-
We defined 'adequate intake' in experimental groups to be 80% to 140% of estimated energy expenditure (i.e. adequate range then is 20 to 35 kcal/kg a day in bedridden participants (including participants in intensive care units)).
We defined 'inadequate intake' as less than 80% of the resting energy expenditure (i.e. inadequate intake is less than 20 kcal/kg a day in bedridden participants).
We defined 'overfeeding' as intakes greater than 35 kcal/kg a day except in trials where participants have a known extraordinary energy requirement (e.g. participants with a temperature of 40 °C, participants with extensive burns, participants with unusually high physical activity, etc.).
The resting energy expenditure could either have been given in the trial or calculated by us, using the Harris‐Benedict equation, based on data in the randomised clinical trial (height, weight, age, sex) (Harris 1918).
-
Comparison of trials where the participants were characterised as 'at nutritional risk' by the following screening tools:
-
NRS 2002;
-
MUST;
-
MNA;
-
SGA;
-
participants characterised as 'at nutritional risk' by other means.
-
-
Comparison of trials where the participants were characterised as 'at nutritional risk' due to the following conditions:
-
major surgery such as open abdominal (liver, pancreas, gastro‐oesophageal, small intestine, colorectal) surgery;
-
stroke;
-
people in intensive care units including trauma;
-
people with severe infections;
-
frail elderly people (aged 65 years or over, as mean age of participants) with less severe conditions that were known to increase protein requirements moderately;
-
participants who do not fall into one of the above categories.
-
-
Comparison of trials where the participants were characterised as 'at nutritional risk' due to the following criteria:
-
BMI less than 20.5 kg/m2;
-
weight loss of at least 5% during the last three months;
-
weight loss of at least 10% during the last six months;
-
insufficient food intake during the last week (50% of requirement or less);
-
participants characterised as 'at nutritional risk' by other means.
-
-
Comparison of trials where the participants were characterised as 'at nutritional risk' due to biomarkers or anthropometric measures:
-
biomarkers;
-
anthropometric measures;
-
participants characterised as 'at nutritional risk' by other means.
-
-
Comparison of trials published in the following time periods (using the date when randomisation began if this was reported):
-
before 1960;
-
1960 to 1979;
-
1980 to 1999;
-
after 1999.
-
-
Comparison of trials where the interventions lasted fewer than three days compared to trials where the interventions lasted three days or more.
'Summary of findings' table
We used the GRADE system (Guyatt 2008) to assess the quality of the body of evidence associated with each of the major outcomes in our review. GRADE may show the extent to which one can be confident that an estimate of effect or association reflects the outcome assessed in a systematic review. The quality measure of a body of evidence considers within‐study risk of bias, indirectness of evidence, heterogeneity of data, imprecision of effect estimates, and risk of publication bias. We assessed the precision of the effect estimates according to Jakobsen 2014. We constructed a 'Summary of findings' table (tech.cochrane.org/revman/other‐resources/gradepro/download) presenting the analysis results of the following outcomes: all‐cause mortality, serious adverse events, quality of life, and weight .
Results
Description of studies
Results of the search
We identified 126,594 potentially relevant references through searching the Cochrane Central Register of Controlled Trials (CENTRAL) (n = 39,150), MEDLINE (n = 36,321), Embase (n = 17,201), LILACS (n = 547), BIOSIS (n = 8,197), and Science Citation Index Expanded (n = 25,178). We also found 20 trials by searching Google Scholar, clinicaltrials.gov, and references identified in previous meta‐analyses. We excluded 39,492 reference duplicates. Accordingly, we screened 87,122 records, and excluded 86,36 references based on titles and abstracts. We assessed 786 full‐text articles for eligibility. Of these, we excluded 447 references according to our inclusion and exclusion criteria. We could not find 33 publications, most of which were conducted in China, and it was not possible to access them. We list reasons for exclusion in the table 'Characteristics of excluded studies'. This resulted in 306 publications reporting results of 252 trials that could be included. Eight of these trials are ongoing. Accordingly, we have included 244 trials in our analyses. Figure 1 represents the study flow.

Study flow diagram.
Included studies
We included 306 references for 252 trials, of which eight are ongoing. The trials were conducted all over the world, with 49 from China, 39 from the USA, 31 from the UK, 10 from Germany, nine from Sweden, eight from Australia, seven each from Italy, Spain, Netherlands and Canada, six each from Denmark, France and India, four from Switzerland, three each from Belgium, Croatia, Japan and Turkey, two each from Norway, Taiwan, Hong Kong, South Korea, Ireland, Latvia and Thailand, and one each from New Zealand, Poland, Portugal, Iran, Finland, Greece, Wales, Israel, Russia, Uruguay and Chile. Eleven trials did not report the trial location. For further details on included trials, see 'Characteristics of included studies'.
Participants
The 244 trials randomised 28,619 participants. The number of participants in each trial ranged from eight to 4640. Two trials accounted for one‐third of all included participants (Dennis 2005; Casaer 2011). The mean age was 64.2 years in the 184 trials reporting mean age. The mean proportion of women was 43.6% in the 173 trials reporting sex. We included participants from 20 medical specialties: emergency medicine (n = 12); endocrinology (n = 1); gastro‐enterological surgery (n = 99); medical gastroenterology and hepatology (n = 19); general surgery (n = 2); geriatrics (n = 16); gynaecology (n = 1); infectious disease (n = 2); nephrology (n = 1); neurology (n = 10); neurological surgery (n = 1); oncology (n = 20); oro‐maxillo‐facial surgery (n = 2); orthopaedics (n = 14); pulmonary disease (n = 9); thoracic surgery (n = 4); trauma surgery (n = 11); transplant surgery (n = 4); vascular surgery (n = 4); haematology (n = 1); and mixed medical specialties (n = 11) (Table 1).
| Medical speciality | Experimental group | Control group |
| Emergency medicine | 3 trials used enteral nutrition 8 trials used parenteral nutrition | 7 trials used no intervention 4 trials used treatment as usual |
| Endocrinology | 1 trial used parenteral nutrition | 1 trial used no intervention |
| Gastroenterological surgery | 36 trials used enteral nutrition 13 trials used oral nutrition 40 trials used parenteral nutrition 3 trials used mixed nutrition | 32 trials used no intervention 4 trials used placebo 56 trials used treatment as usual |
| General surgery | 2 trials used parenteral nutrition | 1 trial used no intervention 1 trial used treatment as usual |
| Geriatrics | 1 trial used fortified foods 2 trials used general nutrition support 13 trials used oral nutrition | 9 trials used no intervention 2 trials used placebo 5 trials used treatment as usual |
| Gynaecology | 1 trial used parenteral nutrition | 1 trial used treatment as usual |
| Haematology | 1 trial used parenteral nutrition | 1 trial used placebo |
| Infectious diseases | 2 trials used enteral nutrition | 2 trials used treatment as usual |
| Medical gastroenterology and hepatology | 9 trials used enteral nutrition 3 trials used oral nutrition 5 trials used parenteral nutrition 1 trial used mixed nutrition | 9 trials used no intervention 9 trials used treatment as usual |
| Mixed medical speciality | 2 trials used enteral nutrition 1 trial used fortified foods 1 trial used general nutrition 4 trials used oral nutrition 1 trial used mixed nutrition | 5 trials used no intervention 1 trial used placebo 3 trials used treatment as usual |
| Neprohology | 1 trial used general nutrition | 1 trial used treatment as usual |
| Neurological surgery | 1 trial used parenteral nutrition | 1 trial used treatment as usual |
| Neurology | 3 trials used enteral nutrition 1 trial used general nutrition 5 trials used oral nutrition 1 trial used mixed nutrition | 4 trials used no intervention 6 trials used treatment as usual |
| Oncology | 3 trials used enteral nutrition 1 trial used general nutrition 11 trials used parenteral nutrition 1 trial used mixed nutrition | 9 trials used no intervention 7 trials used treatment as usual |
| Oro‐maxillo‐facial surgery | 1 trial used enteral nutrition 1 trial used oral nutrition | 2 trials used no intervention |
| Orthopaedics | 5 trials used enteral nutrition 4 trials used oral nutrition 1 trial used general nutrition 1 trial used parenteral nutrition 3 trials used mixed nutrition | 7 trials used no intervention 2 trials used placebo 5 trials used treatment as usual |
| Pulmonary diseases | 2 trials used enteral nutrition 3 trials used oral nutrition 3 trials used parenteral nutrition | 1 trial used no intervention 3 trials used placebo 4 trials used treatment as usual |
| Thoracic surgery | 2 enteral nutrition 1 parenteral nutrition 1 mixed nutrition | 1 trial used placebo 3 trials used treatment as usual |
| Trauma surgery | 8 trials used enteral nutrition 3 trials used parenteral nutrition | 6 trial used no intervention 5 trial used treatment as usual |
| Transplant surgery | 1 trial used enteral nutrition 1 trial used oral nutrition 2 trials used parenteral nutrition | 4 trials used treatment as usual |
| Vascular surgery | 1 trial used enteral nutrition 3 trials used parenteral nutrition | 4 trials used treatment as usual |
Experimental interventions
We included 86 trials where the experimental group received parenteral nutrition, 80 trials with enteral nutrition, 55 with oral nutrition support, 12 with a mixed experimental intervention(e.g. oral nutrition and parenteral nutrition were given together), nine trials with general nutrition support, and two trials with fortified food. Two hundred and three trials had an intervention that lasted three days or more and 25 trials had an intervention that lasted two days or less. The duration of the intervention was unknown in 16 trials. Most intervention periods were until hospital discharge, but in the 79 trials reporting a specific intervention length, the mean in‐hospital intervention length was 10.4 days (range 1 to 32 days).
Table 1 gives a list of the experimental interventions according to medical specialty.
Control interventions
We include 122 trials with 'treatment as usual' as the control intervention, 107 trials with no intervention as control intervention, and 15 trials with placebo as intervention. It is important to note that the control group was often given a co‐intervention consisting of standard care, and therefore often received a measure of nutrition support.
Table 1 gives a list of the control interventions according to medical specialty.
Co‐interventions
Many trials had co‐interventions. We included trials with co‐interventions, but only if the co‐interventions were intended to be delivered similarly to all experimental and control groups of a trial (Jakobsen 2014). The majority of trials with an intervention period longer than three days used 'standard hospital food' as a co‐intervention. Co‐interventions, whenever used, were in general disease‐specific, such as anaesthetics and chemotherapy.
Excluded studies
We excluded 447 references after full‐text assessment reporting on 439 studies. One hundred studies were not a randomised clinical trial (review, observational study, comment); 137 studies had a control group receiving an intervention not fulfilling our inclusion criteria; 93 studies included a mixture of outpatients and hospitalised patients, or only outpatients; 56 studies assessed the effects of interventions not fulfilling our inclusion criteria; 19 studies had multiple interventions; 14 studies did not randomise adults; 10 studies did not include participants at nutritional risk; three studies were cluster‐randomised; three studies assessed pregnant women; three studies were retracted; and one study included participants who received dialysis. The reasons for the exclusion of studies are given in the table 'Characteristics of excluded studies'.
Risk of bias in included studies
Based on the information that we collected from the published reports and information from authors, we rated all 244 trials as being at high risk of bias. We judged many trials to have an unclear risk of bias in several domains, and we could not obtain additional information from the authors when we contacted them. Only one trial had a low risk of bias in six out of seven domains (Lidder 2013a). Additional information can be found in the 'Risk of bias' summary (Figure 2), and the 'Risk of bias' graph (Figure 3).

Risk of bias summary: review authors' judgements about each risk of bias item for each included study.
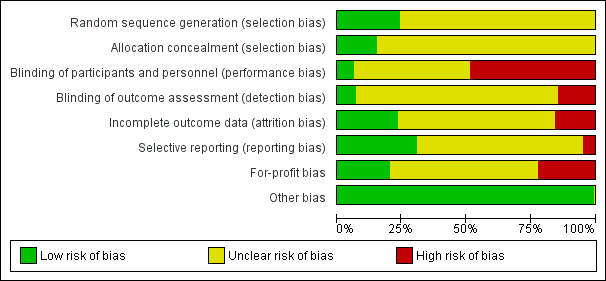
Risk of bias graph: review authors' judgements about each risk of bias item presented as percentages across all included studies.
Allocation
The generation of the allocation sequence was low risk of bias in only 62 trials. The remaining 182 trials were described as being randomised, but without explaining the method used for sequence generation.
The method used to conceal allocation was adequate in only 39 trials. The remaining 205 trials were described as being randomised, but the method used for allocation concealment was either not described or insufficiently described.
Blinding
The blinding of participants and personnel was performed and adequately described in only 15 trials. One hundred and seventeen trials did not blind the participants and personnel. The method for blinding of participants and personnel for the remaining 112 trials was either not described or insufficiently described. The blinding of outcome assessors was performed and adequately described in 17 trials. Thirty‐six trials did not blind the outcome assessors. The method for blinding of outcome assessors for the remaining 191 trials was either not described or was insufficiently described.
Incomplete outcome data
Only 49 trials adequately addressed incomplete outcome data. Forty‐one trials did not properly deal with incomplete outcome data. In 154 trials, incomplete outcome data were either not described or were insufficiently described.
Selective reporting
Seventy‐five trials reported the outcomes stated in their respective protocols, or reported serious adverse events (including reporting complications, morbidity, or similar terms) and mortality, resulting in our assessment of a 'low risk of bias'. Twelve trials did not report the same outcomes they had stated in the protocol. In 157 trials, no protocol was available and the trial did not report mortality or serious adverse events.
Other potential sources of bias
Fifty‐three trials reported how they were funded and appeared to be free of industry sponsorship or other type of for‐profit support that may bias the results of the trial (Lundh 2017). Fifty‐two trials were funded by industry sponsorship or other type of for‐profit support. In 139 trials it was unclear how the trial was funded.
We did not identify any clear signs of academic bias or other potential sources of bias in any of the included trials. Therefore, we rated all 244 trials as 'low risk of bias' in the 'Other potential bias' domain.
Effects of interventions
Primary outcomes
All‐cause mortality
End of intervention
One hundred and fourteen of 244 trials (46.7%), covering 21,758 participants, reported mortality at end of intervention. Eight hundred and thirty‐one of 11,088 nutrition‐support participants (7.49%) died versus 885 of 10,670 control participants (8.3%). Random‐effects meta‐analysis showed that nutrition support did not significantly affect the risk of all‐cause mortality at end of intervention (RR 0.94, 95% CI 0.86 to 1.03, P = 0.16, I2 = 0%, 21,758 participants, 114 trials, low quality of evidence, Analysis 1.1). The point estimate of absolute risk for short‐term mortality was non‐significantly 0.5% lower (8.3% in the control group compared with 7.8% (7.1% to 9.5%) following nutritional interventions.
Heterogeneity
Neither visual inspection of the forest plots nor tests for statistical heterogeneity (I2 = 0%; P = 0.90) indicated significant heterogeneity.
Trial Sequential Analysis
The Trial Sequential Analysis showed that the Z‐curve crossed the boundary for futility. Hence, there is firm evidence that nutrition support versus control does not reduce the risk ratio for all‐cause mortality by 20% at end of intervention (Figure 4). A post hoc Trial Sequential Analysis showed that the acquired information was large enough to rule out that nutrition support versus control reduces the risk ratio of all‐cause mortality by 11% or more (Supplementary online material). It should be noted that Trial Sequential Analysis only assessed the risk of random error and did not consider the risk of bias.

Trial Sequential Analysis on all‐cause mortality (end of intervention) in 114 high risk of bias trials. The diversity‐adjusted required information size (RIS) was calculated based on mortality in the control group of 8.29%; risk ratio reduction of 20% in the experimental group; type I error of 2.5%; and type II error of 20% (80% power). No diversity was noted. The required information size was 9526 participants. The cumulative Z‐curve (blue line) did not cross the trial sequential monitoring boundaries for benefit or harm (red inward sloping lines). The cumulative Z‐curve crossed the inner‐wedge futility line (red outward sloping lines). Additionally the cumulative Z‐score crossed the RIS. The green dotted line shows conventional boundaries (2.5%).
Bayes factor
We calculated the Bayes factor based on a RR of 20% and the meta‐analysis result (RR 0.94). Bayes factor (92.92) was above the Bayes factor threshold for significance of 0.1, supporting that there seems to be no significant effect of nutrition support on all‐cause mortality at end of treatment.
Risk of bias and sensitivity analyses
We rated the risk of bias of the outcome result as high.
The 'best‐worst' and 'worst‐best' case meta‐analyses showed that incomplete outcome data bias has the potential to influence the results ('best‐worst' random‐effects meta‐analysis: RR 0.74, 95% CI 0.65 to 0.84, P < 0.001, 22,207 participants, 114 trials, low‐quality evidence Analysis 1.12; 'worst‐best' random‐effects meta‐analysis: RR 1.13, 95% CI 0.97 to 1.31, P = 0.12, 22,207 participants, 114 trials, low‐quality evidence, Analysis 1.13.). Data were imputed for 22 trials.
Visual inspection of the funnel plots showed signs of asymmetry (Supplementary online material). Harbord's test showed no small‐study effect (P = 0.095). Based on visual inspection of the funnel plot, we assessed the risk of publication bias as high.
Subgroup analyses
Analysis 1.3, comparing trials with different modes of delivery: test of interaction showed no statistically significant difference (subgroup difference P = 0.69).
Analysis 1.4, comparing trials with participants from different medical specialties: test for subgroup difference showed no statistically significant difference (subgroup difference P = 0.44).
Analysis 1.5, comparing trials where the adequacy of the amount of calories received was different: test for subgroup difference showed no statistically significant difference (subgroup difference P = 0.45).
Analysis 1.6, comparing trials with different screening tools: test for subgroup difference showed no statistically significant difference (subgroup difference P = 0.12).
Analysis 1.7, comparing trials where participants at nutritional risk according to specific condition: test for subgroup difference showed no statistically significant difference (subgroup difference P = 0.62).
Analysis 1.8, comparing trials where participants were at nutritional risk according to specific criteria (BMI, weight, insufficient food intake): test for subgroup difference showed no statistically significant difference (subgroup difference P = 0.59).
Analysis 1.9, comparing trials where the participants were classified as at nutritional risk according to biomarkers or anthropometrics: test for subgroup difference showed no statistically significant difference (subgroup difference P = 0.21).
Analysis 1.10, comparing trials according to publication year: test for subgroup difference showed no statistically significant difference (subgroup difference P = 0.83).
Analysis 1.11, comparing the length of the intervention: test for subgroup difference showed no statistically significant difference (subgroup difference P = 0.78).
Zero‐event handling
To test the robustness of our results according to the type of zero‐event handling, we conducted our meta‐analysis using the Trial Sequential Analysis software. We performed our meta‐analysis using both the 'reciprocal of opposite intervention group' continuity correction, a constant continuity correction using both 0.5, 0.01 and 0.001, and an empirical continuity correction using 0.5, 0.01 and 0.001. None of the meta‐analyses produced a P value under 0.025.
Maximum follow‐up
Only 127 of 244 trials (52%), covering 23,170 participants, reported all‐cause mortality at maximum follow‐up (often months and in some cases years after). All trials were at high risk of bias. One thousand three hundred and eighty‐two of 11,788 nutrition support participants (11.67%) died versus 1494 of 11,382 control participants (13.1%). Overall, we found no statistically significant benefit or harm on all‐cause mortality at maximum follow‐up, considering a P value of less than 0.025 significant (Jakobsen 2014) (random‐effects model meta‐analysis: RR 0.93, 95% CI 0.88 to 0.99, P = 0.03, I2 = 0%, 23,170 participants, 127 trials, low quality of evidence, Analysis 2.1).
The point estimate of absolute risk for long‐term mortality was non‐significantly 1% lower (13.2% in the control group compared with 12.2% (11.6% to 13%) following nutritional interventions.
Heterogeneity
Neither visual inspection of the forest plots nor tests for statistical heterogeneity (I2 = 0%; P = 0.74) indicated significant heterogeneity.
Trial Sequential Analysis
The Trial Sequential Analysis showed that the Z‐curve crossed the boundary for futility. Hence, there is firm evidence that nutrition support versus control does not reduce the risk ratio for all‐cause mortality by 20% at maximum follow‐up (Supplementary online material). A post hoc Trial Sequential Analysis showed that the information size was large enough also to rule out that nutrition support versus control reduces the risk ratio of all‐cause mortality by 10% or more (Supplementary online material). It should be noted that Trial Sequential Analysis only assessed the risk of random error and did not consider the risk of bias.
Bayes factor
We calculated the Bayes factor based on a RR of 20%, and the meta‐analysis result (RR 0.93). Bayes factor (374.86) was above the Bayes factor threshold for significance of 0.1, supporting that there is no significant effect of nutrition support on all‐cause mortality at maximum follow‐up.
Risk of bias and sensitivity analyses
We rated the risk of bias of the outcome result as high.
The 'best‐worst' and 'worst‐best' case meta‐analyses showed that incomplete outcome data bias has the potential to influence the results ('best‐worst' random‐effects meta‐analysis: RR 0.77, 95% CI 0.69 to 0.85, P < 0.001, 23,700 participants, 127 trials, low quality of evidence, Analysis 2.12; 'worst‐best' random‐effects meta‐analysis: RR 1.09, 95% CI 0.98 to 1.23, P = 0.12, 23,700 participants, 127 trials, low quality of evidence, Analysis 2.13). Data were imputed for 25 trials.
Visual inspection of the funnel plots showed signs of asymmetry (Supplementary online material). Harbord's test showed a small study effect (P = 0.024). Hence, we assessed the risk of publication bias as high.
Subgroup analyses
Analysis 2.3, comparing trials with different modes of delivery: test for subgroup difference showed no statistically significant difference (subgroup difference P = 0.35).
Analysis 2.4, comparing trials with participants from different medical specialties: test for subgroup difference showed no statistically significant difference (subgroup difference P = 0.40).
Analysis 2.5, comparing trials where the adequacy of the amount of calories received was different: test for subgroup difference showed no statistically significant difference (subgroup difference P = 0.61).
Analysis 2.6, comparing trials with different screening tools: test for subgroup difference showed no statistically significant difference (subgroup difference P = 0.14).
Analysis 2.7, comparing trials where participants were at nutritional risk according to specific condition: test for subgroup difference showed no statistically significant difference (subgroup difference P = 0.67).
Analysis 2.8, comparing trials where participants were at nutritional risk according to specific criteria (BMI, weight, insufficient food intake): test for subgroup difference showed no statistically significant difference (subgroup difference P = 0.80).
Analysis 2.9, comparing trials where the participants were classified as at nutritional risk according to biomarkers or anthropometrics: test for subgroup difference showed no statistically significant difference (subgroup difference P = 0.21).
Analysis 2.10, comparing trials according to publication year: test for subgroup difference showed no statistically significant difference (subgroup difference P = 0.92).
Analysis 2.11, comparing the length of the intervention: test for subgroup difference showed no statistically significant difference (subgroup difference P = 0.58).
Zero‐event handling
To test the robustness of our results according to the type of zero‐event handling, we conducted our meta‐analysis using the Trial Sequential Analysis software. We performed our meta‐analysis using both the 'reciprocal of opposite intervention group' continuity correction, a constant continuity correction using both 0.5, 0.01 and 0.001, and an empirical continuity correction using 0.5, 0.01 and 0.001. None of the meta‐analyses produced a P value under 0.025.
Serious adverse events
End of intervention
One hundred and twenty‐three of 244 trials (50.4%), covering 22,087 participants, reported serious adverse events at end of intervention. All trials were at high risk of bias. Nine hundred and ninety‐six of 11,260 nutrition support participants (8.8%) experienced one or more serious adverse events versus 1067 of 10,827 control participants (9.9%). Overall, we found no statistically significant benefit or harm of nutrition support at the end of intervention, considering a P value of less than 0.025 as significant (Jakobsen 2014) (random‐effects model meta‐analysis: RR 0.93, 95% CI 0.86 to 1.01, P = 0.07, I2 = 0%, 22,087 participants, 123 trials, low quality of evidence, Analysis 3.1). We present an overview of serious adverse events in specific trials in Table 2. The point estimate of absolute risk for short‐term serious adverse events was non‐significantly 0.7% lower following nutrition support compared with control (9.9% versus 9.2% (8.5% to 10%)).
| Trial | Experimental intervention | Type and number of participants with a serious adverse events (Experimental group) | Proportion of participants with a serious adverse event (Experimental group) | Type and number of participants with a serious adverse events (Control group) | Proportion of participants with a serious adverse event (Control group) |
| Parenteral nutrition | 1 sepsis | 1 out of 54 | 10 sepsis | 10 out of 46 | |
| Parenteral nutrition | 1 anastomotic leak, 3 respiratory infections, 2 respiratory insufficiency | 6 out of 43 | 2 anastomotic leaks, 1 renal failure, 2 abdominal abscesses, 4 respiratory infections, 3 respiratory insufficieny | 12 out of 47 | |
| Parenteral nutrition | 7 anastomotic leaks, 5 pneumonias, 1 GI haemorrhages, 8 GI fistula, 4 ileus, 2 myocardial infarction, 12 abscess, 4 deep infection, 7 peritonitis | 50 out of 60 | 3 anastomotic leaks, 6 pneumonias, 1 pulmonary embolism, 2 GI haemorrhages, 5 GI fistula, 1 myocardial infarction, 2 abscess, 4 deep infection, 2 peritonitis | 26 out of 57 | |
| Enteral nutrition | no serious adverse events reported | 0 out of 16 | 1 anastomotic leak | 1 out of 8 | |
| Enteral nutrition | 1 anastomotic leak | 1 out of 10 | no serious adverse events reported | 0 out of 10 | |
| Enteral nutrition | no serious adverse events reported | 0 out of 21 | 1 septic complication | 1 out of 20 | |
| Oral nutrition | 50 strokes, 23 pulmonary embolisms, 43 DVTs, 28 GI haemorrhages, 28 ACS' | 172 out of 2012 | 43 strokes, 18 pulmonary embolism, 29 DVTs, 18 GI haemorrhage, 22 ACS | 130 out of 2000 | |
| Enteral nutrition | 15 strokes, 6 pulmonary embolisms, 11 DVTs, 22 GI haemorrhages, 7 ACS' | 61 out of 429 | 23 strokes, 8 pulmonary embolisms, 13 DVTs, 11 GI haemorrhages, 13 ACS' | 68 out of 428 | |
| Parenteral nutrition | 3 sepsis | 3 out of 9 | 7 sepsis | 7 out of 12 | |
| Oral nutrition | 20 anastomotic leaks, 14 pneumonias, 2 pulmonary embolisms, 2 renal failure, 6 abdominal abscess, 3 unspecific infection, 10 wound dehiscences, 1 pulmonary failure, 11 gastrointestinal complications, 6 cardiovascular complications, 4 haemoperitoneum | 79 out of 338 | 18 anastomotic leaks, 9 pneumonias, 1 pulmonary embolisms, 3 renal failure, 1 abdominal abscess, 2 unspecific infection, 3 wound dehiscences, 2 pulmonary failure, 6 bacteraemia, 23 gastrointestinal complications, 6 cardiovascular complications, 5 haemoperitoneum | 79 out of 340 | |
| Parenteral nutrition | 1 respiratory infection | 1 out of 21 | 2 respiratory infection | 2 out of 21 | |
| Enteral nutrition | no serious adverse events reported | 0 out of 256 | 6 anastomotic leaks | 6 out of 264 | |
| Parenteral nutrition | 4 GI haemorrhages, 4 GI fistulas, 4 hepatic comas | 12 out of 64 | 1 GI haemorrhages, 5 GI fistulas, 4 hepatic comas | 10 out of 60 | |
| Enteral nutrition | 25 pressure sores | 25 out of 48 | 30 pressure sores | 30 out of 53 | |
| Enteral nutrition | no serious adverse events reported | 0 out of 43 | 3 anastomotic leaks, 2 myocardial infarction | 5 out of 16 | |
| Enteral nutrition | 2 abdominal abscess | 2 out of 20 | no serious adverse events reported | 0 out of 10 | |
| General nutrition | 4 pneumonia, 1 DVTs, 4 sepsis, 2 empyemas, 0 gastroenteritis, 1 GI complications, | 12 out of 108 | 4 pneumonia, 1 stroke, 2 sepsis, 1 gastroenteritis, 2 GI complications | 10 out of 104 | |
| Enteral nutrition | 2 renal failures | 2 out of 16 | 2 renal failures | 2 out of 15 | |
| Oral nutrition | no serious adverse events reported | 0 out of 43 | 1 GI perforation | 1 out of 43 | |
| Oral nutrition | 20 pressure sores | 20 out of 197 | 29 pressure sores | 29 out of 328 | |
| Enteral nutrition | 4 variceal bleedings, 1 peritonitis | 5 out of 12 | 1 peritonitis | 1 out of 10 | |
| Parenteral nutrition | no serious adverse events reported | 0 out of 14 | 1 anastomotic leak, 1 GI fistula | 2 out of 15 | |
| Enteral nutrition | 21 Pneumonia, Wound infection 27, Wound dehiscence 4, anastomotic Leak 7, Septicaemia 20 | 27 out of 98 | Pneumonia 30, Wound infection 31, Wound dehiscence 9, Leak 13, Septicaemia 30. | 31 out of 97 | |
| Enteral nutrition | 8 sepsis | 8 out of 27 | 7 sepsis | 7 out of 29 | |
| Parenteral nutrition | no serious adverse events reported | 0 out of 9 | 1 sepsis | 1 out of 12 | |
| Enteral nutrition | no serious adverse events reported | 0 out of 20 | 1 pulmonary embolism | 1 out of 20 | |
| Enteral nutrition | 2 peritonitis | 2 out of 11 | 5 peritonitis | 5 out of 18 | |
| Enteral nutrition | no serious adverse events reported | 0 out of 30 | 4 GI fistulas | 4 out of 30 | |
| Oral nutrition | no serious adverse events reported | 0 out of 80 | 1 anastomotic leak | 1 out of 81 | |
| Parenteral nutrition | 1 pneumonia | 1 out of 10 | 2 pneumonias | 2 out of 10 | |
| Parenteral nutrition | 2 pneumoperitoneum's | 2 out of 40 | 2 anastomotic leaks, 2 pneumoperitoneum's | 4 out of 40 | |
| Parenteral nutrition | 2 pneumonias, 5 sepsis | 7 out of 16 | 2 sepsis | 2 out of 14 | |
| Enteral nutrition | 1 myocardial infarction | 1 out of 16 | 1 myocardial infarction | 1 out of 16 | |
| Parenteral nutrition | no serious adverse events reported | 0 out of 15 | 2 hepatic encephalopathies | 2 out of 17 | |
| Parenteral nutrition | no serious adverse events reported | 0 out of 17 | 2 respiratory infection | 2 out of 17 | |
| General nutrition | no serious adverse events reported | 0 out of 66 | 1 stroke, 1 DVT, 1 septic arthritis, 2 myocardial infarction | 5 out of 66 | |
| Parenteral nutrition | 1 empyema, 1 pelvic abscess | 2 out of 12 | 1 intraabdominal abscess | 1 out of 9 | |
| Mixed nutrition | 1 hepatic encephalopathy | 1 out of 90 | 4 anastomotic leak, 5 hepatic encephalopathies | 9 out of 36 | |
| Enteral nutrition | 2 sepsis, 2 multi organ failure, | 4 out of 52 | 6 sepsis, 3 multi organ failure | 9 out of 49 | |
| Enteral nutrition | 1 anastomotic leak | 1 out of 13 | 3 anastomotic leaks | 3 out of 15 | |
| Mixed nutrition | 11 anastomotic leaks, 6 DVT, 15 sepsis | 32 out of 430 | 10 anastomotic leaks, 15 sepsis | 25 out of 216 | |
| Parenteral nutrition | 1 wound dehiscence | 1 out of 18 | 1 anastomotic leak, 2 pneumonias, 1 sepsis, 1 ileus | 5 out of 16 | |
| Enteral nutrition | 2 GI haemorrhage | 2 out of 50 | 4 GI haemorrhage | 4 out of 50 |
Heterogeneity
Neither visual inspection of the forest plots nor tests for statistical heterogeneity (I2 = 0%; P = 0.65) indicated significant heterogeneity.
Trial Sequential Analysis
The Trial Sequential Analysis showed that the Z‐curve crossed the boundary for futility. Hence, there is firm evidence that nutrition support versus control does not reduce the risk ratio for serious adverse events by 20% at end of intervention (Supplementary online material). A post hoc Trial Sequential Analysis showed that the information size was also large enough to rule out that nutrition support versus control reduces the risk ratio of serious adverse events by 11% or more (Supplementary online material). It should be noted that Trial Sequential Analysis only assessed the risk of random error and did not consider the risk of bias.
Bayes factor
We calculated the Bayes factor based on a RR of 20%, and the meta‐analysis result (RR 0.93). Bayes factor (2.0) was above the Bayes factor threshold for significance of 0.1, supporting that there is no significant effect of nutrition support on serious adverse events at end of intervention.
Risk of bias and sensitivity analyses
We rated the risk of bias of the outcome result as high.
The 'best‐worst' and 'worst‐best' case meta‐analyses showed that incomplete outcome data bias has the potential to influence the results ('best‐worst' random‐effects meta‐analysis: RR 0.74, 95% CI 0.65 to 0.83, P < 0.001, 22,557 participants, 123 trials, low quality of evidence, Analysis 3.12; 'worst‐best' random‐effects meta‐analysis: RR 1.06, 95% CI 0.92 to 1.21, P = 0.53, 22,557 participants, 123 trials, low quality of evidence, Analysis 3.13). Data were imputed for 25 trials.
Visual inspection of the funnel plots showed signs of asymmetry (Supplementary online material). Harbord's test showed small‐study effects (P = 0.003). Hence, we assessed the risk of publication bias as high.
Subgroup analyses
Analysis 3.3, comparing trials with different modes of delivery: test for subgroup difference showed no statistically significant difference (subgroup difference P = 0.51).
Analysis 3.4, comparing trials with participants from different medical specialties: test for subgroup difference showed no statistically significant difference (subgroup difference P = 0.45).
Analysis 3.5, comparing trials where the adequacy of the amount of calories received was different: test for subgroup difference showed no statistically significant difference (subgroup difference P = 0.52).
Analysis 3.6, comparing trials with different screening tools: test for subgroup difference showed no statistically significant difference (subgroup difference P = 0.47).
Analysis 3.7, comparing trials where participants were at nutritional risk according to specific condition: test for subgroup difference showed no statistically significant difference (subgroup difference P = 0.40).
Analysis 3.8, comparing trials where participants were at nutritional risk according to specific criteria (BMI, weight, insufficient food intake): test for subgroup difference showed no statistically significant difference (subgroup difference P = 0.79).
Analysis 3.9, comparing trials where the participants were classified as at nutritional risk according to biomarkers or anthropometrics: test for subgroup difference showed no statistically significant difference (subgroup difference P = 0.15).
Analysis 3.10, comparing trials according to publication year: test for subgroup difference showed no statistically significant difference (subgroup difference P = 0.46).
Analysis 3.11, comparing the length of the intervention: test for subgroup difference showed no statistically significant difference (subgroup difference P = 0.35).
Zero‐event handling
To test the robustness of our results according to the type of zero‐event handling, we conducted our meta‐analysis using the Trial Sequential Analysis software. We performed our meta‐analysis using both the 'reciprocal of opposite intervention group' continuity correction, a constant continuity correction using both 0.5, 0.01 and 0.001, and an empirical continuity correction using 0.5, 0.01 and 0.001. None of the meta‐analyses produced a P value under 0.025.
Maximum follow‐up
One hundred and thirty‐seven of 244 trials (56.14%), covering 23,413 participants, reported serious adverse events at maximum follow‐up. All trials were at high risk of bias. One thousand five hundred and eighty of 11,940 nutrition support participants (13.2%) experienced one or more serious adverse events versus 1741 of 11,473 control participants (15.2%). Overall, we found a statistically significant effect of nutrition support at maximum follow‐up, considering a P value of less than 0.025% significant (Jakobsen 2014) (random‐effects model meta‐analysis: RR 0.91, 95% CI 0.85 to 0.97, P = 0.004, I2 = 3%, 23,413 participants, 137 trials, low quality of evidence, Analysis 4.1). For an overview of the serious adverse events in specific trials please see Table 3. At maximum follow‐up the reduction in the absolute risk of serious adverse events was 1.5%, from 15.2% in control groups to 13.8% (12.9% to 14.7%) following nutritional support.
| Trial | Experimental intervention | Type and number of participants with a serious adverse events (Experimental group) | Proportion of participants with a serious adverse event (Experimental group) | Type and number of participants with a serious adverse events (Control group) | Proportion of participants with a serious adverse event (Control group) |
| Enteral nutrition | 2 anastomotic leaks | 2 out of 64 | 7 anastomotic leaks, 2 GI haemorrhage, 1 myocardial infarction | 10 out of 57 | |
| Enteral nutrition | 2 anastomotic leak, 3 wound dehiscence, 1 myocardial infarction, | 6 out of 30 | 4 anastomotic leak, 1 pulmonary failure | 5 out of 30 | |
| Parenteral nutrition | 1 sepsis | 1 out of 54 | 10 sepsis | 10 out of 46 | |
| Parenteral nutrition | 1 anastomotic leak, 3 respiratory infections, 2 respiratory insufficiencies | 6 out of 43 | 2 anastomotic leaks, 1 renal failure, 2 abdominal abscesses, 4 respiratory infections, 3 respiratory insufficiencies | 12 out of 47 | |
| Parenteral nutrition | 7 anastomotic leaks, 5 pneumonias, 1 GI haemorrhages, 8 GI fistula, 4 ileus, 2 myocardial infarction, 12 abscess, 4 deep infection, 7 peritonitis | 50 out of 60 | 3 anastomotic leaks, 6 pneumonias, 1 pulmonary embolism, 2 GI haemorrhages, 5 GI fistula, 1 myocardial infarction, 2 abscess, 4 deep infection, 2 peritonitis | 26 out of 57 | |
| Enteral nutrition | no serious adverse events reported | 0 out of 16 | 1 anastomotic leak | 1 out of 8 | |
| Enteral nutrition | 1 anastomotic leak | 1 out of 10 | no serious adverse events reported | 0 out of 10 | |
| Enteral nutrition | no serious adverse events reported | 0 out of 21 | 1 septic complication | 1 out of 20 | |
| Enteral nutrition | 2 CNS infections, 13 ventilator associated pneumonias | 15 out of 34 | 2 CNS infections, 12 ventilator associated pneumonias | 14 out of 25 | |
| Oral nutrition | 50 strokes, 23 pulmonary embolisms, 43 DVTs, 28 GI haemorrhages, 28 ACS' | 172 out of 2012 | 43 strokes, 18 pulmonary embolism, 29 DVTs, 18 GI haemorrhage, 22 ACS' | 130 out of 2000 | |
| Enteral nutrition | 15 strokes, 6 pulmonary embolisms, 11 DVTs, 22 GI haemorrhages, 7 ACS' | 61 out of 429 | 23 strokes, 8 pulmonary embolisms, 13 DVTs, 11 GI haemorrhages, 13 ACS' | 68 out of 428 | |
| Parenteral nutrition | 1 respiratory infection | 1 out of 21 | 2 respiratory infection | 2 out of 21 | |
| Parenteral nutrition | 3 sepsis | 3 out of 9 | 7 sepsis | 7 out of 12 | |
| Oral nutrition | 20 anastomotic leaks, 14 pneumonias, 2 pulmonary embolisms, 2 renal failure, 6 abdominal abscess, 3 unspecific infection, 10 wound dehiscences, 1 pulmonary failure, 11 gastrointestinal complications, 6 cardiovascular complications, 4 haemoperitoneum | 79 out of 338 | 18 anastomotic leaks, 9 pneumonias, 1 pulmonary embolisms, 3 renal failure, 1 abdominal abscess, 2 unspecific infection, 3 wound dehiscences, 2 pulmonary failure, 6 bacteraemia, 23 gastrointestinal complications, 6 cardiovascular complications, 5 haemoperitoneum | 79 out of 340 | |
| Enteral nutrition | no serious adverse events reported | 0 out of 256 | 6 anastomotic leaks | 6 out of 264 | |
| Parenteral nutrition | 4 GI haemorrhages, 4 GI fistulas, 4 hepatic comas | 12 out of 64 | 1 GI haemorrhages, 5 GI fistulas, 4 hepatic comas | 10 out of 60 | |
| Enteral nutrition | 25 pressure sores | 25 out of 48 | 30 pressure sores | 30 out of 53 | |
| Oral nutrition | 1 anastomotic leak, 2 wound infections, 1 pulmonary embolism | 4 out of 16 | 1 anastomotic leak, | 1 out of 8 | |
| Enteral nutrition | no serious adverse events reported | 0 out of 43 | 3 anastomotic leaks, 2 myocardial infarction | 5 out of 16 | |
| Enteral nutrition | 2 abdominal abscess | 2 out of 20 | no serious adverse events reported | 0 out of 10 | |
| General nutrition | 4 pneumonia, 1 DVTs, 4 sepsis, 2 empyemas, 0 gastroenteritis, 1 GI complications, | 12 out of 108 | 4 pneumonia, 1 stroke, 2 sepsis, 1 gastroenteritis, 2 GI complications | 10 out of 104 | |
| Enteral nutrition | 3 septic complications, 3 wound dehiscence | 6 out of 50 | 8 septic complications, 4 wound dehiscence | 12 out of 50 | |
| Enteral nutrition | 2 renal failures | 2 out of 16 | 2 renal failures | 2 out of 15 | |
| Oral nutrition | no serious adverse events reported | 0 out of 43 | 1 GI perforation | 1 out of 43 | |
| Oral nutrition | 20 pressure sores | 20 out of 197 | 29 pressure sores | 29 out of 328 | |
| Enteral nutrition | 4 variceal bleedings, 1 peritonitis | 5 out of 12 | 1 peritonitis | 1 out of 10 | |
| Oral nutrition | 2 anastomotic leaks, 2 sepsis | 4 out of 59 | 7 anastomotic leaks, 1 stroke, 1 DVT, 3 sepsis, 3 myocardial infarctions | 15 out of 61 | |
| Parenteral nutrition | no serious adverse events reported | 0 out of 14 | 1 anastomotic leak, 1 GI fistula | 2 out of 15 | |
| Enteral nutrition | 8 sepsis | 8 out of 27 | 7 sepsis | 7 out of 29 | |
| Parenteral nutrition | no serious adverse events reported | 0 out of 9 | 1 sepsis | 1 out of 12 | |
| Enteral nutrition | no serious adverse events reported | 0 out of 20 | 1 pulmonary embolism | 1 out of 20 | |
| Enteral nutrition | 2 peritonitis | 2 out of 11 | 5 peritonitis | 5 out of 18 | |
| Enteral nutrition | no serious adverse events reported | 0 out of 30 | 4 GI fistulas | 4 out of 30 | |
| Oral nutrition | no serious adverse events reported | 0 out of 80 | 1 anastomotic leak | 1 out of 81 | |
| Parenteral nutrition | 1 pneumonia | 1 out of 10 | 2 pneumonias | 2 out of 10 | |
| Parenteral nutrition | 2 pneumoperitoneums | 2 out of 40 | 2 anastomotic leaks, 2 pneumoperitoneums | 4 out of 40 | |
| Parenteral nutrition | 2 pneumonias, 5 sepsis | 7 out of 16 | 2 sepsis | 2 out of 14 | |
| Enteral nutrition | 1 myocardial infarction | 1 out of 16 | 1 myocardial infarction | 1 out of 16 | |
| Parenteral nutrition | no serious adverse events reported | 0 out of 15 | 2 hepatic encephalopathies | 2 out of 17 | |
| Parenteral nutrition | 1 anastomotic leak, 1 respiratory infection, 1 pancreatitis | 3 out of 17 | 2 pulmonary embolisms, 1 septic complication, 4 respiratory infections, | 7 out of 17 | |
| Enteral nutrition | 2 wound infections, 1 pneumonia | 3 out of 9 | 1 anastomotic leak, 2 wound infections, 1 pneumonia, 1 peptic ulcer, 1 wound dehiscence, | 6 out of 9 | |
| General nutrition | no serious adverse events reported | 0 out of 66 | 1 stroke, 1 DVT, 1 septic arthritis, 2 myocardial infarction | 5 out of 66 | |
| Parenteral nutrition | 1 empyema, 1 pelvic abscess | 2 out of 12 | 1 intraabdominal abscess | 1 out of 9 | |
| Mixed nutrition | 1 hepatic encephalopathy | 1 out of 90 | 4 anastomotic leak, 5 hepatic encephalopathies | 9 out of 36 | |
| Enteral nutrition | 2 sepsis, 2 multi organ failure, | 4 out of 52 | 6 sepsis, 3 multi organ failure | 9 out of 49 | |
| Enteral nutrition | 1 anastomotic leak | 1 out of 13 | 3 anastomotic leaks | 3 out of 15 | |
| Parenteral nutrition | 6 anastomotic leaks, 16 pneumonias, 1 pressure sore, 2 abdominal abscess, 1 wound dehiscence, 13 pulmonary failure, 7 bacteraemia, 10 GI complications, 15 cardiac complications, 3 bronchopleurocutaneous fistulas | 74 out of 231 | 6 anastomotic leaks, 9 pneumonias, 1 pulmonary embolism, 1 pressure sore, 3 renal failure, 2 abdominal abscess, 1 septic complication, 1 wound dehiscence, 11 pulmonary failure, 5 bacteraemia, 10 GI complications, 15 cardiac complications, 6 bronchopleurocutaneous fistulas | 80 out of 228 | |
| Mixed nutrition | 11 anastomotic leaks, 6 DVT, 15 sepsis | 32 out of 430 | 10 anastomotic leaks, 15 sepsis | 25 out of 216 | |
| Parenteral nutrition | 1 wound dehiscence | 1 out of 18 | 1 anastomotic leak, 2 pneumonias, 1 sepsis, 1 ileus | 5 out of 16 | |
| Enteral nutrition | 2 GI haemorrhage | 2 out of 50 | 4 GI haemorrhage | 4 out of 50 |
Heterogeneity
Neither visual inspection of the forest plots nor tests for statistical heterogeneity (I2 = 3%; P = 0.39) indicated significant heterogeneity.
Trial Sequential Analysis
The Trial Sequential Analysis showed that the Z‐curve crossed the boundary for futility. Hence, there is firm evidence that nutrition support versus control does not reduce the risk ratio for serious adverse events by 20% at maximum follow‐up (Supplementary online material). A post hoc Trial Sequential Analysis showed that the information size was large enough to rule out that nutrition support versus control reduces the risk ratio of serious adverse events by 10% or more (Figure 5). It should be noted that Trial Sequential Analysis only assessed the risk of random error and did not consider the risk of bias.

Trial Sequential Analysis on serious adverse events (maximum follow‐up) in 137 high risk of bias trials. The diversity‐adjusted required information size (RIS) was calculated based on an incidence rate of serious adverse event in the control group of 15.2%; risk ratio reduction of 10% in the experimental group; type I error of 2.5%; and type II error of 20% (80% power). No diversity was noted. The required information size was 19535 participants. The cumulative Z‐curve (blue line) did not cross the trial sequential monitoring boundaries for benefit or harm (red inward sloping lines). The cumulative Z‐curve crossed the inner‐wedge futility line (red outward sloping lines) indicating that sufficient information is provided. Additionally the cumulative Z‐score crossed the RIS. The green dotted line shows conventional boundaries (2.5%). The cumulative Z‐curve later crosses the green line, indicating a possible significant effect, but one that is smaller than a 10% risk ratio reduction.
Bayes factor
We calculated the Bayes factor based on a RR of 20% and the meta‐analysis result (RR 0.91). Bayes factor (0.056) was below the Bayes factor threshold for significance of 0.1, supporting that the alternative hypothesis was more likely than the null hypothesis.
Risk of bias and sensitivity analyses
We rated the risk of bias of the outcome result as high.
The 'best‐worst' and 'worst‐best' case meta‐analyses showed that incomplete outcome data bias has the potential to influence the results ('best‐worst' random‐effects meta‐analysis: RR 0.72, 95% CI 0.65 to 0.79, P < 0.001, 24,315 participants, 137 trials, low quality of evidence, Analysis 4.12; random‐effects meta‐analysis: RR 1.05, 95% CI 0.94 to 1.17, P = 0.38, 24,082 participants, 137 trials, low quality of evidence, Analysis 4.13). Data were imputed for 31 trials.
Visual inspection of the funnel plots showed signs of asymmetry (Supplementary online material). Harbord's test showed small‐study effects (P = 0.000). Hence, we assessed the risk of publication bias as high.
Subgroup analyses
Analysis 4.3, comparing trials with different modes of delivery: test for subgroup difference showed no statistically significant difference (subgroup difference P = 0.14).
Analysis 4.4, comparing trials with participants from different medical specialties: test for subgroup difference showed no statistically significant difference (subgroup difference P = 0.31).
Analysis 4.5, comparing trials where the adequacy of the amount of calories received was different: test for subgroup difference showed no statistically significant difference (subgroup difference P = 0.36).
Analysis 4.6, comparing trials with different screening tools: test for subgroup difference showed no statistically significant difference (subgroup difference P = 0.22).
Analysis 4.7, comparing trials where participants were at nutritional risk according to specific condition: test for subgroup difference showed a statistically significant difference (subgroup difference P = 0.03).
Analysis 4.8, comparing trials where participants were at nutritional risk according to specific criteria (BMI, weight, insufficient food intake): test for subgroup difference showed no statistically significant difference (subgroup difference P = 0.74).
Analysis 4.9, comparing trials where the participants were classified as at nutritional risk according to biomarkers or anthropometrics: test for subgroup difference showed no statistically significant difference (subgroup difference P = 0.13).
Analysis 4.10, comparing trials according to publication year: test for subgroup difference showed no statistically significant difference (subgroup difference P = 0.34).
Analysis 4.11, comparing the length of the intervention: test for subgroup difference showed no statistically significant difference (subgroup difference P = 0.70).
Zero‐event handling
To test the robustness of our results according to the type of zero‐event handling, we conducted our meta‐analysis using the Trial Sequential Analysis software. We performed our meta‐analysis using both the 'reciprocal of opposite intervention group' continuity correction, a constant continuity correction using both 0.5, 0.01 and 0.001, and an empirical continuity correction using 0.5, 0.01 and 0.001. All of the meta‐analyses produced a P value under 0.025.
Quality of life
Only 16 of 244 trials reported quality of life (Saudny‐Unterberger 1997; Bokhorst‐de 2000; Liu 2000a; MacFie 2000; Johansen 2004; Smedley 2004a; Dennis 2005; Dennis 2006; Miller 2006a; Campbell 2008; Kawaguchi 2008; Ha 2010; Starke 2011; Ljunggren 2012; Neelemaat 2012; Breedveld‐Peters). Few trials used similar quality‐of‐life questionnaires and only data from EuroQoL utility score and SF‐36 could be used in a meta‐analysis. All trials were at high risk of bias.
Two trials reported quality of life at end of intervention using the SF‐36 questionnaire (Johansen 2004; Starke 2011). A meta‐analysis of the trials found no effect for physical performance (random‐effects MD 2.35, 95% CI ‐2.94 to 7.65, P = 0.65, 242 participants, 2 trials, very low quality of evidence; Analysis 5.1) or mental performance (random‐effects MD ‐0.90, 95% CI ‐3.92 to 2.13, P = 0.56, 242 participants, 2 trials, very low quality of evidence; Analysis 7.1). Three trials at high risk of bias reported quality of life at maximum follow‐up using the SF‐36 questionnaire (Johansen 2004; Campbell 2008; Starke 2011). A meta‐analysis of the trials found no effect for physical performance (random‐effects MD 1.54, 95% CI ‐2.47 to 5.55, P = 0.45, 289 participants, 3 trials, very low quality of evidence; Analysis 6.1) or mental performance (random‐effects MD ‐0.25, 95% CI ‐3.02 to 2.53, P = 0.86, 289 participants, 3 trials, very low quality of evidence; Analysis 8.1).
Two trials reported quality of life at end of intervention using EuroQoL utility score (Dennis 2005; Dennis 2006). A meta‐analysis of the trials found no significant effect (random‐effects MD ‐0.01, 95% CI ‐0.03 to 0.01, P = 0.45, 2 trials, 3961 participants, very low quality of evidence; Analysis 9.1).
One trial reported quality of life using the EORTC QLQ‐C30 questionnaire (Bokhorst‐de 2000). The trial of 21 participants found no effect of nutrition support on quality of life in head and neck cancer patients undergoing surgery using the end‐score. Using change‐score, nutrition support also did not show a beneficial effect on physical functioning when considering a P value of 0.025 significant (P = 0.05).
Four trials reported quality of life using the EQ‐5D (VAS) questionnaire (Ha 2010; Ljunggren 2012; Neelemaat 2012; Breedveld‐Peters). However, we could not obtain data for a meta‐analysis. Ha 2010 reported within‐group improvement and worsening of quality of life parameters. This trial randomised 78 participants and found a beneficial effect of nutrition support on quality of life in change score between the study groups (P = 0.009). Ljunggren 2012 (57 participants), Neelemaat 2012 (185 participants) and Breedveld‐Peters (131 participants), found no beneficial effect of nutrition support on quality of life.
One trial reported quality of life using a self‐rating questionnaire involving physical and mental symptoms (Kawaguchi 2008). The trial, with 29 participants, found a beneficial effect of nutrition support on thirst (P = 0.01), fatigue (P = 0.01), and hunger (P = 0.003), but no combined score was reported or available.
One trial at high risk of bias reported quality of life using a general well‐being score (Saudny‐Unterberger 1997). The trial, with 20 participants, found no effect of nutrition support on quality of life.
One trial reported quality of life using the Hospital Anxiety and Depression scale (MacFie 2000). The trial randomised 52 participants and found no effect of nutrition support on anxiety and depression.
One trial reported quality of life using the SF‐12 questionnaire (Miller 2006a). The trial randomised 100 participants and found no effect of nutrition support on quality of life.
Two trials described quality of life as an outcome (Liu 2000a; Smedley 2004a). However, we failed to obtain any data from the trial or by contacting the authors.
Post hoc Trial Sequential Analyses of the different modes of delivery for serious adverse events at maximum follow‐up
A Trial Sequential Analysis for enteral nutrition showed that the Z‐curve crossed the boundary for benefit. This Trial Sequential Analysis was based on a risk ratio reduction of 20%, an event rate in the control group of 17.2%, a two‐sided alpha of 2.5%, a beta of 20%, a diversity of 0%. This indicates that enteral nutrition versus control may result in a 20% or greater risk ratio reduction of serious adverse events at maximum follow‐up (Figure 6).

Trial Sequential Analysis on serious adverse events (maximum follow‐up) with participants receiving enteral nutrition in 49 high risk of bias trials. The diversity‐adjusted required information size (RIS) was calculated based on an incidence rate of serious adverse event in the control group of 17.2%; risk ratio reduction of 20% in the experimental group; type I error of 2.5%; and type II error of 20% (80% power). No diversity was noted. The required information size was 4444 participants. The cumulative Z‐curve (blue line) did cross the trial sequential monitoring boundaries for benefit (red inward sloping lines) indicating that enteral nutrition may result in a 20% or greater risk ratio reduction of serious adverse events at maximum follow‐up. The cumulative Z‐curve did not cross the inner‐wedge futility line (red outward sloping lines). The green dotted line shows conventional boundaries (2.5%).
A Trial Sequential Analysis for oral nutrition support showed that the Z‐curve crossed the futility boundary as well as the diversity‐adjusted required information size. This Trial Sequential Analysis was based on a risk ratio reduction of 20%, an event rate in the control group of 12.6%, a two‐sided alpha of 2.5%, a beta of 20%, and the observed diversity of 0%. This indicates that there is firm evidence that oral nutrition support versus control does not result in a 20% or greater risk ratio reduction or increase in serious adverse events at maximum follow‐up (Supplementary online material).
A Trial Sequential Analysis for parenteral nutrition showed that the Z‐curve crossed the futility boundary as well as the diversity‐adjusted required information size. This Trial Sequential Analysis was based on a risk ratio reduction of 20%, an event rate in the control group of 14.5%, a two‐sided alpha of 2.5%, a beta of 20%, and the observed diversity of 0%. This indicates that there is firm evidence that parenteral nutrition versus control does not result in a 20% or greater risk ratio reduction or increase of serious adverse events at maximum follow‐up (Supplementary online material).
For general nutrition support, fortified foods, and mixed nutrition support, there was not enough information available to produce Trial Sequential Analyses.
Subgroup analyses of the effect of oral nutrition support on all‐cause mortality and serious adverse events
Post hoc subgroup analyses of oral nutrition support found no subgroup difference of nutrition support compared with control in any subgroup (Analyses 29 through 32).
Subgroup analyses of the effect of enteral nutrition support on all‐cause mortality and serious adverse events
Post hoc subgroup analyses of enteral support found no subgroup difference of nutrition support compared with control in any subgroup (Analyses 33 through 36)
Subgroup analyses of the effect of parenteral nutrition support on all‐cause mortality and serious adverse events
Post hoc subgroup analyses of parenteral nutrition support found no subgroup difference of nutrition support compared with control in any subgroup (Analyses 37 through 40).
Post hoc analyses of major surgery
A Trial Sequential Analysis for major surgery participants on serious adverse events at maximum follow‐up using a risk ratio reduction of 20%, an event rate in the control group of 15.2%, a two‐sided alpha of 2.5%, a beta of 20%, a diversity of 0%, showed that nutrition support did not reduce serious adverse events at maximum follow‐up for major surgery participants of 20% or more (Supplementary online material).
Post hoc analyses of participants admitted with stroke
A Trial Sequential Analysis for stroke participants on serious adverse events at maximum follow‐up using a risk ratio reduction of 20%, an event rate in the control group of 19.2%, a two‐sided alpha of 2.5%, a beta of 20%, a diversity of 83%, showed that nutrition support did not reduce serious adverse events at maximum follow‐up in stroke participants of 20% or more (Supplementary online material). The Trial Sequential Analyses did not break the boundary for futility or reach the required information size (Supplementary online material).
Post hoc analyses of the adverse events with uncertain diagnostic criteria and seriousness
In a number of trials the adverse events were not reported adequately. Multiple trialists only reported a proportion of participants experiencing, e.g. 'cardiac failure' or 'pneumonia', but did not report how the diagnosis was made or how 'serious' the event was, and the total number of observed participants was also often missing. We therefore did not include these poorly‐reported outcome results in the 'serious adverse event outcome', based on our predefined criteria (see Primary outcomes). Appendix 3 lists the adverse events/complications always considered as a serious adverse event even without a detailed description. We assessed the following outcomes post hoc: pneumonia, wound dehiscence, renal failure, wound infection, and heart failure.
Pneumonia
We included 28 trials reporting on 12,443 participants. All trials were at high risk of bias. Eight hundred and forty‐nine of 6342 participants (13.4%) randomly assigned to nutrition support versus 766 of 6101 participants (12.5%) randomly assigned to no intervention, placebo, or treatment as usual experienced pneumonia. Overall, we found no statistically significant benefit or harm of nutrition support at maximum follow‐up (random‐effects meta‐analyses RR 1.06, 95% CI 0.96 to 1.16, P = 0.28, I2 = 2%, 12,443 participants, 28 trials, low quality of evidence, Analysis 10.1).
Wound dehiscence
We included 12 trials reporting on 2280 participants. All trials were at high risk of bias. Thirty‐seven of 1237 (3.0%) nutrition support participants experienced wound dehiscence, compared with 43 of 1043 control participants (4.1%). Overall, we found no statistically significant benefit or harm of nutrition support at maximum follow‐up (random‐effects meta‐analyses RR 0.71, 95% CI 0.40 to 1.24, P = 0.22, I2 = 22%, 2280 participants, 12 trials, low quality of evidence, Analysis 11.1).
Renal failure
We included four trials reporting on 6359 participants. All trials were at high risk of bias. Two hundred and sixteen of 3272 (6.6%) nutrition support participants experienced renal failure versus 214 of 3087 control participants (6.9%). Overall, we found no statistically significant benefit or harm of nutrition support at maximum follow‐up (random‐effects meta‐analyses RR 1.00, 95% CI 0.83 to 1.20, P = 0.99, I2 = 0%, 6649 participants, 4 trials, low quality of evidence, Analysis 12.1).
Wound infection
We included 26 trials reporting on 8324 participants. All trials were at high risk of bias. Two hundred and sixteen of 4263 (5.1%) nutrition support participants experienced wound infection versus 211 of 4061 control participants (5.2%). Overall, we found no statistically significant benefit or harm of nutrition support at maximum follow‐up (random‐effects meta‐analyses RR 0.81, 95% CI 0.60 to 1.10, P = 0.18, I2 = 36%, 8324 participants, 26 trials, low quality of evidence, Analysis 13.1).
Heart failure
We included three trials reporting on 1041 participants. All trials were at high risk of bias. Thirteen out of 520 (2.5%) randomly assigned to nutrition support versus 11 out of 521 participants (2.1%) randomly assigned to no intervention, placebo, or treatment as usual experienced heart failure. Overall, we found no statistically significant benefit or harm of nutrition support at maximum follow‐up (random‐effects meta‐analyses RR 1.11, 95% CI 0.34 to 3.61, P = 0.87, I2 = 20%, 1041 participants, 3 trials, low quality of evidence, Analysis 14.1).
Post hoc analyses combining subgroups to assess the effect of following the nutritional guidelines on mortality and serious adverse events
Guidelines today focus on screening patients that are presumably at nutritional risk using screening tools designed for the purpose and providing adequate nutrition support for nutritionally at‐risk adults that are not likely to achieve adequate intake through spontaneous food intake. As a further post hoc analysis, we combined trials that included participants using screening tools (NRS 2002, MUST, SGA and MNA) which also provided the experimental group with clearly adequate nutrition and the control group with clearly inadequate nutrition (Analysis 15.1; Analysis 15.2; Analysis 15.3; Analysis 15.4). We also did a post hoc analysis of trials that included participants either with impaired nutritional status/decreased food intake (Analysis 1.8; Analysis 2.8; Analysis 3.8; Analysis 4.8) and/or increased nutritional requirements (ICU patients, major surgery, stroke and frail elderly patients) (Analysis 1.7; Analysis 2.7; Analysis 3.7; Analysis 4.7) and had a clearly adequate intake in the experimental group and had clearly inadequate intake in the control group (Analysis 1.5; Analysis 2.5; Analysis 3.5; Analysis 4.5). The results are presented in Analysis 16.1; Analysis 16.2; Analysis 16.3; Analysis 16.4. None of the analyses found any significant effect of nutrition support on mortality or serious adverse events.
Secondary outcomes
Time to death (survival data)
We included 11 trials reporting survival data (Nixon 1981; Valdivieso 1987; Kearns 1992; Brennan 1994; Bauer 2000; Bokhorst‐de 2000; Espaulella 2000; Dennis 2005; Dennis 2006; Oh 2014; Moreno 2016). All trials reported Kaplan‐Meier survival curves, but it was not possible to calculate log hazard ratios and standard errors based on these curves. No trial reported hazard ratios and standard errors. Therefor, we were unable to perform any meta‐analyses. None of the trials found significant effects of nutritional support on survival.
Morbidity
End of intervention
Only one trial reported 'morbidity' at end of intervention (Fan 1994). This trial included 124 participants and found a statistically significant benefit of nutrition support on morbidity at end of intervention using the random‐effects model (RR 0.63, 95% CI 0.42 to 0.94, P = 0.02, 124 participants, very low quality of evidence, Analysis 29.1). Fisher's exact test gave a P value of 0.0293.
Maximum follow‐up
Two trials reported morbidity at maximum follow‐up (Fan 1994; Barlow 2011), including 245 participants, and found a statistically significant benefit of nutrition support on morbidity at maximum follow‐up using the random‐effects model (RR 0.71, 95% CI 0.53 to 0.95, P = 0.02, I2 = 0%, 2 trials, 245 participants, very low quality of evidence, Analysis 30.1).
BMI
End of intervention
Fourteen trials (1008 participants) reported BMI at end of intervention. Overall, we found a statistically significant effect of nutrition support on BMI at end of intervention using the random‐effects model (MD 0.57 kg/m2, 95% CI 0.38 to 0.77, P < 0.001, I2 = 0%, 1008 participants, 14 trials, very low quality of evidence, Analysis 31.1). The test for subgroup difference found no significant difference in any analysis (Analysis 31.2; Analysis 31.3; Analysis 31.4; Analysis 31.5; Analysis 31.6; Analysis 31.7; Analysis 31.8; Analysis 31.9; Analysis 31.10; Analysis 31.11).
Egger's test for funnel plot asymmetry was not significant (P = 0.222). Begg's test was also not significant (P = 0.547).
Maximum follow‐up
Nineteen trials (1528 participants) reported BMI at maximum follow‐up. Overall, we found no statistically significant effect of nutrition support on BMI at maximum follow‐up using the random‐effects model (MD 0.40 kg/m2 95% CI ‐0.02 to 0.83, P = 0.06, I2 = 61%, 1528 participants, 19 trials, very low quality of evidence, Analysis 32.1). The test for subgroup differences found no significant difference in any analysis (Analysis 32.2; Analysis 32.3; Analysis 32.4; Analysis 32.5; Analysis 32.6; Analysis 32.7; Analysis 32.8; Analysis 32.9; Analysis 32.10; Analysis 32.11).
Egger's test for funnel plot asymmetry was not significant (P = 0.756). Begg's test was also not significant (P = 0.162).
Weight
End of intervention
Sixty‐eight trials (5445 participants) reported weight. Overall, we found a statistically significant benefit of nutrition support on weight at the end of intervention using the random‐effects model (MD 1.32 kg, 95% CI 0.65 to 2.00, P < 0.001, I2 = 98%, 5445 participants, 68 trials, very low quality of evidence, Analysis 33.1).
Subgroup analysis
In subgroup analyses we found the following: the test for subgroup difference could not be performed for the subgroup comparing high risk of bias outcomes with low risk of bias outcomes as we found no outcome results with low risk of bias (Analysis 33.2).
Analysis 33.3, comparing different modes of delivery: we found a statistically significant subgroup difference (subgroup difference: P ˂ 0.001).
Analysis 33.4, comparing trials with participants from different medical specialties: we found a statistically significant subgroup difference (subgroup difference: P < 0.001).
Analysis 33.5, comparing adequacy of the amount of nutrition: no statistically significant subgroup difference was found (subgroup difference: P = 0.57).
Analysis 33.6, comparing different screening tools: we found no statistically significant subgroup difference (subgroup difference P = 0.52).
Analysis 33.7, comparing different conditions known to be associated with malnutrition: we found no statistically significant subgroup difference (subgroup difference P = 0.52).
Analysis 33.8, participants classified as at nutritional risk according to specific criteria concerning BMI, weight, insufficient food intake: we found a statistically significant subgroup difference (subgroup difference P = 0.01).
Analysis 33.9, comparing participants classified as at nutritional risk according to biomarkers or anthropometric: we found a statistically significant subgroup difference (subgroup difference P = 0.006).
Analysis 33.10, comparing year of publication: we found no statistically significant subgroup difference (subgroup difference P = 0.06).
Analysis 33.11, comparing different interventions lengths of intervention: we found no statistically significant subgroup difference (subgroup difference P = 0.20).
Sensitivity analysis
For trials with missing SDs, we imputed SDs from trials with a similar number of participants. For Fan 1994 we used the SD from Starke 2011, for Førli 2001 from Kawaguchi 2008, for Hickson 2004 from Dong 1996, for Hoffmann 1988 from Munk 2014, for Malhotra 2004 from Johansen 2004, for McWhirter 1996a; McWhirter 1996b from Zheng 2001a; Zheng 2001b. This exploratory analysis still resulted in a small statistically significant benefit using the random‐effects model (MD 1.40 kg, 95% CI 0.76 to 2.03, P ˂ 0.001, I2 = 98%, 5445 participants, 68 trials, very low quality of evidence, Analysis 33.12).
Egger's test for funnel plot asymmetry was not significant (P = 0.823). Begg's test was also not significant (P = 0.149).
Maximum follow‐up
Seventy‐eight of 244 trials (29.91%), with 6865 participants, reported weight. Overall, we found a statistically significant benefit of nutrition support on weight at maximum follow‐up using the random‐effects model (MD 1.13, 95% CI 0.50 to 1.75, P < 0.001, I2 = 98%, 6916 participants, 78 trials, very low quality of evidence, Analysis 34.1).
Subgroup analysis
In subgroup analyses we found the following: we could not perform the test for subgroup difference for the subgroup comparing high risk of bias outcomes with low risk of bias outcomes, because we found no outcome results with low risk of bias (Analysis 33.2).
Analysis 34.3, comparing different modes of delivery: we found a statistically significant subgroup difference : P ˂ 0.001).
Analysis 34.4, comparing trials with participants from different medical specialties: we found a statistically significant subgroup difference (subgroup difference: P ˂ 0.001).
Analysis 34.5, comparing adequacy of the amount of nutrition: we found no statistically significant subgroup difference (subgroup difference: P = 0.85).
Analysis 34.6, comparing different screening tool: we found a statistically significant subgroup difference (subgroup difference P = 0.004).
Analysis 34.7, comparing different conditions known to be associated with malnutrition: we found a statistically significant subgroup difference (subgroup difference P ˂ 0.001).
Analysis 34.8, participants classified as at nutritional risk according to specific criteria concerning BMI, weight, insufficient food intake: we found a statistically significant subgroup difference (subgroup difference P = 0.02).
Analysis 34.9, comparing participants classified as at nutritional risk according to biomarkers or anthropometric: we found a statistically significant subgroup difference (subgroup difference P = 0.005).
Analysis 34.10, comparing year of publication: we found a statistically significant subgroup difference (subgroup difference P = 0.008).
Analysis 34.11, comparing different lengths of intervention: we found no statistically significant subgroup difference (subgroup difference P = 0.29).
Egger's test for funnel plot asymmetry was not significant (P = 0.887). Begg's test was also not significant (P = 0.145).
Hand‐grip strength
End of intervention
Eleven trials (783 participants) reported hand‐grip strength at end of intervention. Overall, we found a statistically significant benefit of nutrition support on hand‐grip strength using the random‐effects model (MD 1.47 kg, 95% CI 0.58 to 2.37, P = 0.001, I2 = 48%, 783 participants, 11 trials, very low quality of evidence, Analysis 35.1). Two trials reported hand‐grip strength in kilo pascal (Keele 1997; MacFie 2000). These were not part of the meta‐analysis.
Egger's test for funnel plot asymmetry was not significant (P = 0.546). Begg's test was also not significant (P = 0.788).
Maximum follow‐up
Fourteen trials (1240 participants) reported hand‐grip strength at maximum follow‐up. Overall, we found no statistically significant benefit of nutrition support on hand‐grip strength using the random‐effects model (MD 0.96 kg, 95% CI 0.15 to 1.76, P = 0.02, I2 = 40%, 14 trials, 1240 participants, very low quality of evidence, Analysis 36.1). Two trials reported hand‐grip strength in kilo pascal (Keele 1997; MacFie 2000). These were not part of the meta‐analysis.
Egger's test for funnel plot asymmetry was not significant (P = 0.834). Begg's test was also not significant (P = 0.625).
Six‐minute walking distance
One trial reported six‐minute walking distance (Rabadi 2008). It found a statistically significant benefit of nutrition support on six‐minute walking distance (MD 133.27 feet, 95% CI 24.32 to 242.22, P = 0.02, very low quality of evidence, Analysis 37.1).
Summary of findings table
Our main results are summarised in the 'summary of findings Table for the main comparison'.
Discussion
Summary of main results
We included 244 trials randomising 28,619 participants. The trials included a heterogenous group of participants, the settings varied, and the experimental and control interventions differed. All trials were at high risk of bias and the level of evidence was low for all‐cause mortality and serious adverse events, and very low for health‐related quality of life. Despite these limitations, overall we saw small or no effects of nutrition support on all outcomes, and our findings had surprisingly low heterogeneity. These limited signs of statistical heterogeneity support the decision to conduct the meta‐analysis by pooling all types of nutrition support interventions in one meta‐analysis, as we did (see Overall completeness and applicability of evidence for a detailed discussion).
Our meta‐analyses showed that nutrition support versus control did not have a statistically significantly effect on all‐cause mortality at end of intervention. The result of our Trial Sequential Analyses implied firm evidence of nutrition support not reducing or increasing the risk ratio of all‐cause mortality by 20% or more at end of intervention (Figure 4; Effects of interventions). Post hoc Trial Sequential Analysis showed we had enough power to reject a risk ratio of 11% or more reduction in all‐cause mortality at end of intervention (Supplementary online material). All‐cause mortality at maximum follow‐up also showed no statistically significant effect of nutrition support when considered against a predefined threshold for statistical significance of 0.025. The result of our Trial Sequential Analyses implied firm evidence of nutrition support not reducing or increasing the risk ratio for all‐cause mortality by 20% or more at maximum follow‐up (Supplementary online material; Effects of interventions). Post hoc Trial Sequential Analysis showed we had enough power to reject a 10% or more reduction in all‐cause mortality at maximum follow‐up Supplementary online material).
Our meta‐analyses showed that nutrition support versus control did not have a statistically significant effect on serious adverse events at end of intervention. The result of our Trial Sequential Analysis implied firm evidence of nutrition support not reducing or increasing the risk ratio of serious adverse events by 20% or more at end of intervention (Supplementary online material; Effects of interventions). Post hoc Trial Sequential Analysis showed we had enough power to reject a risk ratio of 11% or more reduction in serious adverse events at end of intervention (Supplementary online material). Serious adverse events at maximum follow‐up were statistically significantly reduced with nutrition support, but this was not seen at end of intervention and therefore the finding may be a result of multiplicity or risk of bias or both (Jakobsen 2014; Jakobsen 2016). The outcome results were at high risk of bias and the result of our Trial Sequential Analysis analysis implied firm evidence of nutrition support not reducing or increasing serious adverse events by 20% or more at maximum follow‐up (Supplementary online material; Effects of interventions). Post hoc Trial Sequential Analysis showed we had enough power to reject a risk ratio of 10% or more reduction in serious adverse events at maximum follow‐up (Figure 5).
Quality of life in participants receiving nutrition support was not statistically significantly affected at maximum follow‐up. Few trials used similar quality‐of‐life questionnaires, and only data from EuroQoL utility score and SF‐36 could be used in a meta‐analysis. In both meta‐analyses we found no beneficial or harmful effects. While most of the trials found no beneficial or harmful effect of nutrition support, a few trials found a beneficial effect on specific quality‐of‐life variables.
BMI at end of intervention showed a statistically significant improvement when participants received nutrition support (Analysis 31.1). The clinical relevance of this increase is unknown. BMI at maximum follow‐up did not show a statistically significant increase (Analysis 32.1).
Weight at end of intervention and at maximum follow‐up showed a statistically significant increase when participants received nutrition support. The clinical relevance of this increase is unknown (Analysis 33.1; Analysis 34.1).
Hand‐grip strength at end of intervention showed a statistically significant improvement when participants received nutrition support, but the increase was not statistically significant at maximum follow‐up. The clinical relevance of this increase is unknown.
Nutrition support analysed by route of administration
We assessed individually the different modes of delivery of nutrition support. Trial Sequential Analysis for enteral nutrition for serious adverse events at maximum follow‐up broke the threshold for significant benefit (Analysis 4.3; Figure 6; Effects of interventions). There are, however, many important considerations when interpreting this result: all trials were at high risk of bias and the funnel plot was highly suggestive of publication bias (Supplementary online material). Furthermore, it is important to note that, given the amount of subgroup analyses, outcomes, time points, and our threshold for significance, one might expect that by chance alone a type I error would occur (Jakobsen 2016). Despite the significant meta‐analysis result and confirmed 20% risk ratio reduction in the Trial Sequential analysis, trials at low risk of bias will need to assess the effects of enteral nutrition before we can draw any conclusions.
Standard parenteral and oral nutrition broke the threshold for futility, indicating no beneficial or harmful effects despite the high risk of bias (Supplementary online material).
We also performed our subgroup analyses according to the different kinds of nutrition support (not for general and fortified foods, since we identified very few trials that used these kinds of nutrition support) at the suggestion of the editor and one of the peer reviewers. The results of the new subgroup analyses are in agreement with the subgroup analyses of our overall analyses: we found no benefit of oral nutrition support or parenteral nutrition support in any subgroup. Enteral nutrition may be beneficial for different subgroups of patients and may be tested in future trials with low risk of bias and with adequate power.
Exploratory subgroup analyses
Tests for subgroup differences found a significant difference in the subgroup comparing different conditions, theoretically known to increase the nutritional requirements on serious adverse events at maximum follow‐up (Analysis 4.7). Trial Sequential Analysis for major surgery did not pass through the boundary for benefit, implying that nutrition support does not result in a risk ratio reduction of 20% in the risk of a serious adverse event at maximum follow‐up, especially when considering the fact that the trials were at high risk of bias (Supplementary online material).
Trial Sequential Analysis for stroke participants did not pass through the boundary for benefit, implying that nutrition support does not reduce the risk ratio of serious adverse events at maximum follow‐up of 20%. The Trial Sequential Analysis did not reach the required information size (Supplementary online material).
Using the test for subgroup differences, no other subgroups showed significant benefit or harm. For a discussion of the limitations in the way we have handled subgroups and the review in general, see Overall completeness and applicability of evidence.
Overall completeness and applicability of evidence
We searched for published and unpublished trials irrespective of publication type, publication date, and language. We also searched bibliographies of both Cochrane and non‐Cochrane Reviews on nutrition support for any trials we missed. Overall, we have included more trials than any nutrition review ever before, due to our broader inclusion criteria as well as our extensive searches.
A number of the funnel plots suggest that we are still missing data from trials favouring the control group compared with nutrition support (Supplementary online material). This may be due to publication bias, but other types of bias might also cause the asymmetries. The high risks of bias suggest that our results may possibly be due to an overestimate of the benefit and an underestimate of the harm of nutrition support.
Discussion of heterogeneity (clinical and statistical) regarding our overall analysis
We included a very clinically heterogenous participant population assessed in various settings examining various types of nutrition support administered through different routes. Different inclusion criteria exist regarding how to assess whether or not a participant is at nutritional risk and we therefore chose to include various definitions. We chose to focus primarily on the overall analysis, with all types of nutrition support pooled in one analysis for three reasons: 1) we wanted to assess the overall effects of nutrition support in hospitalised adults at nutritional risk; 2) this pooled analysis would have the largest statistical power as well as precision; and 3) pooling all types of nutrition support makes it possible to use subgroup analyses to compare the effects of the different nutrition support interventions. If by pooling all the trials we saw very large heterogeneity, we would not have conducted the overall analyses and instead would have explored (as we still do) any possible explanation for the heterogeneity seen.
We found no signs of statistical heterogeneity in the meta‐analyses, using both visual inspection of the forest plots as well as the statistical tests for heterogeneity for our primary outcomes. For our secondary outcomes, we found no heterogeneity when visually inspecting the forest plots, but the I2 for the outcomes results of weight was high. Our many subgroup analyses also found few subgroups of participants that may benefit from nutrition support, the potential exception being major surgery and stroke participants (Analysis 4.7). The latter subgroup analysis was only significant at maximum follow‐up for serious adverse events. It is important to make the distinction between clinical heterogeneity (which is very large in this review) and statistical heterogeneity (of which there is little indication of in this review). In case of large statistical heterogeneity, we would have had to split up the review perhaps into different modes of administration or concluded that no overall conclusion for nutrition support could be made. However, we found no signs of statistical heterogeneity and the pooling of the different nutritional interventions seems to be appropriate. The overall agreement between our review and the other Cochrane Reviews assessing nutrition support for hospitalised adults makes it even more plausible that our conclusions on nutrition support appy to participants regardless of how they were included in our review (see Agreements and disagreements with other studies or reviews for further details).
Applicability of results for specific subgroups
Mode of delivery
We found no subgroup differences between the different types of nutrition support . Our exploratory Trial Sequential Analyses indicated that enteral nutrition may be beneficial in the settings tested, whereas parenteral nutrition and oral nutrition do not seem to offer any benefit in the settings tested. Performing the same subgroups analyses as for the overall analyses, but only looking at parenteral nutrition support or oral nutrition support, we found no benefit in any subgroup. There was insufficient statistical power for general nutrition support and fortified foods. We therefore primarily recommend future research assessing the effects of enteral nutrition, because this intervention seems to be the only potentially promising nutritional intervention.
Other subgroup analyses (including specific patient populations)
The main objective of this review was to assess the effects of nutrition support in adults at nutritional risk. As described in the Background section, malnutrition can be divided into starvation‐related malnutrition and disease‐related malnutrition. If a common pathway exists from disease to malnutrition to poorer clinical outcome, we expected that our approach would show that nutrition support benefits the participants across medical specialties as they would share a common feature, i.e. malnutrition. This was the rationale for looking at nutrition support broadly instead of assessing participants according to medical specialty as has previously been done in most reviews. As noted above, this has introduced large clinical heterogeneity. However, across most of our subgroups, there was no difference in the effect of nutrition support and a noticeable absence of heterogeneity. Guideline developers may wish to look at the overall analyses as well as the subgroup analyses.
In future updates, we plan to include secondary publications looking at the different participant populations as well as exploring possible areas of benefit of the different types of nutrition support.
It is very important when exploring possible areas of benefit, as we intend in subsequent updates, that we pay attention to the risk of multiplicity as well as assessing the limitations of the amount of information. Subgroup analyses should be confirmed in new trials at low risk of bias. Our results indicate that in most cases there will be too little information to conclude whether nutrition support is beneficial or harmful for specific subgroups of participant, using a specific nutrition support intervention.
Limation of the external validity of our review
We only included hospitalised adults and it is possible that nutrition support administered in an outpatient setting may be beneficial.
We did not include interventions assessing immuno‐nutrition, elemental diets, glutamine only as the primary intervention, micronutrients only, or similar non‐standard nutrition support interventions. Neither does our review provide any evidence on the effect of nutrition support in children.
The co‐interventions/standard care also varied across the included trials, due to the diverse participant population, the difference in practices, as well as the different time periods in which the included trials were conducted. Even though our results did not indicate any significant statistical heterogeneity, the clinical heterogeneity is a limitation of our systematic review, because the subsequent generalisation of the review results might be limited.
It is also important to note that our results only apply to participants who were randomised to nutrition support versus ‘no nutrition support’, i.e. it was judged to be ethically acceptable that the control participants could receive ‘no nutrition support’. Hence, our results do not apply to hospitalised adults who were not able to eat, were unconscious, or unable to absorb nutrients, e.g. due to short bowl syndrome. The benefits and harms of the different forms of nutritional support in such participant groups need further specific scrutiny in systematic reviews.
In our review, we have not specifically assessed the effects on non‐serious adverse events/non‐serious complications. We only assessed adverse events if they were 'serious'. The reason for this was that we expected to identify a large number of trials from all medical specialties, with different types of participants, different types of interventions, etc. We expected that assessing the effects of nutrition support on non‐serious adverse events across these different types of trials would have limited validity, as the events would be very heterogenous as well as differing in their clinical significance. Additionally, we did not assess the risk of serious adverse events and non‐serious adverse events in quasi‐randomised and observational studies. Specific systematic reviews of these types of studies are needed. Moreover, we did not assess cluster‐randomised clinical trials.
We identified three cluster‐randomised trials. Two reported no effect of nutrition support on mortality (Bourdel‐Marchasson 2000; Martin 2004) and one trial had not reported data at the time of writing (Britton 2012). Bourdel‐Marchasson 2000 also found a reduction in pressure sores. Martin 2004 did not report adverse events.
Quality of the evidence
We downgraded the quality of evidence to low due to very serious risk of bias for all‐cause mortality and serious adverse events outcomes. Quality of life was downgraded to very low quality of evidence due to a very serious risk of bias, and a serious inconsistency of the evidence. Weight was downgraded to very low quality of evidence because of very serious risk of bias and inconsistency (see summary of findings Table for the main comparison).
We found no trials or outcome results with a low risk of bias (see Risk of bias in included studies). There is a high risk of our results showing an overestimation of benefit and underestimation of harm of nutrition support (Hrobjartsson 2012; Hrobjartsson 2013; Hrobjartsson 2014a; Hrobjartsson 2014b; Savović 2012a; Schulz 1995; Sutton 2000; Wood 2008).
Visual inspection of a number of funnel plots suggested asymmetry, including the few outcome results that indicated benefit for nutrition support. We then used the trim‐and‐fill method in an attempt to assess the impact of publication bias on our results. The trim‐and‐fill method showed us that the possible publication bias did not appear to have a strong influence on our results.
Despite the variation in the participant populations recruited to the studies, we observed very little statistical heterogeneity in our primary results.
Trial Sequential Analyses of both all‐cause mortality and serious adverse events showed that we had enough information to confirm or reject our anticipated intervention effects. Given we have met the required information size forrisk ratio reductions (RRR) of 10% or more, and we a priori considered a RRR of 20% clinically significant, we do not regard the confidence intervals as wide enough to downgrade further to very low quality due to serious imprecision. The Trial Sequential Analyses of the third primary outcome, quality of life, showed we did not have enough information to confirm or reject our anticipated intervention effect. The Trial Sequential Analysis for enteral nutrition showed that we had enough information to confirm or reject our anticipated intervention effect. Despite this, much consideration must still be given when interpreting this result, see 'Potential biases in the review process'.
The average non‐significant reduction at end of intervention in absolute all‐cause mortality following any type of nutrition support when compared with control was around 0.5%, from 8.3% to 7.8%. For serious adverse events, the non‐significant reduction in risk was 0.7%, from 9.9% to 9.2%. The point estimate from maximum follow‐up was slightly larger (1% for all‐cause mortality and 1.5% for serious adverse events). However, the Trial Sequential Analysis showed that we had enough information to rule out 11% or more relative risk reductions for both outcomes at end of intervention and at maximum follow‐up, but not enough information to confirm or reject risk ratios of 10% or below. Whether RRRs below 10% are clinically relevant is debatable. Consideration should perhaps be given to critically‐ill populations with very high underlying risk of death or serious adverse events.
Potential biases in the review process
Strengths
We included trials regardless of language of publication and whether they reported data on the outcomes we needed. We contacted relevant authors for additional information. We included more participants than previous systematic reviews (Koretz 2001; Perel 2006; Koretz 2007; Milne 2009; Burden 2012; Koretz 2012; Koretz 2014; Avenell 2016), giving us increased power and precision to detect any significant differences between the intervention and control groups.
We followed our peer‐reviewed Cochrane protocol which was published before the literature search began (Feinberg 2015). We conducted the review using the methods recommended by Cochrane and findings of additional methodological studies (Higgins 2011). We also performed Trial Sequential Analyses and used an eight‐step procedure to assess whether the thresholds for statistical and clinical significance were crossed (Jakobsen 2014). This adds further robustness to our results and conclusions. We also tested the robustness of our results with sensitivity analyses ('best‐worst', 'worst‐best', no‐event trials and for missing SDs).
Our meta‐analyses had little statistical heterogeneity, strengthening the validity of our results.
Limitations
Our systematic review has several limitations. Our findings, interpretations, and conclusions are affected by the quality and quantity of the trials we included. We included both different participant populations and different forms of nutrition support, which introduced some possible interpretative limitations to our review (see 'Overall completeness and applicability of evidence' for a discussion).
A potential methodological limitation is our definition of a serious adverse event. In line with the protocol (Feinberg 2015), we included the trial result as a serious adverse event if the event or complications was described as any untoward medical occurrence that resulted in death, was life‐threatening, required hospitalisation or prolongation of existing hospitalisation, or resulted in persistent or significant disability or incapacity. Using this definition, we created a list early in the review process of the events we considered serious and would therefore include, even if the trialist did not classify the adverse events as a 'serious adverse event'. We also included the event as a serious adverse event if the trialists used the term 'serious' or 'major' when reporting the adverse event or complication. If there was doubt if the event should be included then we contacted the trial authors in order to clarify whether we should include the event in our analyses. Most of the trials were not adequately blinded and the assessment of the adverse events in these trials might have been influenced by knowledge of treatment allocation. It is therefore likely that our results overestimate the beneficial effect and underestimate the possible harmful effects of nutrition support. Furthermore, It is always problematic to use composite outcomes, because the different elements of the composite outcome will often have different degrees of severity. It is therefore possible that even with a neutral result there is in reality a significant difference in the severity of symptoms between the compared groups. Nevertheless, using composite outcomes increases power and is therefore often a valid technique, but the limitations must be considered when interpreting results on, for example, serious adverse events.
Another possible limitation of our review is that we do not require a minimum amount of nutrition support. We did this in order to avoid arbitrary cut‐offs. We have instead analysed this in subgroup analyses (Analysis 1.5; Analysis 2.5; Analysis 3.5; Analysis 4.5). The analyses found no difference between the 'adequate' and 'inadequate' nutrition‐support trials. The subgroups were based on our a priori definitions including our predefined cut‐offs. Our cut‐offs may be questionable. It may also be that indirect calorimetry to assess individual nutritional requirement is necessary. We should perhaps have included a definition of 'adequate protein' in our review.
We also made some changes from the protocol stage and added some post hoc analyses, which is also a limitation of our review, see 'Differences between protocol and review' for details.
Our review does not specifically address international guidelines. According to recent international guidelines (Jensen 2010), being nutritionally at‐risk includes both the aspect of nutritional status and the aspect of an elevated rate of catabolism caused by inflammation in participants, who are unlikely to eat adequately and who are treated with an adequate intake. The post hoc Analysis 16.4 results in a statistically significant effect of nutrition support on serious adverse events at maximum follow‐up (RR 0.76, 95% CI 0.61 to 0.95, P = 0.02, I2 = 0%, 2372 participants, 21 trials, low quality of evidence) when removing Casaer 2011. The reason for omitting Casaer 2011 is the controversy surrounding the validity of Casaer 2011 (Bistrian 2011; Felbinger 2011; Marik 2011; O'Leary 2011; McClave 2012). It must be noted that Analysis 16.4 is not significant with Casaer 2011 included. Given the large consensus among clinical societies around the approach of identifying nutritionally at‐risk participants based on specific criteria and providing adequate nutrition to these people despite the lack of documented effect, future trials should be conducted to test this approach.
We also included a very large number of subgroup analyses and numerous outcomes. Although we have adjusted our threshold for significance for our three primary outcomes, there is still a substantial risk of a type 1 error (i.e. falsely rejecting the null hypothesis), given that we have assessed three primary outcomes, seven secondary outcomes, two time points of interest, and have 10 subgroup analyses. This leads to problems with multiplicity (Jakobsen 2014; Jakobsen 2016). It is plausible that the few significant effects of nutrition we have found may be due to 'random error'. We therefore consider the subgroup analyses results as exploratory and hypothesis‐generating. We accept a P value of 0.05 or below as statistically significant in these analyses, i.e. we do not adjust our P values for subgroup analyses. It is obvious to most that when you collect a large amount of data as we have done here, you also want to explore any possible interactions, and we therefore caution the reader to interpret our findings with respect to the substantial risk of a type 1 error.
Our 'worst‐best' and 'best‐worst' analyses showed that there is a high risk of incomplete outcome data bias (Analysis 1.12; Analysis 1.13; Analysis 2.12; Analysis 2.13; Analysis 3.13; Analysis 3.12; Analysis 4.12; Analysis 4.13). Incomplete outcome data bias might alone have caused the few significant results of nutrition. Most of the trials did not report exactly how all‐cause mortality or serious adverse events were assessed. It was often only reported that a certain number of participants died or experienced a serious adverse event, without reporting how many participants were analysed (and hence, how many had incomplete outcome data). One hundred and ninety‐four of 244 trials were assessed as being at unclear or high risk of bias on the incomplete outcome data bias domain, illustrating the high risk of missing data potentially biasing our review results. If insufficient data were reported by the trialists then we tried to contact the authors, but they seldom replied, so we often had insufficient information to assess whether the reported number of deaths or serious adverse events were out of the intention‐to‐treat population or out of an unclearly‐defined observed‐cases population. This might bias our sensitivity meta‐analyses because we used only the data on the reported population if no other information was available. Incomplete outcome data bias might potentially have an even greater impact than our 'best‐worst'/'worst‐best' case scenarios show, i.e. the ’true’ difference between the observed cases and the intention‐to‐treat population might be larger than our data suggest.
We were unable to obtain 34 publications: (Wenzel 1968; Serrou 1982a; Cardona 1986; Liu 1989; Rovera 1989; Huang 1990; Eckart 1992; Mori 1992; Dai 1993; Kolacinski 1993; Li 1993; Driver 1994; Cao 1995; Lv 1995; Wu 1995; Yu 1995; Hu 1996; Liu 1996; Liu 1996a; Volkert 1996; Wu 1996a; Xue 1996; Yoichi 1996; Yu 1996; Lu 1997; Zeng 1997; Zhen 1997; Chai 1998; Guo 1998; Huo 1998; Jin 2000; Anonymous 2003; Nutrition 2003; Li 2013). Most of these seem to have been conducted in China.
We also only assessed academic bias as an 'other potential bias', as well as any obvious bias we encountered, i.e. not in a systematic way. As such, we have not taken systematic account of other potential sources of bias.
We did not search the database CINAHL, which is a limitation of our systematic review.
Agreements and disagreements with other studies or reviews
Below we have compared our results with the results of other reviews on nutrition.
Reviews that lacked estimations of required information sample sizes calculations but reached similar conclusions as our review:
Perel 2006 found no statistically significant benefit on mortality of early versus delayed nutrition support for head‐injured participants.
Milne 2009 found no effect on mortality of oral nutrition support in hospitalised elderly participants at nutritional risk (fixed‐effect meta‐analysis RR 0.91, 95% CI 0.80 to 1.04). The authors did, however, conclude that there was a small increase in weight for elderly participants (both hospitalised and community dwellers) (fixed‐effect meta‐analysis MD 2.15 kg, 95% CI 1.80 to 2.49, P < 0.001).
Avenell 2016 found no statistically significant effect on mortality or 'unfavourable outcomes' of nutrition support as after‐care for hip fracture participants.
Koretz 2012 found no effect on mortality of enteral, parenteral, and oral nutrition supplements for liver patients, both medical and surgical. One trial at low risk of bias showed increased mortality.
Koretz 2014 found a beneficial effect of enteral nutrition on mortality in critically‐ill adults (RR 0.61, 95% CI 0.41 to 0.89). However, the benefit of nutrition support on mortality was only present in trials with high risk of bias and the review concluded that there was currently not enough evidence to conclude that enteral nutrition for critically‐ill adults is beneficial, and that randomised clinical trials at low risk of bias are needed.
Bally 2016 found no effect on mortality in hospitalised medical participants. The systematic review included 22 trials covering 3726 participants. As a secondary outcome, the authors found a statistically significant increase in weight (MD 0.72 kg, 95% CI 0.23 to 1.21). The findings are in agreement with our review, with nutrition only showing a small benefit on weight but no effect on mortality.
Reviews that lacked estimations of required information sizes and found benefit of nutrition support:
Burden 2012 (preoperative gastro‐intestinal surgery) did not assess mortality. They did, however, show a reduction in major complications when using preoperative parenteral nutrition but no effect of oral nutrition supplements nor of enteral nutrition. Our overall conclusions differ from Burden 2012 but our subgroup of adults undergoing gastro‐intestinal surgery showed that this group may have more benefit of nutrition support than other participant groups.
Reviews that lacked estimations of required information sizes and concluded more trials were needed:
Murray 2017 found that there was not enough information to conclude whether providing standard parenteral nutrition over intravenous hydration was beneficial for bone marrow transplant patients. The review included three trials.
Wasiak 2006 found no statistically significant effect on mortality of early versus delayed nutrition support in burn patients but only included one trial (Peck 2004), and concluded that more trials were needed.

Study flow diagram.

Risk of bias summary: review authors' judgements about each risk of bias item for each included study.

Risk of bias graph: review authors' judgements about each risk of bias item presented as percentages across all included studies.

Trial Sequential Analysis on all‐cause mortality (end of intervention) in 114 high risk of bias trials. The diversity‐adjusted required information size (RIS) was calculated based on mortality in the control group of 8.29%; risk ratio reduction of 20% in the experimental group; type I error of 2.5%; and type II error of 20% (80% power). No diversity was noted. The required information size was 9526 participants. The cumulative Z‐curve (blue line) did not cross the trial sequential monitoring boundaries for benefit or harm (red inward sloping lines). The cumulative Z‐curve crossed the inner‐wedge futility line (red outward sloping lines). Additionally the cumulative Z‐score crossed the RIS. The green dotted line shows conventional boundaries (2.5%).

Trial Sequential Analysis on serious adverse events (maximum follow‐up) in 137 high risk of bias trials. The diversity‐adjusted required information size (RIS) was calculated based on an incidence rate of serious adverse event in the control group of 15.2%; risk ratio reduction of 10% in the experimental group; type I error of 2.5%; and type II error of 20% (80% power). No diversity was noted. The required information size was 19535 participants. The cumulative Z‐curve (blue line) did not cross the trial sequential monitoring boundaries for benefit or harm (red inward sloping lines). The cumulative Z‐curve crossed the inner‐wedge futility line (red outward sloping lines) indicating that sufficient information is provided. Additionally the cumulative Z‐score crossed the RIS. The green dotted line shows conventional boundaries (2.5%). The cumulative Z‐curve later crosses the green line, indicating a possible significant effect, but one that is smaller than a 10% risk ratio reduction.

Trial Sequential Analysis on serious adverse events (maximum follow‐up) with participants receiving enteral nutrition in 49 high risk of bias trials. The diversity‐adjusted required information size (RIS) was calculated based on an incidence rate of serious adverse event in the control group of 17.2%; risk ratio reduction of 20% in the experimental group; type I error of 2.5%; and type II error of 20% (80% power). No diversity was noted. The required information size was 4444 participants. The cumulative Z‐curve (blue line) did cross the trial sequential monitoring boundaries for benefit (red inward sloping lines) indicating that enteral nutrition may result in a 20% or greater risk ratio reduction of serious adverse events at maximum follow‐up. The cumulative Z‐curve did not cross the inner‐wedge futility line (red outward sloping lines). The green dotted line shows conventional boundaries (2.5%).

Comparison 1 All‐cause mortality ‐ end of intervention, Outcome 1 All‐cause mortality ‐ overall.

Comparison 1 All‐cause mortality ‐ end of intervention, Outcome 2 All‐cause mortality ‐ bias.
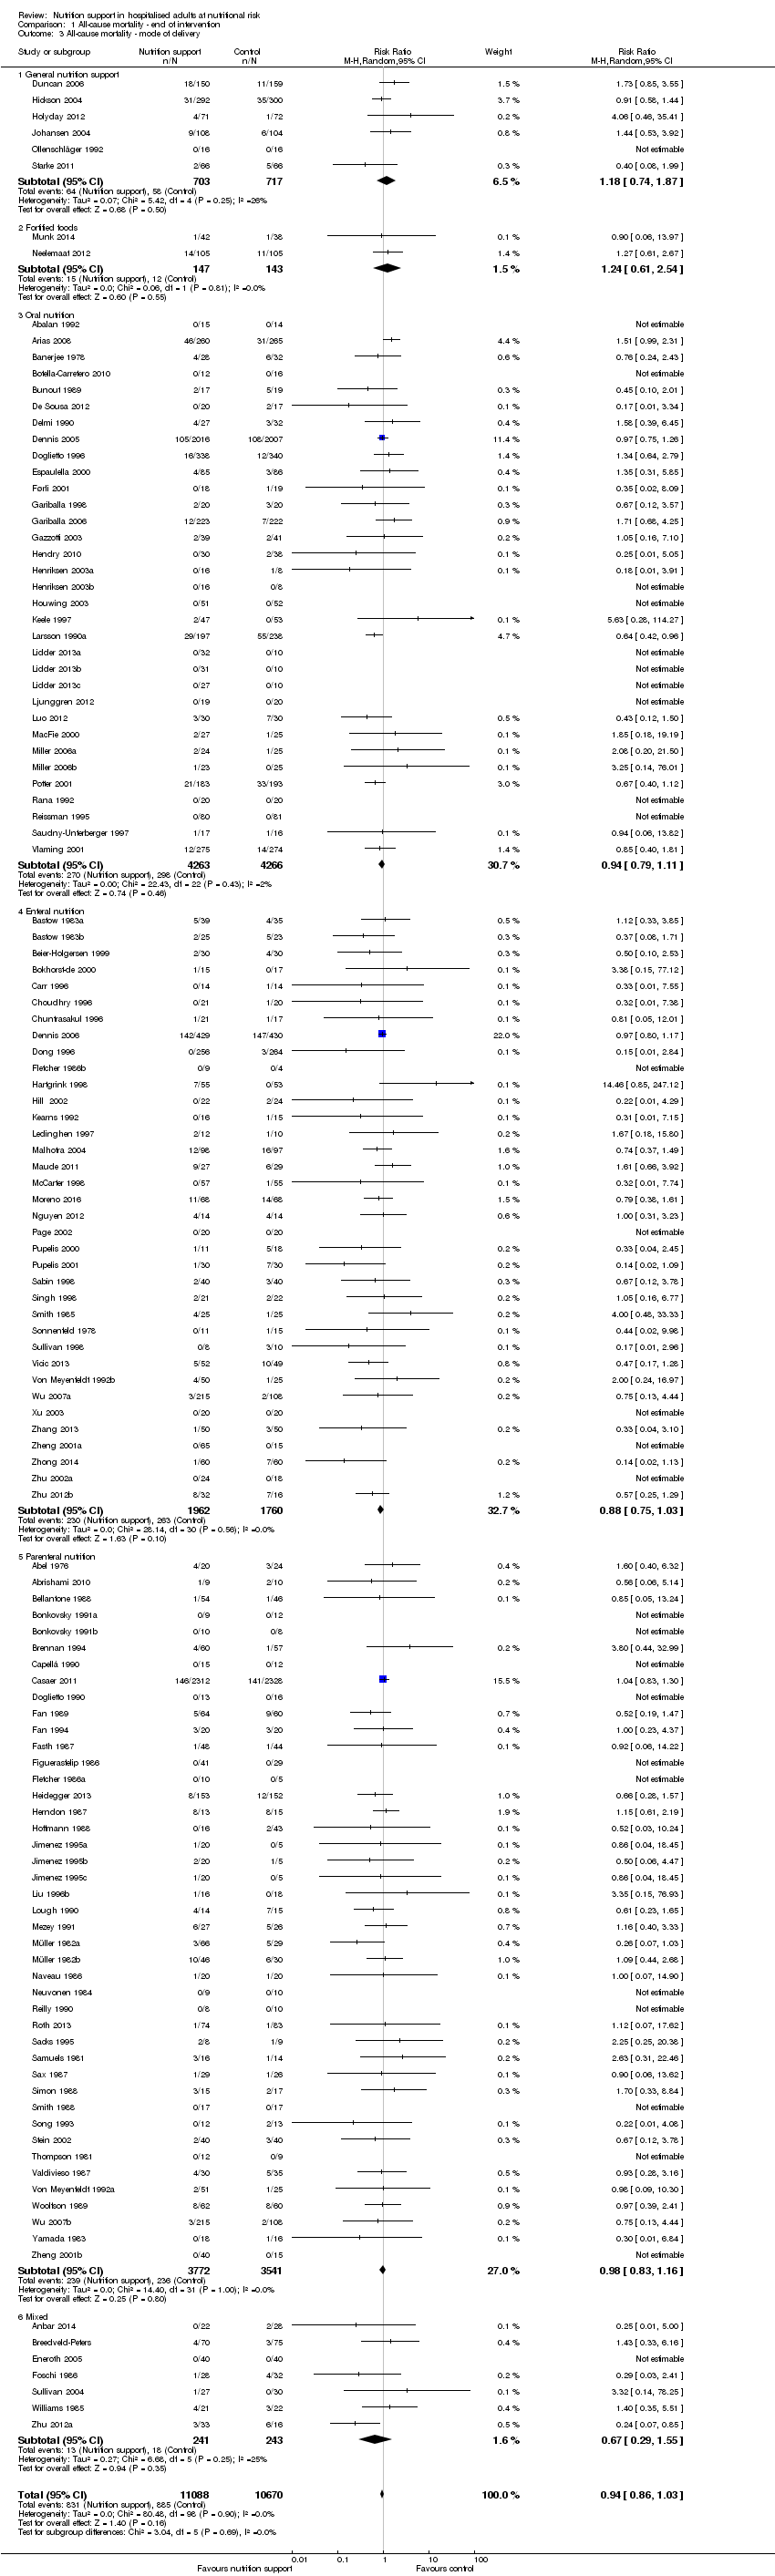
Comparison 1 All‐cause mortality ‐ end of intervention, Outcome 3 All‐cause mortality ‐ mode of delivery.

Comparison 1 All‐cause mortality ‐ end of intervention, Outcome 4 All‐cause mortality ‐ medical specialty.

Comparison 1 All‐cause mortality ‐ end of intervention, Outcome 5 All‐cause mortality ‐ based on adequacy of the amount of calories.

Comparison 1 All‐cause mortality ‐ end of intervention, Outcome 6 All‐cause mortality ‐ different screening tools.

Comparison 1 All‐cause mortality ‐ end of intervention, Outcome 7 All‐cause mortality ‐ participants characterised as 'at nutritional risk' due to one of the following conditions.
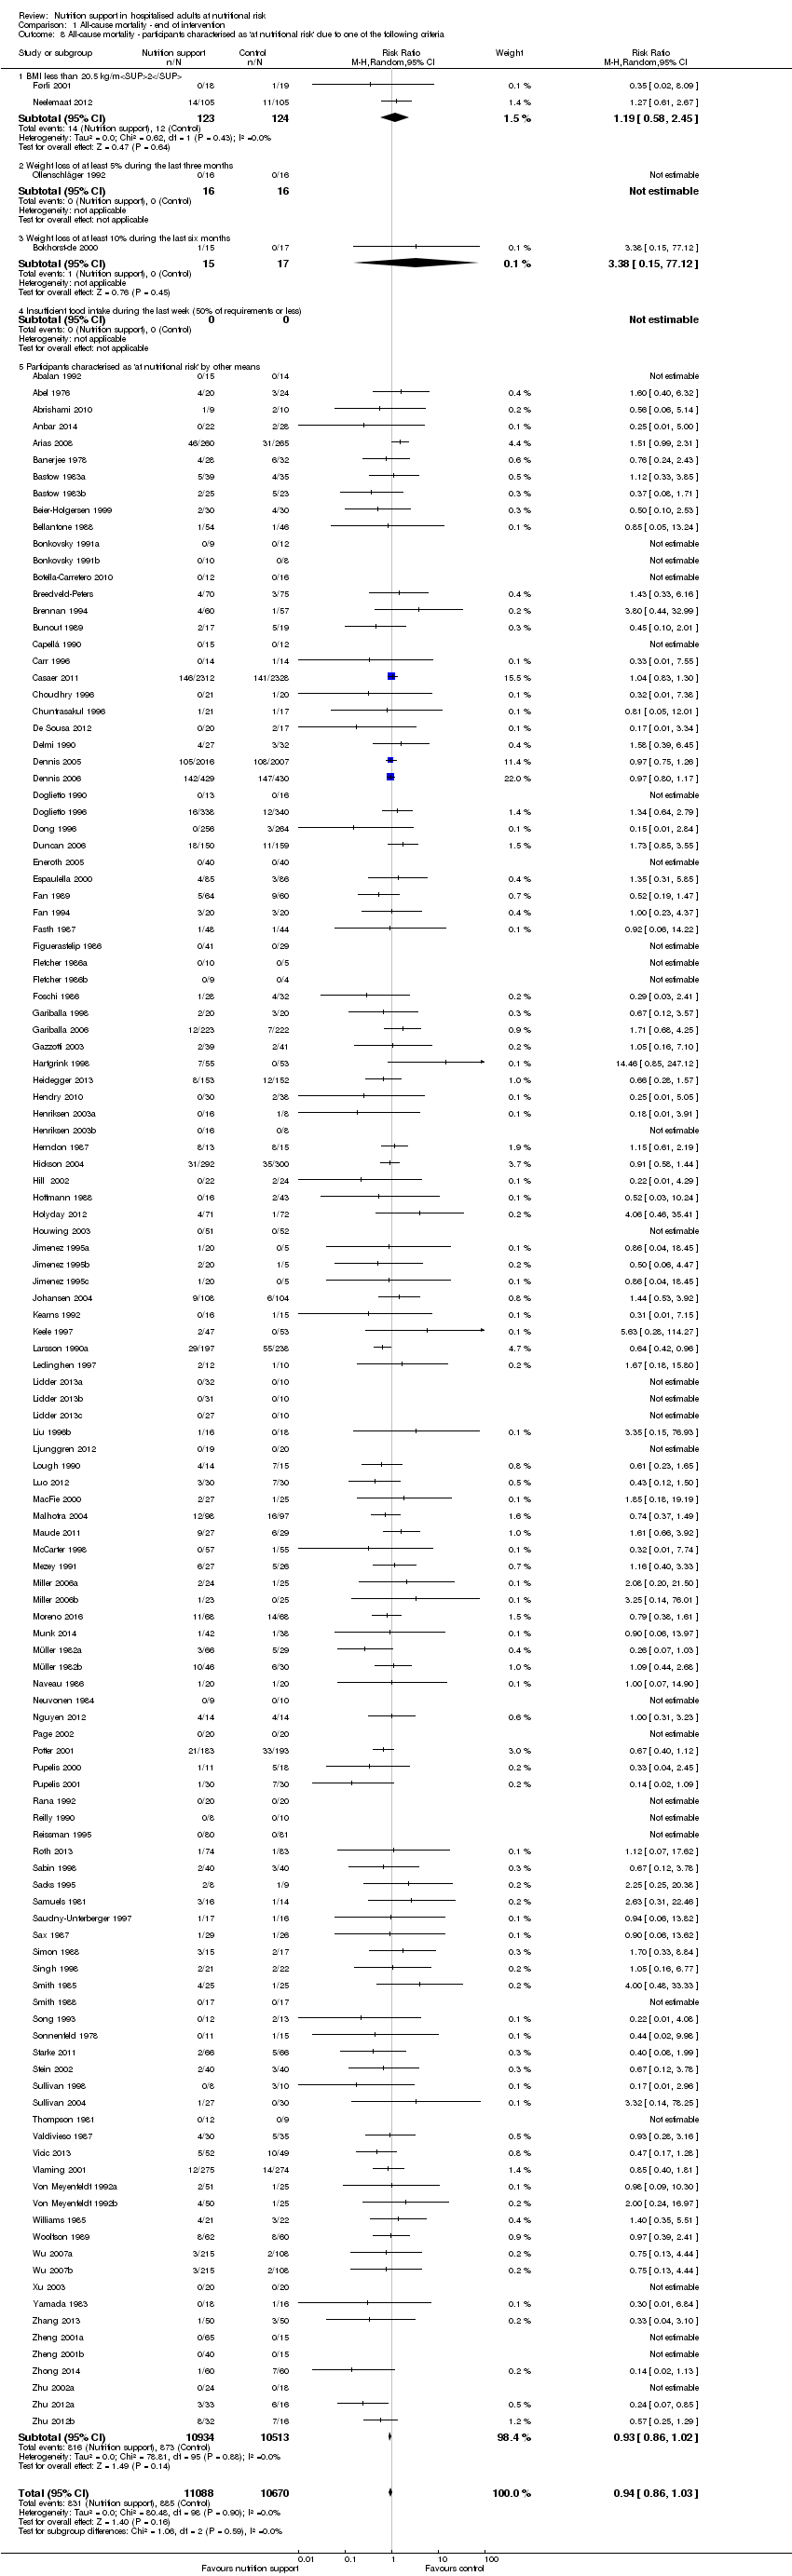
Comparison 1 All‐cause mortality ‐ end of intervention, Outcome 8 All‐cause mortality ‐ participants characterised as 'at nutritional risk' due to one of the following criteria.

Comparison 1 All‐cause mortality ‐ end of intervention, Outcome 9 All‐cause mortality ‐ participants characterised as 'at nutritional risk' due to biomarkers or anthropometrics.

Comparison 1 All‐cause mortality ‐ end of intervention, Outcome 10 All‐cause mortality ‐ randomisation year.
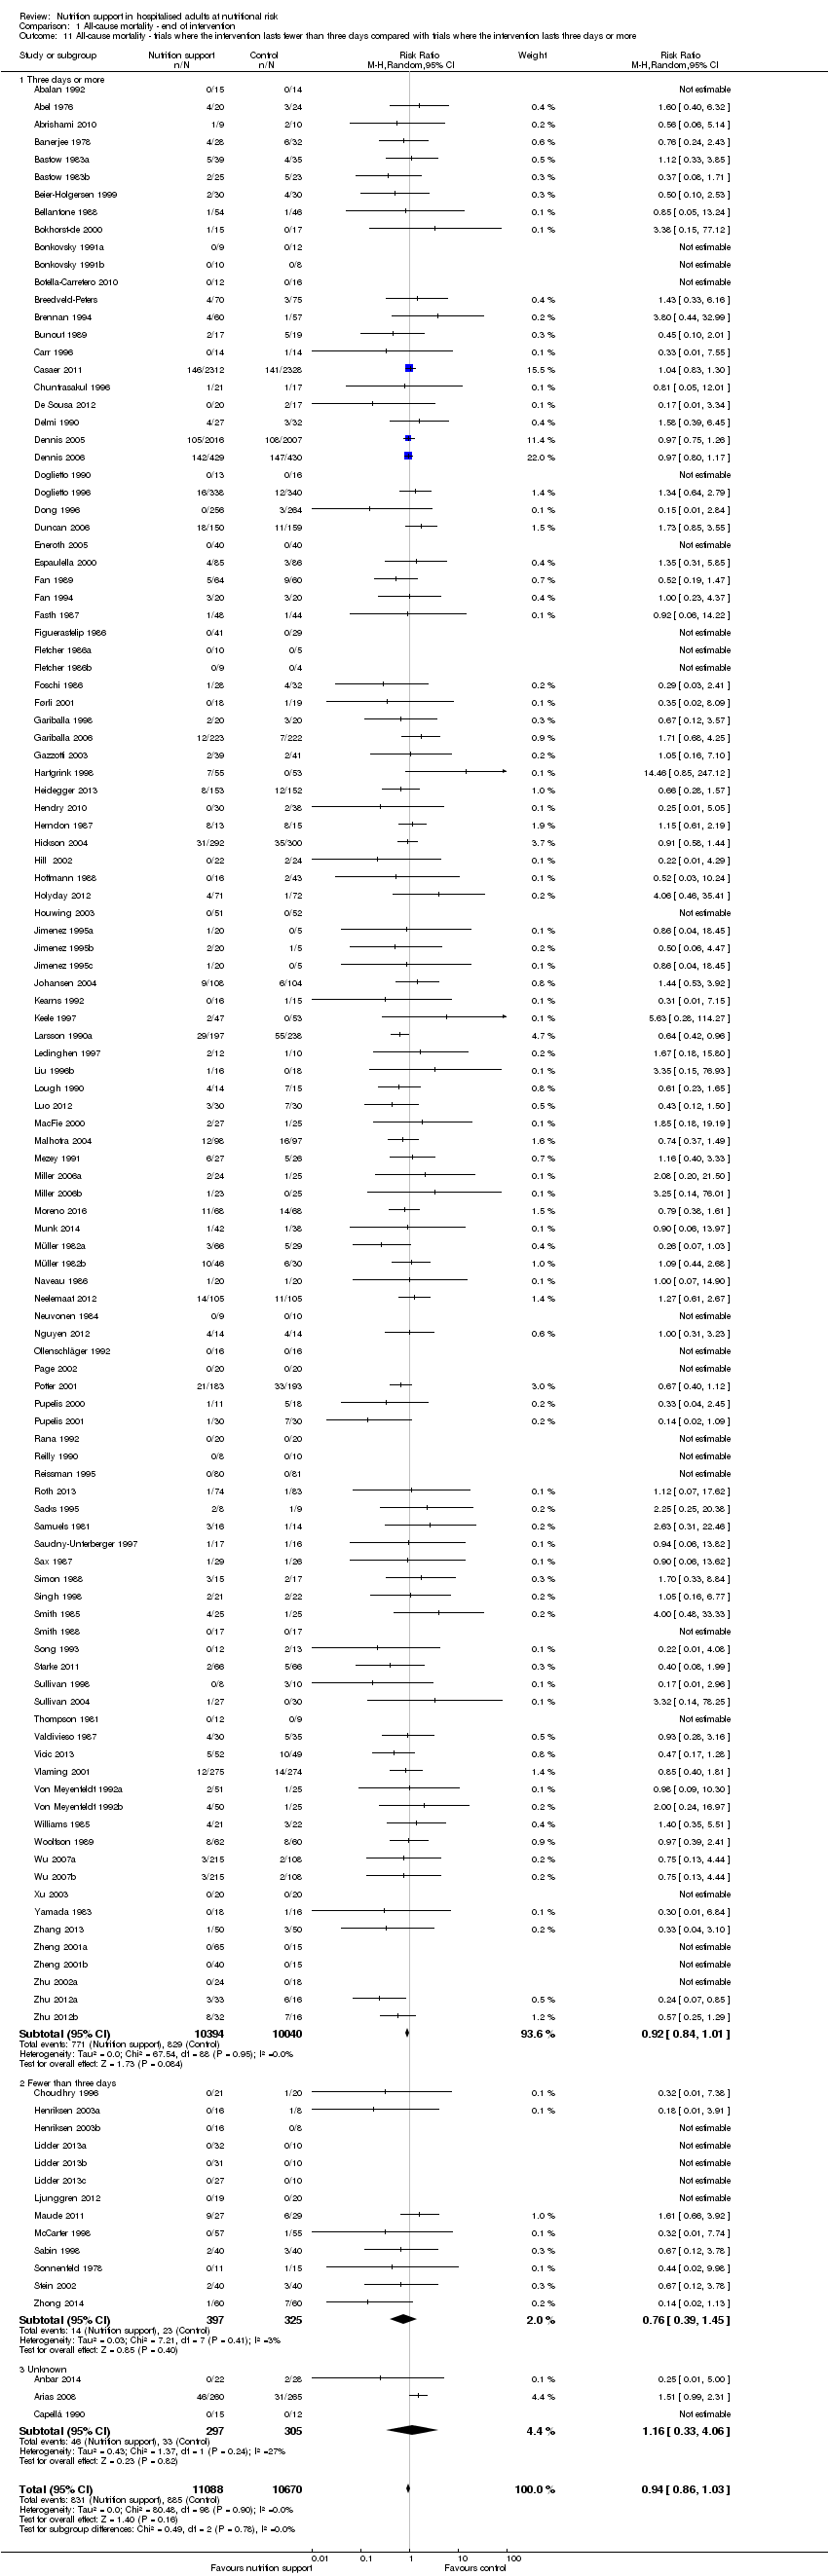
Comparison 1 All‐cause mortality ‐ end of intervention, Outcome 11 All‐cause mortality ‐ trials where the intervention lasts fewer than three days compared with trials where the intervention lasts three days or more.
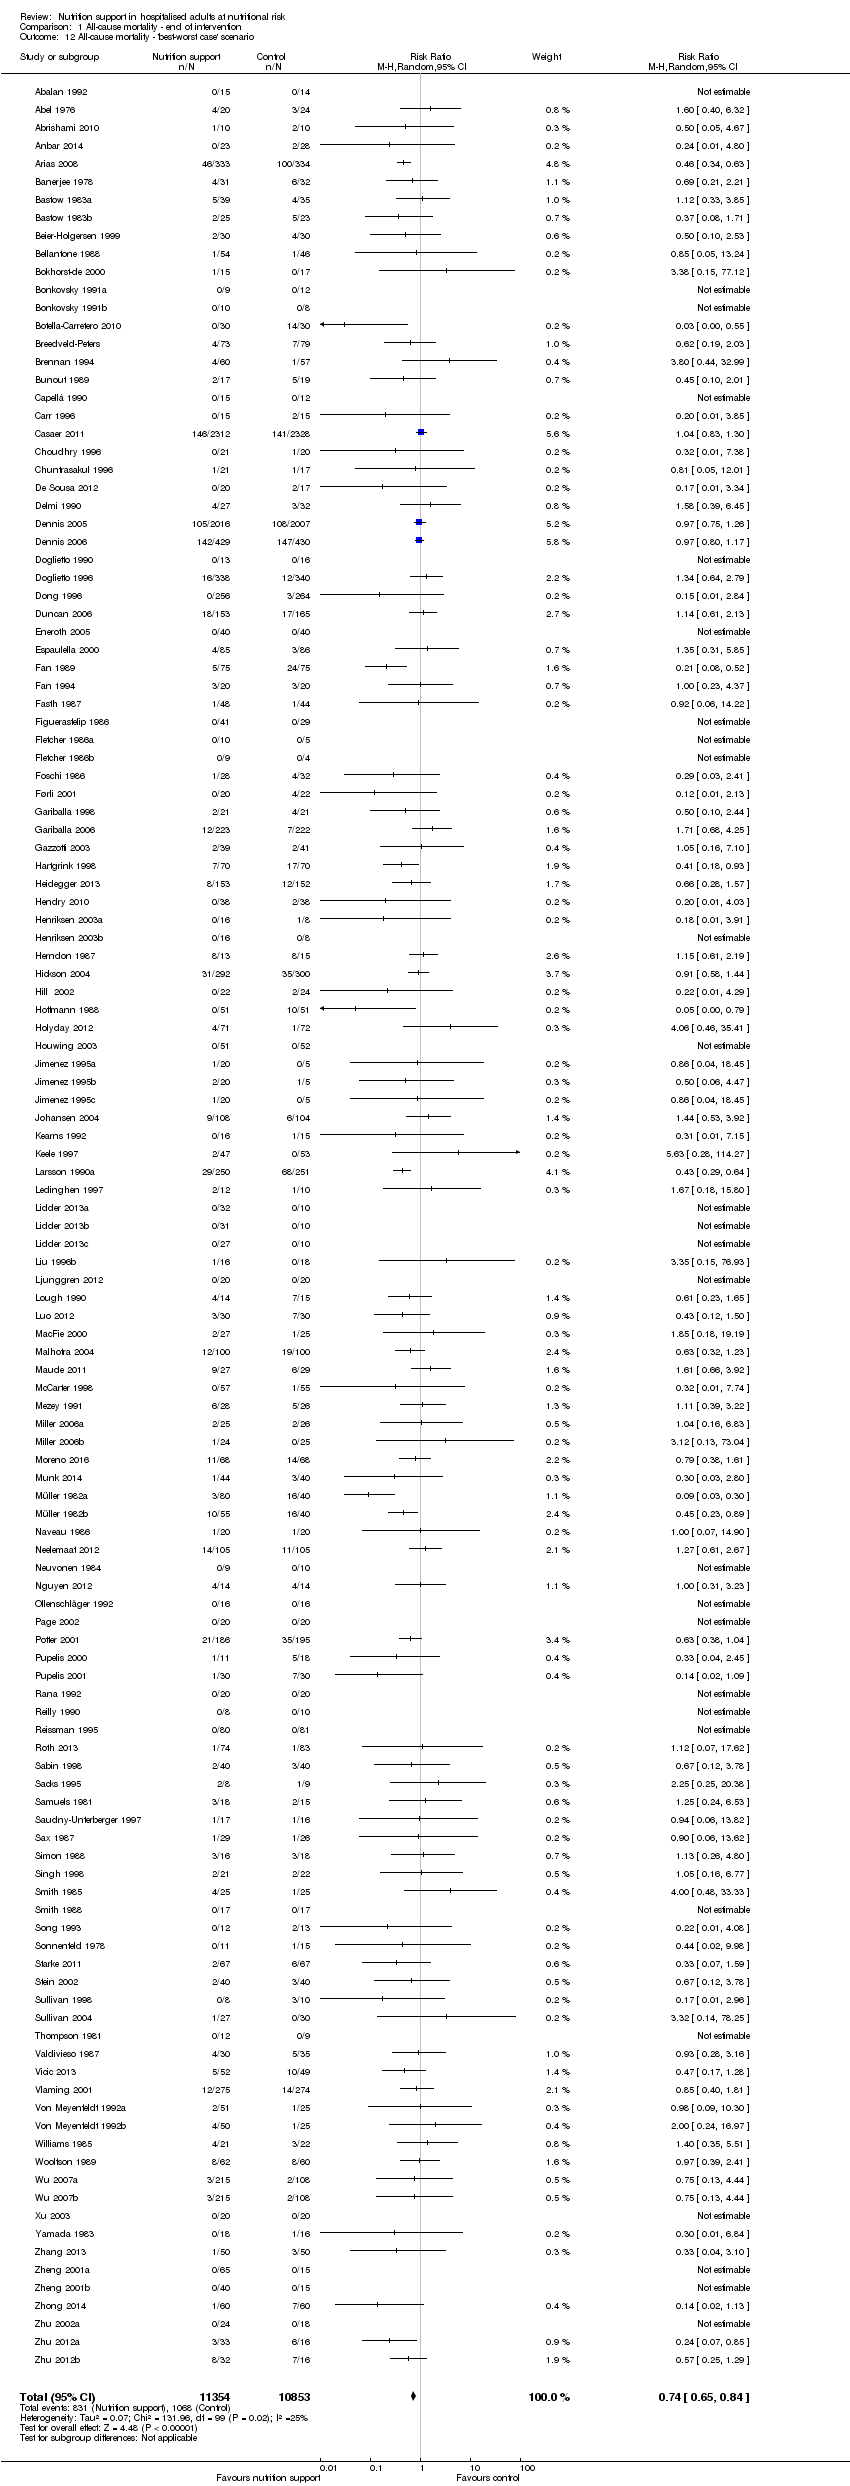
Comparison 1 All‐cause mortality ‐ end of intervention, Outcome 12 All‐cause mortality ‐ 'best‐worst case' scenario.

Comparison 1 All‐cause mortality ‐ end of intervention, Outcome 13 All‐cause mortality ‐ 'worst‐best case' scenario.

Comparison 1 All‐cause mortality ‐ end of intervention, Outcome 14 All‐cause mortality co‐interventions.

Comparison 2 All‐cause mortality ‐ maximum follow‐up, Outcome 1 All‐cause mortality ‐ overall.

Comparison 2 All‐cause mortality ‐ maximum follow‐up, Outcome 2 All‐cause mortality ‐ bias.

Comparison 2 All‐cause mortality ‐ maximum follow‐up, Outcome 3 All‐cause mortality ‐ mode of delivery.

Comparison 2 All‐cause mortality ‐ maximum follow‐up, Outcome 4 All‐cause mortality ‐ medical specialty.

Comparison 2 All‐cause mortality ‐ maximum follow‐up, Outcome 5 All‐cause mortality ‐ based on adequacy of the amount of calories.

Comparison 2 All‐cause mortality ‐ maximum follow‐up, Outcome 6 All‐cause mortality ‐ different screening tools.

Comparison 2 All‐cause mortality ‐ maximum follow‐up, Outcome 7 All‐cause mortality ‐ participants characterised as 'at nutritional risk' due to one of the following conditions.

Comparison 2 All‐cause mortality ‐ maximum follow‐up, Outcome 8 All‐cause mortality ‐ participants characterised as 'at nutritional risk' due to one of the following criteria.

Comparison 2 All‐cause mortality ‐ maximum follow‐up, Outcome 9 All‐cause mortality ‐ participants characterised as 'at nutritional risk' due to biomarkers or anthropometrics.

Comparison 2 All‐cause mortality ‐ maximum follow‐up, Outcome 10 All‐cause mortality ‐ randomisation year.
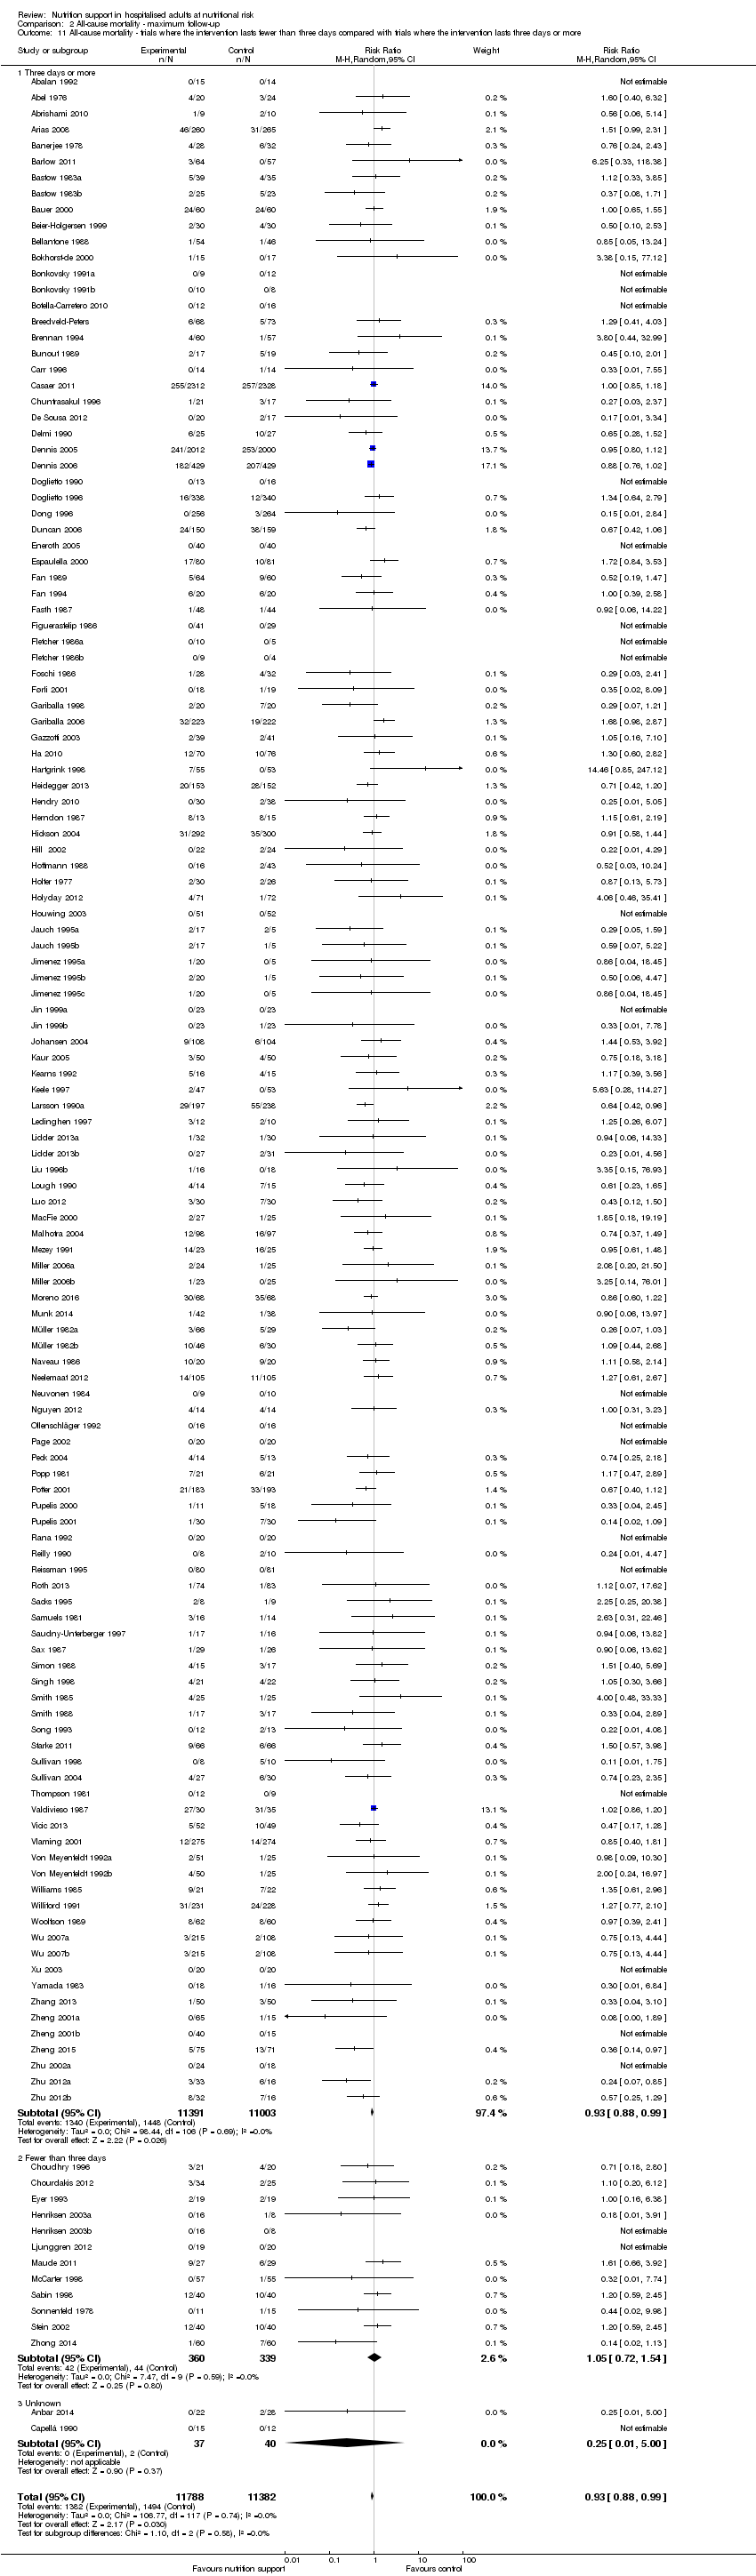
Comparison 2 All‐cause mortality ‐ maximum follow‐up, Outcome 11 All‐cause mortality ‐ trials where the intervention lasts fewer than three days compared with trials where the intervention lasts three days or more.

Comparison 2 All‐cause mortality ‐ maximum follow‐up, Outcome 12 All‐cause mortality ‐ 'best‐worst case' scenario.

Comparison 2 All‐cause mortality ‐ maximum follow‐up, Outcome 13 All‐cause mortality ‐ 'worst‐best case' scenario.

Comparison 2 All‐cause mortality ‐ maximum follow‐up, Outcome 14 All‐cause mortality co‐interventions.
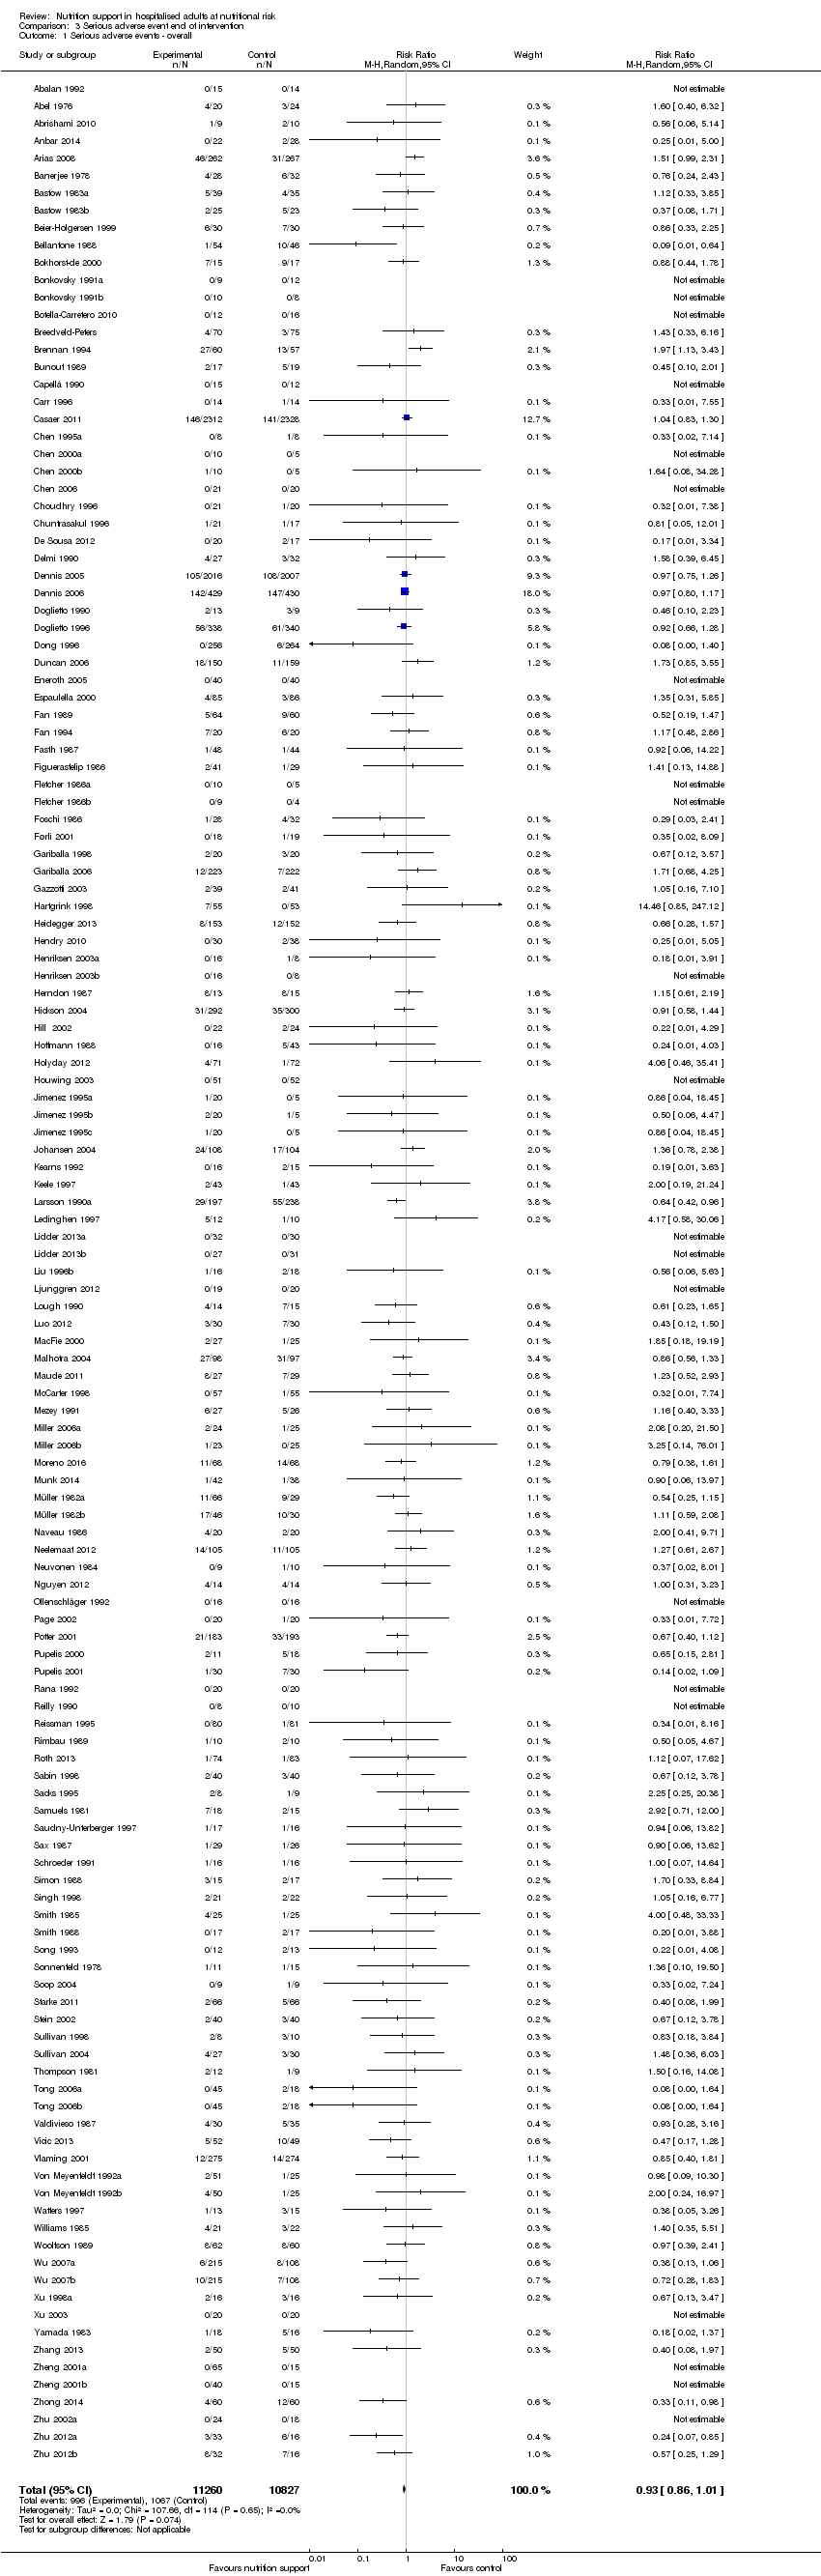
Comparison 3 Serious adverse event end of intervention, Outcome 1 Serious adverse events ‐ overall.

Comparison 3 Serious adverse event end of intervention, Outcome 2 Serious adverse events ‐ bias.

Comparison 3 Serious adverse event end of intervention, Outcome 3 Serious adverse events ‐ mode of delivery.

Comparison 3 Serious adverse event end of intervention, Outcome 4 Serious adverse events ‐ by medical specialty.

Comparison 3 Serious adverse event end of intervention, Outcome 5 Serious adverse events ‐ based on adequacy of the amount of calories.

Comparison 3 Serious adverse event end of intervention, Outcome 6 Serious adverse events ‐ different screening tools.

Comparison 3 Serious adverse event end of intervention, Outcome 7 Serious adverse events ‐ participants characterised as 'at nutritional risk' due to one of the following conditions.
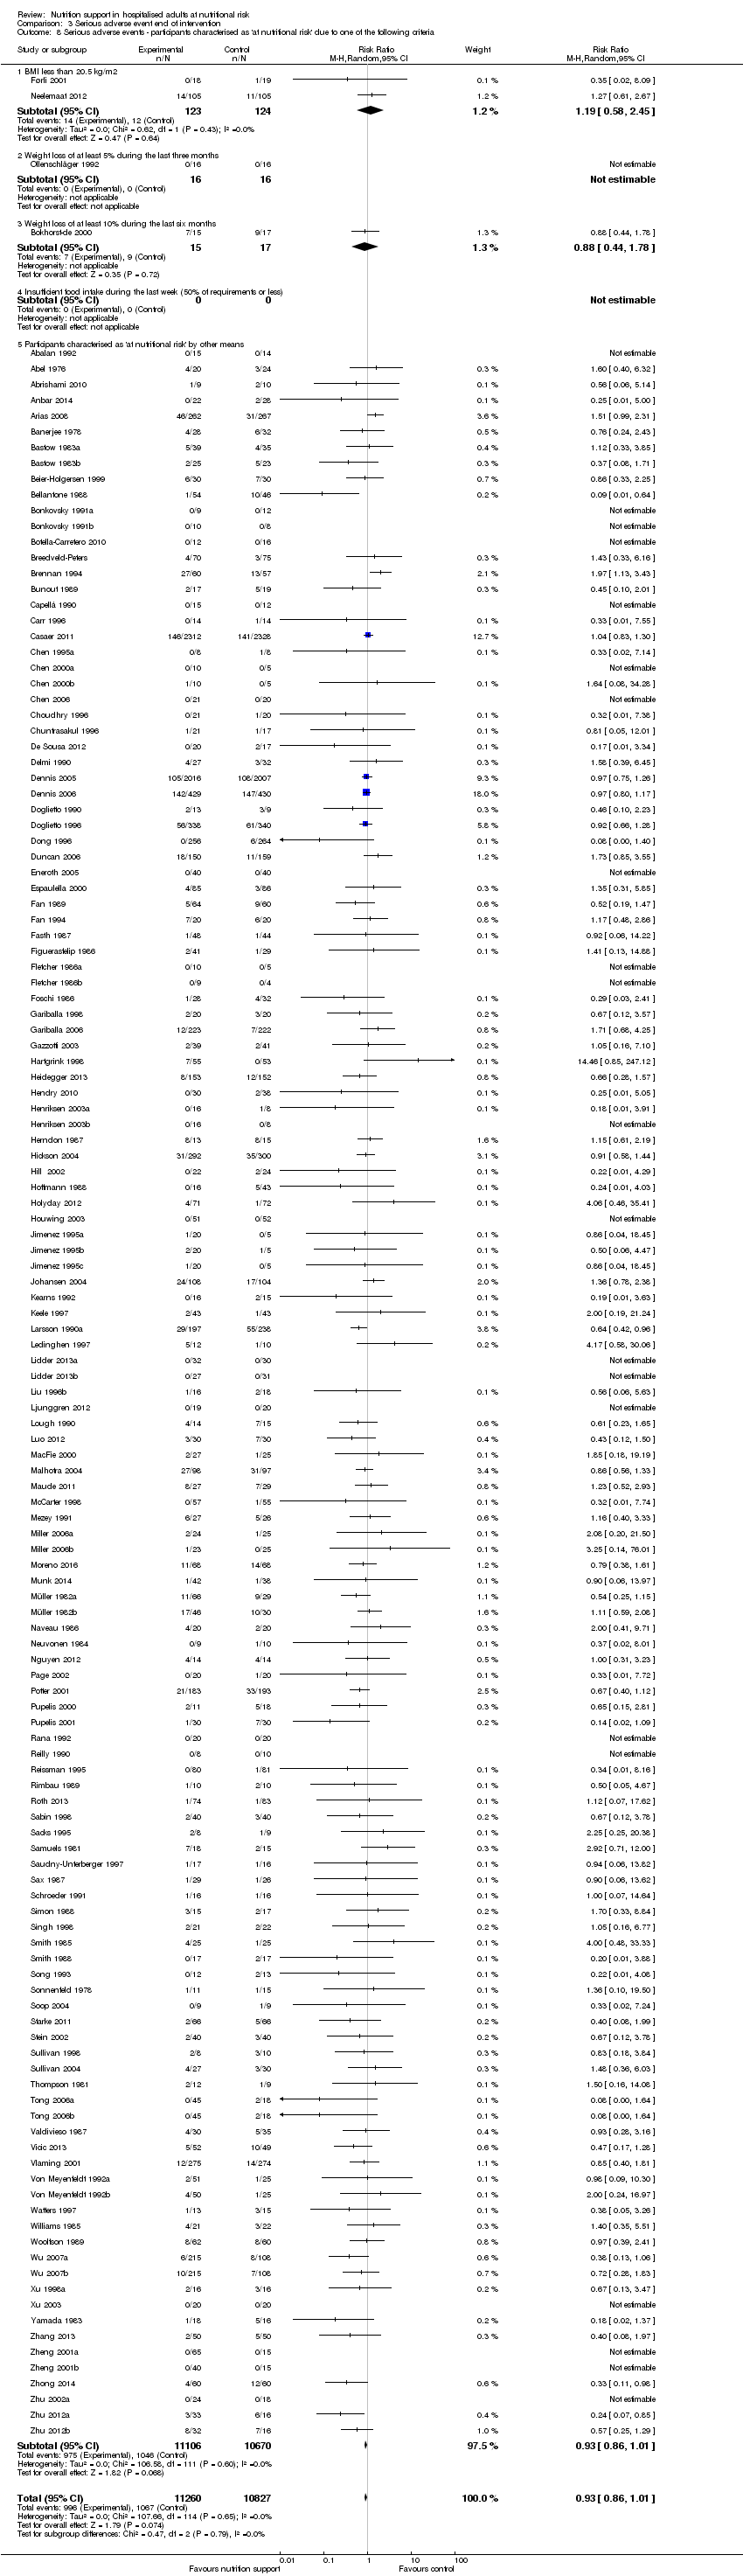
Comparison 3 Serious adverse event end of intervention, Outcome 8 Serious adverse events ‐ participants characterised as 'at nutritional risk' due to one of the following criteria.

Comparison 3 Serious adverse event end of intervention, Outcome 9 Serious adverse events ‐ participants characterised as 'at nutritional risk' due to biomarkers or anthropometrics.
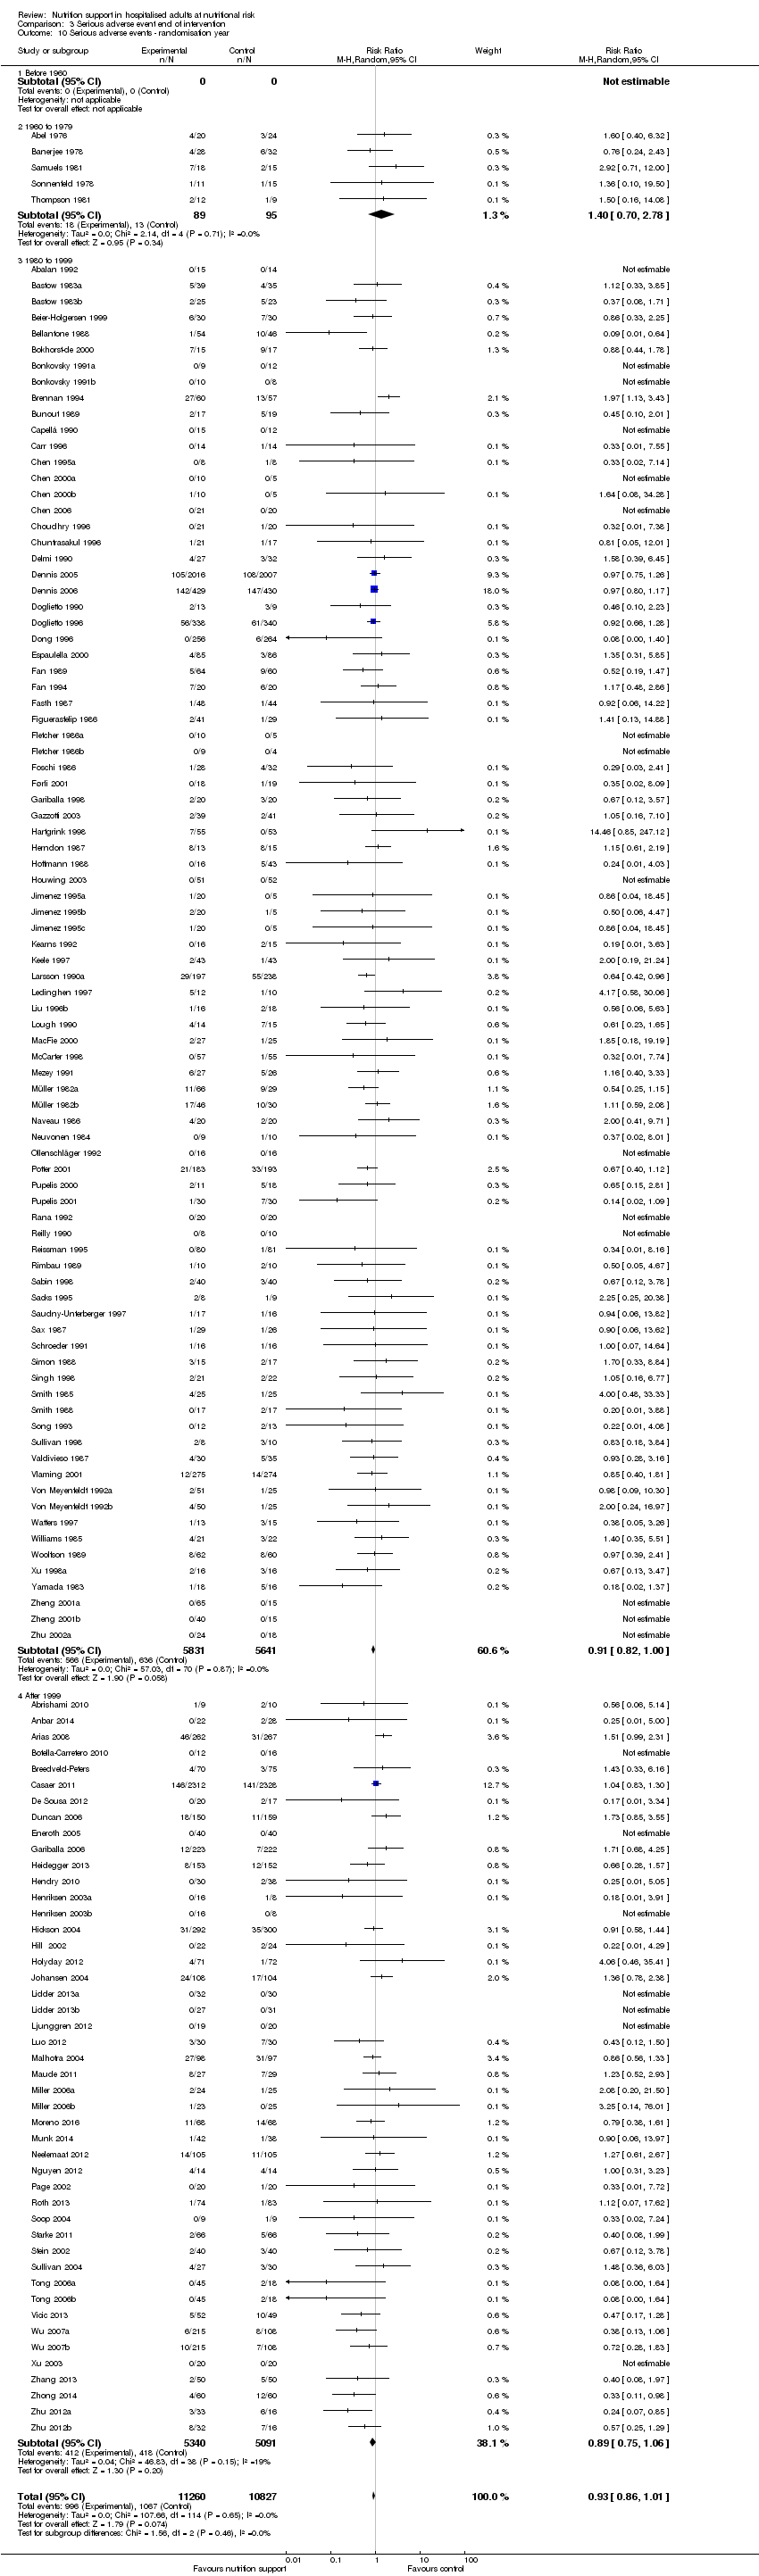
Comparison 3 Serious adverse event end of intervention, Outcome 10 Serious adverse events ‐ randomisation year.

Comparison 3 Serious adverse event end of intervention, Outcome 11 Serious adverse events ‐ trials where the intervention lasts fewer than three days compared with trials where the intervention lasts three days or more.

Comparison 3 Serious adverse event end of intervention, Outcome 12 Serious adverse events ‐ 'best‐worst case' scenario.

Comparison 3 Serious adverse event end of intervention, Outcome 13 Serious adverse events ‐ 'worst‐best case' scenario.

Comparison 3 Serious adverse event end of intervention, Outcome 14 Serious adverse events co‐interventions.
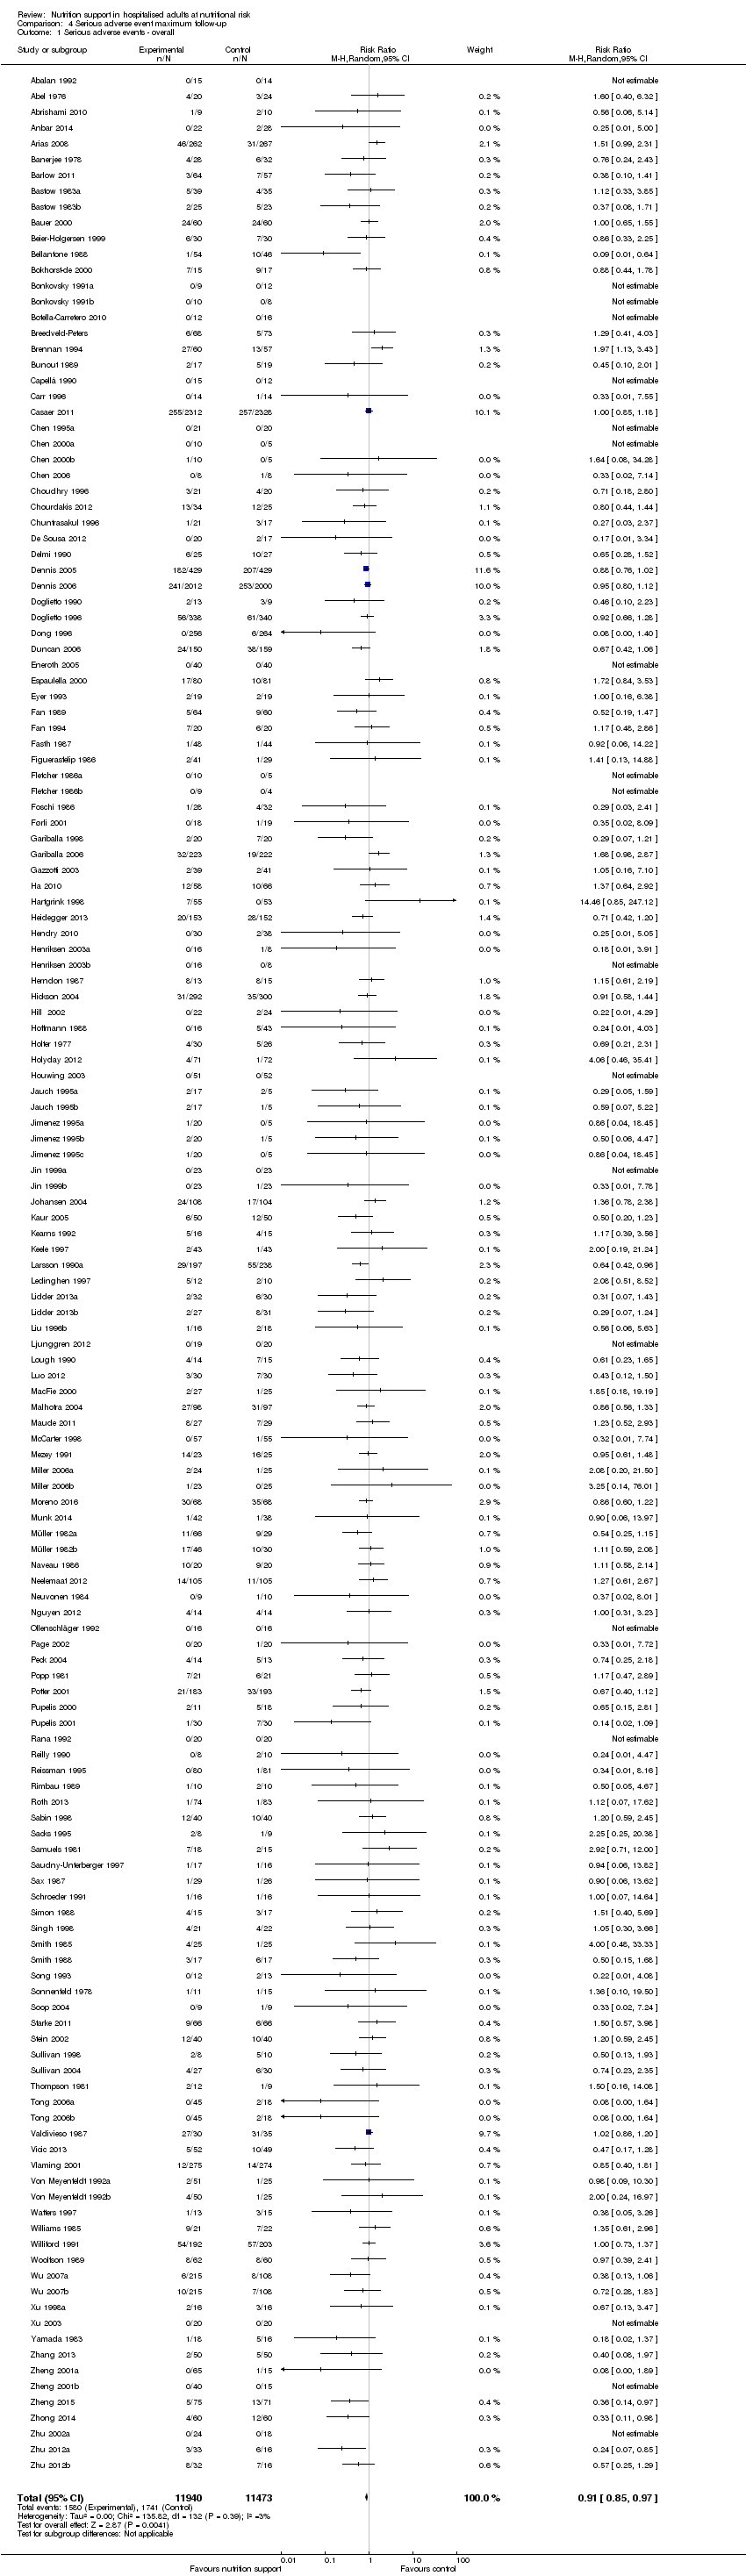
Comparison 4 Serious adverse event maximum follow‐up, Outcome 1 Serious adverse events ‐ overall.

Comparison 4 Serious adverse event maximum follow‐up, Outcome 2 Serious adverse events ‐ bias.

Comparison 4 Serious adverse event maximum follow‐up, Outcome 3 Serious adverse events ‐ mode of delivery.

Comparison 4 Serious adverse event maximum follow‐up, Outcome 4 Serious adverse events ‐ by medical specialty.

Comparison 4 Serious adverse event maximum follow‐up, Outcome 5 Serious adverse events ‐ based on adequacy of the amount of calories.

Comparison 4 Serious adverse event maximum follow‐up, Outcome 6 Serious adverse events ‐ different screening tools.
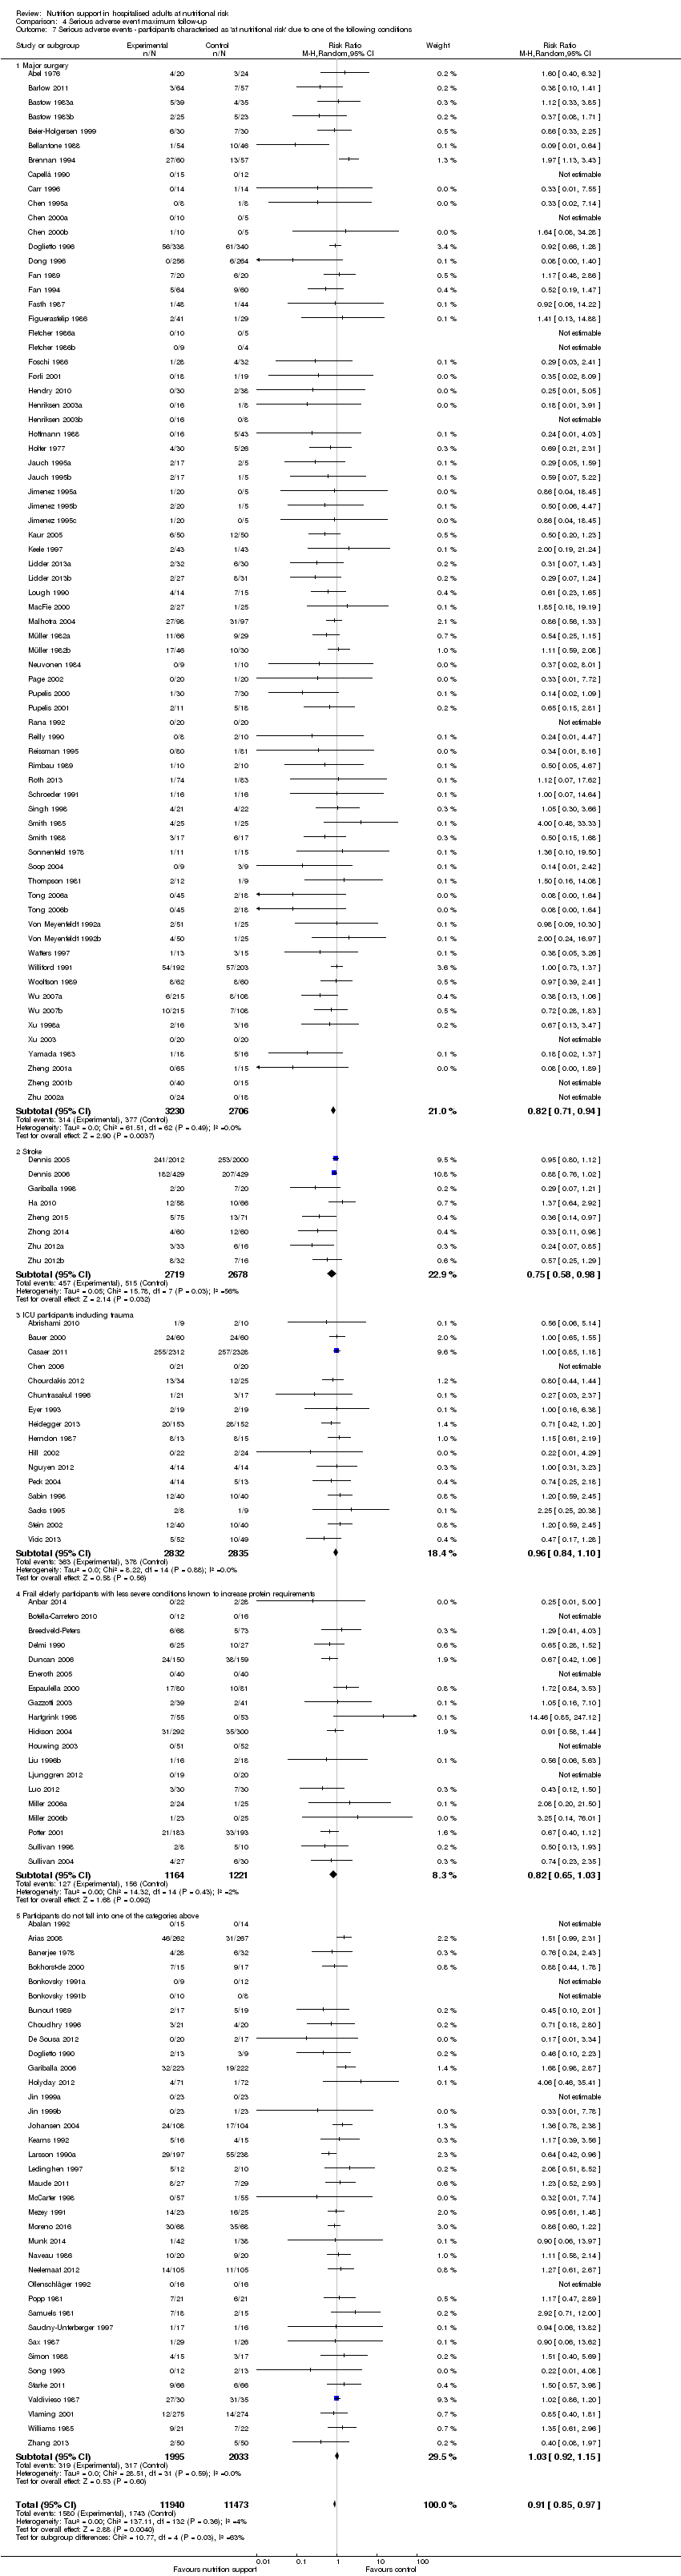
Comparison 4 Serious adverse event maximum follow‐up, Outcome 7 Serious adverse events ‐ participants characterised as 'at nutritional risk' due to one of the following conditions.
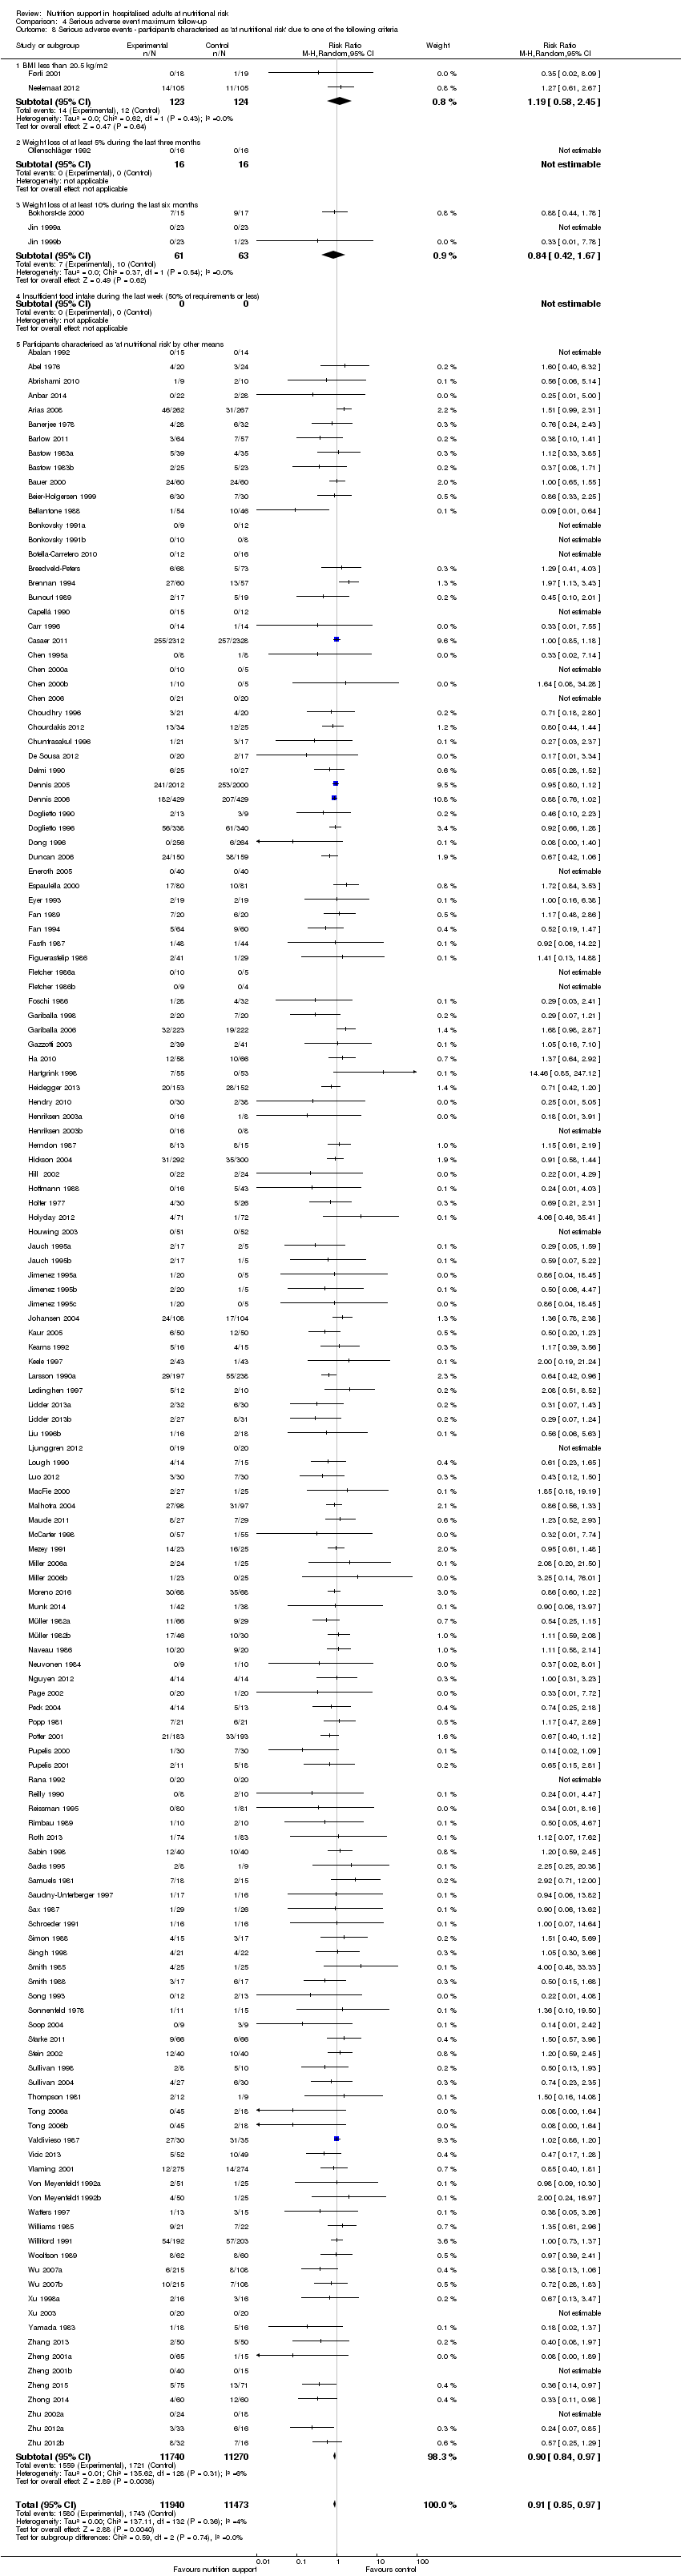
Comparison 4 Serious adverse event maximum follow‐up, Outcome 8 Serious adverse events ‐ participants characterised as 'at nutritional risk' due to one of the following criteria.

Comparison 4 Serious adverse event maximum follow‐up, Outcome 9 Serious adverse events ‐ participants characterised as 'at nutritional risk' due to biomarkers or anthropometrics.

Comparison 4 Serious adverse event maximum follow‐up, Outcome 10 Serious adverse events ‐ randomisation year.

Comparison 4 Serious adverse event maximum follow‐up, Outcome 11 Serious adverse events ‐ trials where the intervention lasts fewer than three days compared with trials where the intervention lasts three days or more.

Comparison 4 Serious adverse event maximum follow‐up, Outcome 12 Serious adverse events ‐ 'best‐worst case' scenario.

Comparison 4 Serious adverse event maximum follow‐up, Outcome 13 Serious adverse events ‐ 'worst‐best case' scenario.

Comparison 4 Serious adverse event maximum follow‐up, Outcome 14 Serious adverse events co‐interventions.

Comparison 4 Serious adverse event maximum follow‐up, Outcome 15 Serious adverse events ‐ 'best‐worse case' scenario (enteral nutrition).

Comparison 4 Serious adverse event maximum follow‐up, Outcome 16 Serious adverse events ‐ 'worst‐best case' scenario (enteral nutrition).

Comparison 5 Quality of life (SF36 ‐ Physical performance) ‐ end of intervention, Outcome 1 Quality of life ‐ overall.

Comparison 6 Quality of life (SF36 ‐ Physical performance) ‐ maximum follow‐up, Outcome 1 Quality of life ‐ overall.

Comparison 7 Quality of life (SF36 ‐ Mental performance ‐ end of intervention, Outcome 1 Quality of life ‐ overall.

Comparison 8 Quality of life (SF36 ‐ Mental performance) ‐ maximum follow‐up, Outcome 1 Quality of life ‐ overall.

Comparison 9 Quality of life (EuroQoL) ‐ maximum follow‐up, Outcome 1 Quality of life ‐ overall.

Comparison 10 Pneumonia, Outcome 1 Pneumonia.
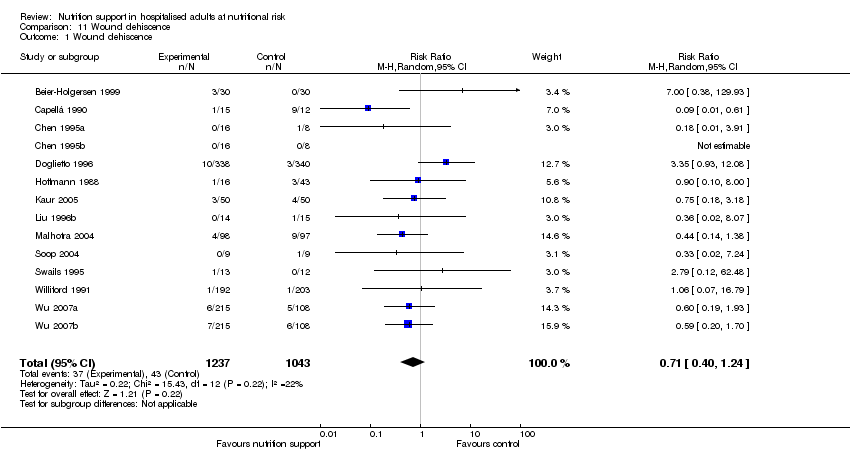
Comparison 11 Wound dehiscence, Outcome 1 Wound dehiscence.

Comparison 12 Renal failure, Outcome 1 Renal failure.
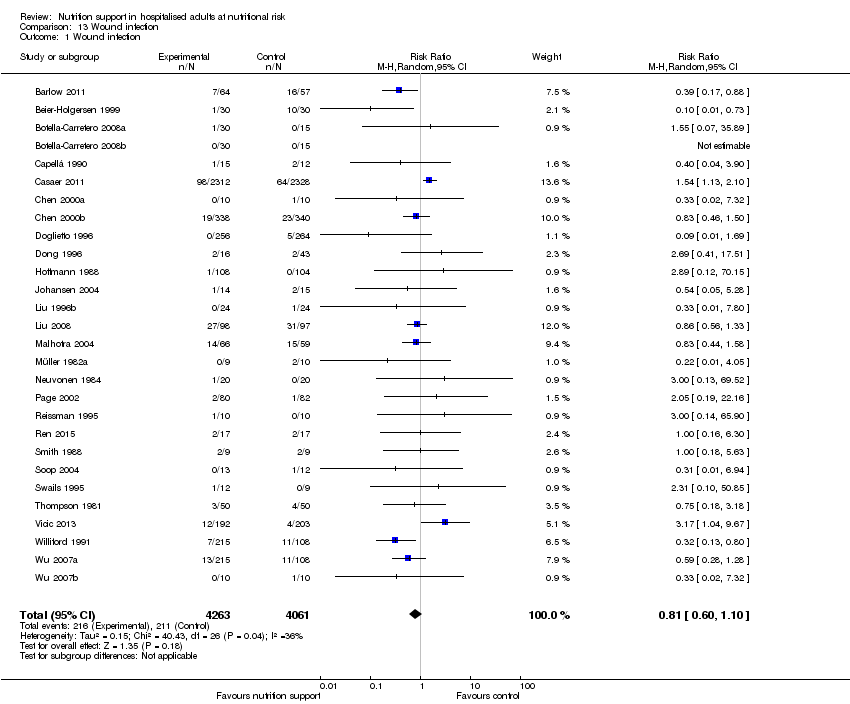
Comparison 13 Wound infection, Outcome 1 Wound infection.

Comparison 14 Heart failure, Outcome 1 Heart failure.

Comparison 15 Clearly adequate and screening tool, Outcome 1 AcM ‐ EoI.

Comparison 15 Clearly adequate and screening tool, Outcome 2 AcM ‐ MF.

Comparison 15 Clearly adequate and screening tool, Outcome 3 SaE ‐ EoI.

Comparison 15 Clearly adequate and screening tool, Outcome 4 SaE ‐ MF.

Comparison 16 Clearly adequate + (NRS component/at risk due to condition), Outcome 1 AcM ‐ EoI.

Comparison 16 Clearly adequate + (NRS component/at risk due to condition), Outcome 2 AcM ‐ MF.

Comparison 16 Clearly adequate + (NRS component/at risk due to condition), Outcome 3 SaE ‐ EoI.
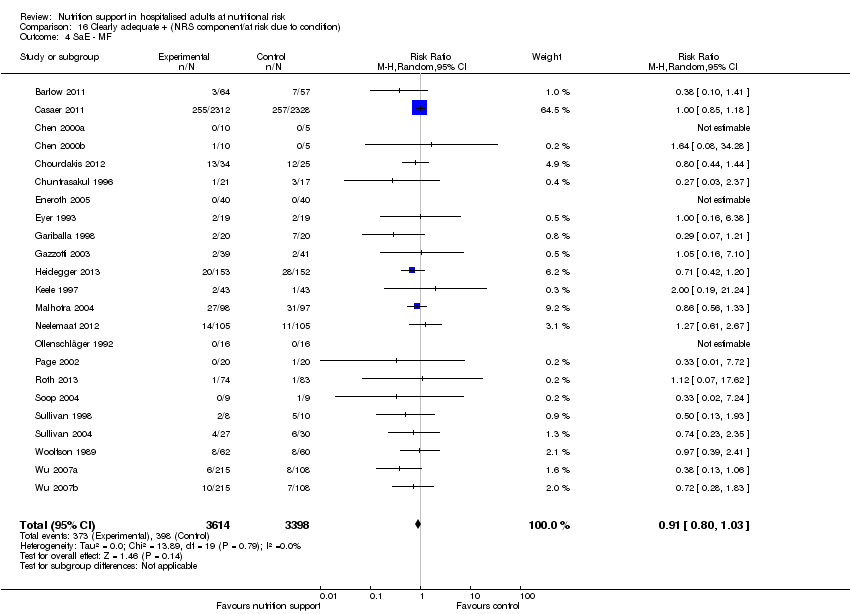
Comparison 16 Clearly adequate + (NRS component/at risk due to condition), Outcome 4 SaE ‐ MF.

Comparison 17 Oral ‐ All cause mortality ‐ end of intervention, Outcome 1 All‐cause mortality ‐ overall.

Comparison 17 Oral ‐ All cause mortality ‐ end of intervention, Outcome 2 All‐cause mortality ‐ bias.

Comparison 17 Oral ‐ All cause mortality ‐ end of intervention, Outcome 3 All‐cause mortality ‐ medical speciality.

Comparison 17 Oral ‐ All cause mortality ‐ end of intervention, Outcome 4 All‐cause mortality ‐ based on adequacy of the amount of calories.

Comparison 17 Oral ‐ All cause mortality ‐ end of intervention, Outcome 5 All‐cause mortality ‐ different screening tools.

Comparison 17 Oral ‐ All cause mortality ‐ end of intervention, Outcome 6 All‐cause mortality ‐ participants characterised as 'at nutritional risk' due to one of the following conditions.

Comparison 17 Oral ‐ All cause mortality ‐ end of intervention, Outcome 7 All‐cause mortality ‐ participants characterised as 'at nutritional risk' due to one of the following criteria.

Comparison 17 Oral ‐ All cause mortality ‐ end of intervention, Outcome 8 All‐cause mortality ‐ participants characterised as 'at nutritional risk' due to biomarkers or anthropometrics.

Comparison 17 Oral ‐ All cause mortality ‐ end of intervention, Outcome 9 All‐cause mortality ‐ randomisation year.
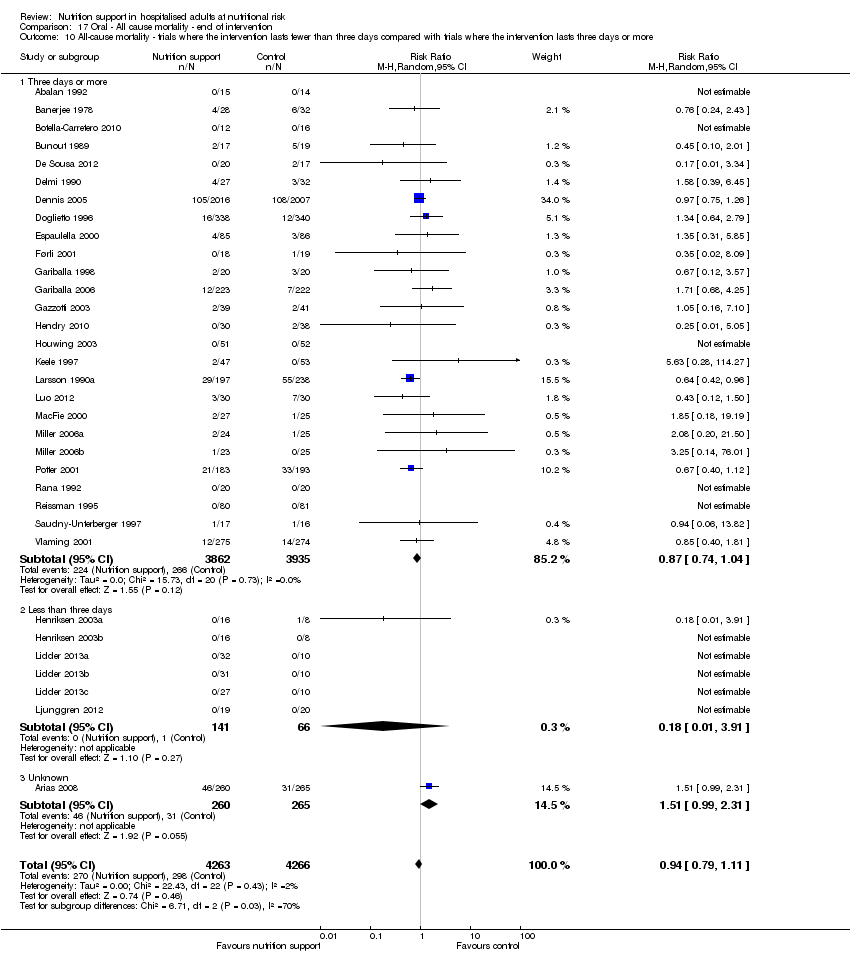
Comparison 17 Oral ‐ All cause mortality ‐ end of intervention, Outcome 10 All‐cause mortality ‐ trials where the intervention lasts fewer than three days compared with trials where the intervention lasts three days or more.

Comparison 17 Oral ‐ All cause mortality ‐ end of intervention, Outcome 11 All‐cause mortality ‐ 'best‐worst case' scenario.

Comparison 17 Oral ‐ All cause mortality ‐ end of intervention, Outcome 12 All‐cause mortality ‐ 'worst‐best case' scenario.
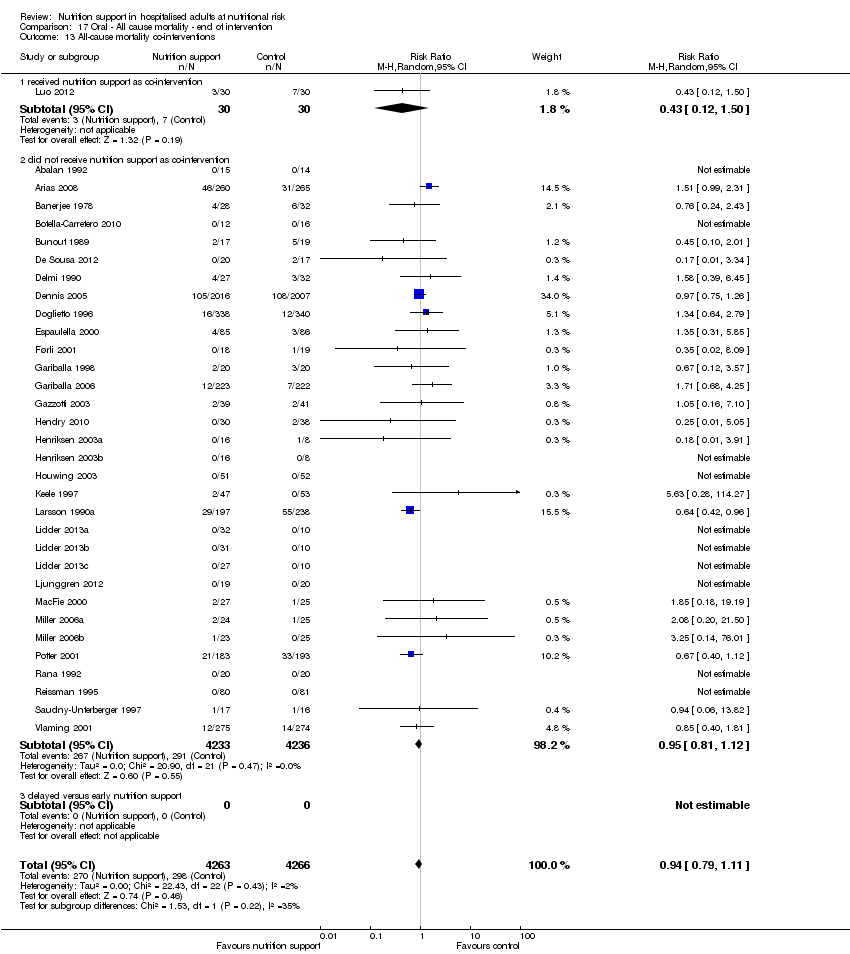
Comparison 17 Oral ‐ All cause mortality ‐ end of intervention, Outcome 13 All‐cause mortality co‐interventions.

Comparison 18 Oral ‐ All cause mortality ‐ maximum follow‐up, Outcome 1 All‐cause mortality ‐ overall.

Comparison 18 Oral ‐ All cause mortality ‐ maximum follow‐up, Outcome 2 All‐cause mortality ‐ bias.

Comparison 18 Oral ‐ All cause mortality ‐ maximum follow‐up, Outcome 3 All‐cause mortality ‐ medical speciality.
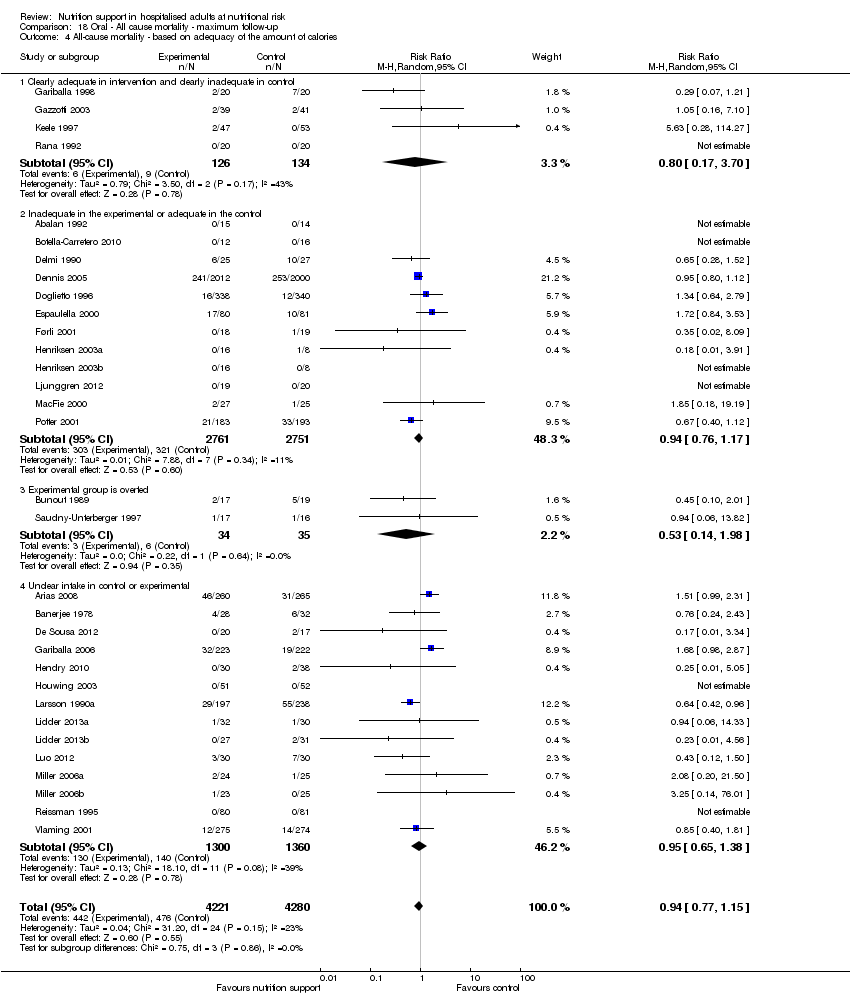
Comparison 18 Oral ‐ All cause mortality ‐ maximum follow‐up, Outcome 4 All‐cause mortality ‐ based on adequacy of the amount of calories.
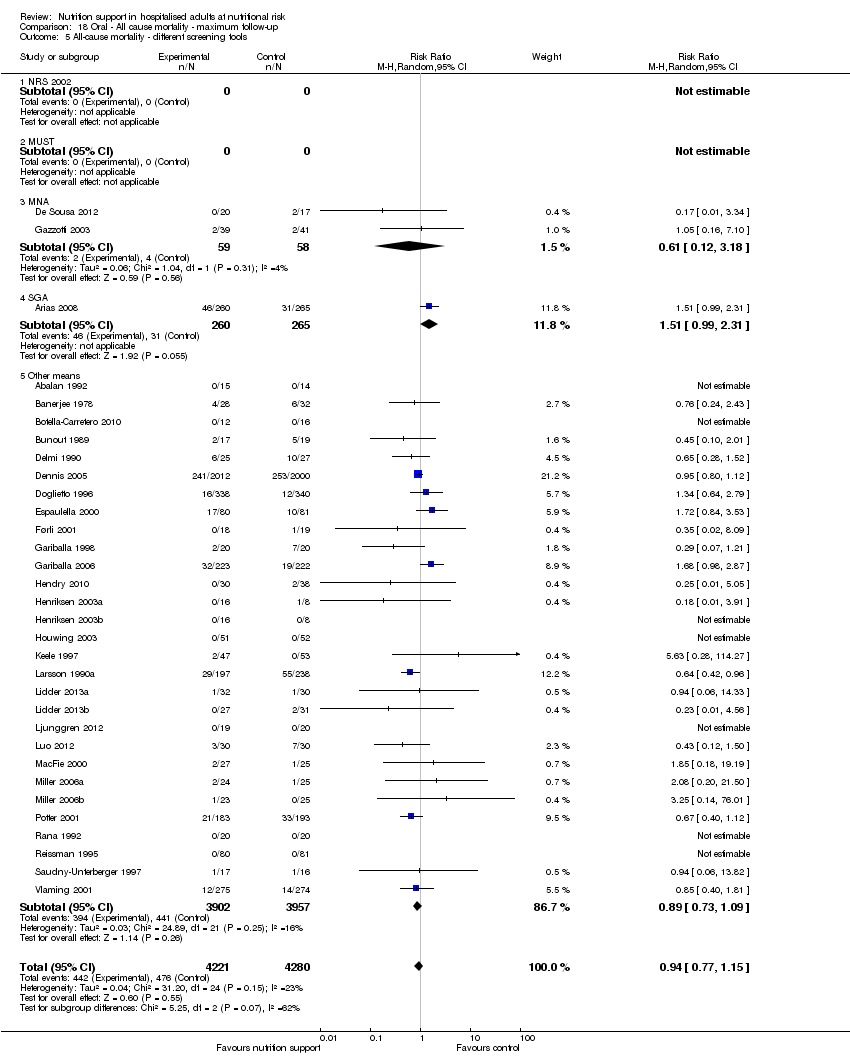
Comparison 18 Oral ‐ All cause mortality ‐ maximum follow‐up, Outcome 5 All‐cause mortality ‐ different screening tools.
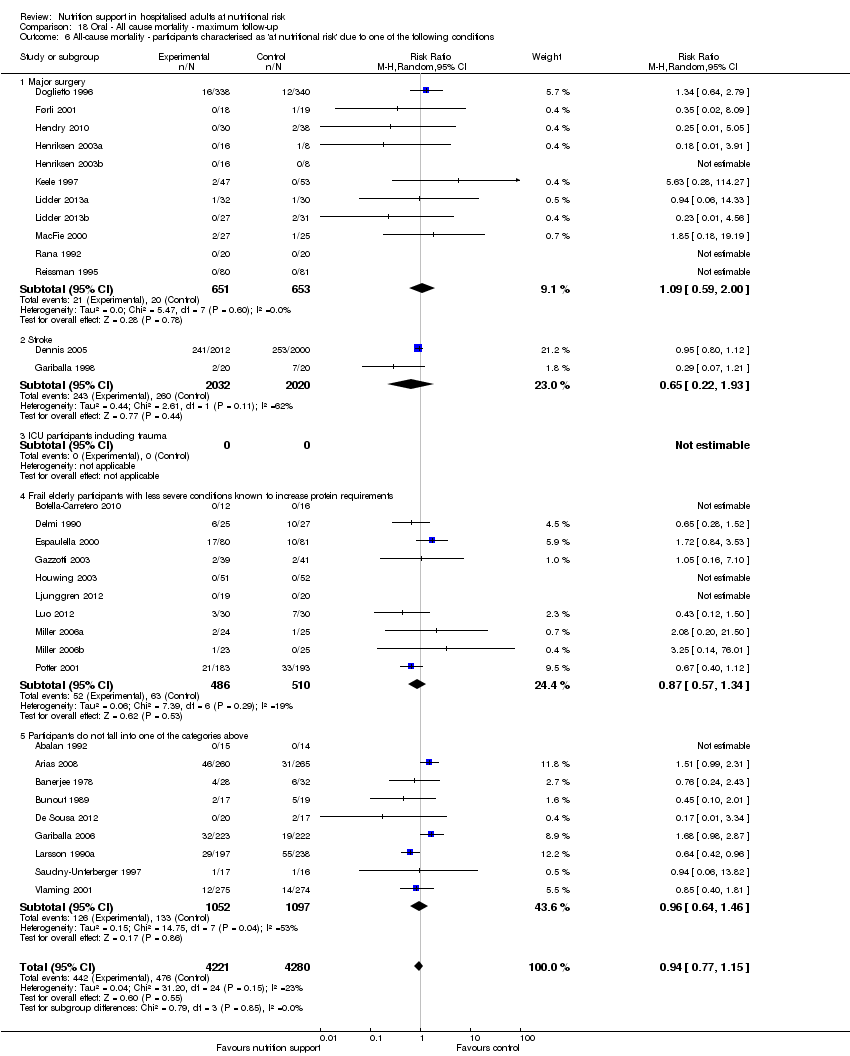
Comparison 18 Oral ‐ All cause mortality ‐ maximum follow‐up, Outcome 6 All‐cause mortality ‐ participants characterised as 'at nutritional risk' due to one of the following conditions.
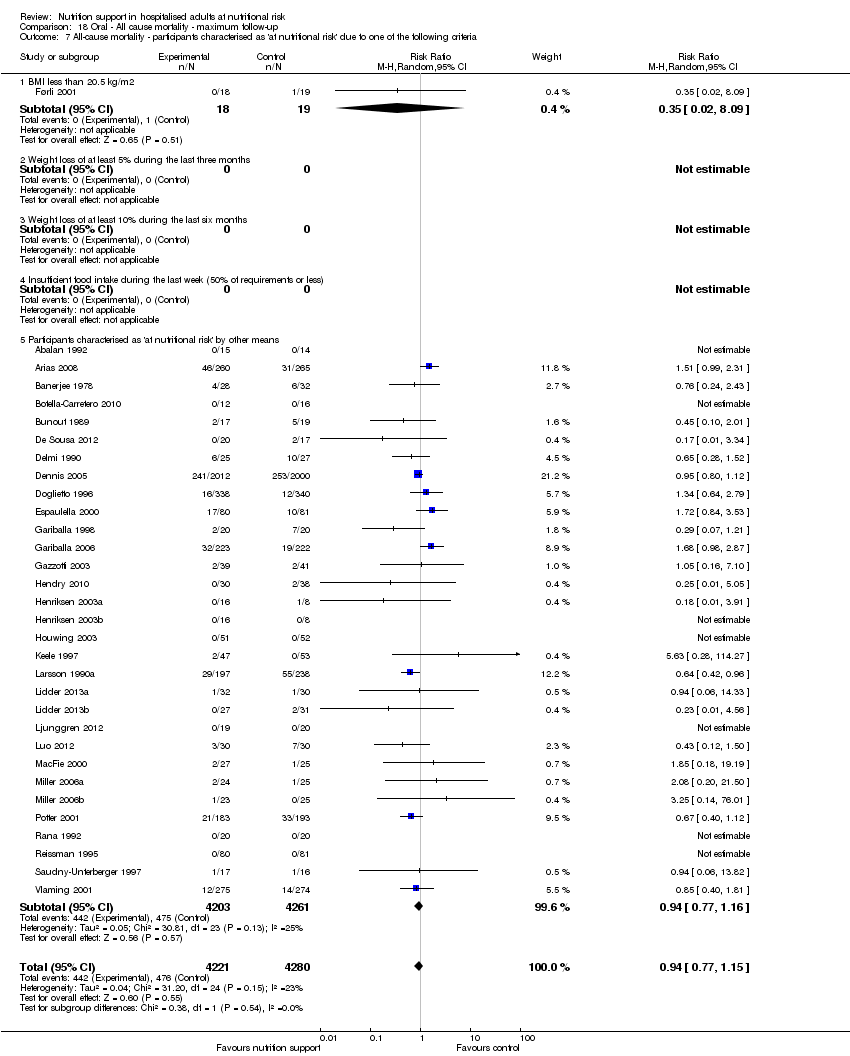
Comparison 18 Oral ‐ All cause mortality ‐ maximum follow‐up, Outcome 7 All‐cause mortality ‐ participants characterised as 'at nutritional risk' due to one of the following criteria.

Comparison 18 Oral ‐ All cause mortality ‐ maximum follow‐up, Outcome 8 All‐cause mortality ‐ participants characterised as 'at nutritional risk' due to biomarkers or anthropometrics.

Comparison 18 Oral ‐ All cause mortality ‐ maximum follow‐up, Outcome 9 All‐cause mortality ‐ randomisation year.

Comparison 18 Oral ‐ All cause mortality ‐ maximum follow‐up, Outcome 10 All‐cause mortality ‐ trials where the intervention lasts fewer than three days compared with trials where the intervention lasts three days or more.

Comparison 18 Oral ‐ All cause mortality ‐ maximum follow‐up, Outcome 11 All‐cause mortality ‐ 'best‐worst case' scenario.
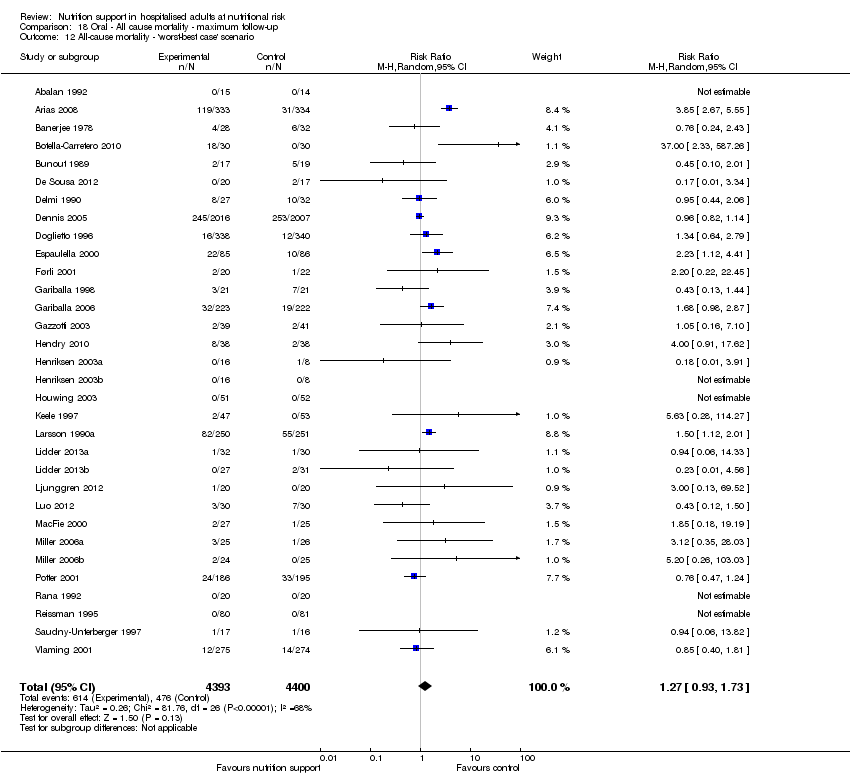
Comparison 18 Oral ‐ All cause mortality ‐ maximum follow‐up, Outcome 12 All‐cause mortality ‐ 'worst‐best case' scenario.

Comparison 18 Oral ‐ All cause mortality ‐ maximum follow‐up, Outcome 13 All‐cause mortality co‐interventions.

Comparison 19 Oral ‐ Serious adverse event end of intervention, Outcome 1 Serious adverse events ‐ overall.

Comparison 19 Oral ‐ Serious adverse event end of intervention, Outcome 2 Serious adverse events ‐ bias.
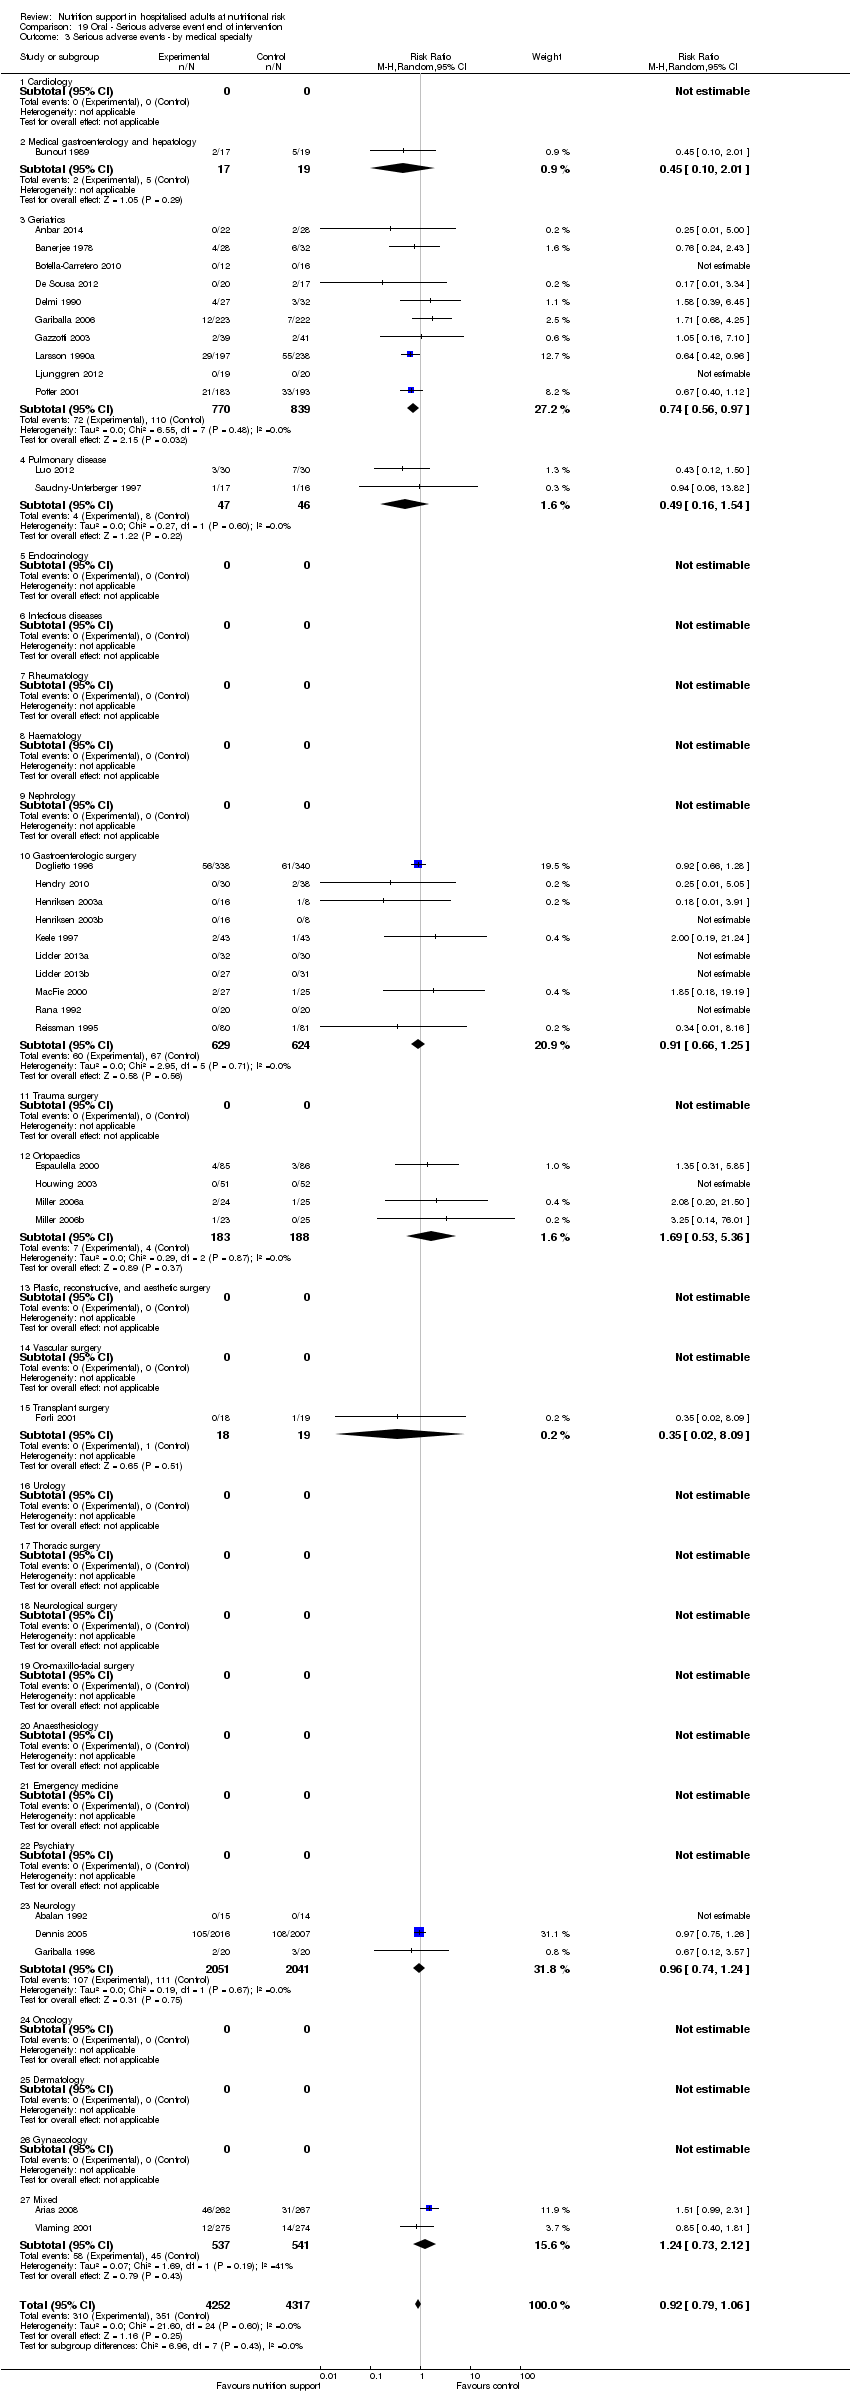
Comparison 19 Oral ‐ Serious adverse event end of intervention, Outcome 3 Serious adverse events ‐ by medical specialty.
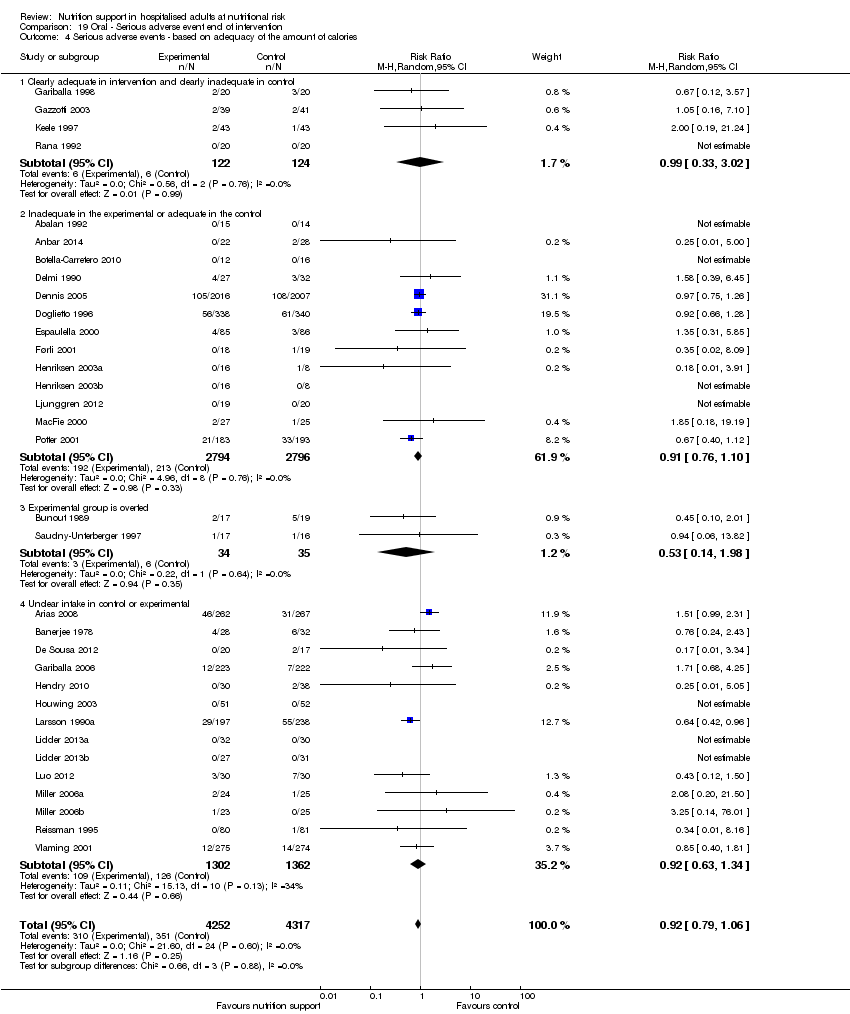
Comparison 19 Oral ‐ Serious adverse event end of intervention, Outcome 4 Serious adverse events ‐ based on adequacy of the amount of calories.
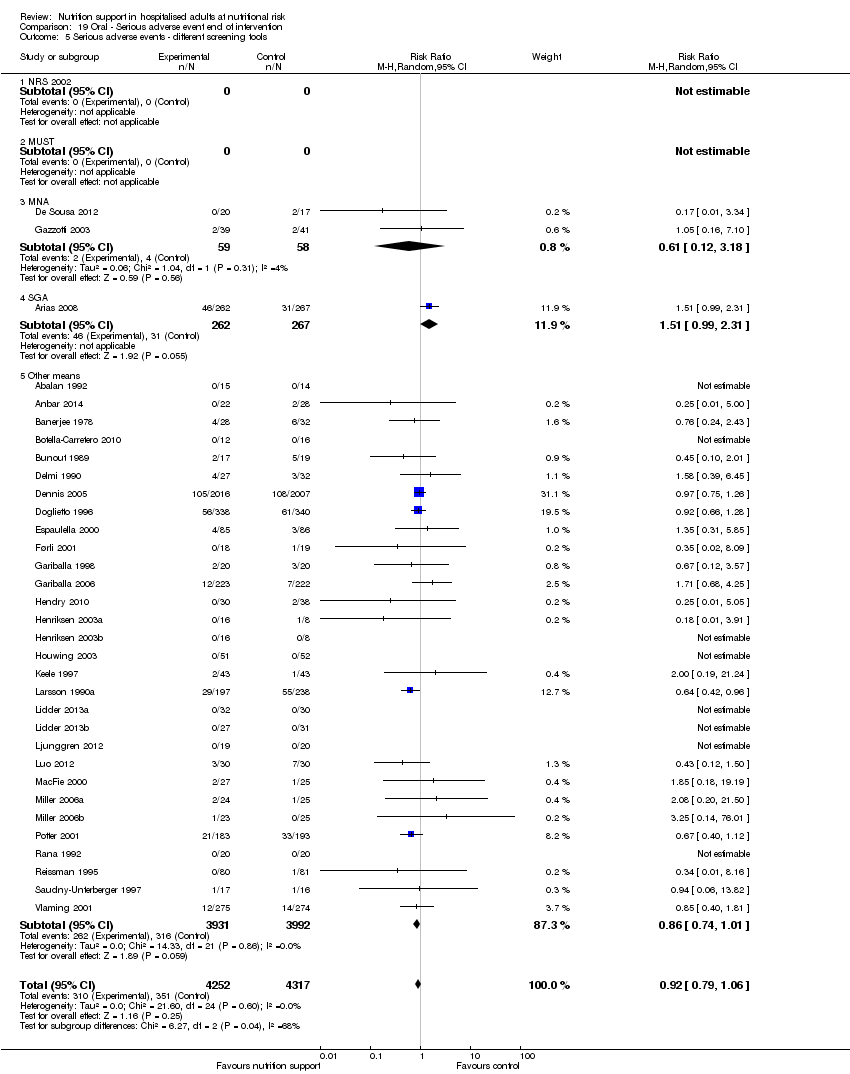
Comparison 19 Oral ‐ Serious adverse event end of intervention, Outcome 5 Serious adverse events ‐ different screening tools.

Comparison 19 Oral ‐ Serious adverse event end of intervention, Outcome 6 Serious adverse events ‐ participants characterised as 'at nutritional risk' due to one of the following conditions.
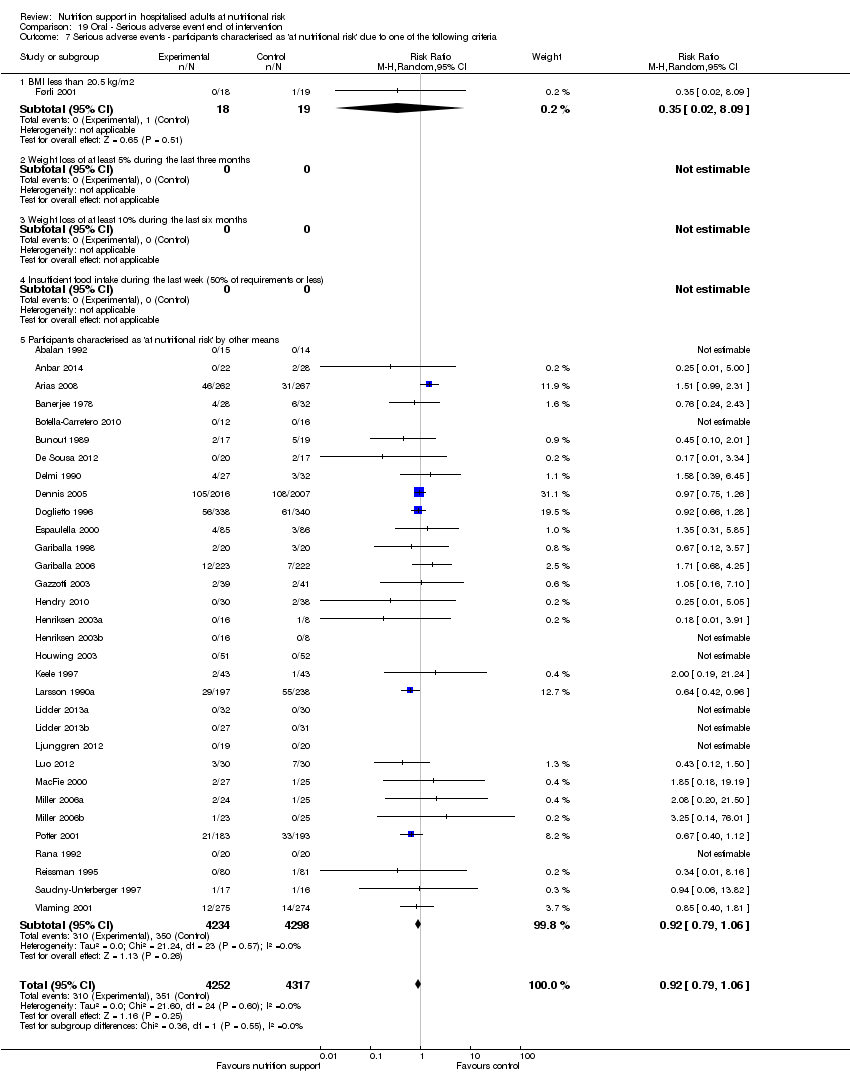
Comparison 19 Oral ‐ Serious adverse event end of intervention, Outcome 7 Serious adverse events ‐ participants characterised as 'at nutritional risk' due to one of the following criteria.
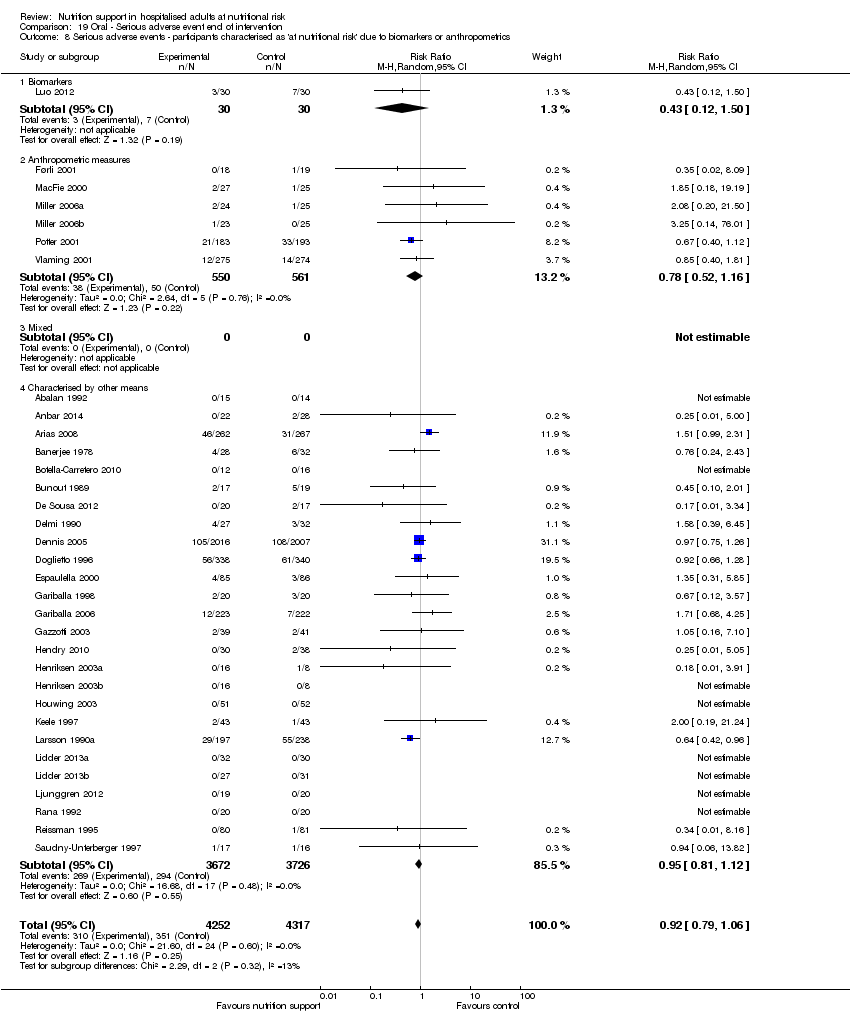
Comparison 19 Oral ‐ Serious adverse event end of intervention, Outcome 8 Serious adverse events ‐ participants characterised as 'at nutritional risk' due to biomarkers or anthropometrics.

Comparison 19 Oral ‐ Serious adverse event end of intervention, Outcome 9 Serious adverse events ‐ randomisation year.

Comparison 19 Oral ‐ Serious adverse event end of intervention, Outcome 10 Serious adverse events ‐ trials where the intervention lasts fewer than three days compared with trials where the intervention lasts three days or more.

Comparison 19 Oral ‐ Serious adverse event end of intervention, Outcome 11 Serious adverse events ‐ 'best‐worst case' scenario.

Comparison 19 Oral ‐ Serious adverse event end of intervention, Outcome 12 Serious adverse events ‐ 'worst‐best case' scenario.
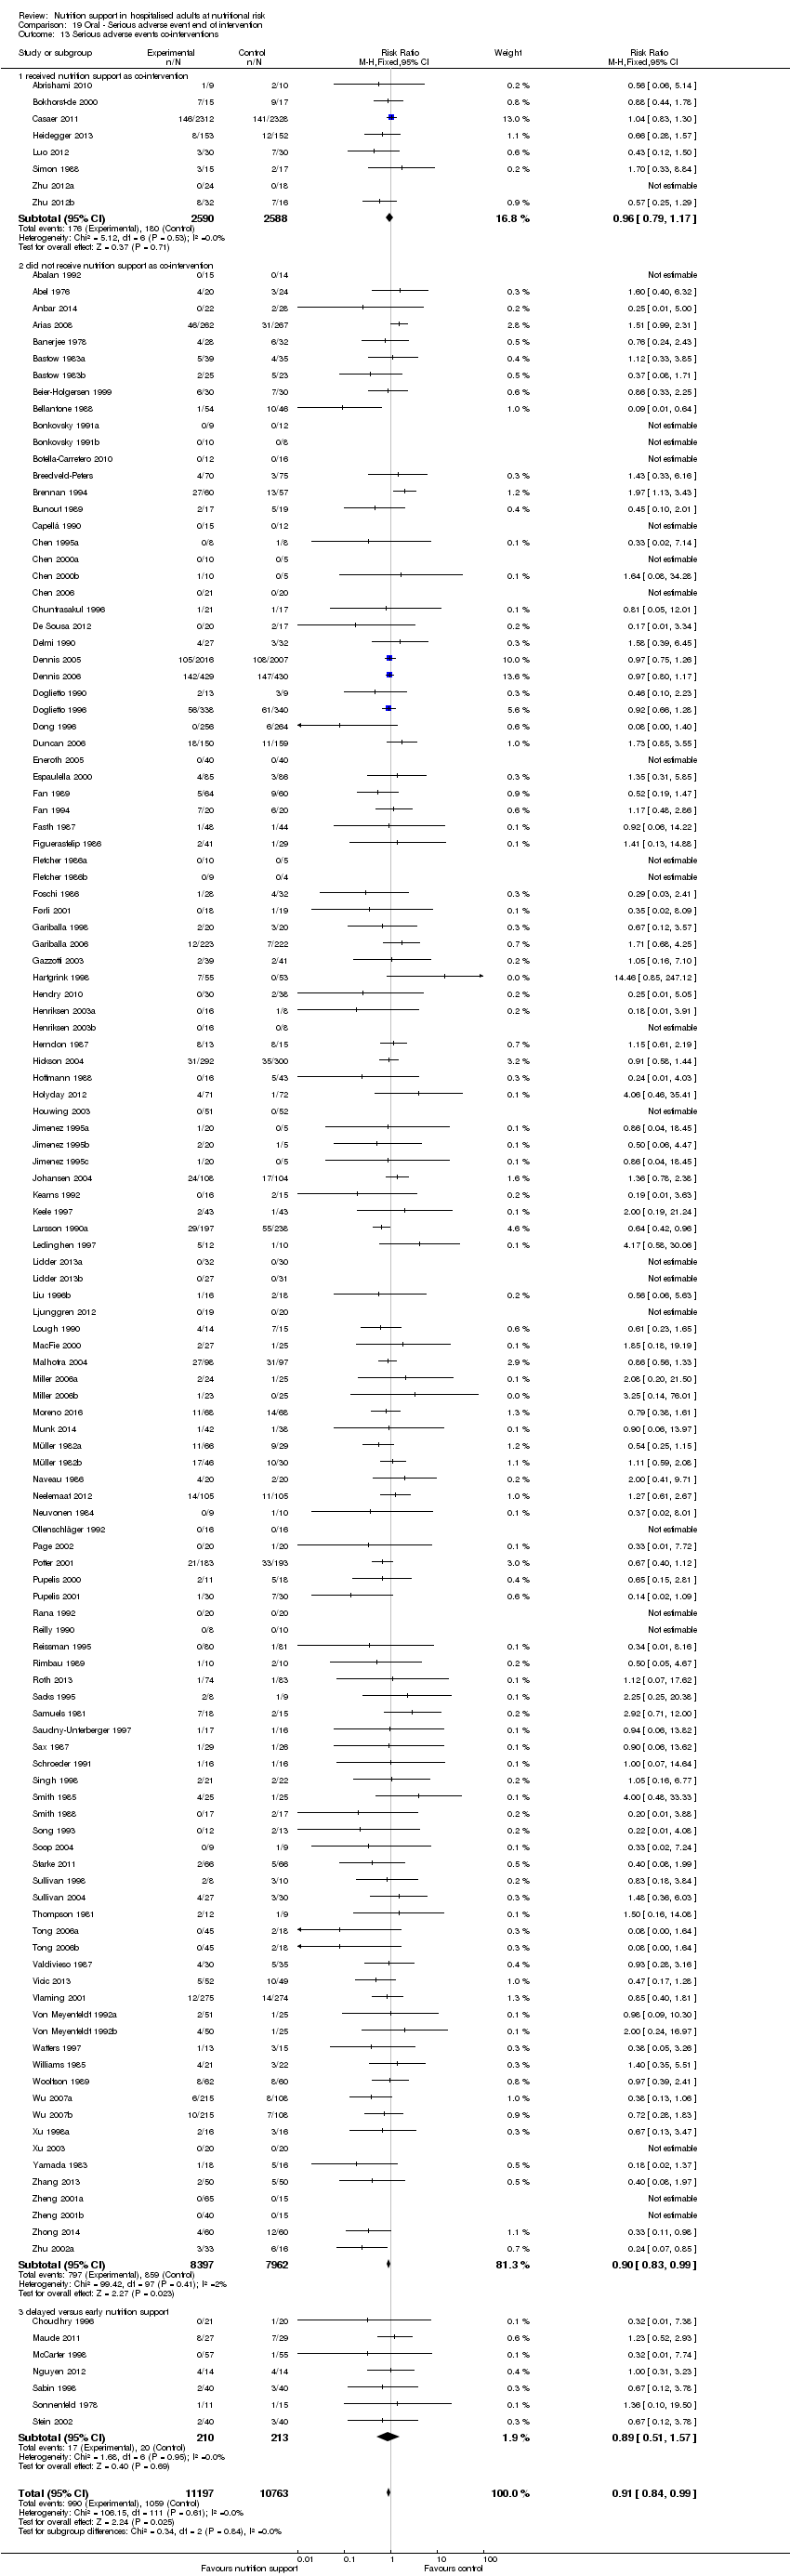
Comparison 19 Oral ‐ Serious adverse event end of intervention, Outcome 13 Serious adverse events co‐interventions.

Comparison 20 Oral ‐ Serious adverse event maximum follow‐up, Outcome 1 Serious adverse events ‐ overall.

Comparison 20 Oral ‐ Serious adverse event maximum follow‐up, Outcome 2 Serious adverse events ‐ bias.
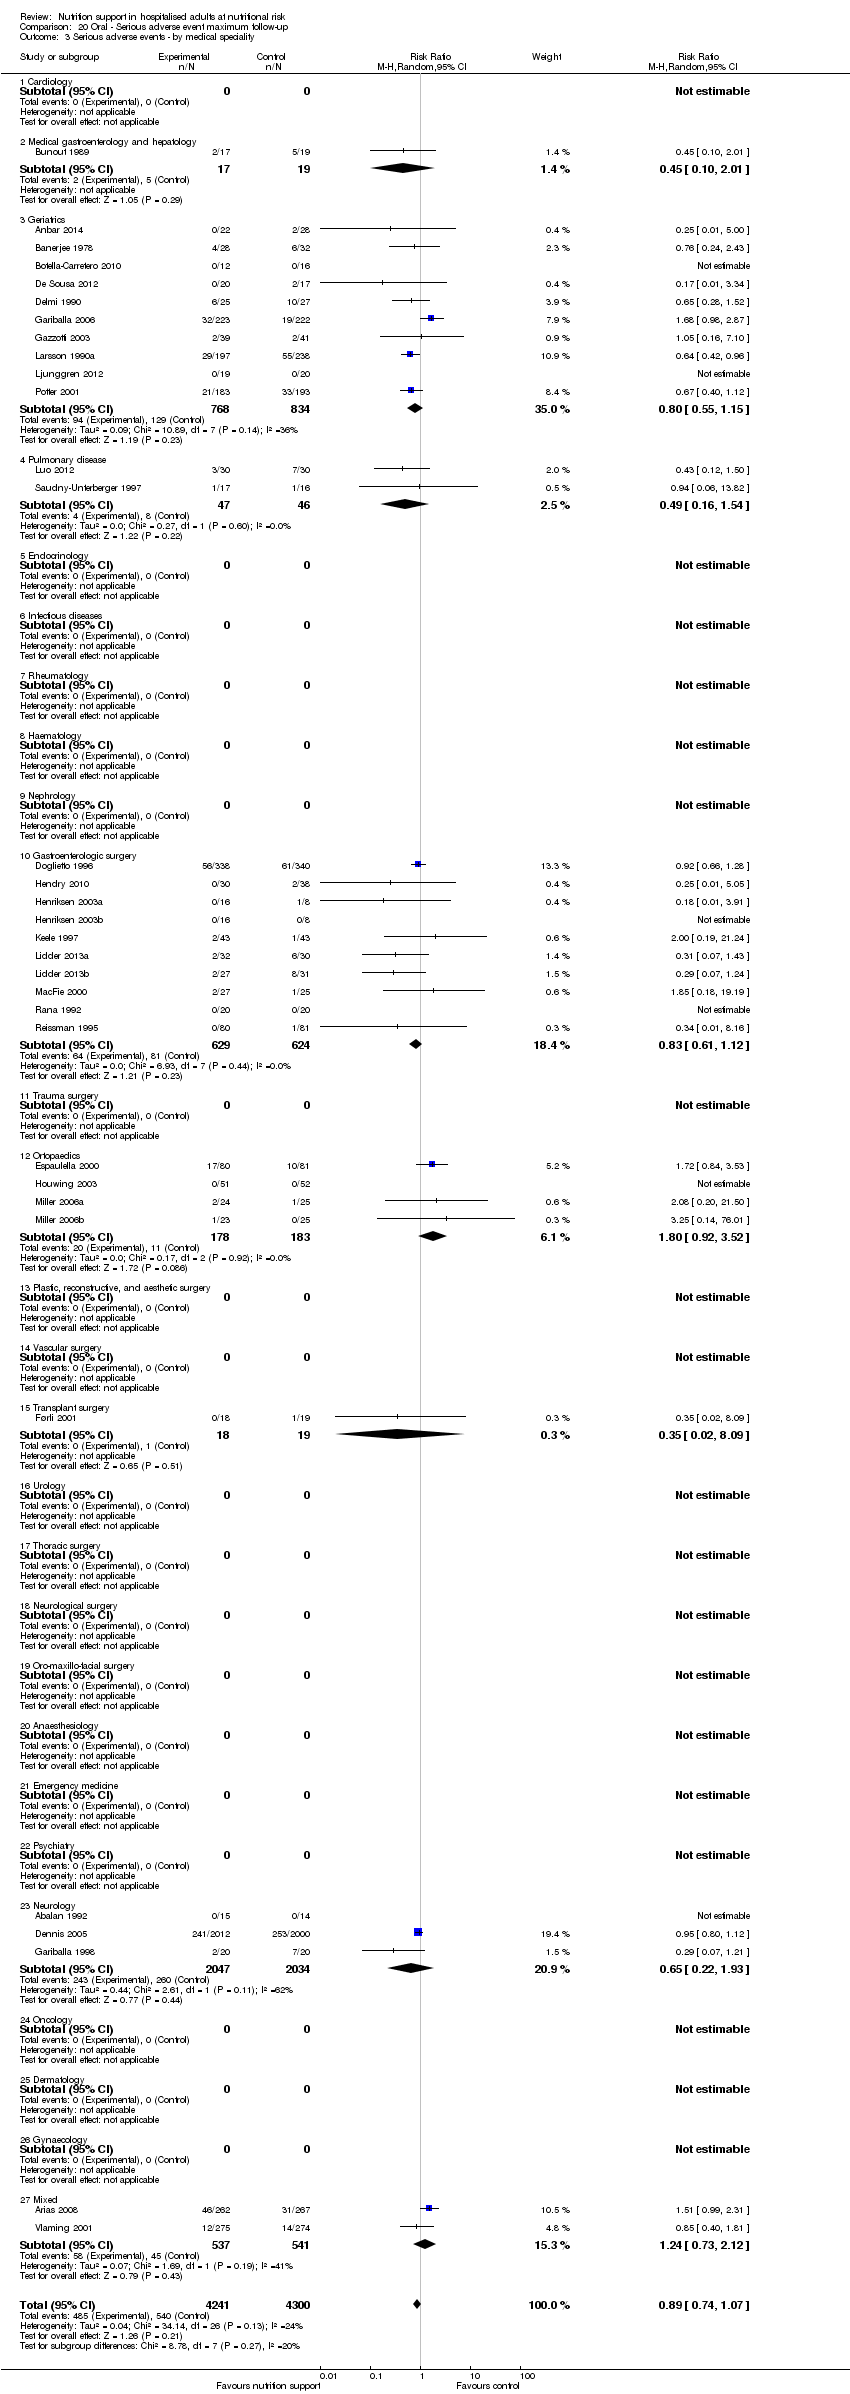
Comparison 20 Oral ‐ Serious adverse event maximum follow‐up, Outcome 3 Serious adverse events ‐ by medical speciality.
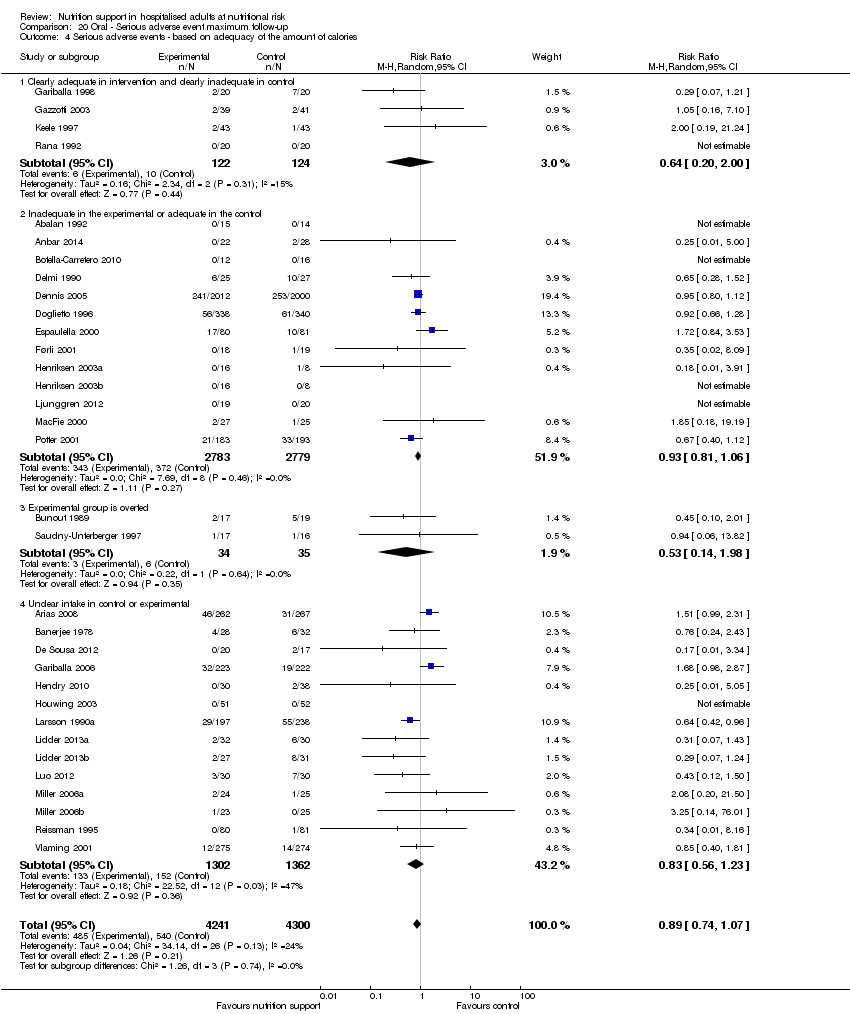
Comparison 20 Oral ‐ Serious adverse event maximum follow‐up, Outcome 4 Serious adverse events ‐ based on adequacy of the amount of calories.

Comparison 20 Oral ‐ Serious adverse event maximum follow‐up, Outcome 5 Serious adverse events ‐ different screening tools.
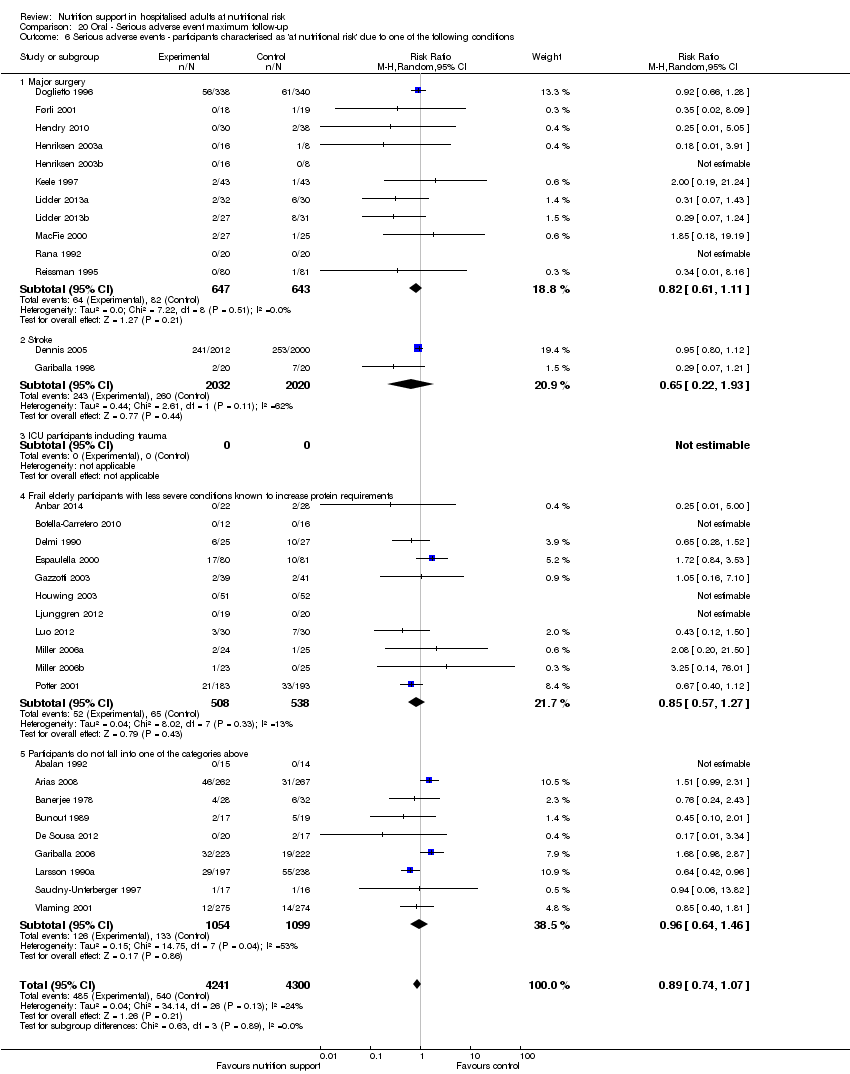
Comparison 20 Oral ‐ Serious adverse event maximum follow‐up, Outcome 6 Serious adverse events ‐ participants characterised as 'at nutritional risk' due to one of the following conditions.
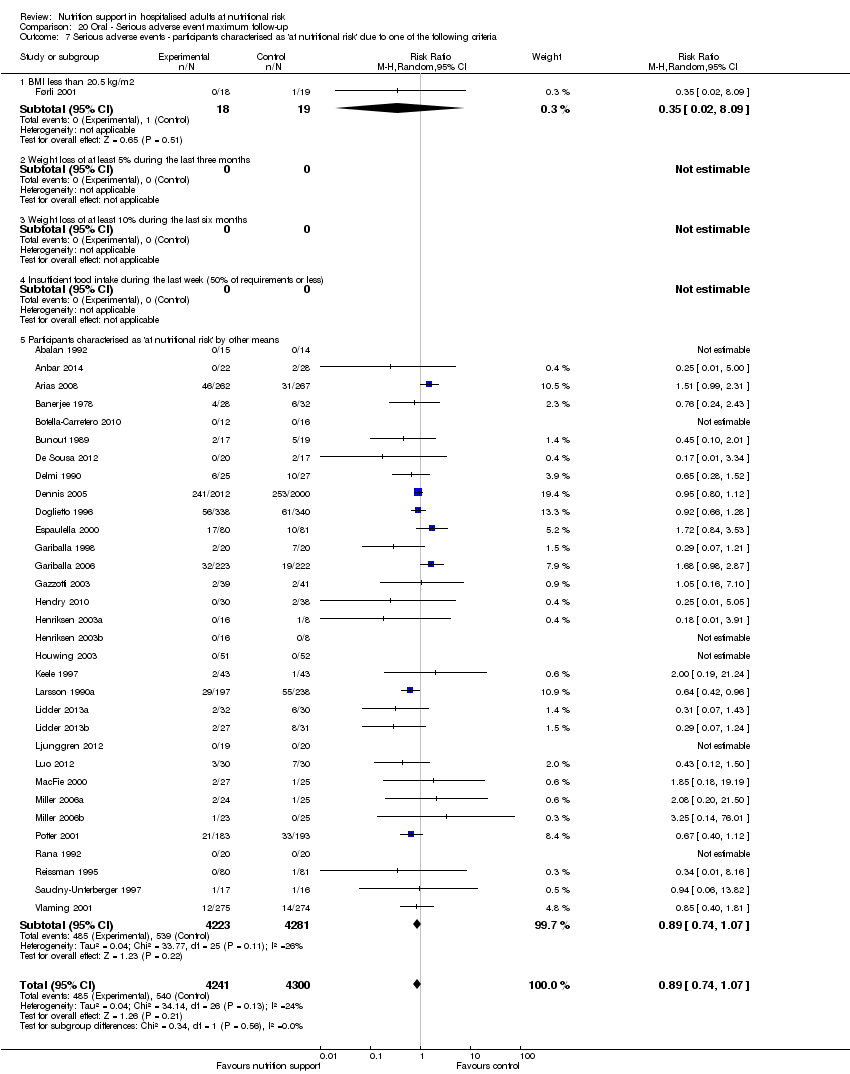
Comparison 20 Oral ‐ Serious adverse event maximum follow‐up, Outcome 7 Serious adverse events ‐ participants characterised as 'at nutritional risk' due to one of the following criteria.

Comparison 20 Oral ‐ Serious adverse event maximum follow‐up, Outcome 8 Serious adverse events ‐ participants characterised as 'at nutritional risk' due to biomarkers or anthropometrics.

Comparison 20 Oral ‐ Serious adverse event maximum follow‐up, Outcome 9 Serious adverse events ‐ randomisation year.
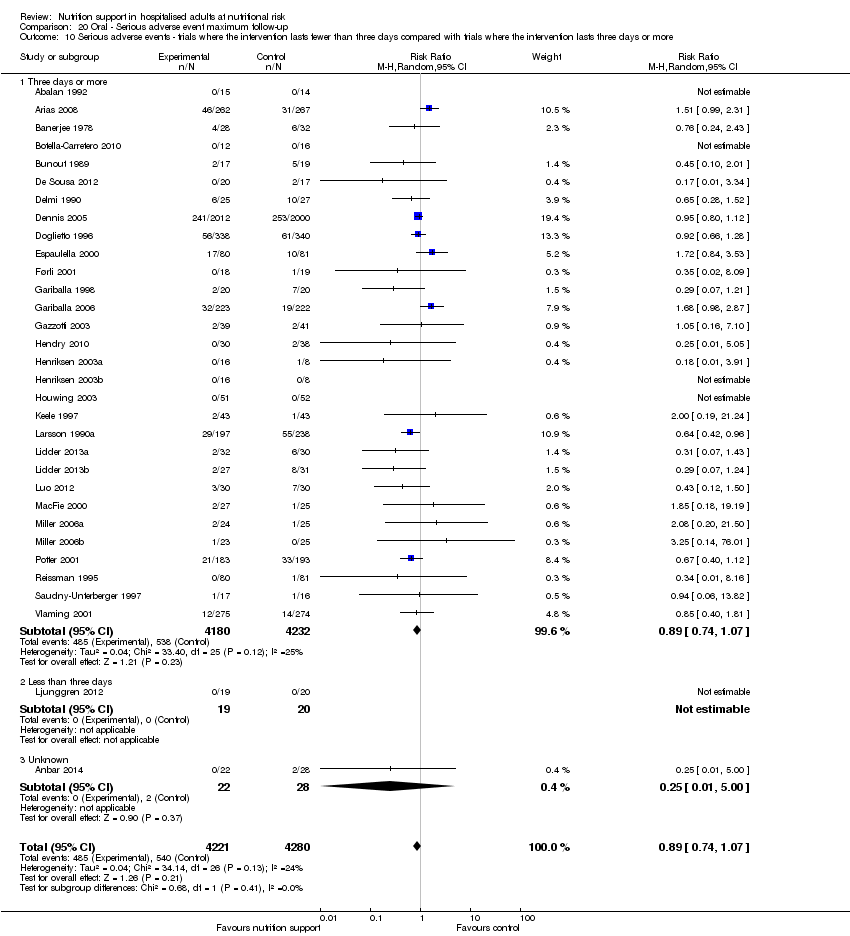
Comparison 20 Oral ‐ Serious adverse event maximum follow‐up, Outcome 10 Serious adverse events ‐ trials where the intervention lasts fewer than three days compared with trials where the intervention lasts three days or more.

Comparison 20 Oral ‐ Serious adverse event maximum follow‐up, Outcome 11 Serious adverse events ‐ 'best‐worst case' scenario.

Comparison 20 Oral ‐ Serious adverse event maximum follow‐up, Outcome 12 Serious adverse events ‐ 'worst‐best case' scenario.

Comparison 20 Oral ‐ Serious adverse event maximum follow‐up, Outcome 13 Serious adverse events co‐interventions.

Comparison 21 Enteral ‐ All cause mortality ‐ end of intervention, Outcome 1 All‐cause mortality ‐ overall.

Comparison 21 Enteral ‐ All cause mortality ‐ end of intervention, Outcome 2 All‐cause mortality ‐ bias.

Comparison 21 Enteral ‐ All cause mortality ‐ end of intervention, Outcome 3 All‐cause mortality ‐ medical speciality.
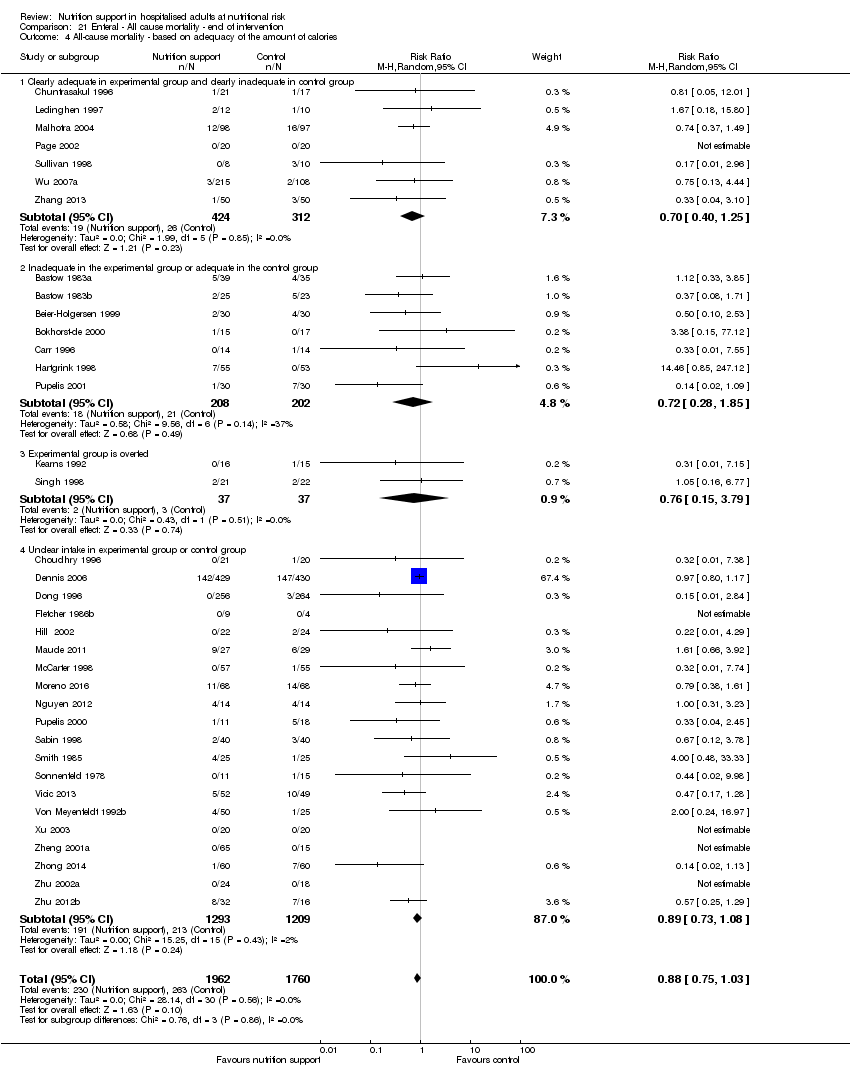
Comparison 21 Enteral ‐ All cause mortality ‐ end of intervention, Outcome 4 All‐cause mortality ‐ based on adequacy of the amount of calories.

Comparison 21 Enteral ‐ All cause mortality ‐ end of intervention, Outcome 5 All‐cause mortality ‐ different screening tools.
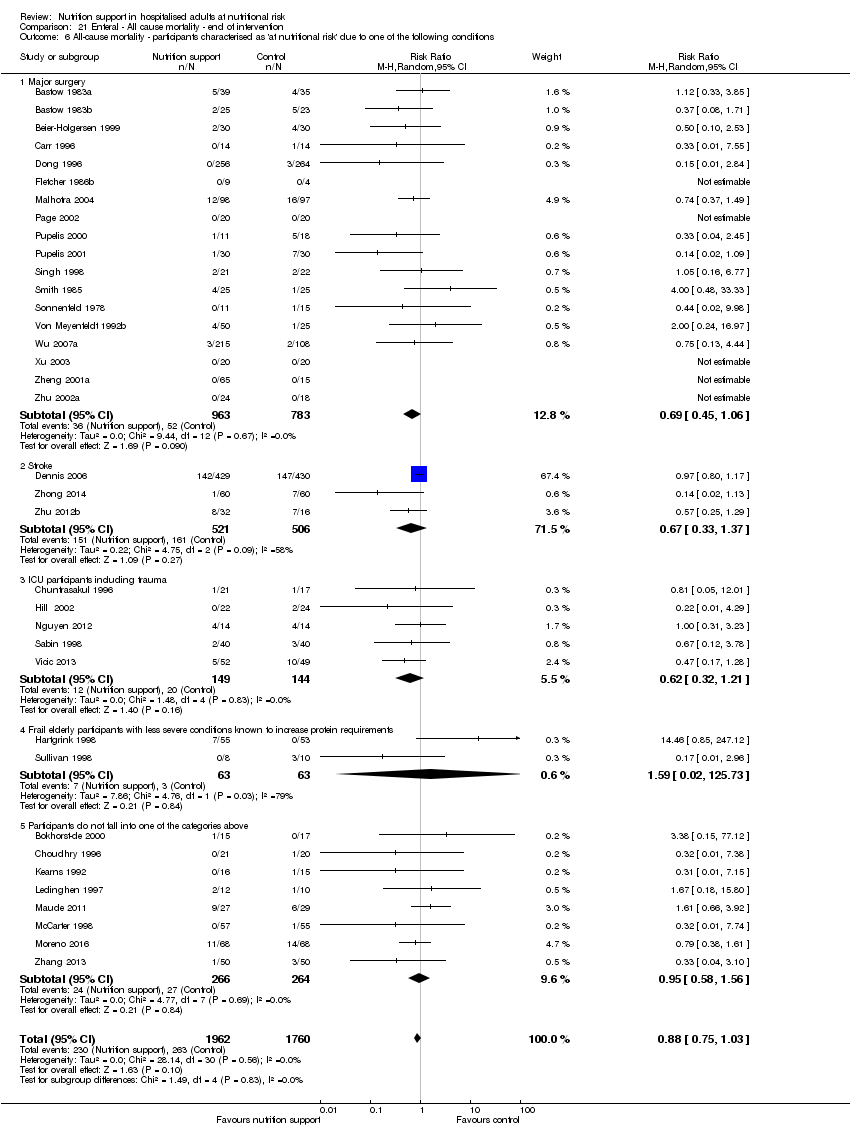
Comparison 21 Enteral ‐ All cause mortality ‐ end of intervention, Outcome 6 All‐cause mortality ‐ participants characterised as 'at nutritional risk' due to one of the following conditions.
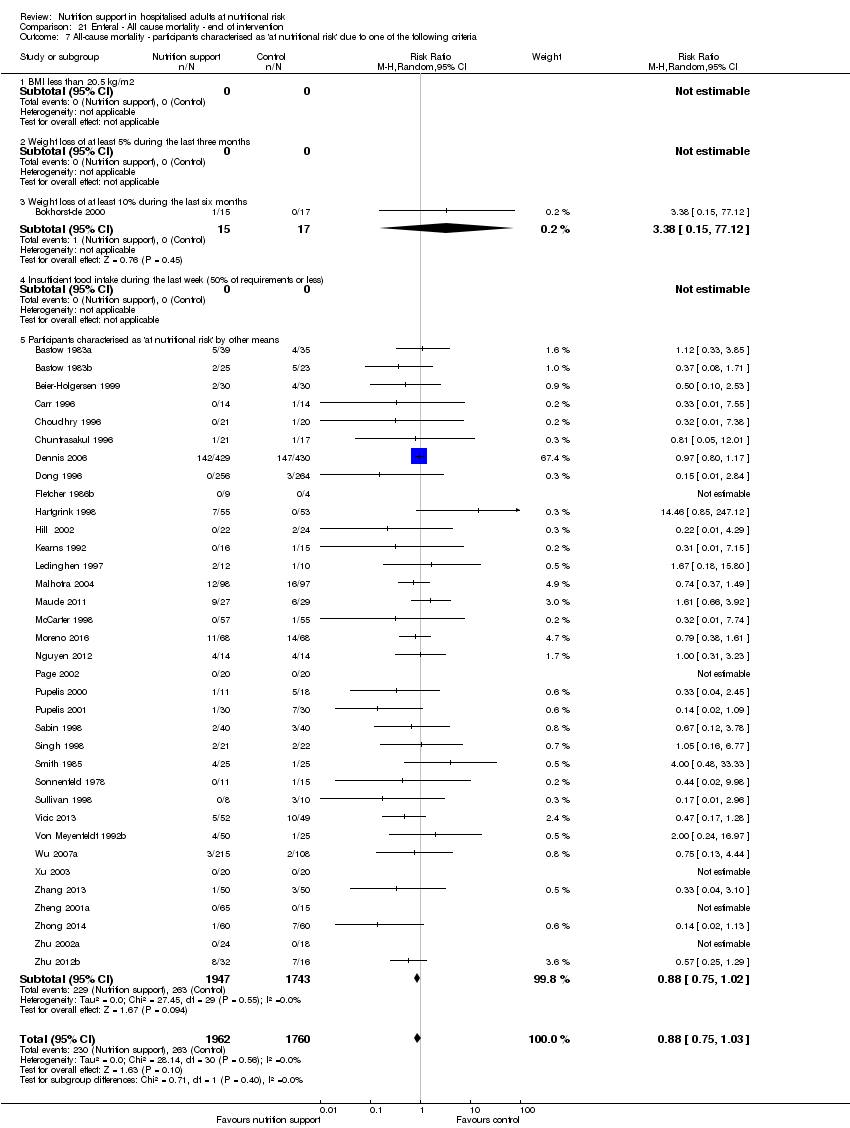
Comparison 21 Enteral ‐ All cause mortality ‐ end of intervention, Outcome 7 All‐cause mortality ‐ participants characterised as 'at nutritional risk' due to one of the following criteria.
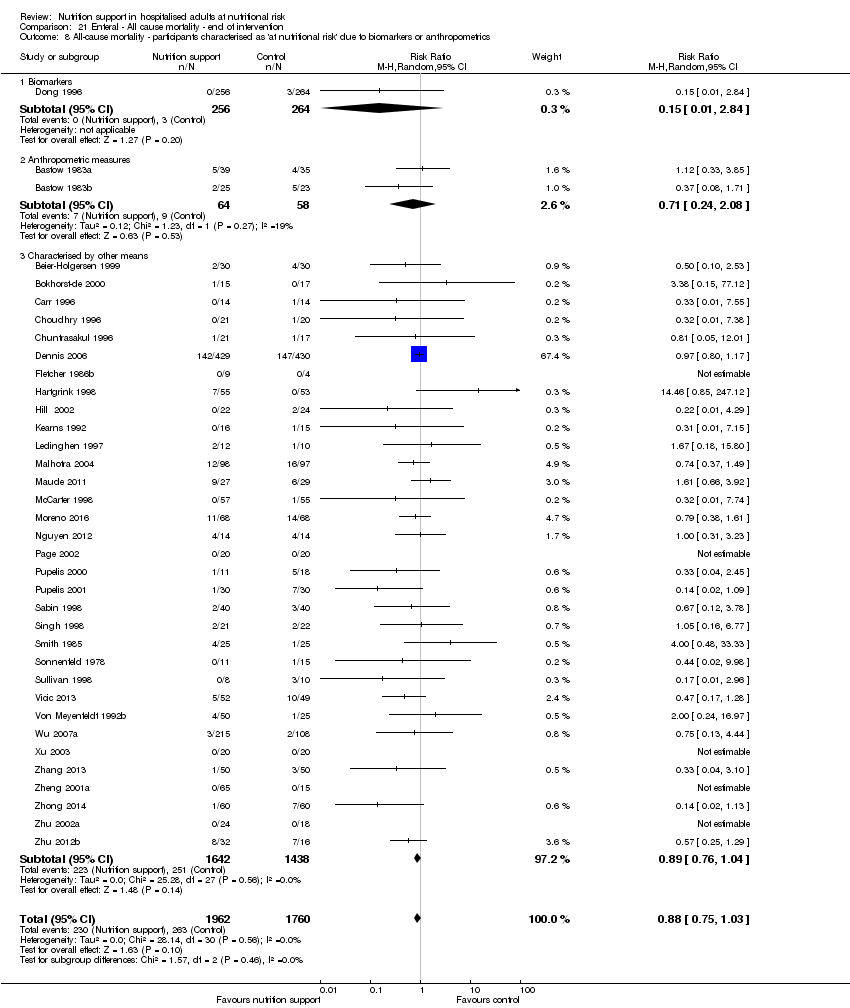
Comparison 21 Enteral ‐ All cause mortality ‐ end of intervention, Outcome 8 All‐cause mortality ‐ participants characterised as 'at nutritional risk' due to biomarkers or anthropometrics.

Comparison 21 Enteral ‐ All cause mortality ‐ end of intervention, Outcome 9 All‐cause mortality ‐ randomisation year.
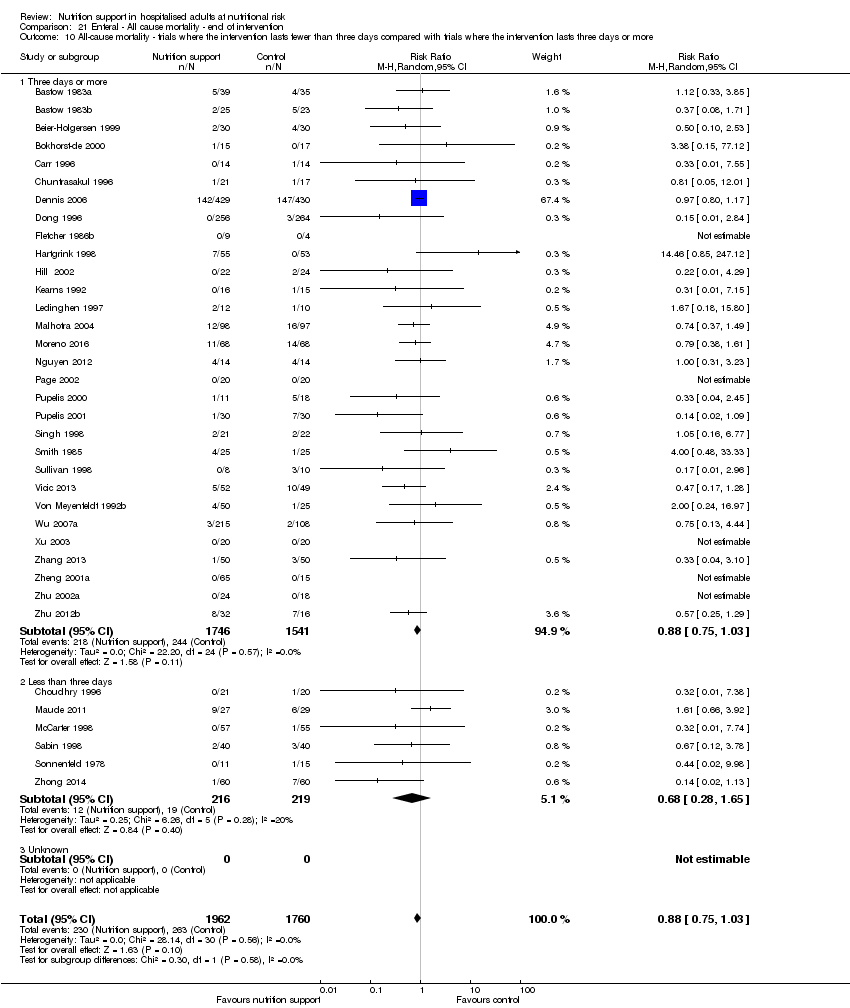
Comparison 21 Enteral ‐ All cause mortality ‐ end of intervention, Outcome 10 All‐cause mortality ‐ trials where the intervention lasts fewer than three days compared with trials where the intervention lasts three days or more.

Comparison 21 Enteral ‐ All cause mortality ‐ end of intervention, Outcome 11 All‐cause mortality ‐ 'best‐worst case' scenario.

Comparison 21 Enteral ‐ All cause mortality ‐ end of intervention, Outcome 12 All‐cause mortality ‐ 'worst‐best case' scenario.

Comparison 21 Enteral ‐ All cause mortality ‐ end of intervention, Outcome 13 All‐cause mortality co‐interventions.
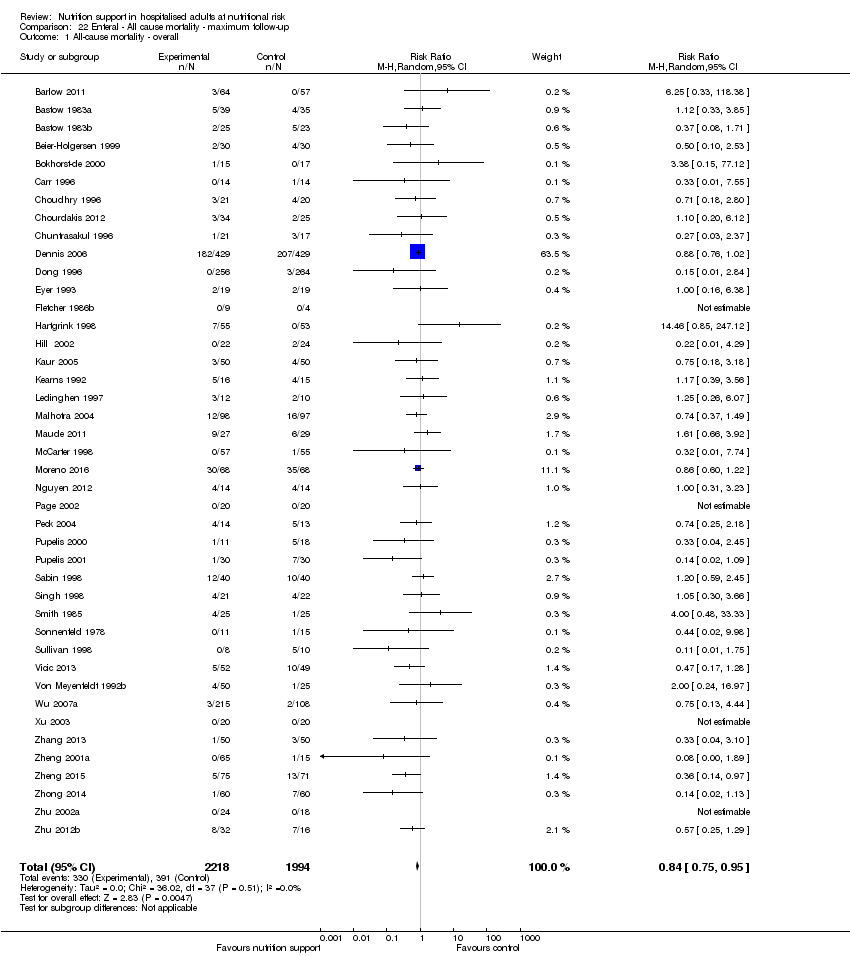
Comparison 22 Enteral ‐ All cause mortality ‐ maximum follow‐up, Outcome 1 All‐cause mortality ‐ overall.

Comparison 22 Enteral ‐ All cause mortality ‐ maximum follow‐up, Outcome 2 All‐cause mortality ‐ bias.

Comparison 22 Enteral ‐ All cause mortality ‐ maximum follow‐up, Outcome 3 All‐cause mortality ‐ medical speciality.

Comparison 22 Enteral ‐ All cause mortality ‐ maximum follow‐up, Outcome 4 All‐cause mortality ‐ based on adequacy of the amount of calories.

Comparison 22 Enteral ‐ All cause mortality ‐ maximum follow‐up, Outcome 5 All‐cause mortality ‐ different screening tools.

Comparison 22 Enteral ‐ All cause mortality ‐ maximum follow‐up, Outcome 6 All‐cause mortality ‐ participants characterised as 'at nutritional risk' due to one of the following conditions.

Comparison 22 Enteral ‐ All cause mortality ‐ maximum follow‐up, Outcome 7 All‐cause mortality ‐ participants characterised as 'at nutritional risk' due to one of the following criteria.
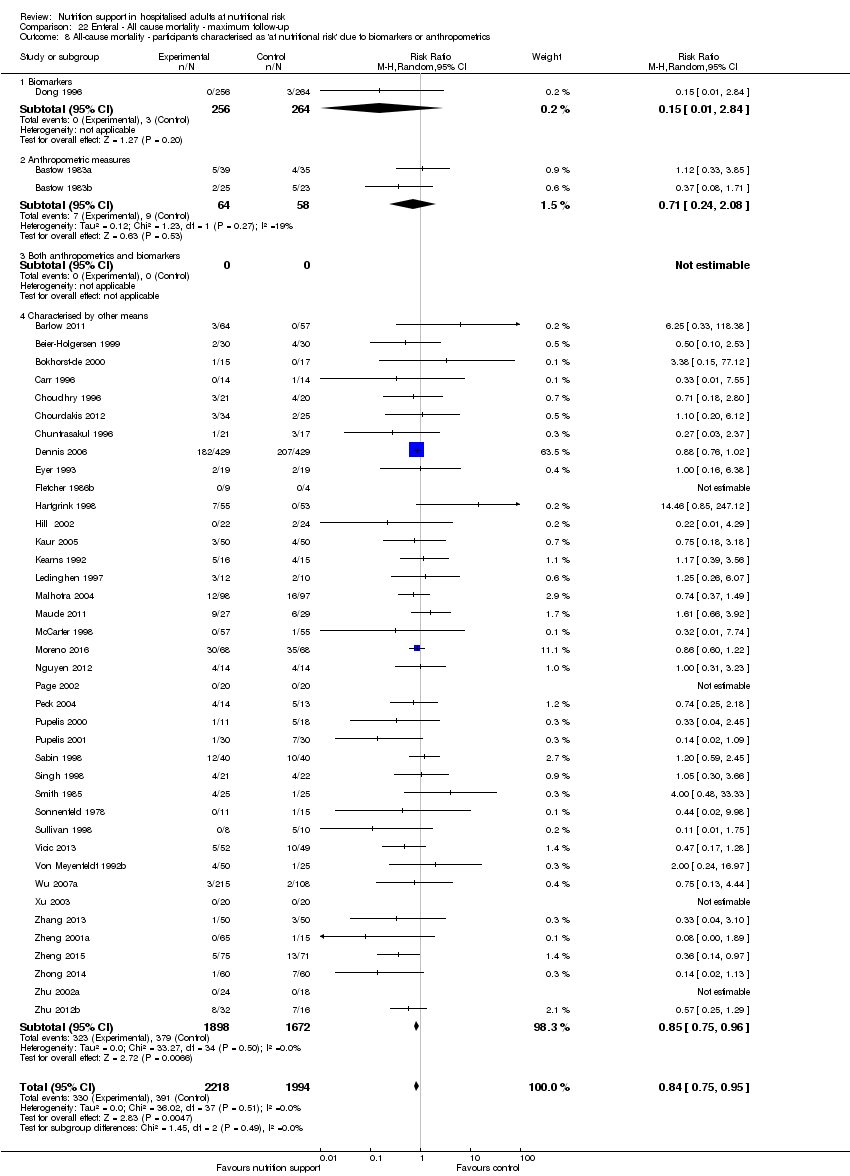
Comparison 22 Enteral ‐ All cause mortality ‐ maximum follow‐up, Outcome 8 All‐cause mortality ‐ participants characterised as 'at nutritional risk' due to biomarkers or anthropometrics.
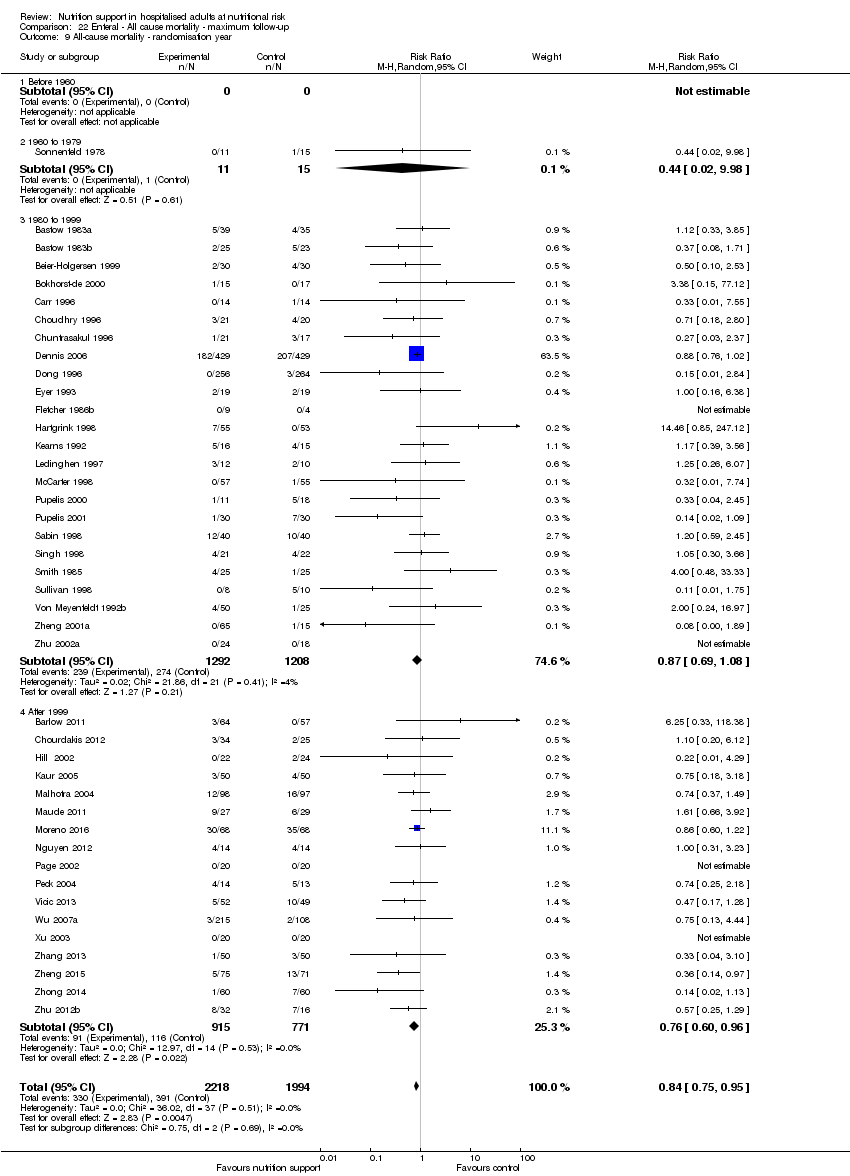
Comparison 22 Enteral ‐ All cause mortality ‐ maximum follow‐up, Outcome 9 All‐cause mortality ‐ randomisation year.
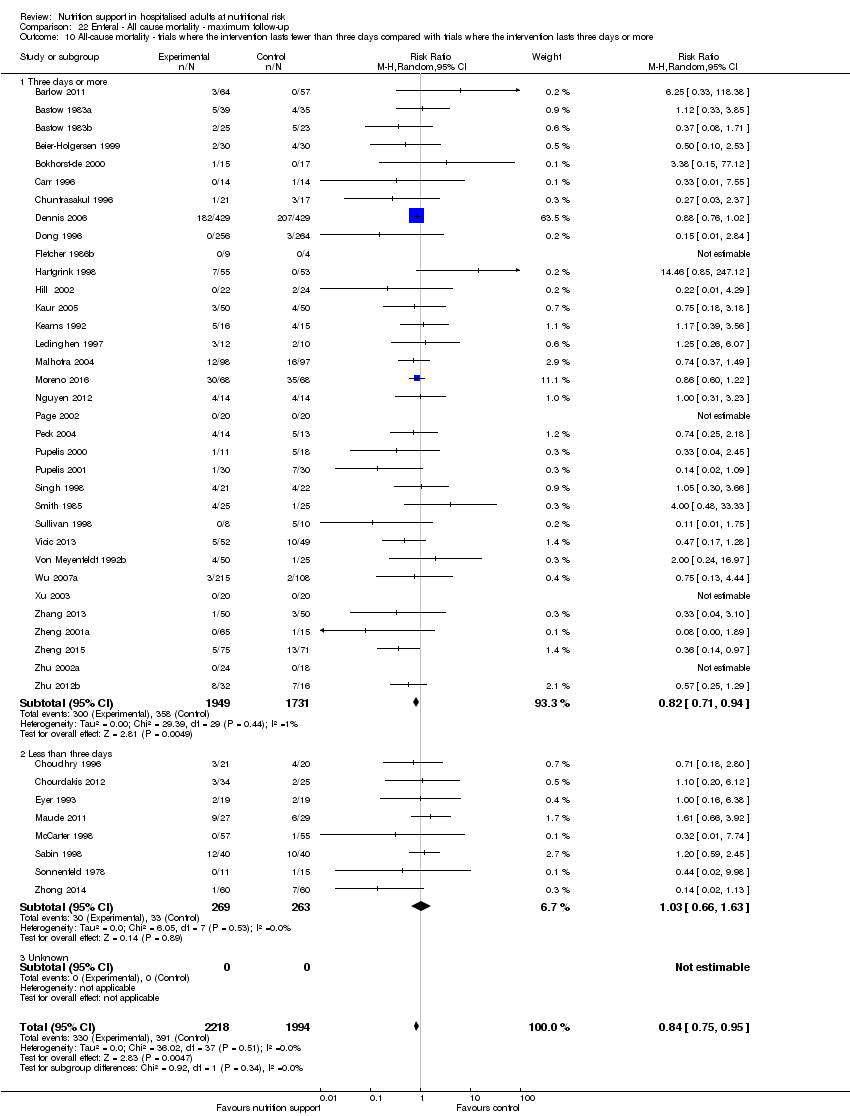
Comparison 22 Enteral ‐ All cause mortality ‐ maximum follow‐up, Outcome 10 All‐cause mortality ‐ trials where the intervention lasts fewer than three days compared with trials where the intervention lasts three days or more.
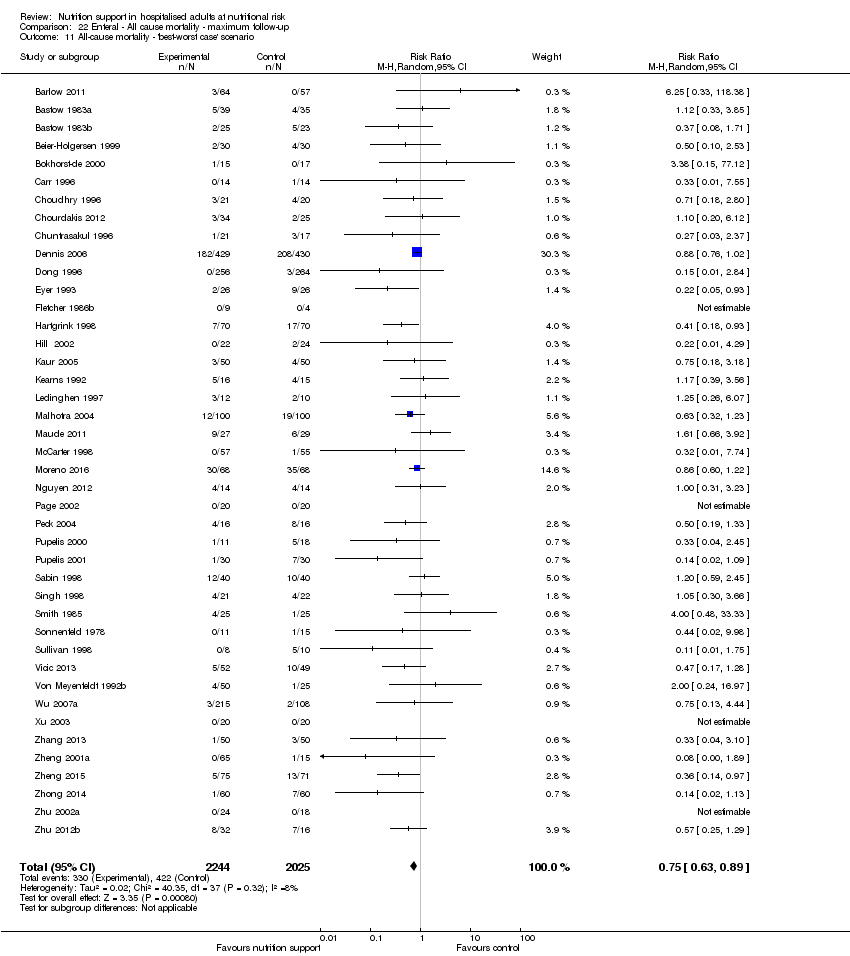
Comparison 22 Enteral ‐ All cause mortality ‐ maximum follow‐up, Outcome 11 All‐cause mortality ‐ 'best‐worst case' scenario.
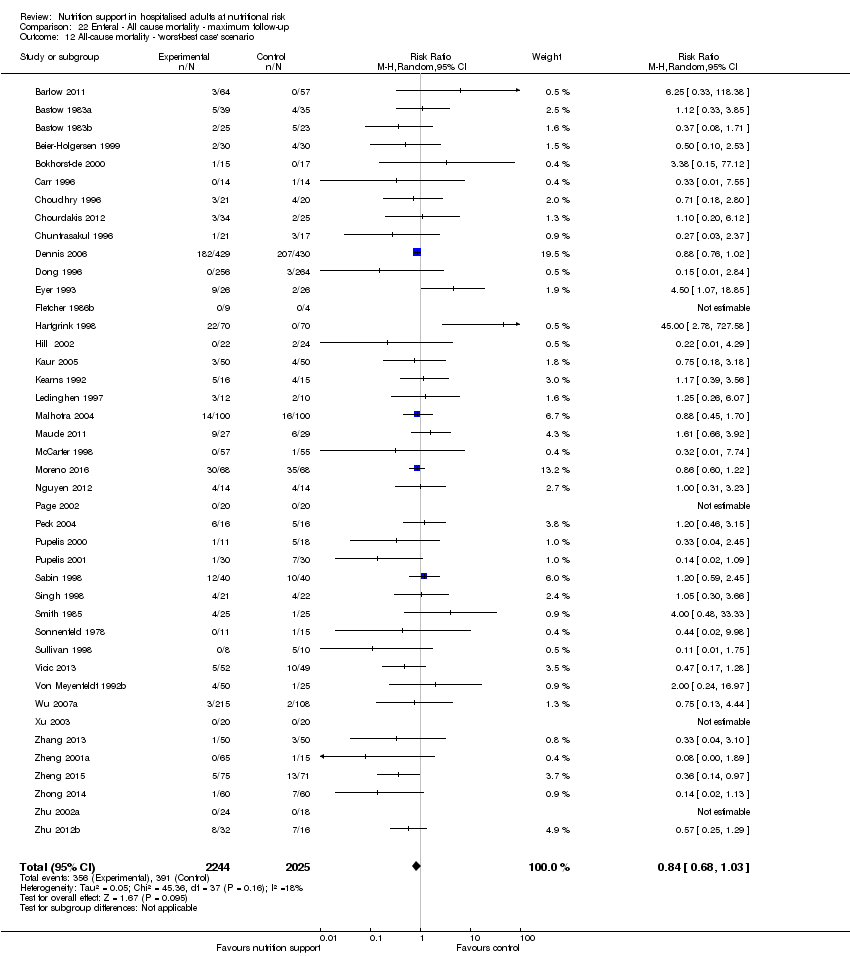
Comparison 22 Enteral ‐ All cause mortality ‐ maximum follow‐up, Outcome 12 All‐cause mortality ‐ 'worst‐best case' scenario.

Comparison 22 Enteral ‐ All cause mortality ‐ maximum follow‐up, Outcome 13 All‐cause mortality co‐interventions.

Comparison 23 Enteral ‐ Serious adverse event end of intervention, Outcome 1 Serious adverse events ‐ overall.

Comparison 23 Enteral ‐ Serious adverse event end of intervention, Outcome 2 Serious adverse events ‐ bias.

Comparison 23 Enteral ‐ Serious adverse event end of intervention, Outcome 3 Serious adverse events ‐ by medical specialty.

Comparison 23 Enteral ‐ Serious adverse event end of intervention, Outcome 4 Serious adverse events ‐ based on adequacy of the amount of calories.
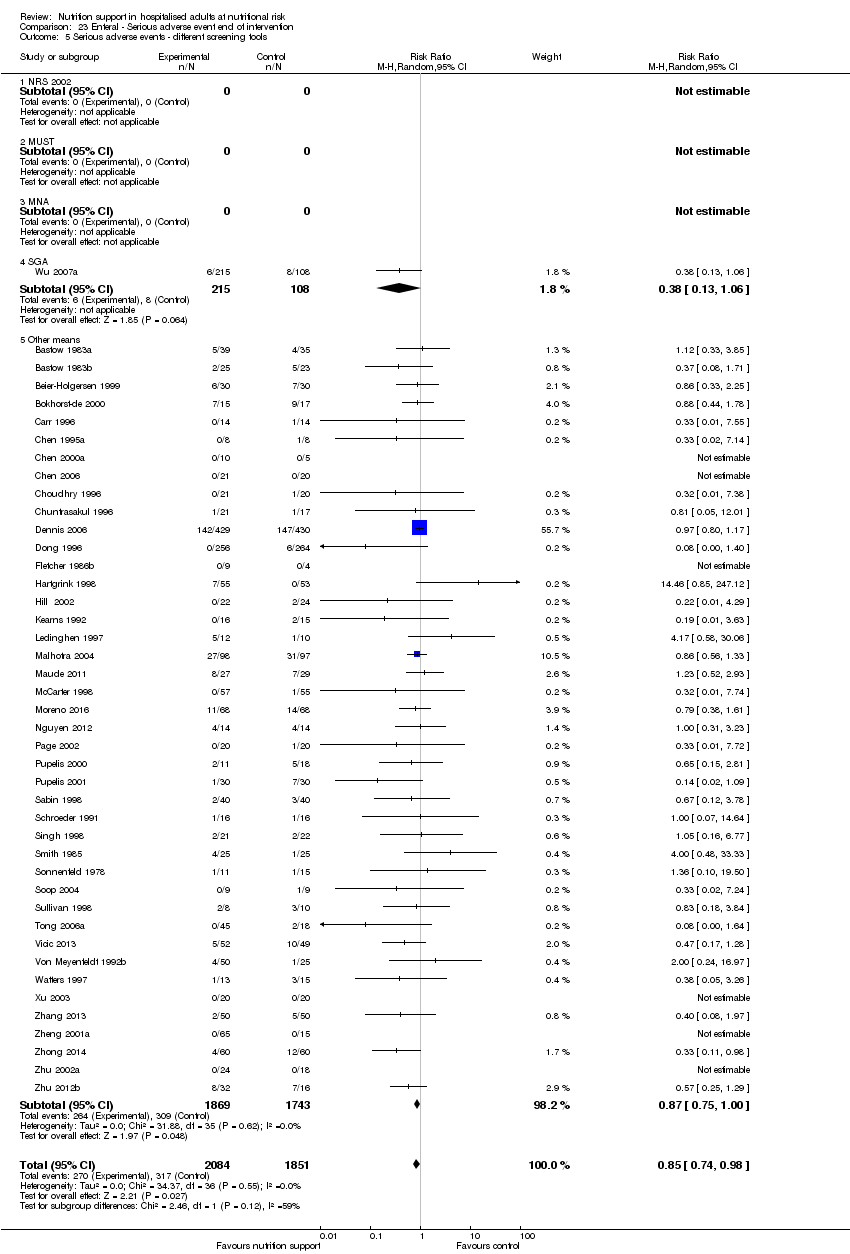
Comparison 23 Enteral ‐ Serious adverse event end of intervention, Outcome 5 Serious adverse events ‐ different screening tools.

Comparison 23 Enteral ‐ Serious adverse event end of intervention, Outcome 6 Serious adverse events ‐ participants characterised as 'at nutritional risk' due to one of the following conditions.

Comparison 23 Enteral ‐ Serious adverse event end of intervention, Outcome 7 Serious adverse events ‐ participants characterised as 'at nutritional risk' due to one of the following criteria.

Comparison 23 Enteral ‐ Serious adverse event end of intervention, Outcome 8 Serious adverse events ‐ participants characterised as 'at nutritional risk' due to biomarkers or anthropometrics.
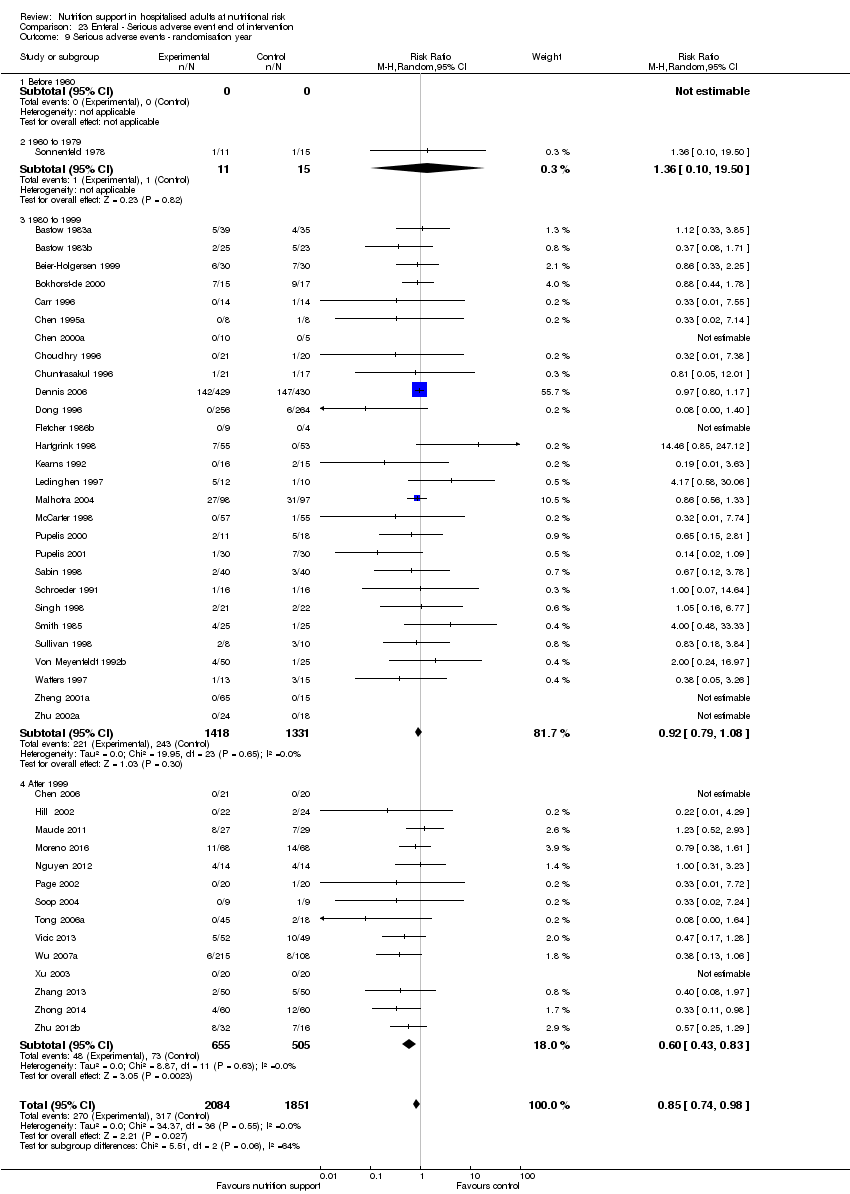
Comparison 23 Enteral ‐ Serious adverse event end of intervention, Outcome 9 Serious adverse events ‐ randomisation year.

Comparison 23 Enteral ‐ Serious adverse event end of intervention, Outcome 10 Serious adverse events ‐ trials where the intervention lasts fewer than three days compared with trials where the intervention lasts three days or more.
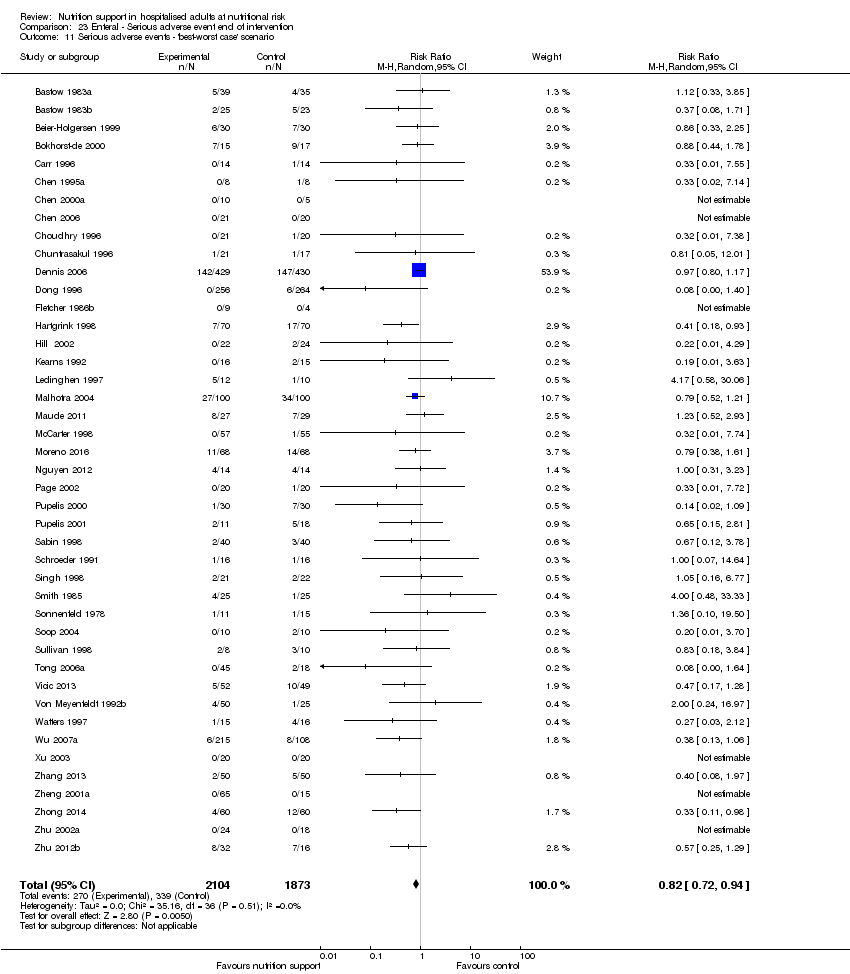
Comparison 23 Enteral ‐ Serious adverse event end of intervention, Outcome 11 Serious adverse events ‐ 'best‐worst case' scenario.

Comparison 23 Enteral ‐ Serious adverse event end of intervention, Outcome 12 Serious adverse events ‐ 'worst‐best case' scenario.

Comparison 23 Enteral ‐ Serious adverse event end of intervention, Outcome 13 Serious adverse events co‐interventions.
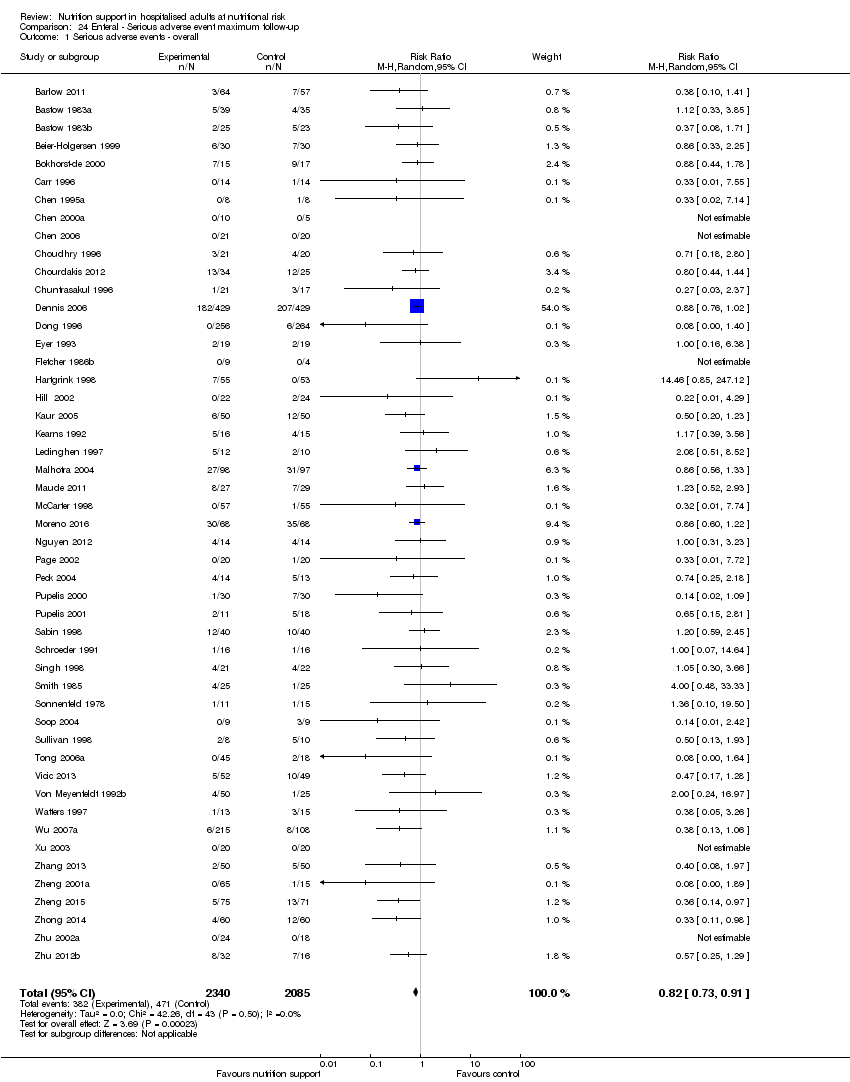
Comparison 24 Enteral ‐ Serious adverse event maximum follow‐up, Outcome 1 Serious adverse events ‐ overall.

Comparison 24 Enteral ‐ Serious adverse event maximum follow‐up, Outcome 2 Serious adverse events ‐ bias.
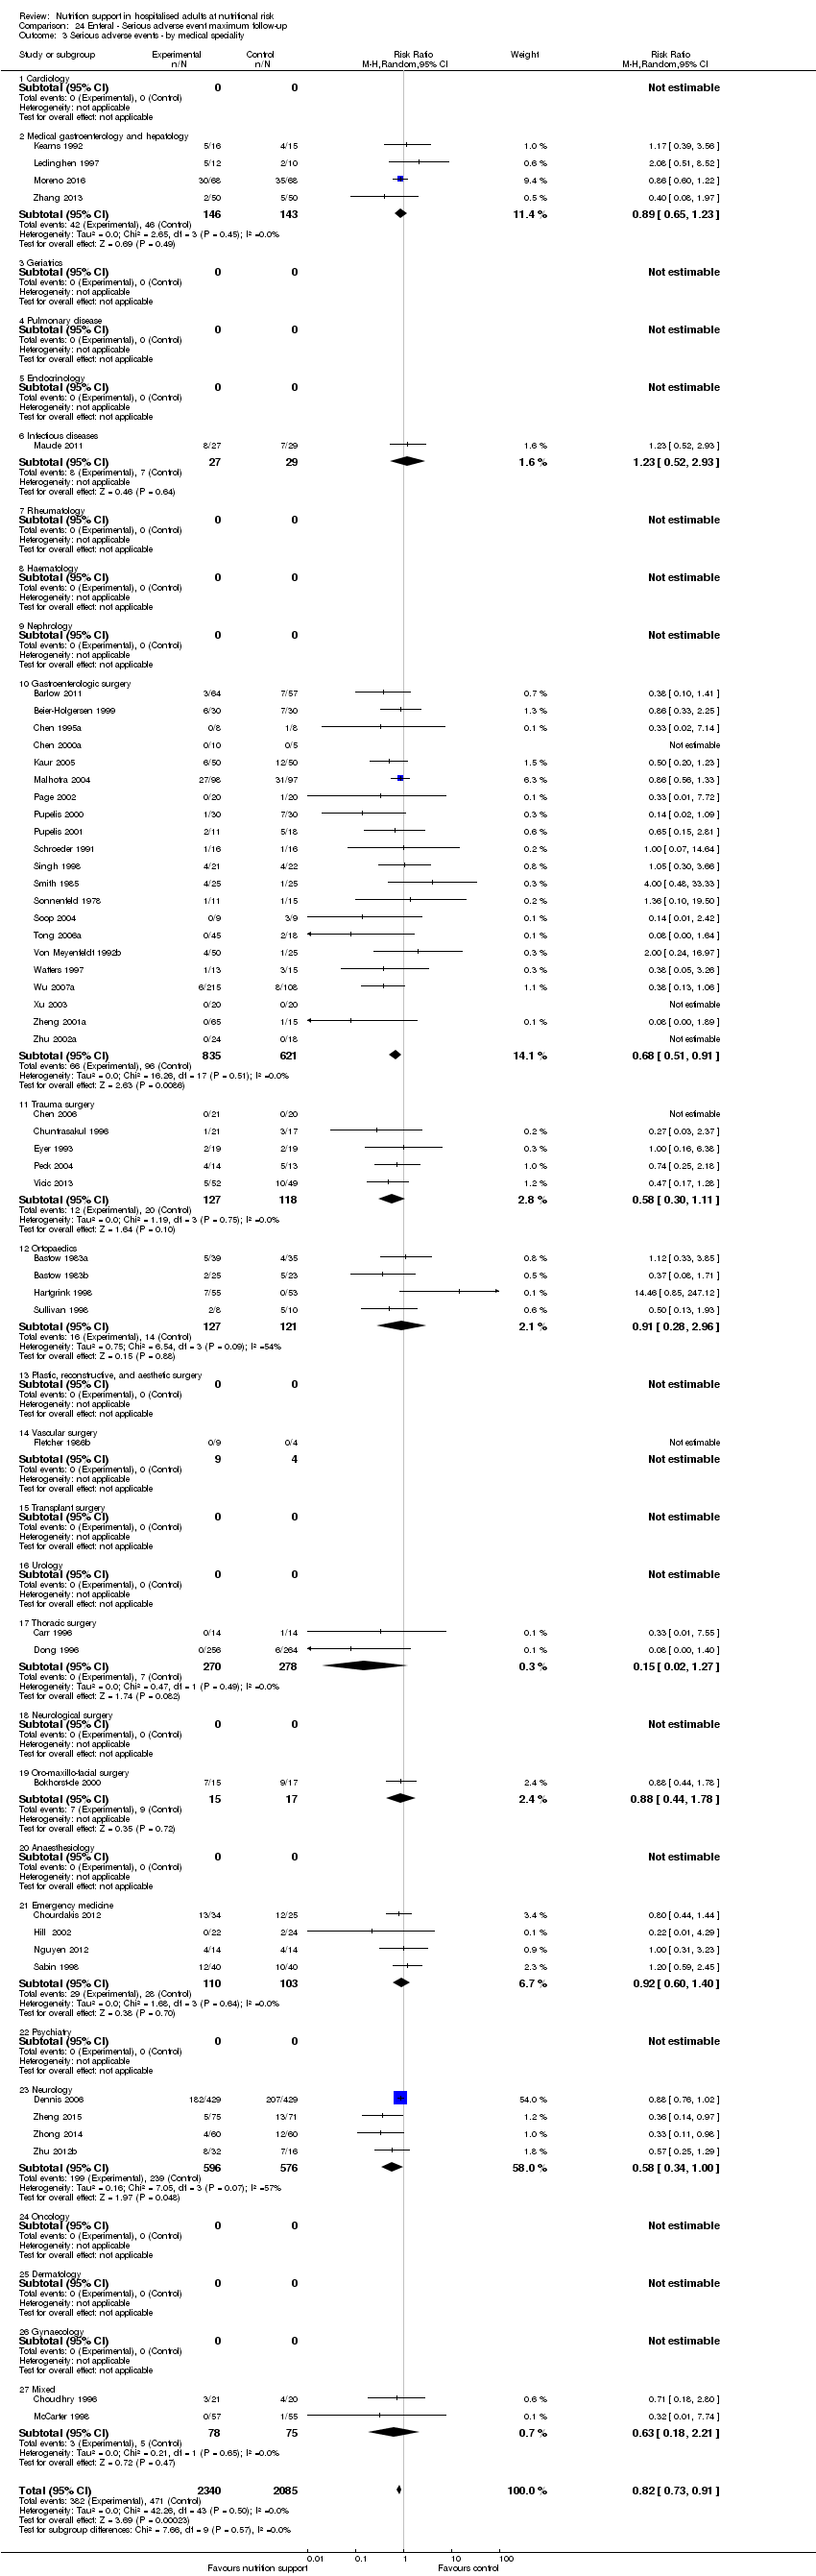
Comparison 24 Enteral ‐ Serious adverse event maximum follow‐up, Outcome 3 Serious adverse events ‐ by medical speciality.

Comparison 24 Enteral ‐ Serious adverse event maximum follow‐up, Outcome 4 Serious adverse events ‐ based on adequacy of the amount of calories.

Comparison 24 Enteral ‐ Serious adverse event maximum follow‐up, Outcome 5 Serious adverse events ‐ different screening tools.

Comparison 24 Enteral ‐ Serious adverse event maximum follow‐up, Outcome 6 Serious adverse events ‐ participants characterised as 'at nutritional risk' due to one of the following conditions.

Comparison 24 Enteral ‐ Serious adverse event maximum follow‐up, Outcome 7 Serious adverse events ‐ participants characterised as 'at nutritional risk' due to one of the following criteria.

Comparison 24 Enteral ‐ Serious adverse event maximum follow‐up, Outcome 8 Serious adverse events ‐ participants characterised as 'at nutritional risk' due to biomarkers or anthropometrics.

Comparison 24 Enteral ‐ Serious adverse event maximum follow‐up, Outcome 9 Serious adverse events ‐ randomisation year.

Comparison 24 Enteral ‐ Serious adverse event maximum follow‐up, Outcome 10 Serious adverse events ‐ trials where the intervention lasts fewer than three days compared with trials where the intervention lasts three days or more.

Comparison 24 Enteral ‐ Serious adverse event maximum follow‐up, Outcome 11 Serious adverse events co‐interventions.

Comparison 24 Enteral ‐ Serious adverse event maximum follow‐up, Outcome 12 Serious adverse events ‐ 'best‐worse case' scenario (enteral nutrition).

Comparison 24 Enteral ‐ Serious adverse event maximum follow‐up, Outcome 13 Serious adverse events ‐ 'worst‐best case' scenario (enteral nutrition).
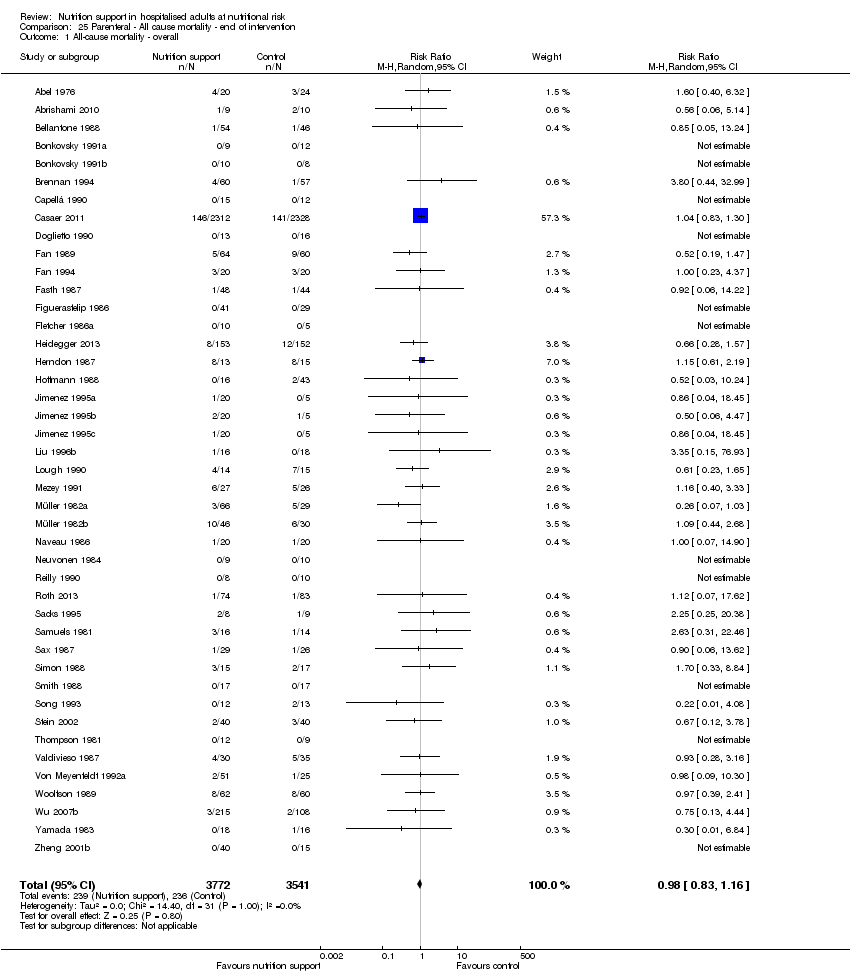
Comparison 25 Parenteral ‐ All cause mortality ‐ end of intervention, Outcome 1 All‐cause mortality ‐ overall.

Comparison 25 Parenteral ‐ All cause mortality ‐ end of intervention, Outcome 2 All‐cause mortality ‐ bias.
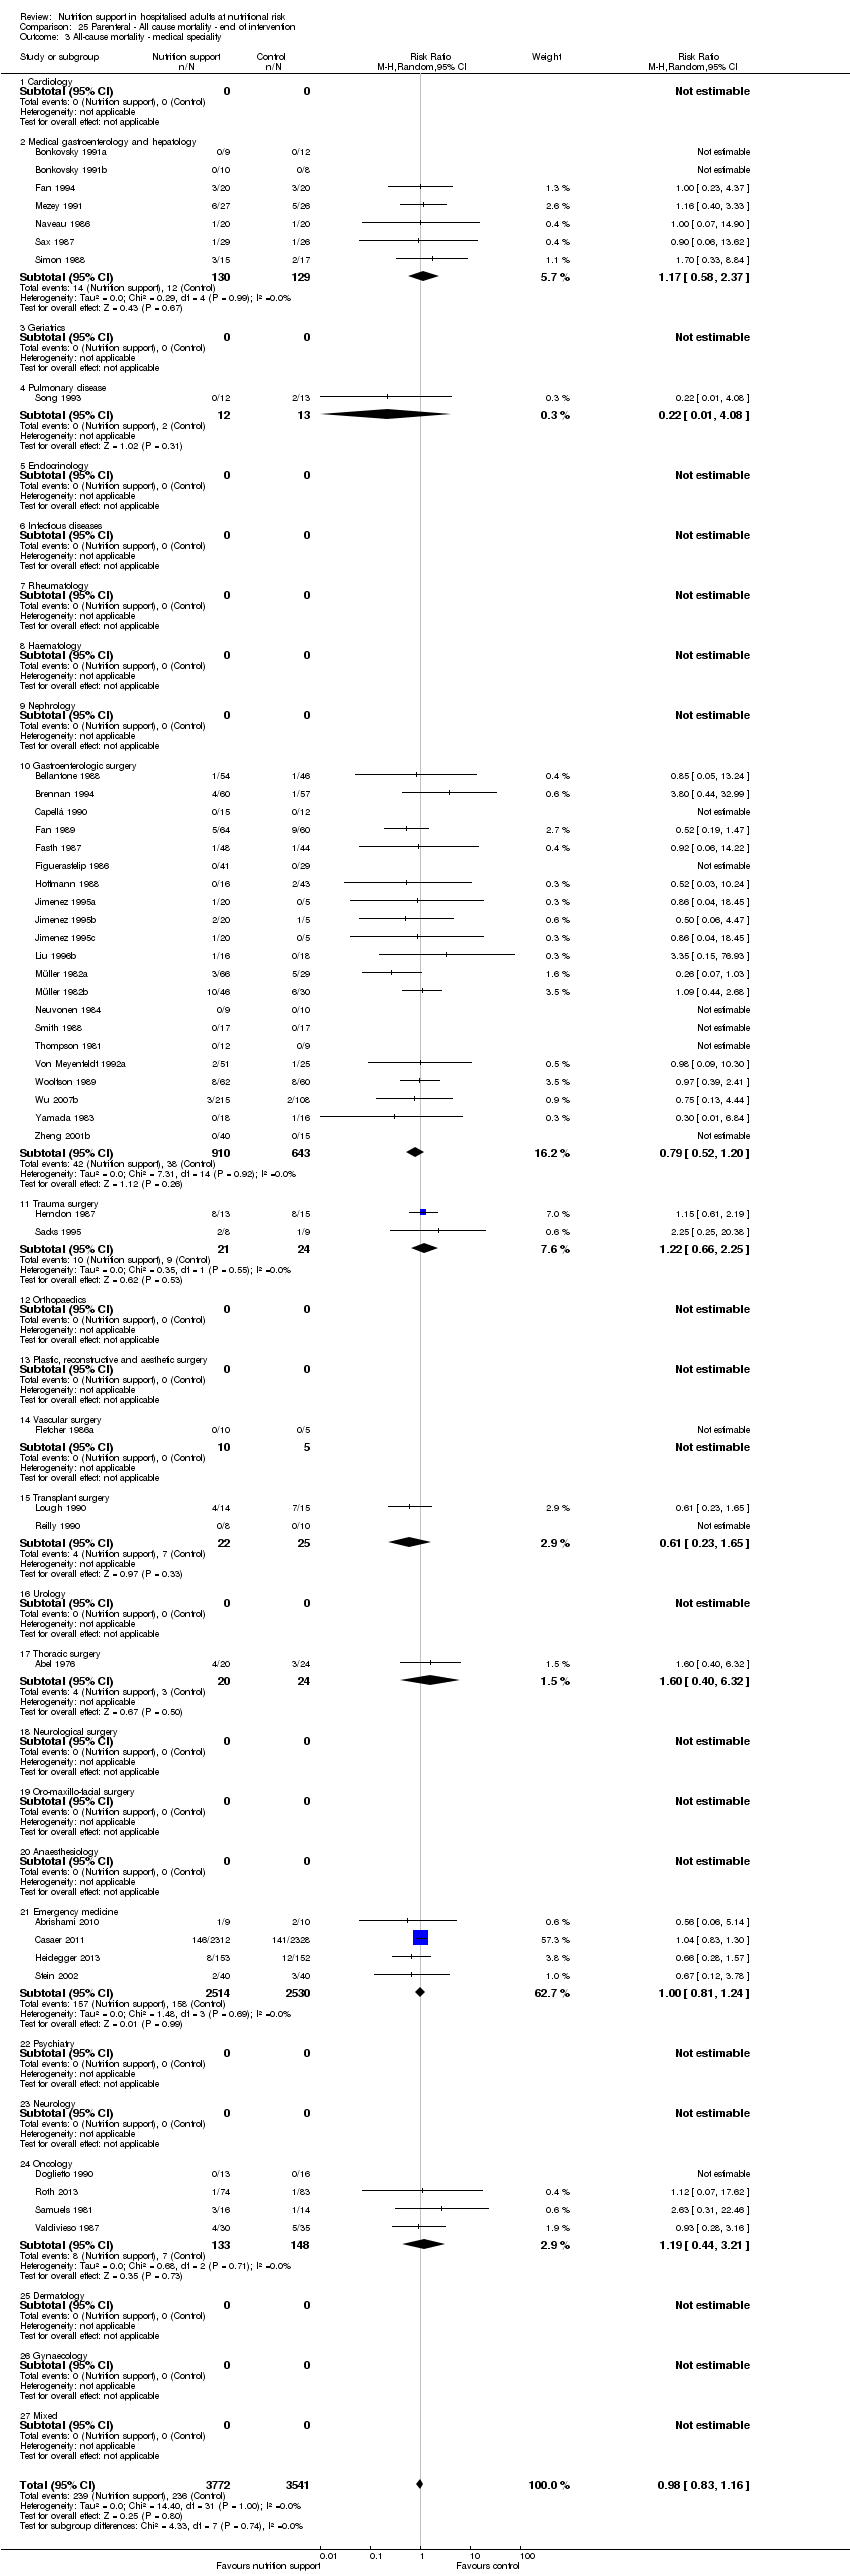
Comparison 25 Parenteral ‐ All cause mortality ‐ end of intervention, Outcome 3 All‐cause mortality ‐ medical speciality.

Comparison 25 Parenteral ‐ All cause mortality ‐ end of intervention, Outcome 4 All‐cause mortality ‐ based on adequacy of the amount of calories.

Comparison 25 Parenteral ‐ All cause mortality ‐ end of intervention, Outcome 5 All‐cause mortality ‐ different screening tools.
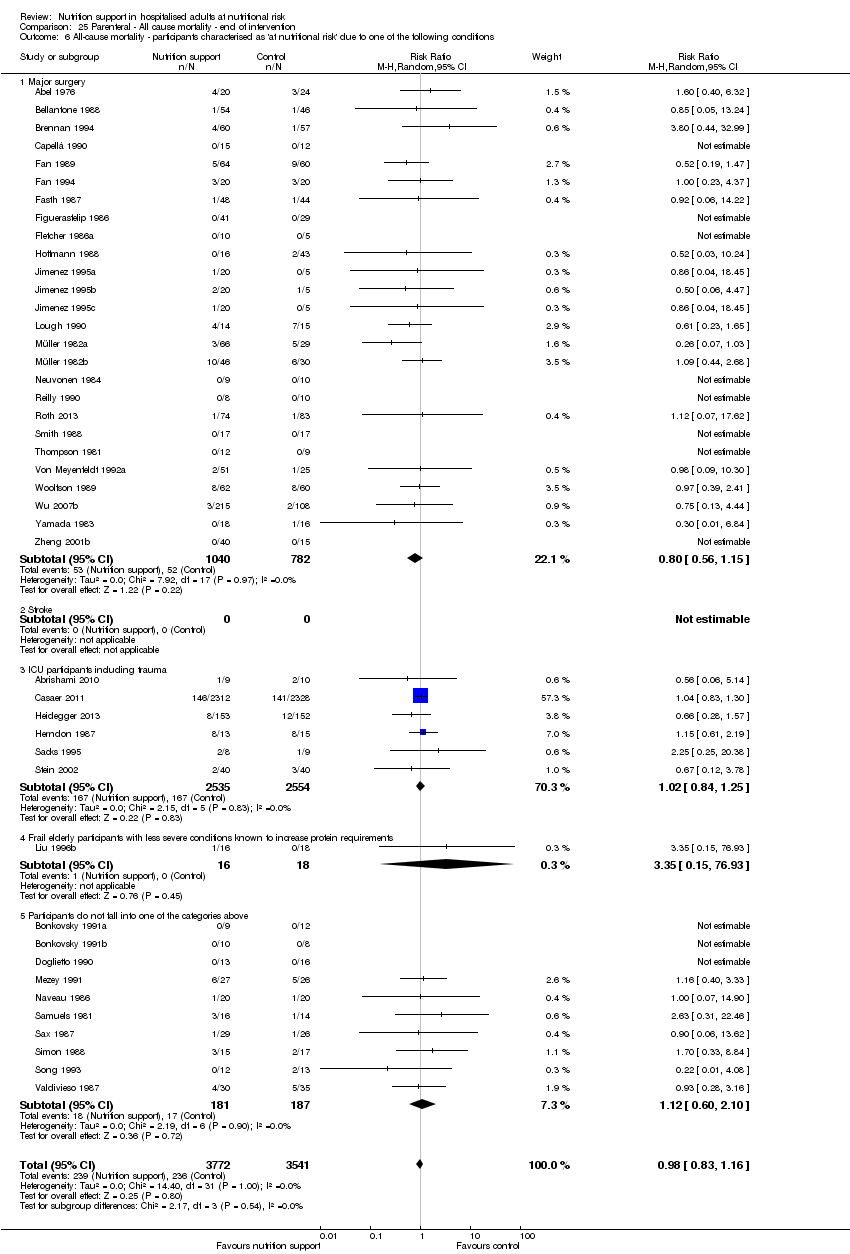
Comparison 25 Parenteral ‐ All cause mortality ‐ end of intervention, Outcome 6 All‐cause mortality ‐ participants characterised as 'at nutritional risk' due to one of the following conditions.

Comparison 25 Parenteral ‐ All cause mortality ‐ end of intervention, Outcome 7 All‐cause mortality ‐ participants characterised as 'at nutritional risk' due to one of the following criteria.
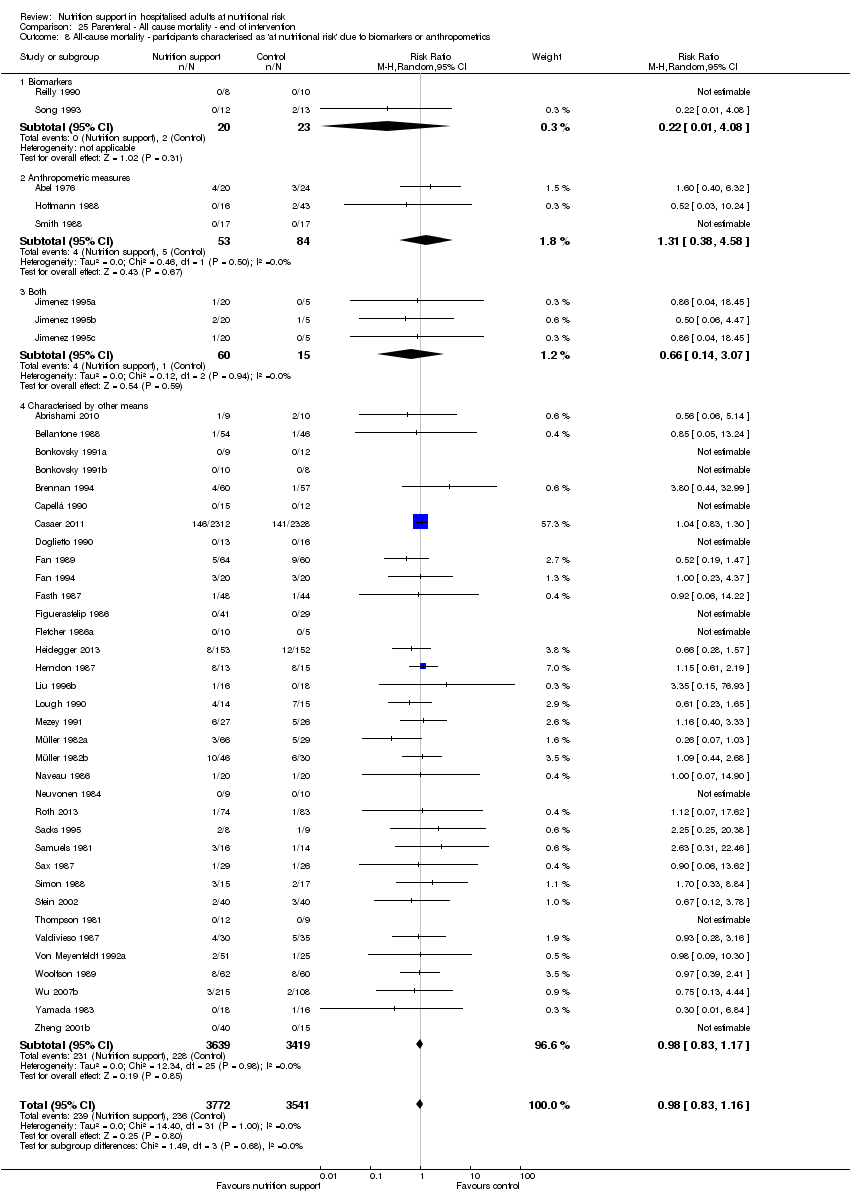
Comparison 25 Parenteral ‐ All cause mortality ‐ end of intervention, Outcome 8 All‐cause mortality ‐ participants characterised as 'at nutritional risk' due to biomarkers or anthropometrics.

Comparison 25 Parenteral ‐ All cause mortality ‐ end of intervention, Outcome 9 All‐cause mortality ‐ randomisation year.

Comparison 25 Parenteral ‐ All cause mortality ‐ end of intervention, Outcome 10 All‐cause mortality ‐ trials where the intervention lasts fewer than three days compared with trials where the intervention lasts three days or more.

Comparison 25 Parenteral ‐ All cause mortality ‐ end of intervention, Outcome 11 All‐cause mortality ‐ 'best‐worst case' scenario.

Comparison 25 Parenteral ‐ All cause mortality ‐ end of intervention, Outcome 12 All‐cause mortality ‐ 'worst‐best case' scenario.
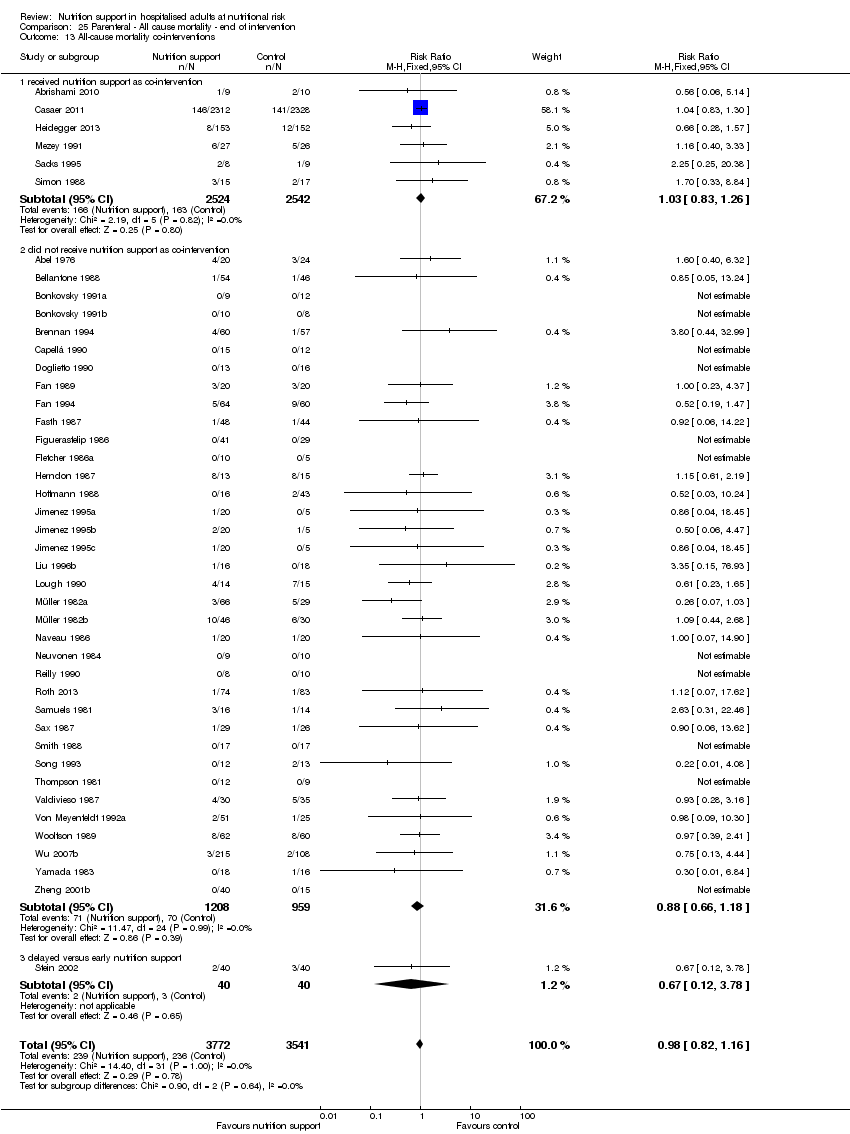
Comparison 25 Parenteral ‐ All cause mortality ‐ end of intervention, Outcome 13 All‐cause mortality co‐interventions.

Comparison 26 Parenteral ‐ All cause mortality ‐ maximum follow‐up, Outcome 1 All‐cause mortality ‐ overall.
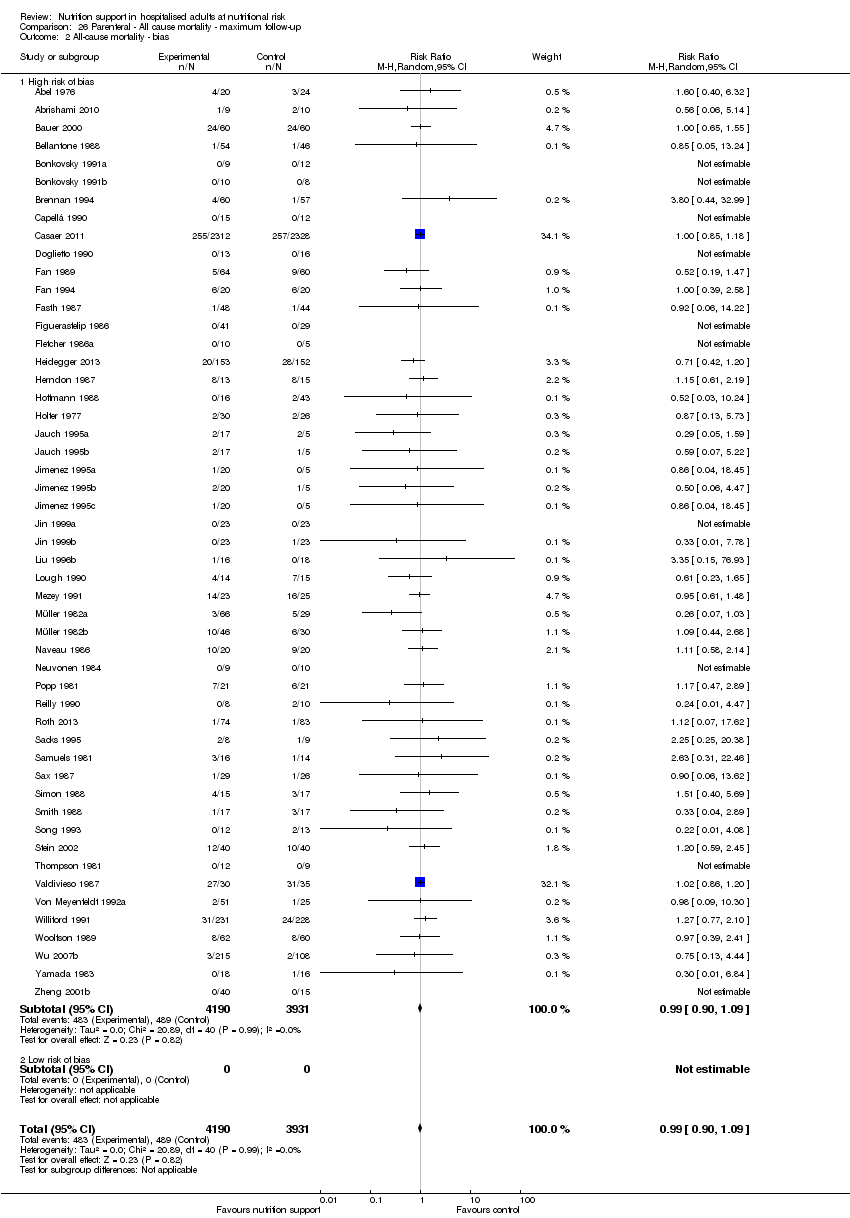
Comparison 26 Parenteral ‐ All cause mortality ‐ maximum follow‐up, Outcome 2 All‐cause mortality ‐ bias.

Comparison 26 Parenteral ‐ All cause mortality ‐ maximum follow‐up, Outcome 3 All‐cause mortality ‐ medical speciality.
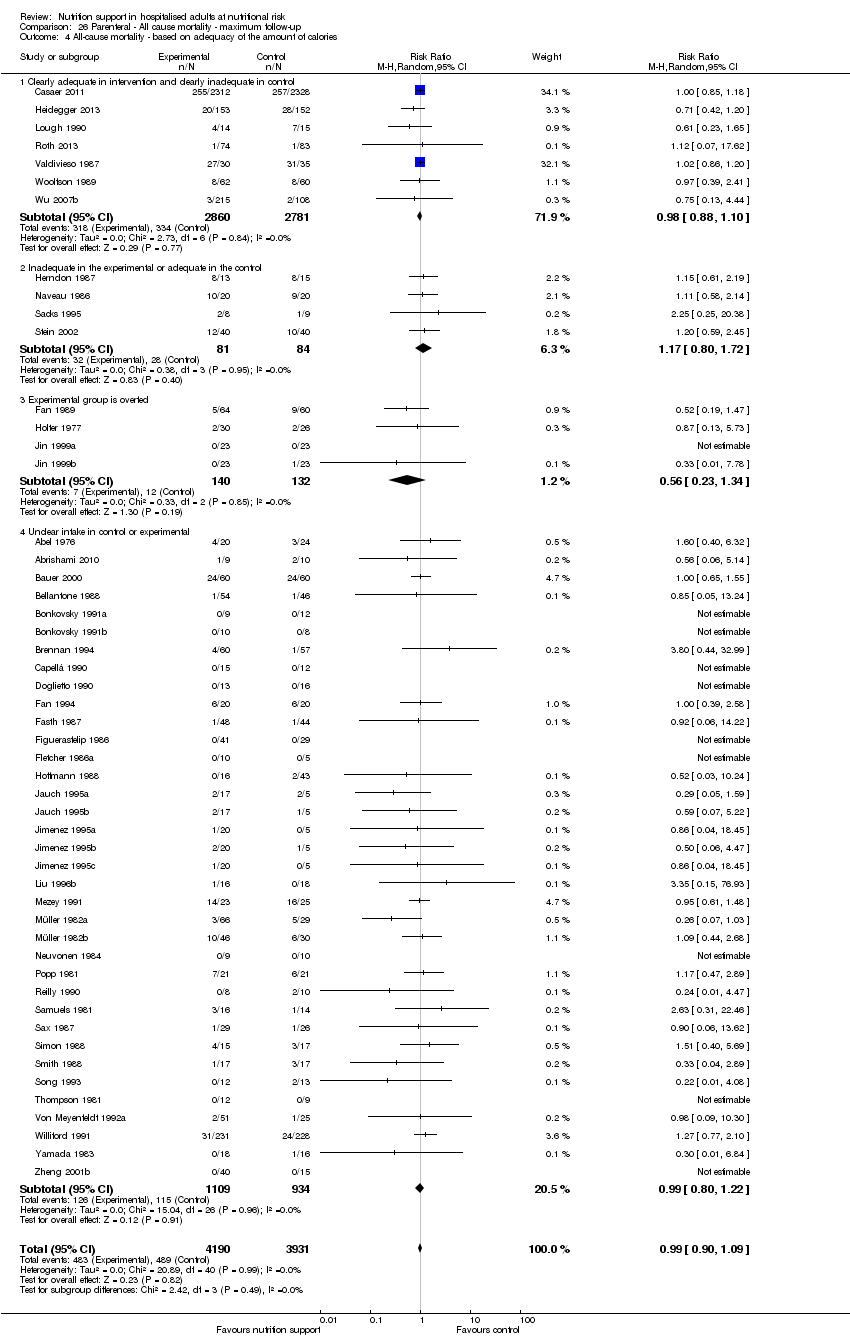
Comparison 26 Parenteral ‐ All cause mortality ‐ maximum follow‐up, Outcome 4 All‐cause mortality ‐ based on adequacy of the amount of calories.

Comparison 26 Parenteral ‐ All cause mortality ‐ maximum follow‐up, Outcome 5 All‐cause mortality ‐ different screening tools.

Comparison 26 Parenteral ‐ All cause mortality ‐ maximum follow‐up, Outcome 6 All‐cause mortality ‐ participants characterised as 'at nutritional risk' due to one of the following conditions.
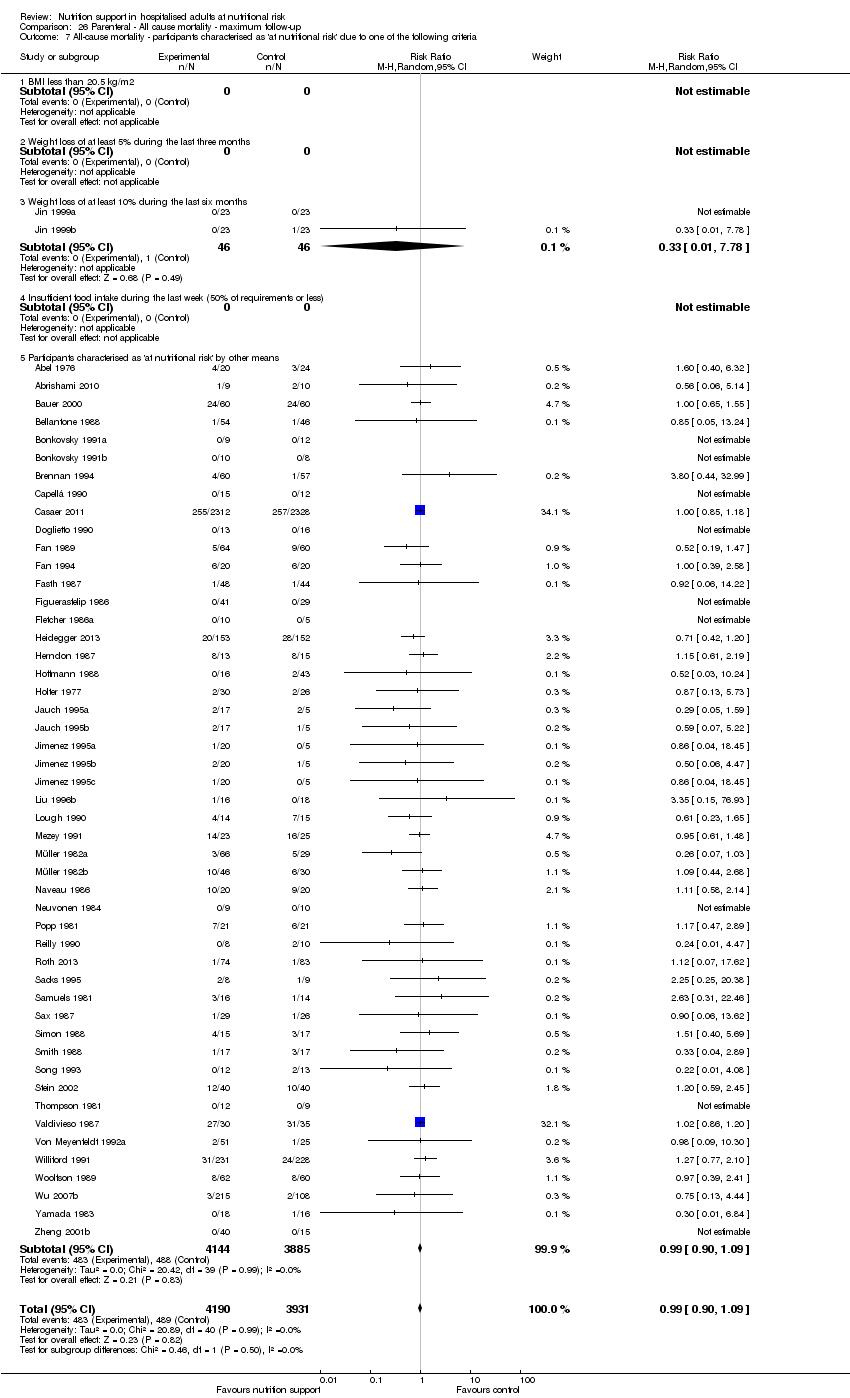
Comparison 26 Parenteral ‐ All cause mortality ‐ maximum follow‐up, Outcome 7 All‐cause mortality ‐ participants characterised as 'at nutritional risk' due to one of the following criteria.

Comparison 26 Parenteral ‐ All cause mortality ‐ maximum follow‐up, Outcome 8 All‐cause mortality ‐ participants characterised as 'at nutritional risk' due to biomarkers or anthropometrics.

Comparison 26 Parenteral ‐ All cause mortality ‐ maximum follow‐up, Outcome 9 All‐cause mortality ‐ randomisation year.
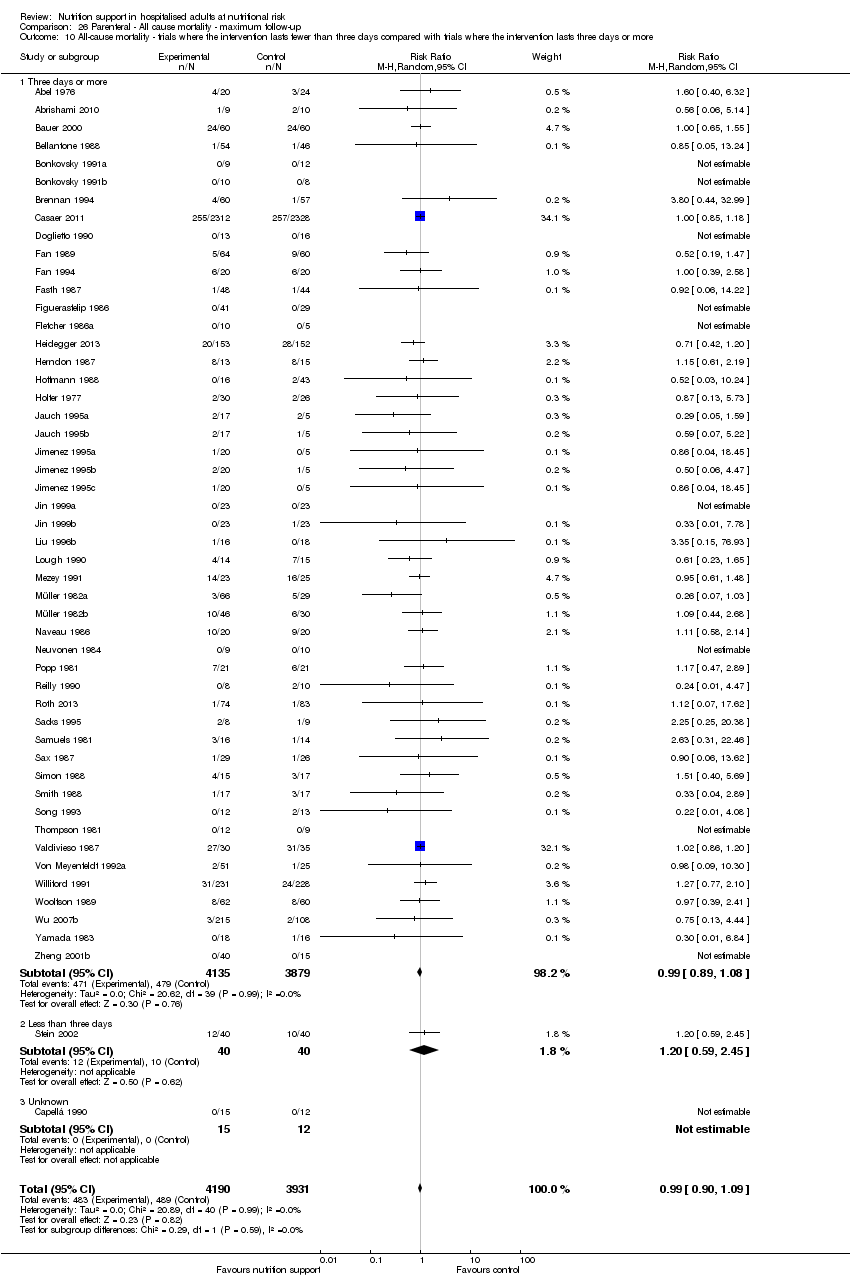
Comparison 26 Parenteral ‐ All cause mortality ‐ maximum follow‐up, Outcome 10 All‐cause mortality ‐ trials where the intervention lasts fewer than three days compared with trials where the intervention lasts three days or more.

Comparison 26 Parenteral ‐ All cause mortality ‐ maximum follow‐up, Outcome 11 All‐cause mortality ‐ 'best‐worst case' scenario.

Comparison 26 Parenteral ‐ All cause mortality ‐ maximum follow‐up, Outcome 12 All‐cause mortality ‐ 'worst‐best case' scenario.

Comparison 26 Parenteral ‐ All cause mortality ‐ maximum follow‐up, Outcome 13 All‐cause mortality co‐interventions.
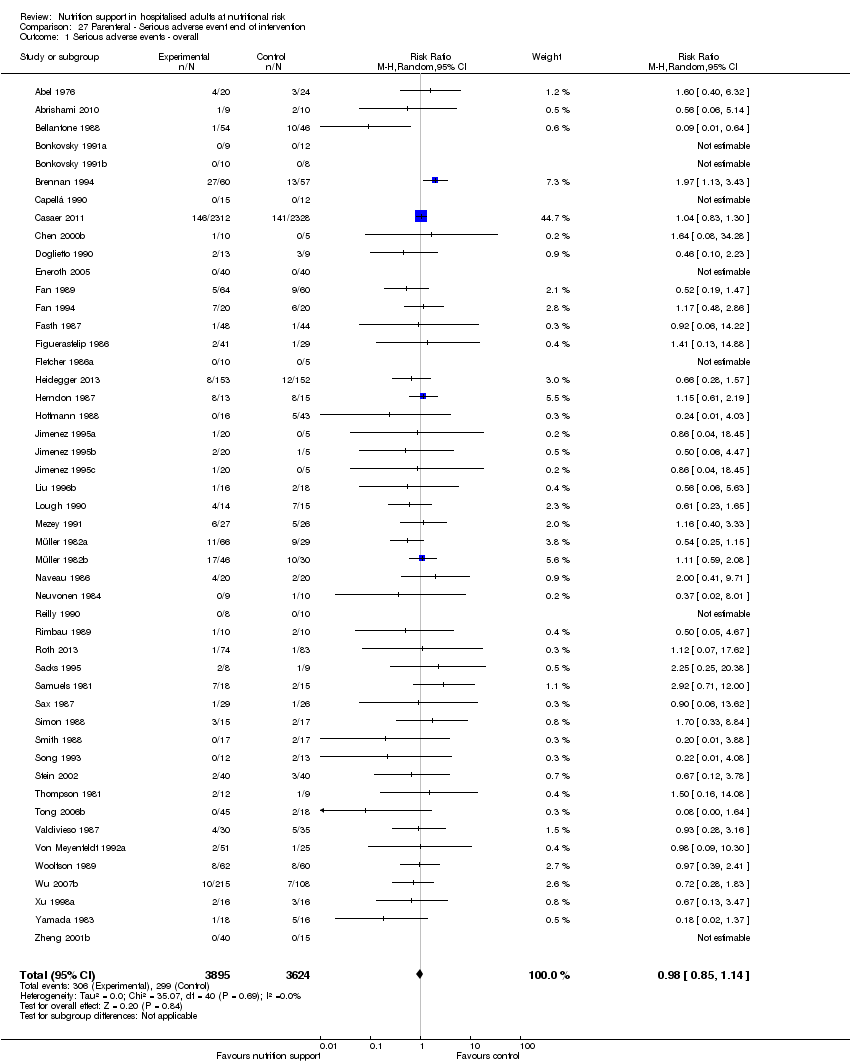
Comparison 27 Parenteral ‐ Serious adverse event end of intervention, Outcome 1 Serious adverse events ‐ overall.

Comparison 27 Parenteral ‐ Serious adverse event end of intervention, Outcome 2 Serious adverse events ‐ bias.

Comparison 27 Parenteral ‐ Serious adverse event end of intervention, Outcome 3 Serious adverse events ‐ by medical specialty.

Comparison 27 Parenteral ‐ Serious adverse event end of intervention, Outcome 4 Serious adverse events ‐ based on adequacy of the amount of calories.

Comparison 27 Parenteral ‐ Serious adverse event end of intervention, Outcome 5 Serious adverse events ‐ different screening tools.

Comparison 27 Parenteral ‐ Serious adverse event end of intervention, Outcome 6 Serious adverse events ‐ participants characterised as 'at nutritional risk' due to one of the following conditions.

Comparison 27 Parenteral ‐ Serious adverse event end of intervention, Outcome 7 Serious adverse events ‐ participants characterised as 'at nutritional risk' due to one of the following criteria.

Comparison 27 Parenteral ‐ Serious adverse event end of intervention, Outcome 8 Serious adverse events ‐ participants characterised as 'at nutritional risk' due to biomarkers or anthropometrics.

Comparison 27 Parenteral ‐ Serious adverse event end of intervention, Outcome 9 Serious adverse events ‐ randomisation year.
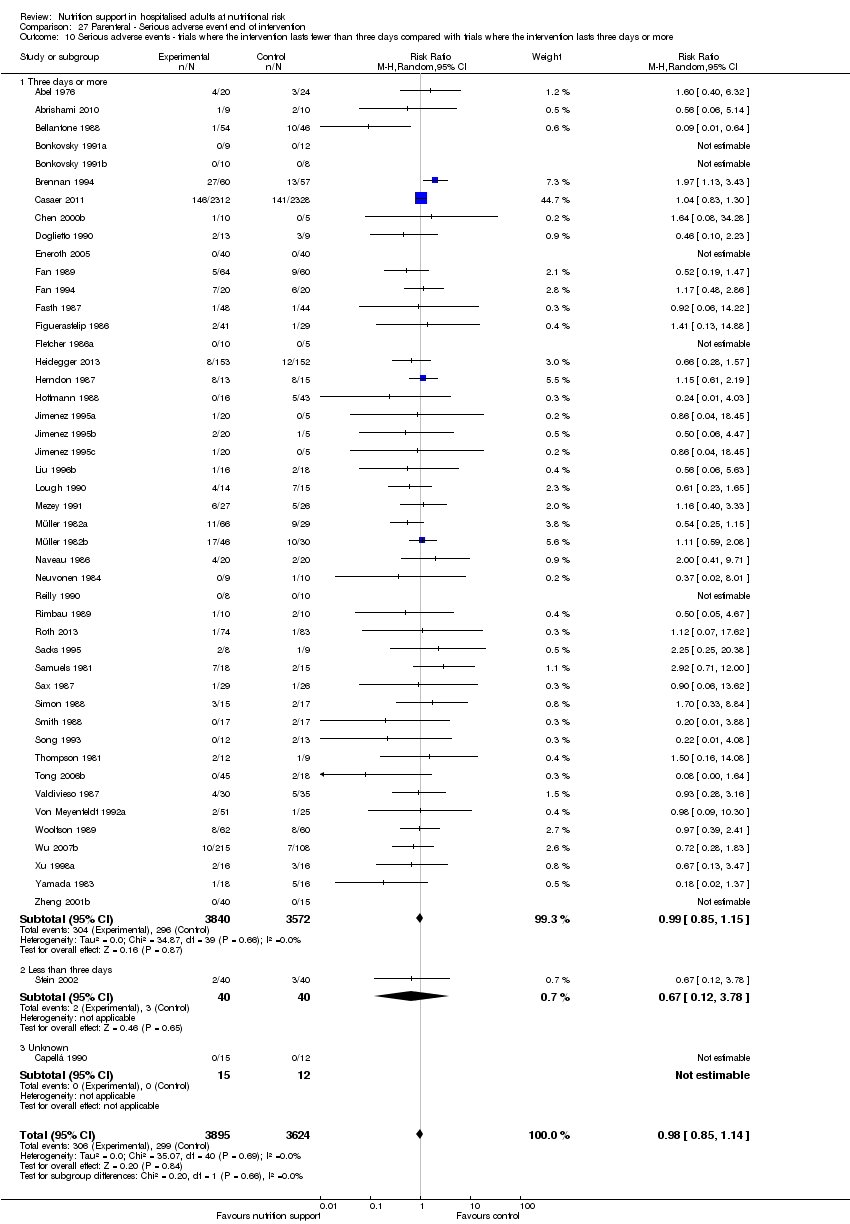
Comparison 27 Parenteral ‐ Serious adverse event end of intervention, Outcome 10 Serious adverse events ‐ trials where the intervention lasts fewer than three days compared with trials where the intervention lasts three days or more.

Comparison 27 Parenteral ‐ Serious adverse event end of intervention, Outcome 11 Serious adverse events ‐ 'best‐worst case' scenario.
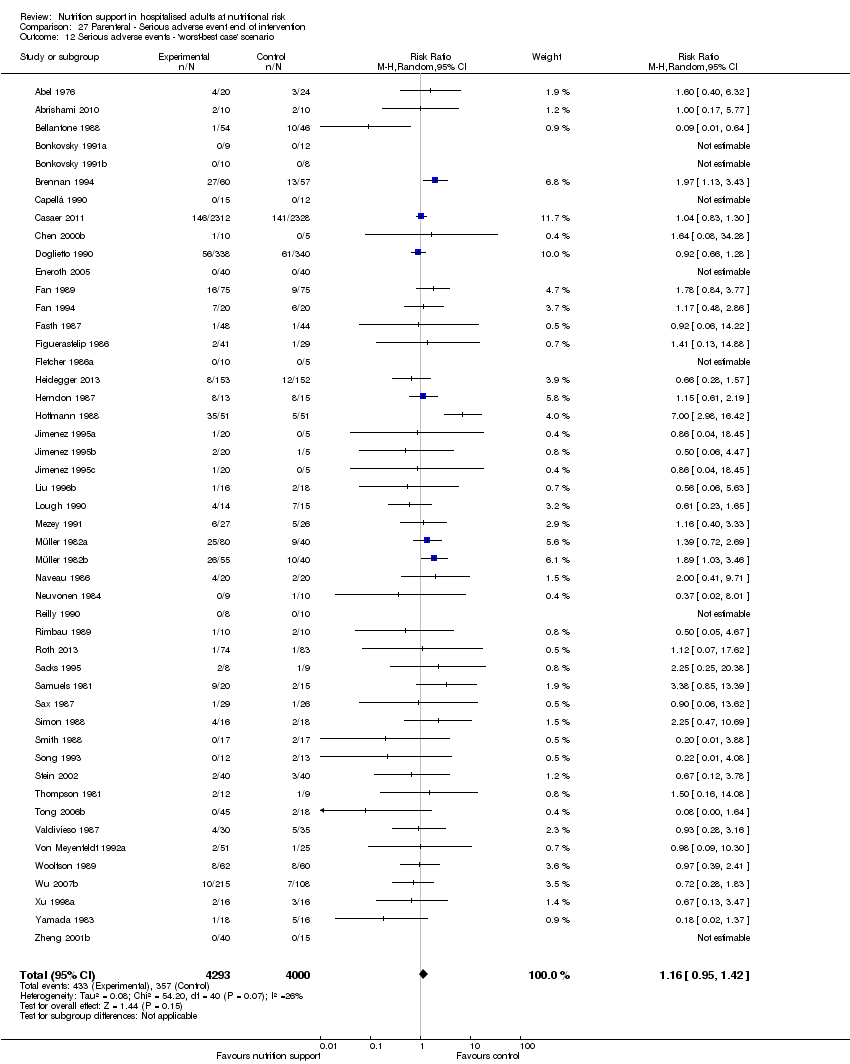
Comparison 27 Parenteral ‐ Serious adverse event end of intervention, Outcome 12 Serious adverse events ‐ 'worst‐best case' scenario.

Comparison 27 Parenteral ‐ Serious adverse event end of intervention, Outcome 13 Serious adverse events co‐interventions.

Comparison 28 Parenteral ‐ Serious adverse event maximum follow‐up, Outcome 1 Serious adverse events ‐ overall.
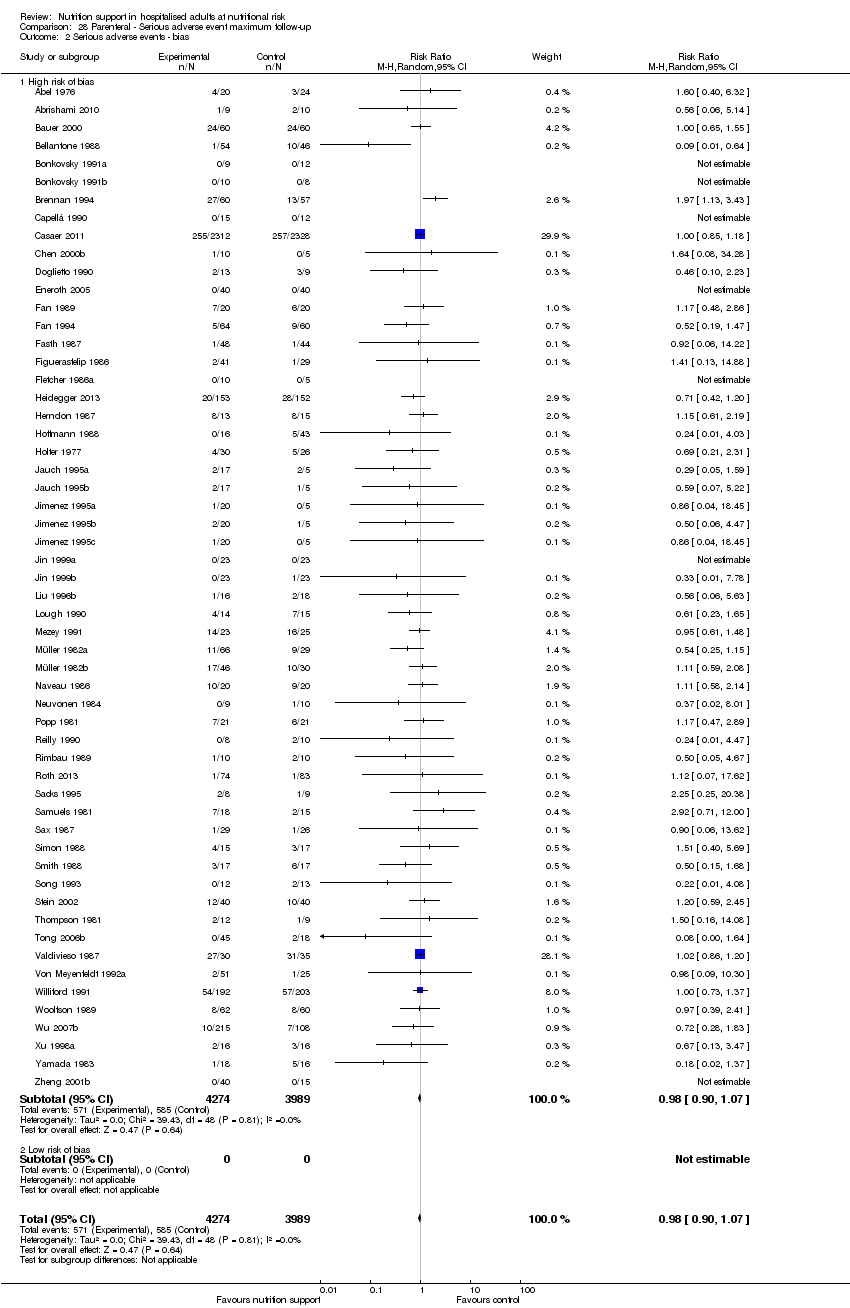
Comparison 28 Parenteral ‐ Serious adverse event maximum follow‐up, Outcome 2 Serious adverse events ‐ bias.

Comparison 28 Parenteral ‐ Serious adverse event maximum follow‐up, Outcome 3 Serious adverse events ‐ by medical speciality.

Comparison 28 Parenteral ‐ Serious adverse event maximum follow‐up, Outcome 4 Serious adverse events ‐ based on adequacy of the amount of calories.

Comparison 28 Parenteral ‐ Serious adverse event maximum follow‐up, Outcome 5 Serious adverse events ‐ different screening tools.
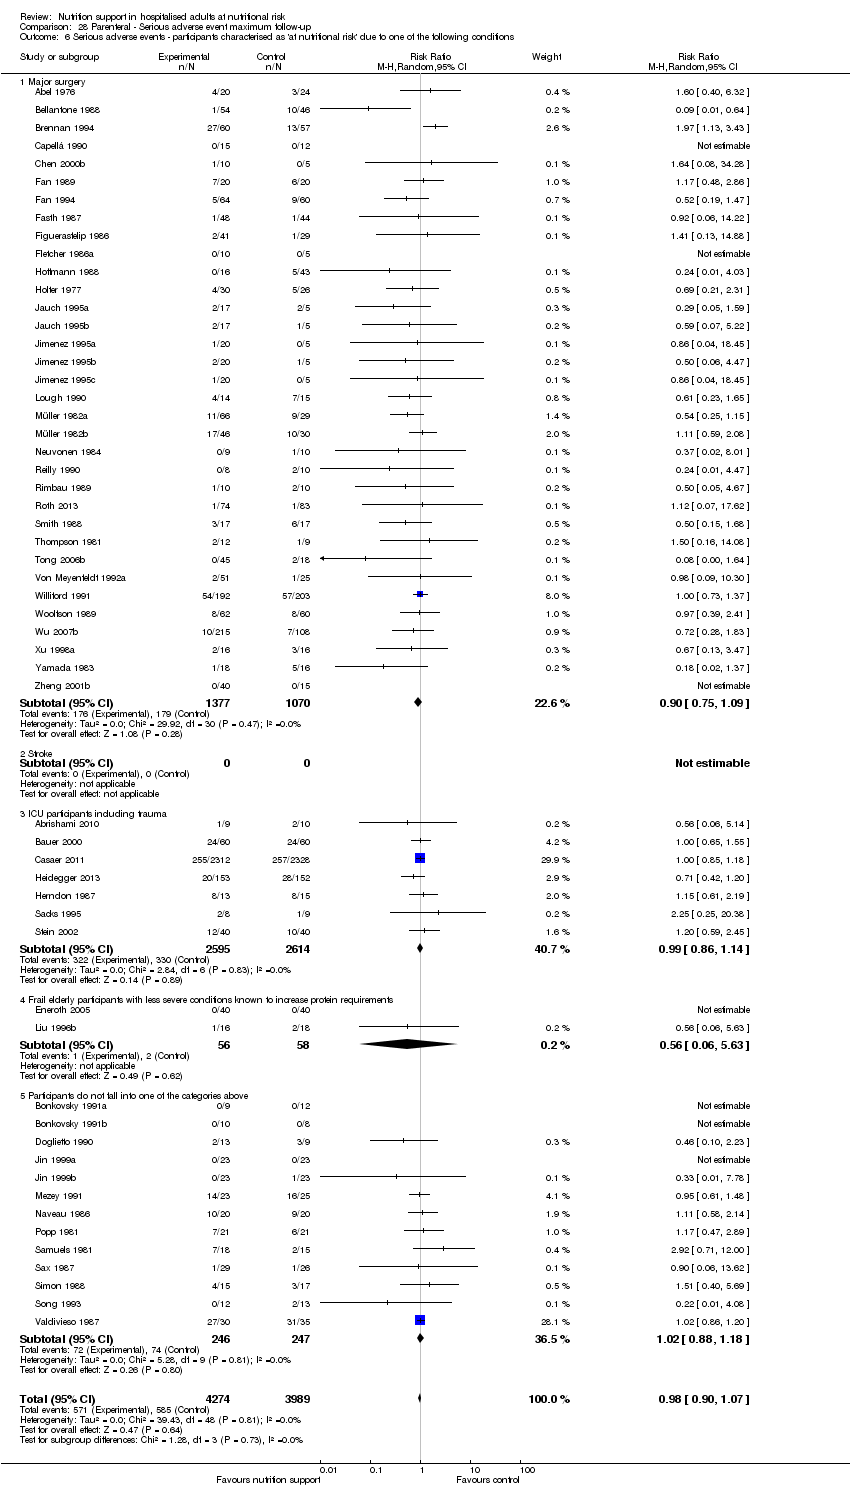
Comparison 28 Parenteral ‐ Serious adverse event maximum follow‐up, Outcome 6 Serious adverse events ‐ participants characterised as 'at nutritional risk' due to one of the following conditions.

Comparison 28 Parenteral ‐ Serious adverse event maximum follow‐up, Outcome 7 Serious adverse events ‐ participants characterised as 'at nutritional risk' due to one of the following criteria.
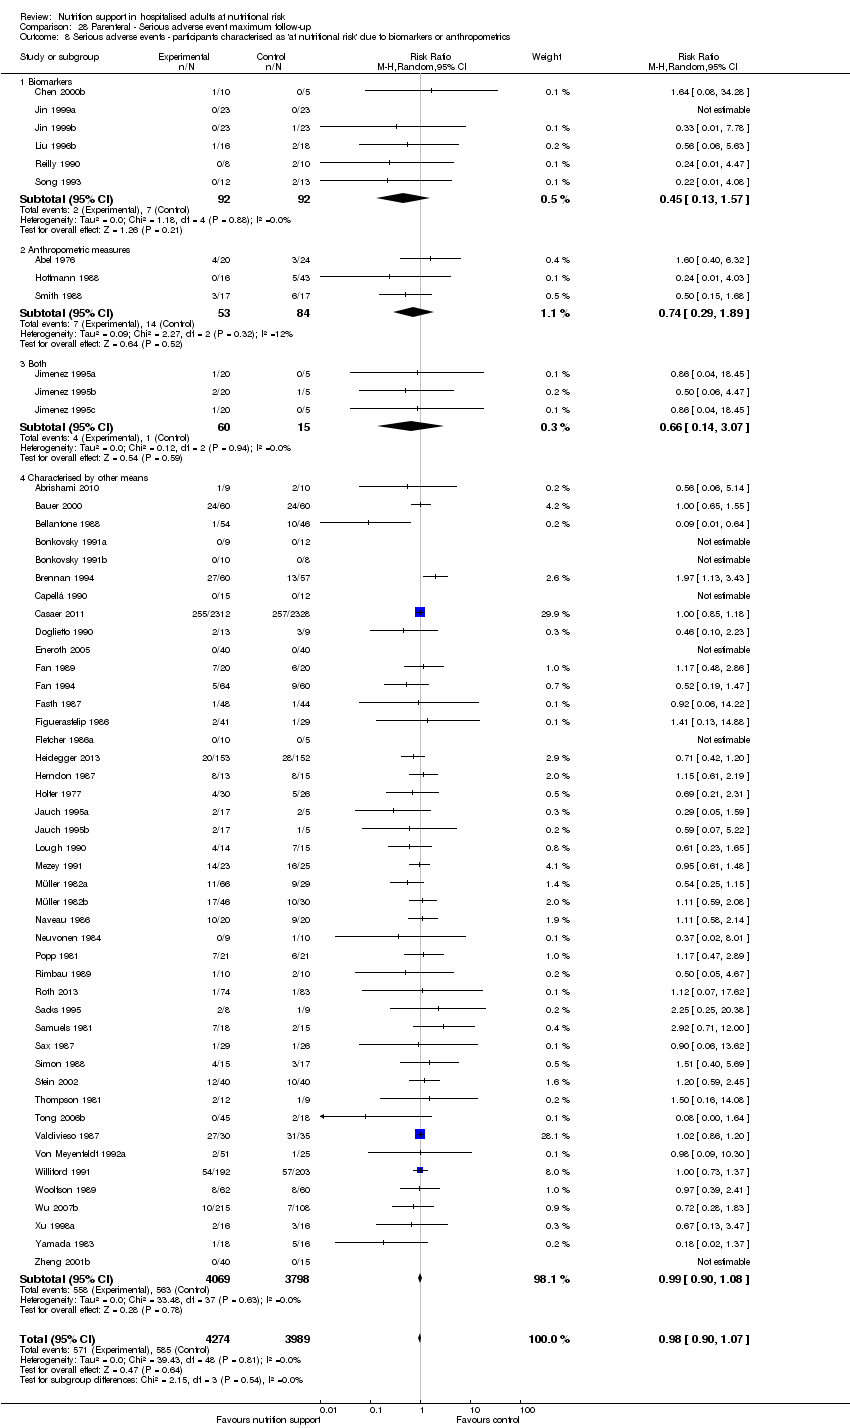
Comparison 28 Parenteral ‐ Serious adverse event maximum follow‐up, Outcome 8 Serious adverse events ‐ participants characterised as 'at nutritional risk' due to biomarkers or anthropometrics.
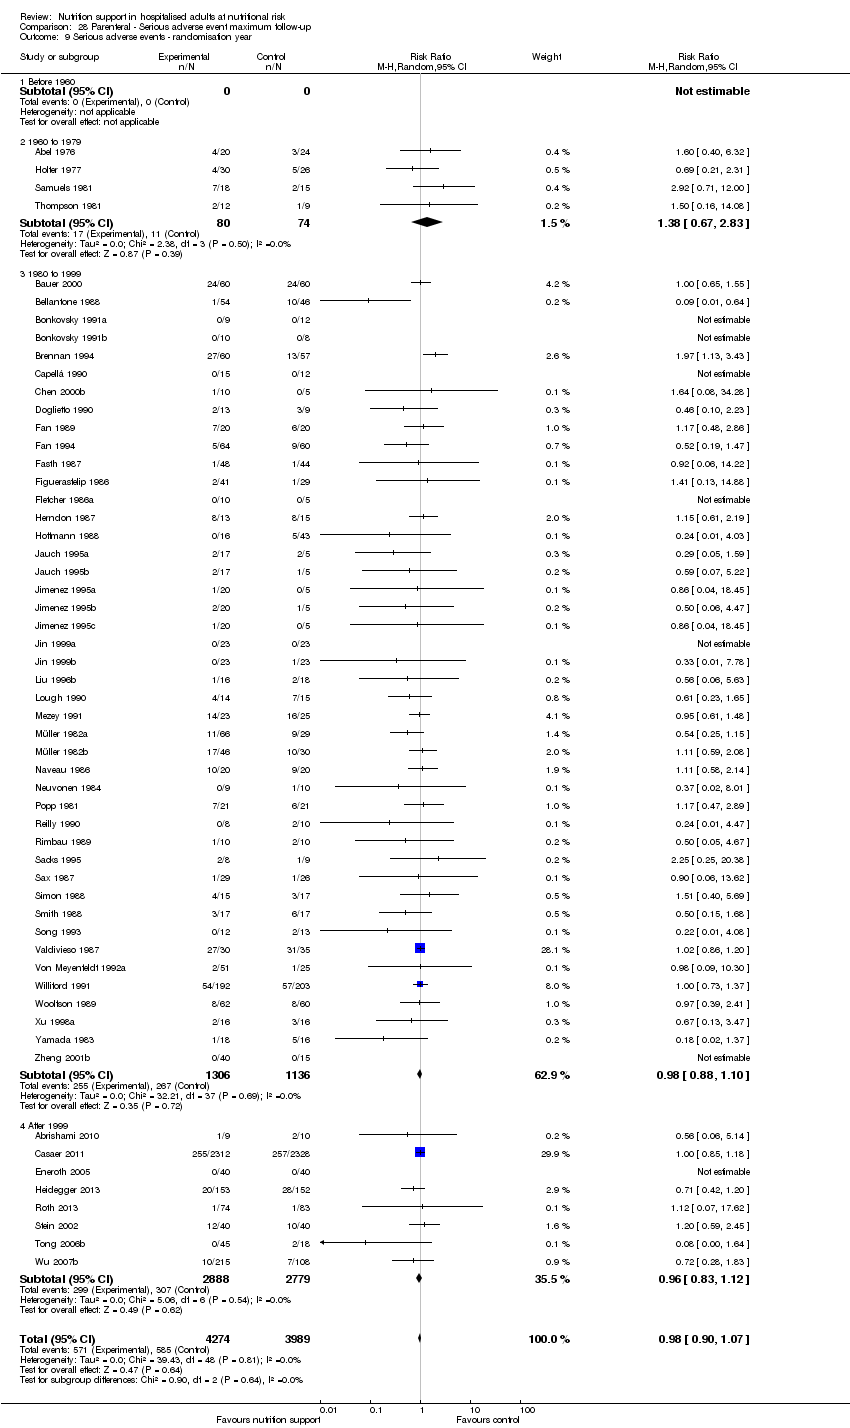
Comparison 28 Parenteral ‐ Serious adverse event maximum follow‐up, Outcome 9 Serious adverse events ‐ randomisation year.

Comparison 28 Parenteral ‐ Serious adverse event maximum follow‐up, Outcome 10 Serious adverse events ‐ trials where the intervention lasts fewer than three days compared with trials where the intervention lasts three days or more.

Comparison 28 Parenteral ‐ Serious adverse event maximum follow‐up, Outcome 11 Serious adverse events ‐ 'best‐worst case' scenario.

Comparison 28 Parenteral ‐ Serious adverse event maximum follow‐up, Outcome 12 Serious adverse events ‐ 'worst‐best case' scenario.
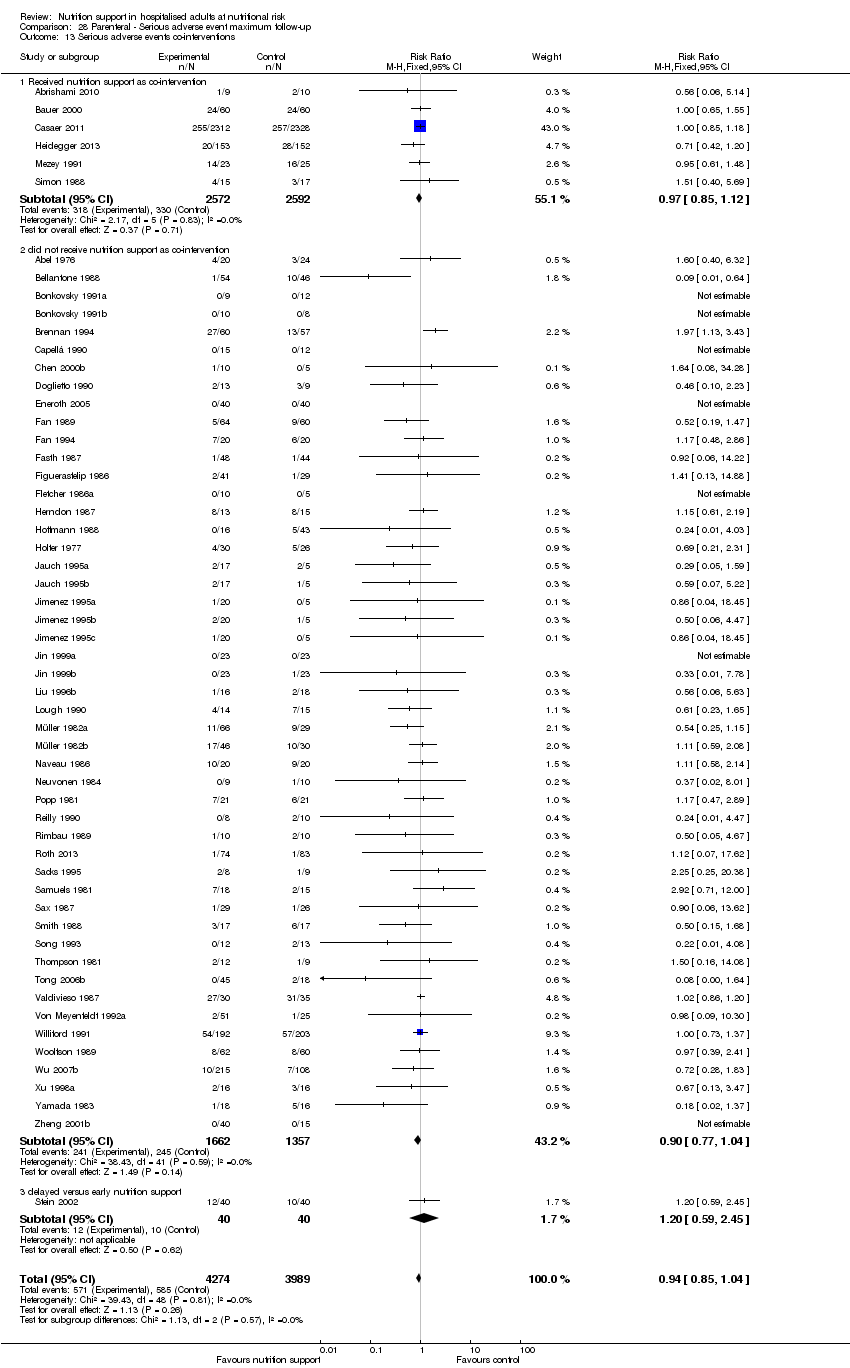
Comparison 28 Parenteral ‐ Serious adverse event maximum follow‐up, Outcome 13 Serious adverse events co‐interventions.

Comparison 29 Morbidity ‐ end of intervention, Outcome 1 Morbidity ‐ overall.

Comparison 30 Morbidity ‐ maximum follow‐up, Outcome 1 Morbidity ‐ overall.

Comparison 31 BMI ‐ end of intervention, Outcome 1 BMI ‐ overall.

Comparison 31 BMI ‐ end of intervention, Outcome 2 BMI ‐ bias.

Comparison 31 BMI ‐ end of intervention, Outcome 3 BMI ‐ mode of administration.

Comparison 31 BMI ‐ end of intervention, Outcome 4 BMI ‐ by medical delivery.
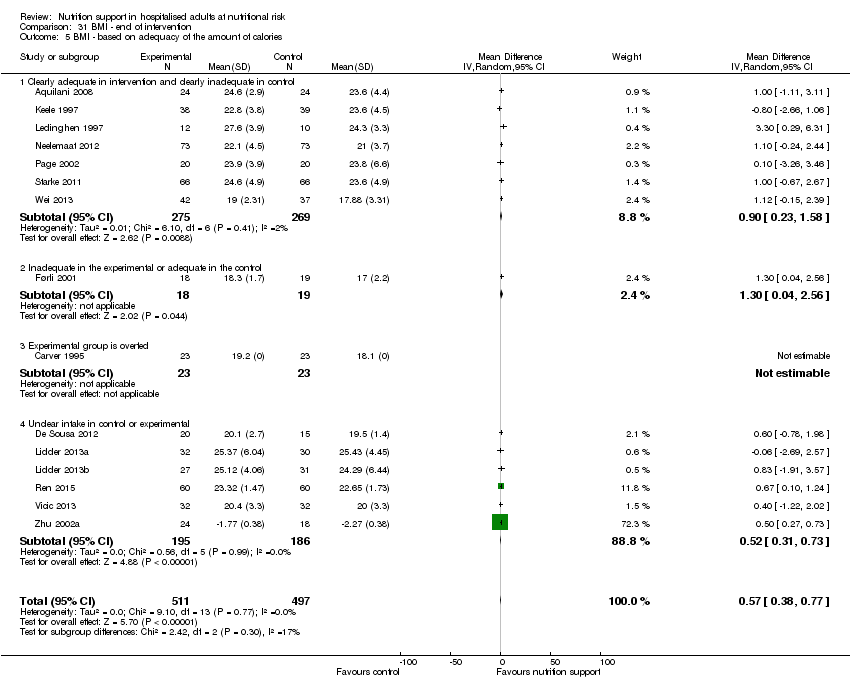
Comparison 31 BMI ‐ end of intervention, Outcome 5 BMI ‐ based on adequacy of the amount of calories.

Comparison 31 BMI ‐ end of intervention, Outcome 6 BMI ‐ different screening tools.
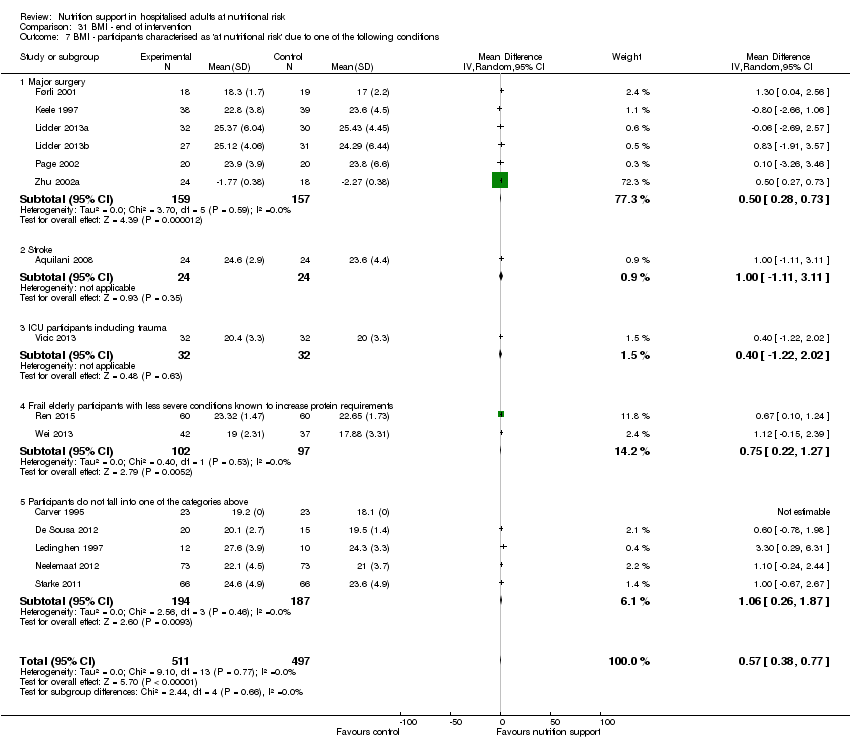
Comparison 31 BMI ‐ end of intervention, Outcome 7 BMI ‐ participants characterised as 'at nutritional risk' due to one of the following conditions.

Comparison 31 BMI ‐ end of intervention, Outcome 8 BMI ‐ participants characterised as 'at nutritional risk' due to one of the following criteria.

Comparison 31 BMI ‐ end of intervention, Outcome 9 BMI ‐ participants characterised as 'at nutritional risk' due to biomarkers of anthropometrics.

Comparison 31 BMI ‐ end of intervention, Outcome 10 BMI ‐ randomisation year.

Comparison 31 BMI ‐ end of intervention, Outcome 11 BMI ‐ trials where the intervention lasts fewer than three days compared with trials where the intervention lasts three days or more.

Comparison 32 BMI ‐ maximum follow‐up, Outcome 1 BMI ‐ overall.

Comparison 32 BMI ‐ maximum follow‐up, Outcome 2 BMI ‐ bias.

Comparison 32 BMI ‐ maximum follow‐up, Outcome 3 BMI ‐ mode of delivery.

Comparison 32 BMI ‐ maximum follow‐up, Outcome 4 BMI ‐ by medical speciality.

Comparison 32 BMI ‐ maximum follow‐up, Outcome 5 BMI ‐ based on adequacy of the amount of calories.

Comparison 32 BMI ‐ maximum follow‐up, Outcome 6 BMI ‐ different screening tools.

Comparison 32 BMI ‐ maximum follow‐up, Outcome 7 BMI ‐ participants characterised as 'at nutritional risk' due to one of the following conditions.

Comparison 32 BMI ‐ maximum follow‐up, Outcome 8 BMI ‐ participants characterised as 'at nutritional risk' due to one of the following criteria.
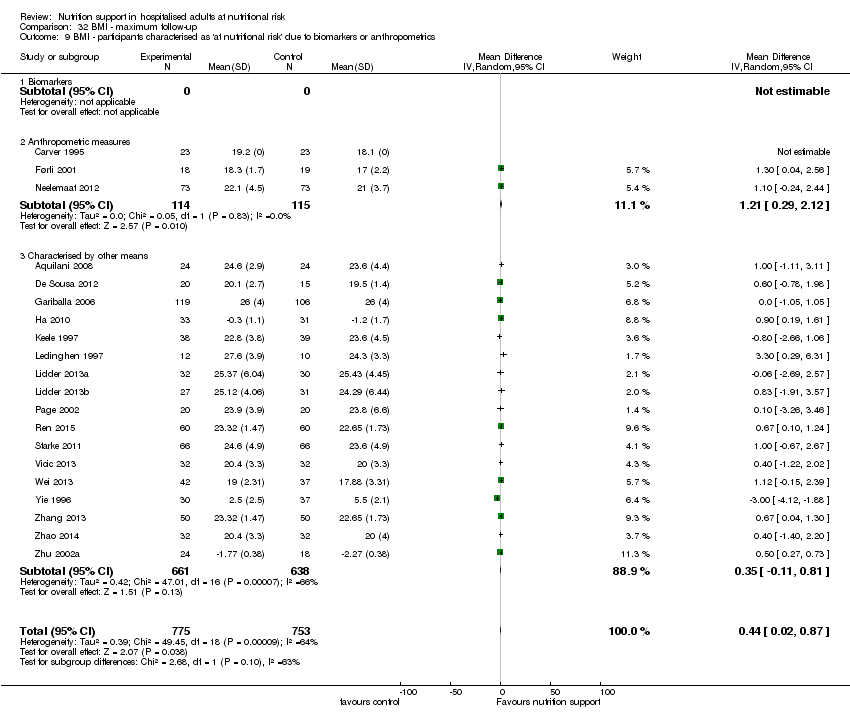
Comparison 32 BMI ‐ maximum follow‐up, Outcome 9 BMI ‐ participants characterised as 'at nutritional risk' due to biomarkers or anthropometrics.

Comparison 32 BMI ‐ maximum follow‐up, Outcome 10 BMI ‐ randomisation year.

Comparison 32 BMI ‐ maximum follow‐up, Outcome 11 BMI ‐ trials where the intervention lasts fewer than three days compared with trials where the intervention lasts three days or more.

Comparison 33 Weight ‐ end of intervention, Outcome 1 Weight ‐ overall.

Comparison 33 Weight ‐ end of intervention, Outcome 2 Weight ‐ bias.

Comparison 33 Weight ‐ end of intervention, Outcome 3 Weight ‐ mode of delivery.

Comparison 33 Weight ‐ end of intervention, Outcome 4 Weight ‐ by medical speciality.

Comparison 33 Weight ‐ end of intervention, Outcome 5 Weight ‐ based on adequacy of the amount of calories.

Comparison 33 Weight ‐ end of intervention, Outcome 6 Weight ‐ different screening tools.

Comparison 33 Weight ‐ end of intervention, Outcome 7 Weight ‐ participants characterised as 'at nutritional risk' due to one of the following conditions.
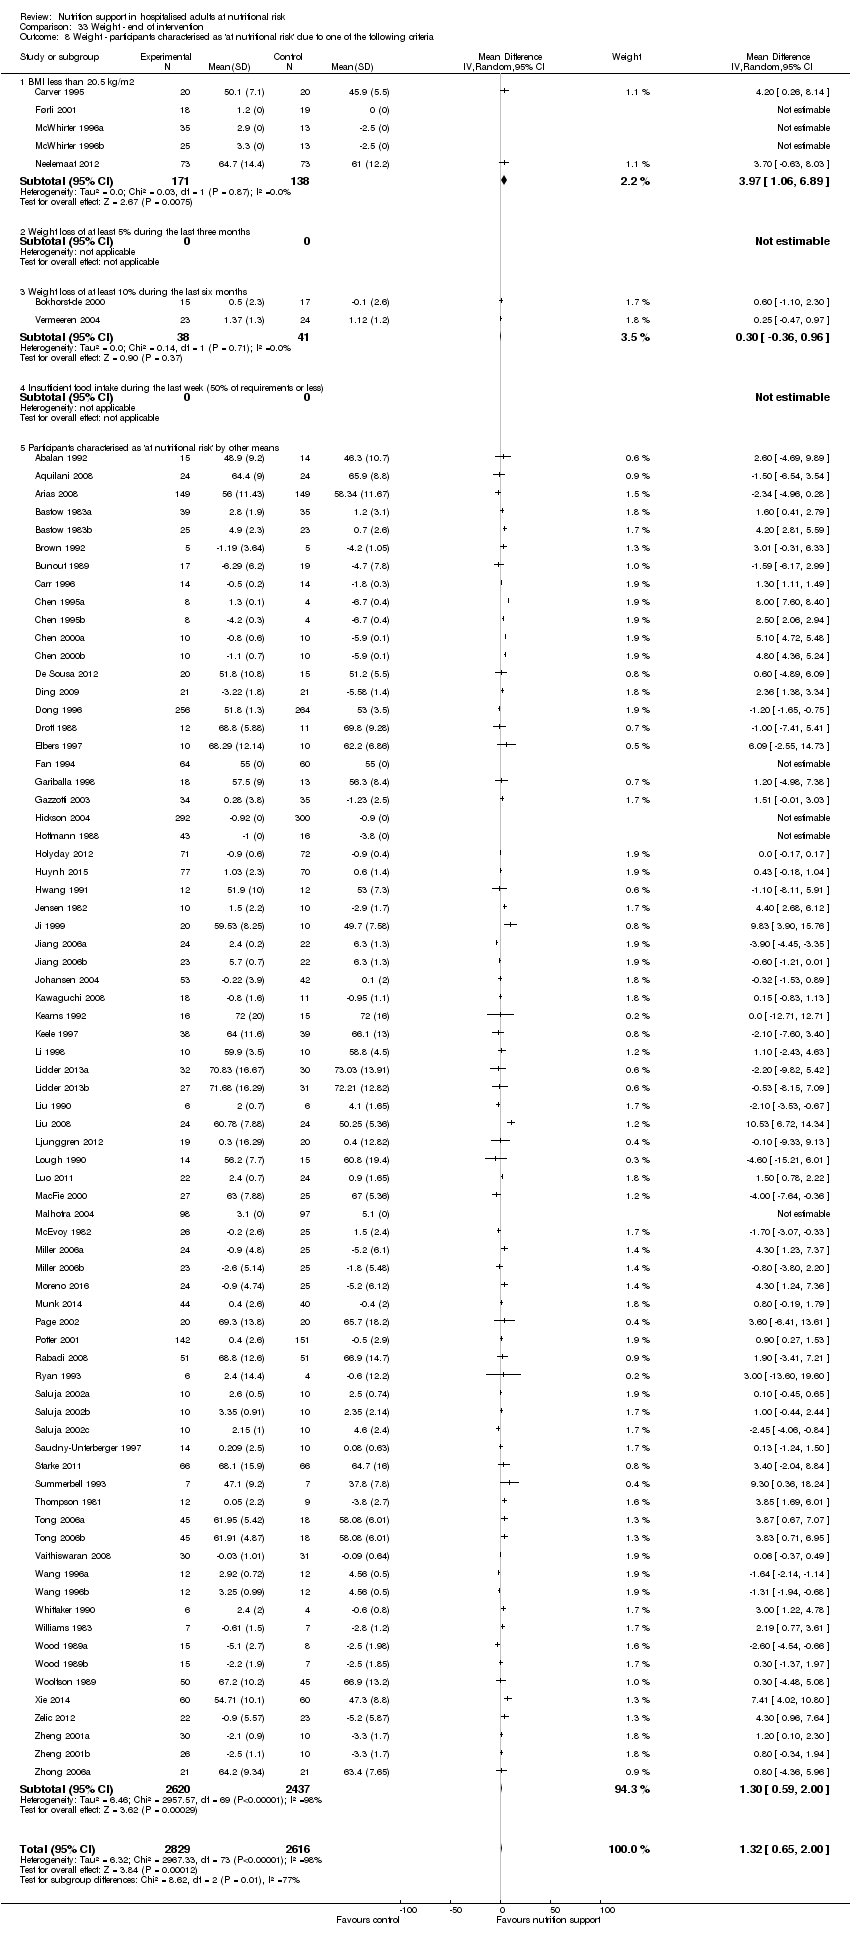
Comparison 33 Weight ‐ end of intervention, Outcome 8 Weight ‐ participants characterised as 'at nutritional risk' due to one of the following criteria.

Comparison 33 Weight ‐ end of intervention, Outcome 9 Weight ‐ participants characterised as 'at nutritional risk' due to biomarkers or anthropometrics.

Comparison 33 Weight ‐ end of intervention, Outcome 10 Weight ‐ randomisation year.
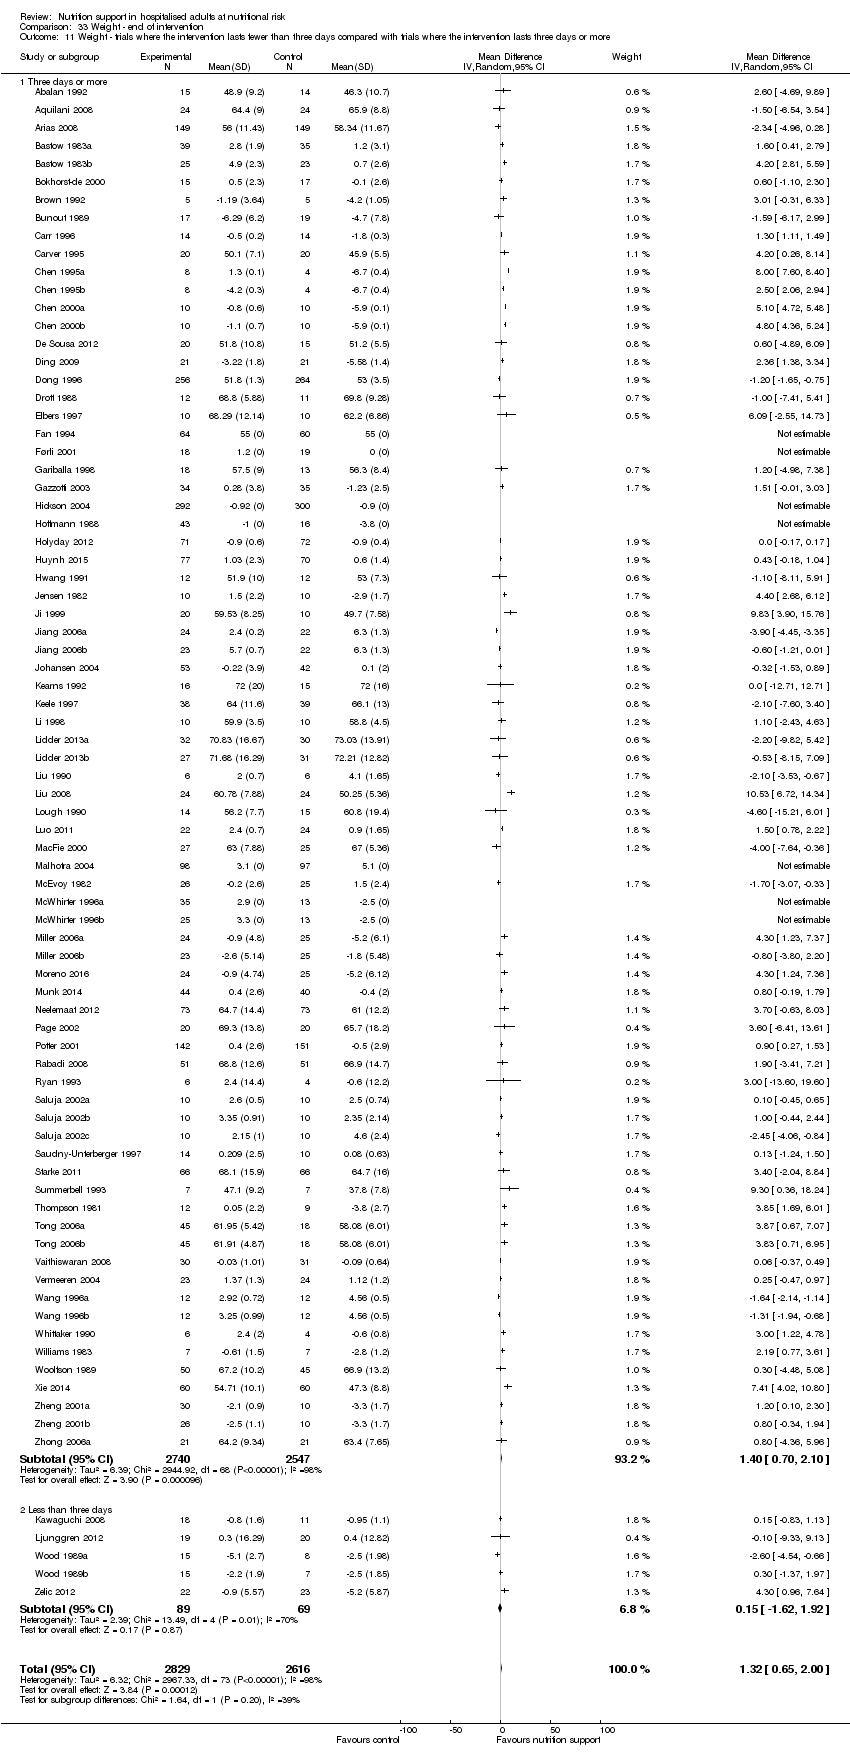
Comparison 33 Weight ‐ end of intervention, Outcome 11 Weight ‐ trials where the intervention lasts fewer than three days compared with trials where the intervention lasts three days or more.

Comparison 33 Weight ‐ end of intervention, Outcome 12 Weight ‐ Missing SDs.

Comparison 34 Weight ‐ maximum follow‐up, Outcome 1 Weight ‐ overall.

Comparison 34 Weight ‐ maximum follow‐up, Outcome 2 Weight ‐ bias.
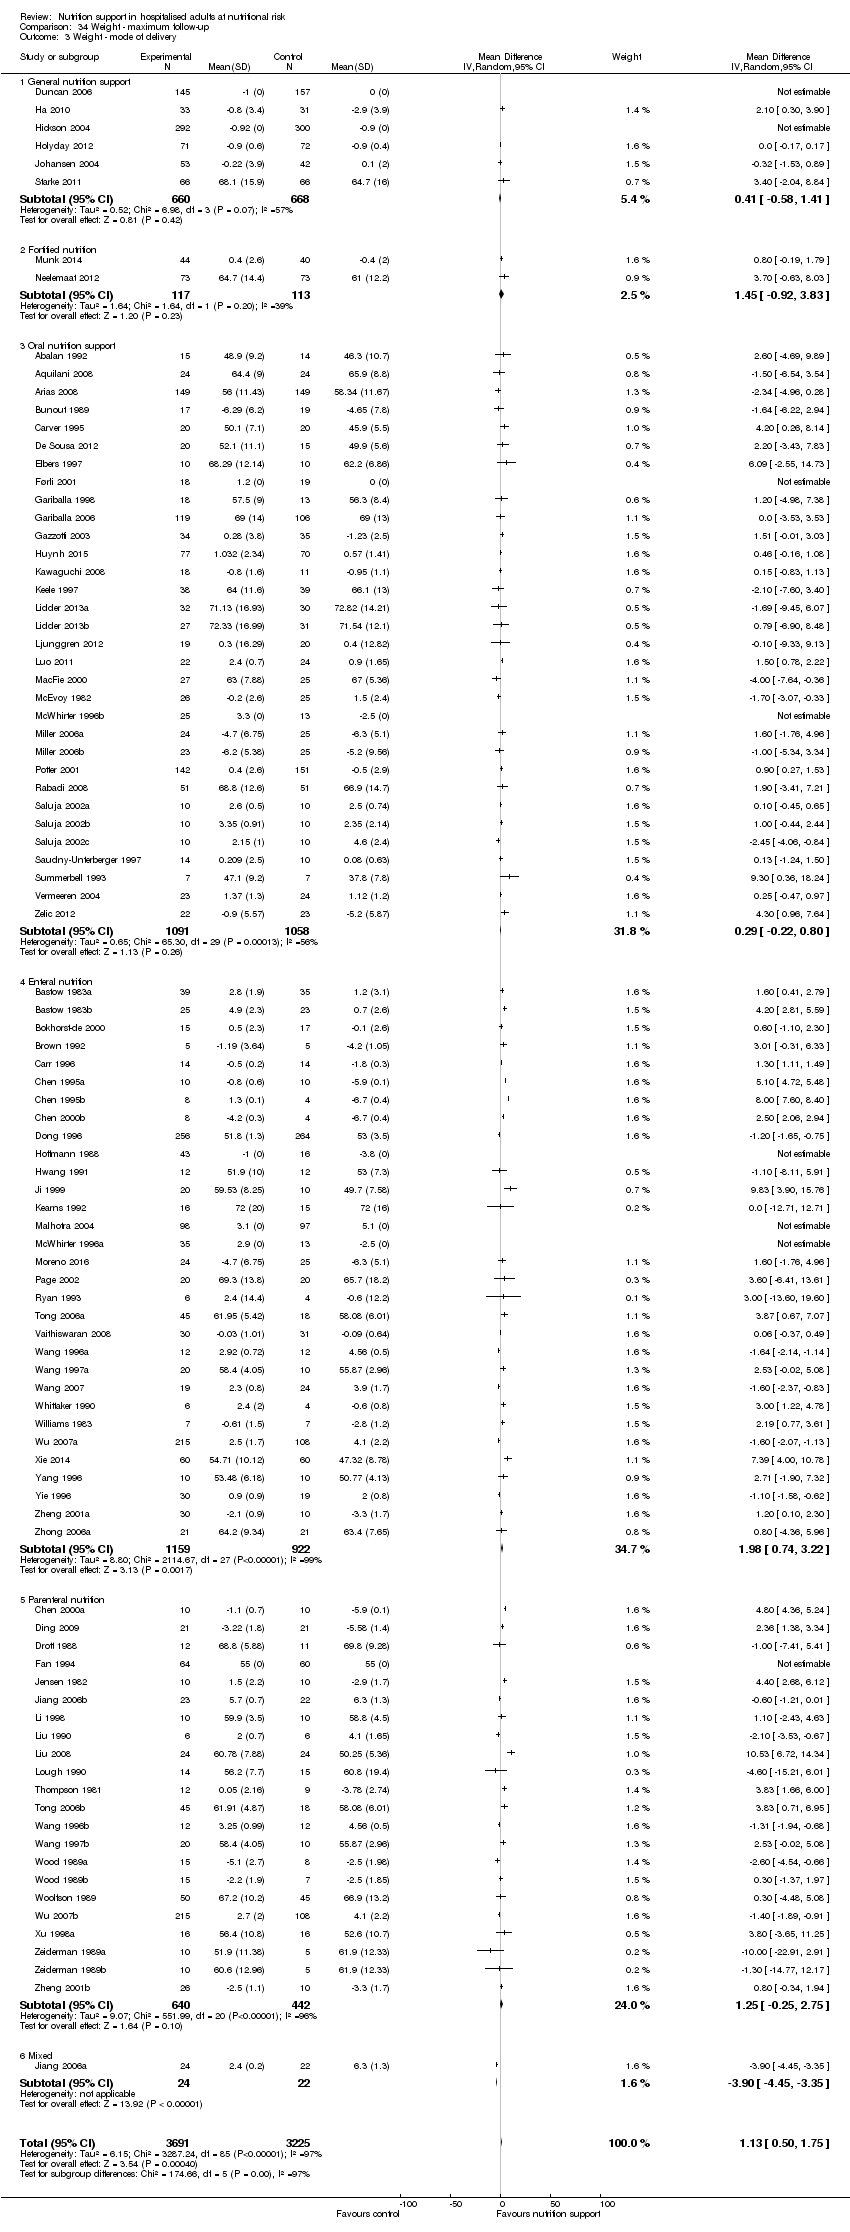
Comparison 34 Weight ‐ maximum follow‐up, Outcome 3 Weight ‐ mode of delivery.

Comparison 34 Weight ‐ maximum follow‐up, Outcome 4 Weight ‐ by medical speciality.

Comparison 34 Weight ‐ maximum follow‐up, Outcome 5 Weight ‐ based on adequacy of the amount of nutrition.

Comparison 34 Weight ‐ maximum follow‐up, Outcome 6 Weight ‐ different screening tools.

Comparison 34 Weight ‐ maximum follow‐up, Outcome 7 Weight ‐ participants characterised as 'at nutritional risk' due to one of the following conditions.

Comparison 34 Weight ‐ maximum follow‐up, Outcome 8 Weight ‐ participants characterised as 'at nutritional risk' due to one of the following criteria.

Comparison 34 Weight ‐ maximum follow‐up, Outcome 9 Weight ‐ participants characterised as 'at nutritional risk' due to biomarkers or anthropometrics.

Comparison 34 Weight ‐ maximum follow‐up, Outcome 10 Weight ‐ randomisation year.
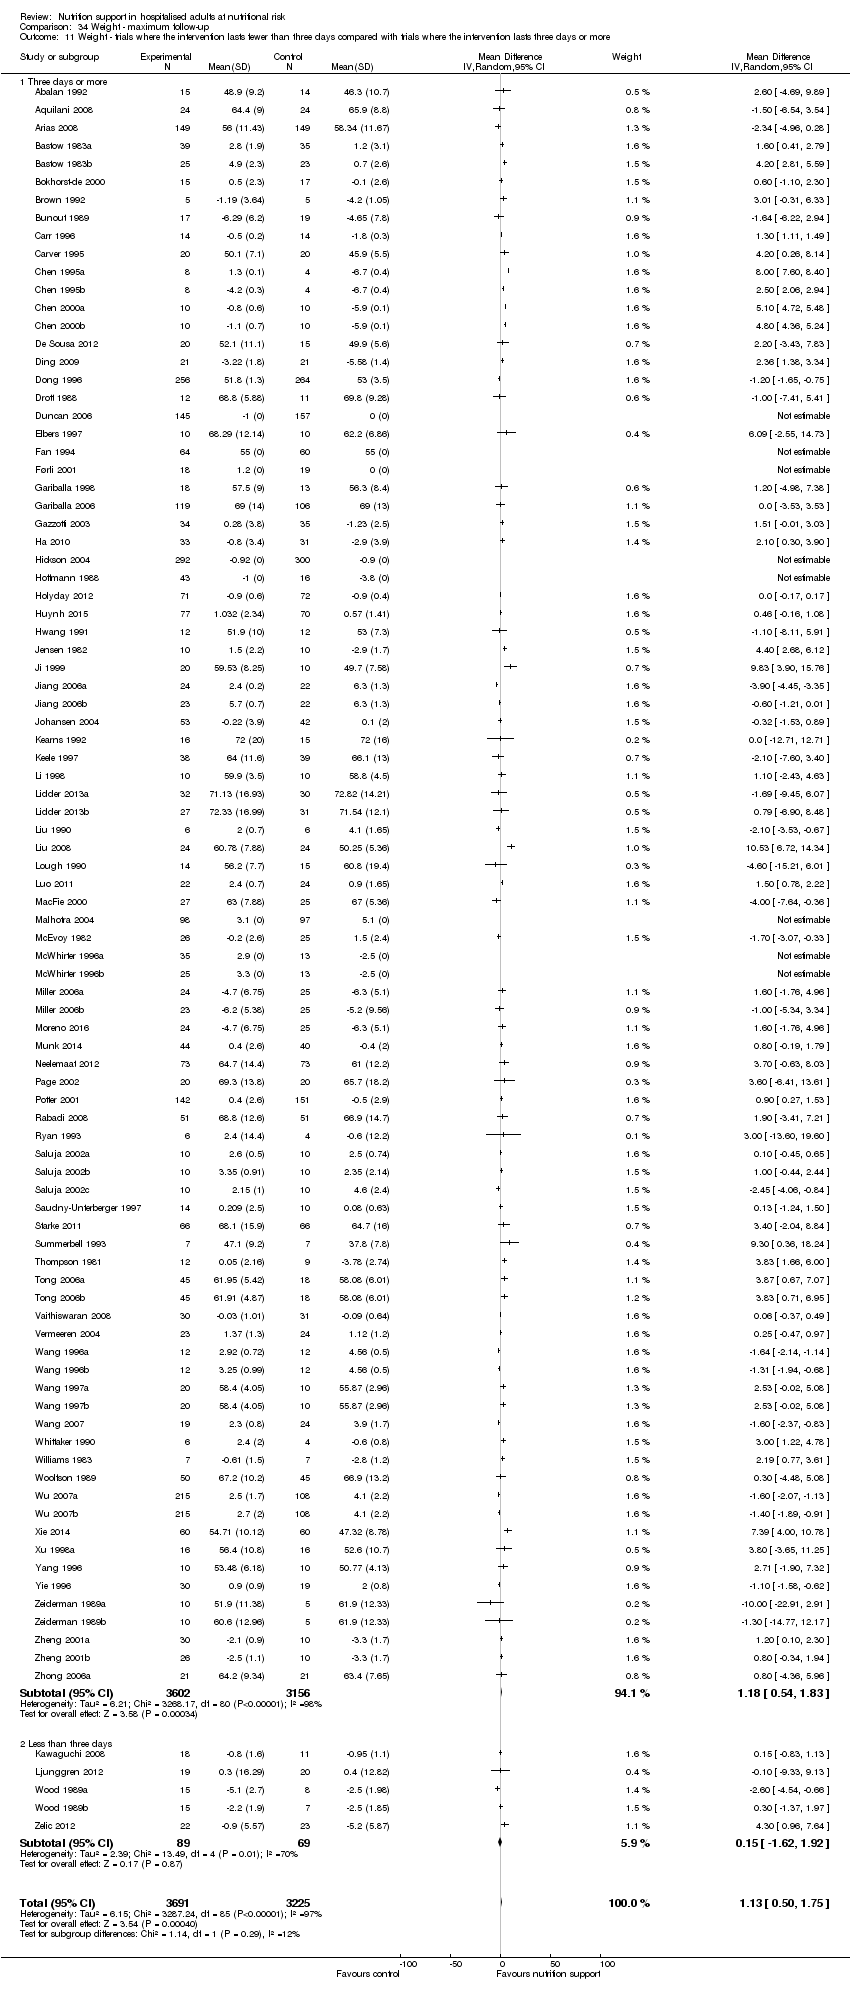
Comparison 34 Weight ‐ maximum follow‐up, Outcome 11 Weight ‐ trials where the intervention lasts fewer than three days compared with trials where the intervention lasts three days or more.

Comparison 35 Hand‐grip strength ‐ end of intervention, Outcome 1 Hand‐grip strength ‐ overall.

Comparison 36 Hand‐grip strength ‐ maximum follow‐up, Outcome 1 Hand‐grip strength ‐ overall.

Comparison 37 Six‐minute walking distance ‐ end of intervention, Outcome 1 Six‐minute walking distance ‐ overall.
| Nutrition support versus no intervention, placebo, or treatment as usual in hospitalised adults at nutritional risk | ||||||
| Patient or population: hospitalised adults at nutritional risk | ||||||
| Outcomes | Anticipated absolute effects* (95% CI) | Relative effect | № of participants | Quality of the evidence | Comments | |
| Risk with no intervention, placebo, or treatment‐as‐usual | Risk with nutrition support | |||||
| All‐cause mortality | ||||||
| ‐ at end of intervention | Study population | RR 0.94 | 21,758 | ⊕⊕⊝⊝ | Trial Sequential Analysis of all nutrition support trials shows that the futility area is reached. This leads us to conclude that the possible intervention effect, if any, is less than 11%. Multiple eligible treatments were used in 9 trials generating a further 13 comparisons (= 127 studies). | |
| 83 per 1.000 | 78 per 1.000 | |||||
| ‐ at maximum follow‐up | Study population | RR 0.93 | 23170 | ⊕⊕⊝⊝ | Trial Sequential Analysis of all nutrition support trials shows that the futility area is reached. This leads us to conclude that any possible intervention effect, if any, is less than 10%. Multiple eligible treatments were used in 10 trials generating a further 14 comparisons (= 141 studies). | |
| 132 per 1.000 | 122 per 1.000 | |||||
| Serious adverse events | ||||||
| ‐ at end of intervention | Study population | RR 0.93 | 22,087 | ⊕⊕⊝⊝ | Trial Sequential Analysis of all nutrition support trials shows that the futility area is reached. This leads us to conclude that any possible intervention effect, if any, is less than 11%. Multiple eligible treatments were used in 10 trials generating a further 14 comparisons (= 137 studies). | |
| 99 per 1.000 | 92 per 1.000 | |||||
| at maximum follow‐up | Study population | RR 0.91 | 23,413 | ⊕⊕⊝⊝ | Trial Sequential Analysis of all nutrition support trials shows that the futility area is reached. This leads us to conclude that any possible intervention effect, if any, is less than 10%. Multiple eligible treatments were used in 11 trials generating a further 15 comparisons (= 152 studies). | |
| 152 per 1.000 | 138 per 1.000 | |||||
| Health‐related quality of life | ||||||
| ‐at end of intervention | We found that nutrition support of any type for participants at nutritional risk (defined by our inclusion criteria, including as defined by the trial investigators) did not show any benefit or harm with regard to quality of life at end of intervention or at maximum follow‐up. Few trials used similar quality‐of‐life questionnaires, and only data from EuroQoL utility score and SF‐36 could be used in a meta‐analysis. Whichever score was used, we found no beneficial or harmful effects. While most trials found no beneficial or harmful effect of nutrition support, only a few trials found a beneficial effect on specific parameters. All included trials assessing health‐related quality of life were at high risk of bias. | ‐ | (16 RCTs) | ‐ | ||
| at maximum follow‐up ((EuroQol) ) | Control group mean quality of life scores were 0.486 and 0.175. | Quality of life was on average 0.01 units lower | ‐ | 3961 | ⊕⊝⊝⊝ | |
| Weight at the end of intervention | Control group weight ranged from 45.9 to 73.03 kg | MD 1.32 kg higher | ‐ | 5445 | ⊕⊝⊝⊝ | |
| *The risk in the intervention group (and its 95% confidence interval) is based on the assumed risk in the comparison group and the relative effect of the intervention (and its 95% CI). | ||||||
| GRADE Working Group grades of evidence | ||||||
| 1Downgraded by 2 levels because of a very serious risk of bias. | ||||||
| Medical speciality | Experimental group | Control group |
| Emergency medicine | 3 trials used enteral nutrition 8 trials used parenteral nutrition | 7 trials used no intervention 4 trials used treatment as usual |
| Endocrinology | 1 trial used parenteral nutrition | 1 trial used no intervention |
| Gastroenterological surgery | 36 trials used enteral nutrition 13 trials used oral nutrition 40 trials used parenteral nutrition 3 trials used mixed nutrition | 32 trials used no intervention 4 trials used placebo 56 trials used treatment as usual |
| General surgery | 2 trials used parenteral nutrition | 1 trial used no intervention 1 trial used treatment as usual |
| Geriatrics | 1 trial used fortified foods 2 trials used general nutrition support 13 trials used oral nutrition | 9 trials used no intervention 2 trials used placebo 5 trials used treatment as usual |
| Gynaecology | 1 trial used parenteral nutrition | 1 trial used treatment as usual |
| Haematology | 1 trial used parenteral nutrition | 1 trial used placebo |
| Infectious diseases | 2 trials used enteral nutrition | 2 trials used treatment as usual |
| Medical gastroenterology and hepatology | 9 trials used enteral nutrition 3 trials used oral nutrition 5 trials used parenteral nutrition 1 trial used mixed nutrition | 9 trials used no intervention 9 trials used treatment as usual |
| Mixed medical speciality | 2 trials used enteral nutrition 1 trial used fortified foods 1 trial used general nutrition 4 trials used oral nutrition 1 trial used mixed nutrition | 5 trials used no intervention 1 trial used placebo 3 trials used treatment as usual |
| Neprohology | 1 trial used general nutrition | 1 trial used treatment as usual |
| Neurological surgery | 1 trial used parenteral nutrition | 1 trial used treatment as usual |
| Neurology | 3 trials used enteral nutrition 1 trial used general nutrition 5 trials used oral nutrition 1 trial used mixed nutrition | 4 trials used no intervention 6 trials used treatment as usual |
| Oncology | 3 trials used enteral nutrition 1 trial used general nutrition 11 trials used parenteral nutrition 1 trial used mixed nutrition | 9 trials used no intervention 7 trials used treatment as usual |
| Oro‐maxillo‐facial surgery | 1 trial used enteral nutrition 1 trial used oral nutrition | 2 trials used no intervention |
| Orthopaedics | 5 trials used enteral nutrition 4 trials used oral nutrition 1 trial used general nutrition 1 trial used parenteral nutrition 3 trials used mixed nutrition | 7 trials used no intervention 2 trials used placebo 5 trials used treatment as usual |
| Pulmonary diseases | 2 trials used enteral nutrition 3 trials used oral nutrition 3 trials used parenteral nutrition | 1 trial used no intervention 3 trials used placebo 4 trials used treatment as usual |
| Thoracic surgery | 2 enteral nutrition 1 parenteral nutrition 1 mixed nutrition | 1 trial used placebo 3 trials used treatment as usual |
| Trauma surgery | 8 trials used enteral nutrition 3 trials used parenteral nutrition | 6 trial used no intervention 5 trial used treatment as usual |
| Transplant surgery | 1 trial used enteral nutrition 1 trial used oral nutrition 2 trials used parenteral nutrition | 4 trials used treatment as usual |
| Vascular surgery | 1 trial used enteral nutrition 3 trials used parenteral nutrition | 4 trials used treatment as usual |
| Trial | Experimental intervention | Type and number of participants with a serious adverse events (Experimental group) | Proportion of participants with a serious adverse event (Experimental group) | Type and number of participants with a serious adverse events (Control group) | Proportion of participants with a serious adverse event (Control group) |
| Parenteral nutrition | 1 sepsis | 1 out of 54 | 10 sepsis | 10 out of 46 | |
| Parenteral nutrition | 1 anastomotic leak, 3 respiratory infections, 2 respiratory insufficiency | 6 out of 43 | 2 anastomotic leaks, 1 renal failure, 2 abdominal abscesses, 4 respiratory infections, 3 respiratory insufficieny | 12 out of 47 | |
| Parenteral nutrition | 7 anastomotic leaks, 5 pneumonias, 1 GI haemorrhages, 8 GI fistula, 4 ileus, 2 myocardial infarction, 12 abscess, 4 deep infection, 7 peritonitis | 50 out of 60 | 3 anastomotic leaks, 6 pneumonias, 1 pulmonary embolism, 2 GI haemorrhages, 5 GI fistula, 1 myocardial infarction, 2 abscess, 4 deep infection, 2 peritonitis | 26 out of 57 | |
| Enteral nutrition | no serious adverse events reported | 0 out of 16 | 1 anastomotic leak | 1 out of 8 | |
| Enteral nutrition | 1 anastomotic leak | 1 out of 10 | no serious adverse events reported | 0 out of 10 | |
| Enteral nutrition | no serious adverse events reported | 0 out of 21 | 1 septic complication | 1 out of 20 | |
| Oral nutrition | 50 strokes, 23 pulmonary embolisms, 43 DVTs, 28 GI haemorrhages, 28 ACS' | 172 out of 2012 | 43 strokes, 18 pulmonary embolism, 29 DVTs, 18 GI haemorrhage, 22 ACS | 130 out of 2000 | |
| Enteral nutrition | 15 strokes, 6 pulmonary embolisms, 11 DVTs, 22 GI haemorrhages, 7 ACS' | 61 out of 429 | 23 strokes, 8 pulmonary embolisms, 13 DVTs, 11 GI haemorrhages, 13 ACS' | 68 out of 428 | |
| Parenteral nutrition | 3 sepsis | 3 out of 9 | 7 sepsis | 7 out of 12 | |
| Oral nutrition | 20 anastomotic leaks, 14 pneumonias, 2 pulmonary embolisms, 2 renal failure, 6 abdominal abscess, 3 unspecific infection, 10 wound dehiscences, 1 pulmonary failure, 11 gastrointestinal complications, 6 cardiovascular complications, 4 haemoperitoneum | 79 out of 338 | 18 anastomotic leaks, 9 pneumonias, 1 pulmonary embolisms, 3 renal failure, 1 abdominal abscess, 2 unspecific infection, 3 wound dehiscences, 2 pulmonary failure, 6 bacteraemia, 23 gastrointestinal complications, 6 cardiovascular complications, 5 haemoperitoneum | 79 out of 340 | |
| Parenteral nutrition | 1 respiratory infection | 1 out of 21 | 2 respiratory infection | 2 out of 21 | |
| Enteral nutrition | no serious adverse events reported | 0 out of 256 | 6 anastomotic leaks | 6 out of 264 | |
| Parenteral nutrition | 4 GI haemorrhages, 4 GI fistulas, 4 hepatic comas | 12 out of 64 | 1 GI haemorrhages, 5 GI fistulas, 4 hepatic comas | 10 out of 60 | |
| Enteral nutrition | 25 pressure sores | 25 out of 48 | 30 pressure sores | 30 out of 53 | |
| Enteral nutrition | no serious adverse events reported | 0 out of 43 | 3 anastomotic leaks, 2 myocardial infarction | 5 out of 16 | |
| Enteral nutrition | 2 abdominal abscess | 2 out of 20 | no serious adverse events reported | 0 out of 10 | |
| General nutrition | 4 pneumonia, 1 DVTs, 4 sepsis, 2 empyemas, 0 gastroenteritis, 1 GI complications, | 12 out of 108 | 4 pneumonia, 1 stroke, 2 sepsis, 1 gastroenteritis, 2 GI complications | 10 out of 104 | |
| Enteral nutrition | 2 renal failures | 2 out of 16 | 2 renal failures | 2 out of 15 | |
| Oral nutrition | no serious adverse events reported | 0 out of 43 | 1 GI perforation | 1 out of 43 | |
| Oral nutrition | 20 pressure sores | 20 out of 197 | 29 pressure sores | 29 out of 328 | |
| Enteral nutrition | 4 variceal bleedings, 1 peritonitis | 5 out of 12 | 1 peritonitis | 1 out of 10 | |
| Parenteral nutrition | no serious adverse events reported | 0 out of 14 | 1 anastomotic leak, 1 GI fistula | 2 out of 15 | |
| Enteral nutrition | 21 Pneumonia, Wound infection 27, Wound dehiscence 4, anastomotic Leak 7, Septicaemia 20 | 27 out of 98 | Pneumonia 30, Wound infection 31, Wound dehiscence 9, Leak 13, Septicaemia 30. | 31 out of 97 | |
| Enteral nutrition | 8 sepsis | 8 out of 27 | 7 sepsis | 7 out of 29 | |
| Parenteral nutrition | no serious adverse events reported | 0 out of 9 | 1 sepsis | 1 out of 12 | |
| Enteral nutrition | no serious adverse events reported | 0 out of 20 | 1 pulmonary embolism | 1 out of 20 | |
| Enteral nutrition | 2 peritonitis | 2 out of 11 | 5 peritonitis | 5 out of 18 | |
| Enteral nutrition | no serious adverse events reported | 0 out of 30 | 4 GI fistulas | 4 out of 30 | |
| Oral nutrition | no serious adverse events reported | 0 out of 80 | 1 anastomotic leak | 1 out of 81 | |
| Parenteral nutrition | 1 pneumonia | 1 out of 10 | 2 pneumonias | 2 out of 10 | |
| Parenteral nutrition | 2 pneumoperitoneum's | 2 out of 40 | 2 anastomotic leaks, 2 pneumoperitoneum's | 4 out of 40 | |
| Parenteral nutrition | 2 pneumonias, 5 sepsis | 7 out of 16 | 2 sepsis | 2 out of 14 | |
| Enteral nutrition | 1 myocardial infarction | 1 out of 16 | 1 myocardial infarction | 1 out of 16 | |
| Parenteral nutrition | no serious adverse events reported | 0 out of 15 | 2 hepatic encephalopathies | 2 out of 17 | |
| Parenteral nutrition | no serious adverse events reported | 0 out of 17 | 2 respiratory infection | 2 out of 17 | |
| General nutrition | no serious adverse events reported | 0 out of 66 | 1 stroke, 1 DVT, 1 septic arthritis, 2 myocardial infarction | 5 out of 66 | |
| Parenteral nutrition | 1 empyema, 1 pelvic abscess | 2 out of 12 | 1 intraabdominal abscess | 1 out of 9 | |
| Mixed nutrition | 1 hepatic encephalopathy | 1 out of 90 | 4 anastomotic leak, 5 hepatic encephalopathies | 9 out of 36 | |
| Enteral nutrition | 2 sepsis, 2 multi organ failure, | 4 out of 52 | 6 sepsis, 3 multi organ failure | 9 out of 49 | |
| Enteral nutrition | 1 anastomotic leak | 1 out of 13 | 3 anastomotic leaks | 3 out of 15 | |
| Mixed nutrition | 11 anastomotic leaks, 6 DVT, 15 sepsis | 32 out of 430 | 10 anastomotic leaks, 15 sepsis | 25 out of 216 | |
| Parenteral nutrition | 1 wound dehiscence | 1 out of 18 | 1 anastomotic leak, 2 pneumonias, 1 sepsis, 1 ileus | 5 out of 16 | |
| Enteral nutrition | 2 GI haemorrhage | 2 out of 50 | 4 GI haemorrhage | 4 out of 50 |
| Trial | Experimental intervention | Type and number of participants with a serious adverse events (Experimental group) | Proportion of participants with a serious adverse event (Experimental group) | Type and number of participants with a serious adverse events (Control group) | Proportion of participants with a serious adverse event (Control group) |
| Enteral nutrition | 2 anastomotic leaks | 2 out of 64 | 7 anastomotic leaks, 2 GI haemorrhage, 1 myocardial infarction | 10 out of 57 | |
| Enteral nutrition | 2 anastomotic leak, 3 wound dehiscence, 1 myocardial infarction, | 6 out of 30 | 4 anastomotic leak, 1 pulmonary failure | 5 out of 30 | |
| Parenteral nutrition | 1 sepsis | 1 out of 54 | 10 sepsis | 10 out of 46 | |
| Parenteral nutrition | 1 anastomotic leak, 3 respiratory infections, 2 respiratory insufficiencies | 6 out of 43 | 2 anastomotic leaks, 1 renal failure, 2 abdominal abscesses, 4 respiratory infections, 3 respiratory insufficiencies | 12 out of 47 | |
| Parenteral nutrition | 7 anastomotic leaks, 5 pneumonias, 1 GI haemorrhages, 8 GI fistula, 4 ileus, 2 myocardial infarction, 12 abscess, 4 deep infection, 7 peritonitis | 50 out of 60 | 3 anastomotic leaks, 6 pneumonias, 1 pulmonary embolism, 2 GI haemorrhages, 5 GI fistula, 1 myocardial infarction, 2 abscess, 4 deep infection, 2 peritonitis | 26 out of 57 | |
| Enteral nutrition | no serious adverse events reported | 0 out of 16 | 1 anastomotic leak | 1 out of 8 | |
| Enteral nutrition | 1 anastomotic leak | 1 out of 10 | no serious adverse events reported | 0 out of 10 | |
| Enteral nutrition | no serious adverse events reported | 0 out of 21 | 1 septic complication | 1 out of 20 | |
| Enteral nutrition | 2 CNS infections, 13 ventilator associated pneumonias | 15 out of 34 | 2 CNS infections, 12 ventilator associated pneumonias | 14 out of 25 | |
| Oral nutrition | 50 strokes, 23 pulmonary embolisms, 43 DVTs, 28 GI haemorrhages, 28 ACS' | 172 out of 2012 | 43 strokes, 18 pulmonary embolism, 29 DVTs, 18 GI haemorrhage, 22 ACS' | 130 out of 2000 | |
| Enteral nutrition | 15 strokes, 6 pulmonary embolisms, 11 DVTs, 22 GI haemorrhages, 7 ACS' | 61 out of 429 | 23 strokes, 8 pulmonary embolisms, 13 DVTs, 11 GI haemorrhages, 13 ACS' | 68 out of 428 | |
| Parenteral nutrition | 1 respiratory infection | 1 out of 21 | 2 respiratory infection | 2 out of 21 | |
| Parenteral nutrition | 3 sepsis | 3 out of 9 | 7 sepsis | 7 out of 12 | |
| Oral nutrition | 20 anastomotic leaks, 14 pneumonias, 2 pulmonary embolisms, 2 renal failure, 6 abdominal abscess, 3 unspecific infection, 10 wound dehiscences, 1 pulmonary failure, 11 gastrointestinal complications, 6 cardiovascular complications, 4 haemoperitoneum | 79 out of 338 | 18 anastomotic leaks, 9 pneumonias, 1 pulmonary embolisms, 3 renal failure, 1 abdominal abscess, 2 unspecific infection, 3 wound dehiscences, 2 pulmonary failure, 6 bacteraemia, 23 gastrointestinal complications, 6 cardiovascular complications, 5 haemoperitoneum | 79 out of 340 | |
| Enteral nutrition | no serious adverse events reported | 0 out of 256 | 6 anastomotic leaks | 6 out of 264 | |
| Parenteral nutrition | 4 GI haemorrhages, 4 GI fistulas, 4 hepatic comas | 12 out of 64 | 1 GI haemorrhages, 5 GI fistulas, 4 hepatic comas | 10 out of 60 | |
| Enteral nutrition | 25 pressure sores | 25 out of 48 | 30 pressure sores | 30 out of 53 | |
| Oral nutrition | 1 anastomotic leak, 2 wound infections, 1 pulmonary embolism | 4 out of 16 | 1 anastomotic leak, | 1 out of 8 | |
| Enteral nutrition | no serious adverse events reported | 0 out of 43 | 3 anastomotic leaks, 2 myocardial infarction | 5 out of 16 | |
| Enteral nutrition | 2 abdominal abscess | 2 out of 20 | no serious adverse events reported | 0 out of 10 | |
| General nutrition | 4 pneumonia, 1 DVTs, 4 sepsis, 2 empyemas, 0 gastroenteritis, 1 GI complications, | 12 out of 108 | 4 pneumonia, 1 stroke, 2 sepsis, 1 gastroenteritis, 2 GI complications | 10 out of 104 | |
| Enteral nutrition | 3 septic complications, 3 wound dehiscence | 6 out of 50 | 8 septic complications, 4 wound dehiscence | 12 out of 50 | |
| Enteral nutrition | 2 renal failures | 2 out of 16 | 2 renal failures | 2 out of 15 | |
| Oral nutrition | no serious adverse events reported | 0 out of 43 | 1 GI perforation | 1 out of 43 | |
| Oral nutrition | 20 pressure sores | 20 out of 197 | 29 pressure sores | 29 out of 328 | |
| Enteral nutrition | 4 variceal bleedings, 1 peritonitis | 5 out of 12 | 1 peritonitis | 1 out of 10 | |
| Oral nutrition | 2 anastomotic leaks, 2 sepsis | 4 out of 59 | 7 anastomotic leaks, 1 stroke, 1 DVT, 3 sepsis, 3 myocardial infarctions | 15 out of 61 | |
| Parenteral nutrition | no serious adverse events reported | 0 out of 14 | 1 anastomotic leak, 1 GI fistula | 2 out of 15 | |
| Enteral nutrition | 8 sepsis | 8 out of 27 | 7 sepsis | 7 out of 29 | |
| Parenteral nutrition | no serious adverse events reported | 0 out of 9 | 1 sepsis | 1 out of 12 | |
| Enteral nutrition | no serious adverse events reported | 0 out of 20 | 1 pulmonary embolism | 1 out of 20 | |
| Enteral nutrition | 2 peritonitis | 2 out of 11 | 5 peritonitis | 5 out of 18 | |
| Enteral nutrition | no serious adverse events reported | 0 out of 30 | 4 GI fistulas | 4 out of 30 | |
| Oral nutrition | no serious adverse events reported | 0 out of 80 | 1 anastomotic leak | 1 out of 81 | |
| Parenteral nutrition | 1 pneumonia | 1 out of 10 | 2 pneumonias | 2 out of 10 | |
| Parenteral nutrition | 2 pneumoperitoneums | 2 out of 40 | 2 anastomotic leaks, 2 pneumoperitoneums | 4 out of 40 | |
| Parenteral nutrition | 2 pneumonias, 5 sepsis | 7 out of 16 | 2 sepsis | 2 out of 14 | |
| Enteral nutrition | 1 myocardial infarction | 1 out of 16 | 1 myocardial infarction | 1 out of 16 | |
| Parenteral nutrition | no serious adverse events reported | 0 out of 15 | 2 hepatic encephalopathies | 2 out of 17 | |
| Parenteral nutrition | 1 anastomotic leak, 1 respiratory infection, 1 pancreatitis | 3 out of 17 | 2 pulmonary embolisms, 1 septic complication, 4 respiratory infections, | 7 out of 17 | |
| Enteral nutrition | 2 wound infections, 1 pneumonia | 3 out of 9 | 1 anastomotic leak, 2 wound infections, 1 pneumonia, 1 peptic ulcer, 1 wound dehiscence, | 6 out of 9 | |
| General nutrition | no serious adverse events reported | 0 out of 66 | 1 stroke, 1 DVT, 1 septic arthritis, 2 myocardial infarction | 5 out of 66 | |
| Parenteral nutrition | 1 empyema, 1 pelvic abscess | 2 out of 12 | 1 intraabdominal abscess | 1 out of 9 | |
| Mixed nutrition | 1 hepatic encephalopathy | 1 out of 90 | 4 anastomotic leak, 5 hepatic encephalopathies | 9 out of 36 | |
| Enteral nutrition | 2 sepsis, 2 multi organ failure, | 4 out of 52 | 6 sepsis, 3 multi organ failure | 9 out of 49 | |
| Enteral nutrition | 1 anastomotic leak | 1 out of 13 | 3 anastomotic leaks | 3 out of 15 | |
| Parenteral nutrition | 6 anastomotic leaks, 16 pneumonias, 1 pressure sore, 2 abdominal abscess, 1 wound dehiscence, 13 pulmonary failure, 7 bacteraemia, 10 GI complications, 15 cardiac complications, 3 bronchopleurocutaneous fistulas | 74 out of 231 | 6 anastomotic leaks, 9 pneumonias, 1 pulmonary embolism, 1 pressure sore, 3 renal failure, 2 abdominal abscess, 1 septic complication, 1 wound dehiscence, 11 pulmonary failure, 5 bacteraemia, 10 GI complications, 15 cardiac complications, 6 bronchopleurocutaneous fistulas | 80 out of 228 | |
| Mixed nutrition | 11 anastomotic leaks, 6 DVT, 15 sepsis | 32 out of 430 | 10 anastomotic leaks, 15 sepsis | 25 out of 216 | |
| Parenteral nutrition | 1 wound dehiscence | 1 out of 18 | 1 anastomotic leak, 2 pneumonias, 1 sepsis, 1 ileus | 5 out of 16 | |
| Enteral nutrition | 2 GI haemorrhage | 2 out of 50 | 4 GI haemorrhage | 4 out of 50 |
| Outcome or subgroup title | No. of studies | No. of participants | Statistical method | Effect size |
| 1 All‐cause mortality ‐ overall Show forest plot | 127 | 21758 | Risk Ratio (M‐H, Random, 95% CI) | 0.94 [0.86, 1.03] |
| 2 All‐cause mortality ‐ bias Show forest plot | 127 | 21758 | Risk Ratio (M‐H, Random, 95% CI) | 0.94 [0.86, 1.03] |
| 2.1 High risk of bias | 127 | 21758 | Risk Ratio (M‐H, Random, 95% CI) | 0.94 [0.86, 1.03] |
| 2.2 Low risk of bias | 0 | 0 | Risk Ratio (M‐H, Random, 95% CI) | 0.0 [0.0, 0.0] |
| 3 All‐cause mortality ‐ mode of delivery Show forest plot | 127 | 21758 | Risk Ratio (M‐H, Random, 95% CI) | 0.94 [0.86, 1.03] |
| 3.1 General nutrition support | 6 | 1420 | Risk Ratio (M‐H, Random, 95% CI) | 1.18 [0.74, 1.87] |
| 3.2 Fortified foods | 2 | 290 | Risk Ratio (M‐H, Random, 95% CI) | 1.24 [0.61, 2.54] |
| 3.3 Oral nutrition | 33 | 8529 | Risk Ratio (M‐H, Random, 95% CI) | 0.94 [0.79, 1.11] |
| 3.4 Enteral nutrition | 36 | 3722 | Risk Ratio (M‐H, Random, 95% CI) | 0.88 [0.75, 1.03] |
| 3.5 Parenteral nutrition | 43 | 7313 | Risk Ratio (M‐H, Random, 95% CI) | 0.98 [0.83, 1.16] |
| 3.6 Mixed | 7 | 484 | Risk Ratio (M‐H, Random, 95% CI) | 0.67 [0.29, 1.55] |
| 4 All‐cause mortality ‐ medical specialty Show forest plot | 127 | 21758 | Risk Ratio (M‐H, Random, 95% CI) | 0.94 [0.86, 1.03] |
| 4.1 Cardiology | 0 | 0 | Risk Ratio (M‐H, Random, 95% CI) | 0.0 [0.0, 0.0] |
| 4.2 Medical gastro‐enterology and hepatology | 13 | 627 | Risk Ratio (M‐H, Random, 95% CI) | 0.90 [0.58, 1.38] |
| 4.3 Geriatrics | 13 | 2554 | Risk Ratio (M‐H, Random, 95% CI) | 0.85 [0.66, 1.08] |
| 4.4 Pulmonary disease | 3 | 118 | Risk Ratio (M‐H, Random, 95% CI) | 0.44 [0.15, 1.28] |
| 4.5 Endocrinology | 0 | 0 | Risk Ratio (M‐H, Random, 95% CI) | 0.0 [0.0, 0.0] |
| 4.6 Infectious diseases | 1 | 56 | Risk Ratio (M‐H, Random, 95% CI) | 1.61 [0.66, 3.92] |
| 4.7 Rheumatology | 0 | 0 | Risk Ratio (M‐H, Random, 95% CI) | 0.0 [0.0, 0.0] |
| 4.8 Haematology | 0 | 0 | Risk Ratio (M‐H, Random, 95% CI) | 0.0 [0.0, 0.0] |
| 4.9 Nephrology | 0 | 0 | Risk Ratio (M‐H, Random, 95% CI) | 0.0 [0.0, 0.0] |
| 4.10 Gastro‐enterologic surgery | 46 | 3943 | Risk Ratio (M‐H, Random, 95% CI) | 0.82 [0.62, 1.09] |
| 4.11 Trauma surgery | 4 | 184 | Risk Ratio (M‐H, Random, 95% CI) | 0.93 [0.55, 1.57] |
| 4.12 Orthopaedics | 12 | 1210 | Risk Ratio (M‐H, Random, 95% CI) | 1.39 [0.87, 2.22] |
| 4.13 Plastic, reconstructive and aesthetic surgery | 0 | 0 | Risk Ratio (M‐H, Random, 95% CI) | 0.0 [0.0, 0.0] |
| 4.14 Vascular surgery | 2 | 28 | Risk Ratio (M‐H, Random, 95% CI) | 0.0 [0.0, 0.0] |
| 4.15 Transplant surgery | 3 | 84 | Risk Ratio (M‐H, Random, 95% CI) | 0.58 [0.23, 1.50] |
| 4.16 Urology | 0 | 0 | Risk Ratio (M‐H, Random, 95% CI) | 0.0 [0.0, 0.0] |
| 4.17 Thoracic surgery | 3 | 592 | Risk Ratio (M‐H, Random, 95% CI) | 0.71 [0.16, 3.22] |
| 4.18 Neurological surgery | 0 | 0 | Risk Ratio (M‐H, Random, 95% CI) | 0.0 [0.0, 0.0] |
| 4.19 Oro‐maxillo‐facial surgery | 1 | 32 | Risk Ratio (M‐H, Random, 95% CI) | 3.38 [0.15, 77.12] |
| 4.20 Anaesthesiology | 0 | 0 | Risk Ratio (M‐H, Random, 95% CI) | 0.0 [0.0, 0.0] |
| 4.21 Emergency medicine | 7 | 5198 | Risk Ratio (M‐H, Random, 95% CI) | 0.99 [0.80, 1.22] |
| 4.22 Psychiatry | 0 | 0 | Risk Ratio (M‐H, Random, 95% CI) | 0.0 [0.0, 0.0] |
| 4.23 Neurology | 7 | 5168 | Risk Ratio (M‐H, Random, 95% CI) | 0.81 [0.60, 1.11] |
| 4.24 Oncology | 5 | 313 | Risk Ratio (M‐H, Random, 95% CI) | 1.19 [0.44, 3.21] |
| 4.25 Dermatology | 0 | 0 | Risk Ratio (M‐H, Random, 95% CI) | 0.0 [0.0, 0.0] |
| 4.26 Gynaecology | 0 | 0 | Risk Ratio (M‐H, Random, 95% CI) | 0.0 [0.0, 0.0] |
| 4.27 Mixed | 7 | 1651 | Risk Ratio (M‐H, Random, 95% CI) | 1.22 [0.88, 1.70] |
| 5 All‐cause mortality ‐ based on adequacy of the amount of calories Show forest plot | 127 | 21758 | Risk Ratio (M‐H, Random, 95% CI) | 0.94 [0.86, 1.03] |
| 5.1 Clearly adequate in experimental group and clearly inadequate in control group | 25 | 7371 | Risk Ratio (M‐H, Random, 95% CI) | 0.97 [0.81, 1.16] |
| 5.2 Inadequate in the experimental group or adequate in the control group | 26 | 6711 | Risk Ratio (M‐H, Random, 95% CI) | 1.00 [0.83, 1.19] |
| 5.3 Experimental group is overfed | 5 | 267 | Risk Ratio (M‐H, Random, 95% CI) | 0.57 [0.27, 1.17] |
| 5.4 Unclear intake in experimental group or control group | 71 | 7409 | Risk Ratio (M‐H, Random, 95% CI) | 0.91 [0.81, 1.03] |
| 6 All‐cause mortality ‐ different screening tools Show forest plot | 127 | 21758 | Risk Ratio (M‐H, Random, 95% CI) | 0.94 [0.86, 1.03] |
| 6.1 NRS 2002 | 4 | 5064 | Risk Ratio (M‐H, Random, 95% CI) | 1.04 [0.84, 1.29] |
| 6.2 MUST | 0 | 0 | Risk Ratio (M‐H, Random, 95% CI) | 0.0 [0.0, 0.0] |
| 6.3 MNA | 2 | 117 | Risk Ratio (M‐H, Random, 95% CI) | 0.61 [0.12, 3.18] |
| 6.4 SGA | 3 | 1171 | Risk Ratio (M‐H, Random, 95% CI) | 1.41 [0.94, 2.10] |
| 6.5 Other means | 118 | 15406 | Risk Ratio (M‐H, Random, 95% CI) | 0.90 [0.81, 0.99] |
| 7 All‐cause mortality ‐ participants characterised as 'at nutritional risk' due to one of the following conditions Show forest plot | 127 | 21758 | Risk Ratio (M‐H, Random, 95% CI) | 0.94 [0.86, 1.03] |
| 7.1 Major surgery | 60 | 5618 | Risk Ratio (M‐H, Random, 95% CI) | 0.81 [0.65, 1.01] |
| 7.2 Stroke | 3 | 4922 | Risk Ratio (M‐H, Random, 95% CI) | 0.97 [0.83, 1.12] |
| 7.3 ICU participants including trauma | 11 | 5382 | Risk Ratio (M‐H, Random, 95% CI) | 0.98 [0.81, 1.19] |
| 7.4 Frail elderly participants with less severe conditions known to increase protein requirements | 19 | 1937 | Risk Ratio (M‐H, Random, 95% CI) | 0.88 [0.56, 1.40] |
| 7.5 Participants do not fall into one of the categories above | 34 | 3899 | Risk Ratio (M‐H, Random, 95% CI) | 1.01 [0.83, 1.22] |
| 8 All‐cause mortality ‐ participants characterised as 'at nutritional risk' due to one of the following criteria Show forest plot | 127 | 21758 | Risk Ratio (M‐H, Random, 95% CI) | 0.94 [0.86, 1.03] |
| 8.1 BMI less than 20.5 kg/m2 | 2 | 247 | Risk Ratio (M‐H, Random, 95% CI) | 1.19 [0.58, 2.45] |
| 8.2 Weight loss of at least 5% during the last three months | 1 | 32 | Risk Ratio (M‐H, Random, 95% CI) | 0.0 [0.0, 0.0] |
| 8.3 Weight loss of at least 10% during the last six months | 1 | 32 | Risk Ratio (M‐H, Random, 95% CI) | 3.38 [0.15, 77.12] |
| 8.4 Insufficient food intake during the last week (50% of requirements or less) | 0 | 0 | Risk Ratio (M‐H, Random, 95% CI) | 0.0 [0.0, 0.0] |
| 8.5 Participants characterised as 'at nutritional risk' by other means | 123 | 21447 | Risk Ratio (M‐H, Random, 95% CI) | 0.93 [0.86, 1.02] |
| 9 All‐cause mortality ‐ participants characterised as 'at nutritional risk' due to biomarkers or anthropometrics Show forest plot | 127 | 21758 | Risk Ratio (M‐H, Random, 95% CI) | 0.94 [0.86, 1.03] |
| 9.1 Biomarkers | 5 | 657 | Risk Ratio (M‐H, Random, 95% CI) | 0.43 [0.16, 1.19] |
| 9.2 Anthropometric measures | 12 | 1402 | Risk Ratio (M‐H, Random, 95% CI) | 0.80 [0.56, 1.15] |
| 9.3 Characterised by other means | 110 | 19699 | Risk Ratio (M‐H, Random, 95% CI) | 0.95 [0.87, 1.05] |
| 10 All‐cause mortality ‐ randomisation year Show forest plot | 127 | 21758 | Risk Ratio (M‐H, Random, 95% CI) | 0.94 [0.86, 1.03] |
| 10.1 Before 1960 | 0 | 0 | Risk Ratio (M‐H, Random, 95% CI) | 0.0 [0.0, 0.0] |
| 10.2 1960 to 1979 | 5 | 181 | Risk Ratio (M‐H, Random, 95% CI) | 1.11 [0.50, 2.46] |
| 10.3 1980 to 1999 | 79 | 11350 | Risk Ratio (M‐H, Random, 95% CI) | 0.91 [0.81, 1.02] |
| 10.4 After 1999 | 43 | 10227 | Risk Ratio (M‐H, Random, 95% CI) | 0.95 [0.80, 1.12] |
| 11 All‐cause mortality ‐ trials where the intervention lasts fewer than three days compared with trials where the intervention lasts three days or more Show forest plot | 127 | 21758 | Risk Ratio (M‐H, Random, 95% CI) | 0.94 [0.86, 1.03] |
| 11.1 Three days or more | 111 | 20434 | Risk Ratio (M‐H, Random, 95% CI) | 0.92 [0.84, 1.01] |
| 11.2 Fewer than three days | 13 | 722 | Risk Ratio (M‐H, Random, 95% CI) | 0.76 [0.39, 1.45] |
| 11.3 Unknown | 3 | 602 | Risk Ratio (M‐H, Random, 95% CI) | 1.16 [0.33, 4.06] |
| 12 All‐cause mortality ‐ 'best‐worst case' scenario Show forest plot | 127 | 22207 | Risk Ratio (M‐H, Random, 95% CI) | 0.74 [0.65, 0.84] |
| 13 All‐cause mortality ‐ 'worst‐best case' scenario Show forest plot | 127 | 22207 | Risk Ratio (M‐H, Random, 95% CI) | 1.13 [0.97, 1.31] |
| 14 All‐cause mortality co‐interventions Show forest plot | 127 | 21758 | Risk Ratio (M‐H, Fixed, 95% CI) | 0.93 [0.86, 1.02] |
| 14.1 received nutrition support as co‐intervention | 12 | 5361 | Risk Ratio (M‐H, Fixed, 95% CI) | 0.94 [0.78, 1.14] |
| 14.2 did not receive nutrition support as co‐intervention | 108 | 15974 | Risk Ratio (M‐H, Fixed, 95% CI) | 0.93 [0.84, 1.03] |
| 14.3 delayed versus early nutrition support | 7 | 423 | Risk Ratio (M‐H, Fixed, 95% CI) | 0.94 [0.53, 1.66] |
| Outcome or subgroup title | No. of studies | No. of participants | Statistical method | Effect size |
| 1 All‐cause mortality ‐ overall Show forest plot | 141 | 23170 | Risk Ratio (M‐H, Random, 95% CI) | 0.93 [0.88, 0.99] |
| 2 All‐cause mortality ‐ bias Show forest plot | 141 | 23170 | Risk Ratio (M‐H, Random, 95% CI) | 0.93 [0.88, 0.99] |
| 2.1 High risk of bias | 141 | 23170 | Risk Ratio (M‐H, Random, 95% CI) | 0.93 [0.88, 0.99] |
| 2.2 Low risk of bias | 0 | 0 | Risk Ratio (M‐H, Random, 95% CI) | 0.0 [0.0, 0.0] |
| 3 All‐cause mortality ‐ mode of delivery Show forest plot | 141 | 23170 | Risk Ratio (M‐H, Random, 95% CI) | 0.93 [0.88, 0.99] |
| 3.1 General nutrition support | 7 | 1566 | Risk Ratio (M‐H, Random, 95% CI) | 0.99 [0.71, 1.36] |
| 3.2 Fortified nutrition | 2 | 290 | Risk Ratio (M‐H, Random, 95% CI) | 1.24 [0.61, 2.54] |
| 3.3 Oral nutrition support | 32 | 8501 | Risk Ratio (M‐H, Random, 95% CI) | 0.94 [0.77, 1.15] |
| 3.4 Enteral nutrition | 42 | 4212 | Risk Ratio (M‐H, Random, 95% CI) | 0.84 [0.75, 0.95] |
| 3.5 Parenteral nutrition | 51 | 8121 | Risk Ratio (M‐H, Random, 95% CI) | 0.99 [0.90, 1.09] |
| 3.6 Mixed | 7 | 480 | Risk Ratio (M‐H, Random, 95% CI) | 0.72 [0.37, 1.37] |
| 4 All‐cause mortality ‐ medical specialty Show forest plot | 141 | 23170 | Risk Ratio (M‐H, Random, 95% CI) | 0.93 [0.88, 0.99] |
| 4.1 Cardiology | 0 | 0 | Risk Ratio (M‐H, Random, 95% CI) | 0.0 [0.0, 0.0] |
| 4.2 Medical gastro‐enterology and hepatology | 13 | 622 | Risk Ratio (M‐H, Random, 95% CI) | 0.96 [0.77, 1.19] |
| 4.3 Geriatrics | 13 | 2547 | Risk Ratio (M‐H, Random, 95% CI) | 0.88 [0.67, 1.17] |
| 4.4 Pulmonary disease | 3 | 118 | Risk Ratio (M‐H, Random, 95% CI) | 0.44 [0.15, 1.28] |
| 4.5 Endocrinology | 0 | 0 | Risk Ratio (M‐H, Random, 95% CI) | 0.0 [0.0, 0.0] |
| 4.6 Infectious diseases | 1 | 56 | Risk Ratio (M‐H, Random, 95% CI) | 1.61 [0.66, 3.92] |
| 4.7 Rheumatology | 0 | 0 | Risk Ratio (M‐H, Random, 95% CI) | 0.0 [0.0, 0.0] |
| 4.8 Haematology | 0 | 0 | Risk Ratio (M‐H, Random, 95% CI) | 0.0 [0.0, 0.0] |
| 4.9 Nephrology | 0 | 0 | Risk Ratio (M‐H, Random, 95% CI) | 0.0 [0.0, 0.0] |
| 4.10 Gastroenterologic surgery | 50 | 4715 | Risk Ratio (M‐H, Random, 95% CI) | 0.89 [0.70, 1.12] |
| 4.11 Trauma surgery | 6 | 249 | Risk Ratio (M‐H, Random, 95% CI) | 0.86 [0.55, 1.34] |
| 4.12 Ortopaedics | 12 | 1196 | Risk Ratio (M‐H, Random, 95% CI) | 1.00 [0.61, 1.62] |
| 4.13 Plastic, reconstructive, and aesthetic surgery | 0 | 0 | Risk Ratio (M‐H, Random, 95% CI) | 0.0 [0.0, 0.0] |
| 4.14 Vascular surgery | 2 | 28 | Risk Ratio (M‐H, Random, 95% CI) | 0.0 [0.0, 0.0] |
| 4.15 Transplant surgery | 3 | 84 | Risk Ratio (M‐H, Random, 95% CI) | 0.54 [0.22, 1.31] |
| 4.16 Urology | 0 | 0 | Risk Ratio (M‐H, Random, 95% CI) | 0.0 [0.0, 0.0] |
| 4.17 Thoracic surgery | 3 | 592 | Risk Ratio (M‐H, Random, 95% CI) | 0.71 [0.16, 3.22] |
| 4.18 Neurological surgery | 0 | 0 | Risk Ratio (M‐H, Random, 95% CI) | 0.0 [0.0, 0.0] |
| 4.19 Oro‐maxillo‐facial surgery | 1 | 32 | Risk Ratio (M‐H, Random, 95% CI) | 3.38 [0.15, 77.12] |
| 4.20 Anaesthesiology | 0 | 0 | Risk Ratio (M‐H, Random, 95% CI) | 0.0 [0.0, 0.0] |
| 4.21 Emergency medicine | 11 | 5421 | Risk Ratio (M‐H, Random, 95% CI) | 0.97 [0.85, 1.12] |
| 4.22 Psychiatry | 0 | 0 | Risk Ratio (M‐H, Random, 95% CI) | 0.0 [0.0, 0.0] |
| 4.23 Neurology | 9 | 5448 | Risk Ratio (M‐H, Random, 95% CI) | 0.77 [0.59, 0.99] |
| 4.24 Oncology | 7 | 411 | Risk Ratio (M‐H, Random, 95% CI) | 1.03 [0.87, 1.21] |
| 4.25 Dermatology | 0 | 0 | Risk Ratio (M‐H, Random, 95% CI) | 0.0 [0.0, 0.0] |
| 4.26 Gynaecology | 0 | 0 | Risk Ratio (M‐H, Random, 95% CI) | 0.0 [0.0, 0.0] |
| 4.27 Mixed | 7 | 1651 | Risk Ratio (M‐H, Random, 95% CI) | 1.28 [0.94, 1.75] |
| 5 All‐cause mortality ‐ based on adequacy of the amount of calories Show forest plot | 141 | 23170 | Risk Ratio (M‐H, Random, 95% CI) | 0.93 [0.88, 0.99] |
| 5.1 Clearly adequate in intervention and clearly inadequate in control | 28 | 7589 | Risk Ratio (M‐H, Random, 95% CI) | 0.98 [0.88, 1.09] |
| 5.2 Inadequate in the experimental or adequate in the control | 27 | 6824 | Risk Ratio (M‐H, Random, 95% CI) | 0.95 [0.82, 1.10] |
| 5.3 Experimental group is overfed | 10 | 974 | Risk Ratio (M‐H, Random, 95% CI) | 0.98 [0.69, 1.41] |
| 5.4 Unclear intake in control or experimental | 76 | 7783 | Risk Ratio (M‐H, Random, 95% CI) | 0.89 [0.81, 0.98] |
| 6 All‐cause mortality ‐ different screening tools Show forest plot | 141 | 23170 | Risk Ratio (M‐H, Random, 95% CI) | 0.93 [0.88, 0.99] |
| 6.1 NRS 2002 | 4 | 5064 | Risk Ratio (M‐H, Random, 95% CI) | 1.02 [0.87, 1.19] |
| 6.2 MUST | 1 | 146 | Risk Ratio (M‐H, Random, 95% CI) | 1.30 [0.60, 2.82] |
| 6.3 MNA | 2 | 117 | Risk Ratio (M‐H, Random, 95% CI) | 0.61 [0.12, 3.18] |
| 6.4 SGA | 3 | 1171 | Risk Ratio (M‐H, Random, 95% CI) | 1.41 [0.94, 2.10] |
| 6.5 Other means | 131 | 16672 | Risk Ratio (M‐H, Random, 95% CI) | 0.91 [0.85, 0.97] |
| 7 All‐cause mortality ‐ participants characterised as 'at nutritional risk' due to one of the following conditions Show forest plot | 141 | 23170 | Risk Ratio (M‐H, Random, 95% CI) | 0.93 [0.88, 0.99] |
| 7.1 Major surgery | 62 | 5712 | Risk Ratio (M‐H, Random, 95% CI) | 0.84 [0.68, 1.04] |
| 7.2 Stroke | 4 | 5056 | Risk Ratio (M‐H, Random, 95% CI) | 0.91 [0.79, 1.05] |
| 7.3 ICU participants including trauma | 15 | 5626 | Risk Ratio (M‐H, Random, 95% CI) | 0.97 [0.85, 1.11] |
| 7.4 Frail elderly participants with less severe conditions known to increase protein requirements | 19 | 2385 | Risk Ratio (M‐H, Random, 95% CI) | 0.85 [0.65, 1.11] |
| 7.5 Participants do not fall into one of the categories above | 41 | 4391 | Risk Ratio (M‐H, Random, 95% CI) | 0.98 [0.84, 1.14] |
| 8 All‐cause mortality ‐ participants characterised as 'at nutritional risk' due to one of the following criteria Show forest plot | 141 | 23170 | Risk Ratio (M‐H, Random, 95% CI) | 0.93 [0.88, 0.99] |
| 8.1 BMI less than 20.5 kg/m2 | 2 | 247 | Risk Ratio (M‐H, Random, 95% CI) | 1.19 [0.58, 2.45] |
| 8.2 Weight loss of at least 5% during the last three months | 1 | 32 | Risk Ratio (M‐H, Random, 95% CI) | 0.0 [0.0, 0.0] |
| 8.3 Weight loss of at least 10% during the last six months | 3 | 124 | Risk Ratio (M‐H, Random, 95% CI) | 1.07 [0.11, 10.33] |
| 8.4 Insufficient food intake during the last week (50% of requirements or less) | 0 | 0 | Risk Ratio (M‐H, Random, 95% CI) | 0.0 [0.0, 0.0] |
| 8.5 Participants characterised as 'at nutritional risk' by other means | 135 | 22767 | Risk Ratio (M‐H, Random, 95% CI) | 0.93 [0.88, 0.99] |
| 9 All‐cause mortality ‐ participants characterised as 'at nutritional risk' due to biomarkers or anthropometrics Show forest plot | 141 | 23170 | Risk Ratio (M‐H, Random, 95% CI) | 0.93 [0.88, 0.99] |
| 9.1 Biomarkers | 7 | 749 | Risk Ratio (M‐H, Random, 95% CI) | 0.40 [0.16, 1.00] |
| 9.2 Anthropometric measures | 12 | 1402 | Risk Ratio (M‐H, Random, 95% CI) | 0.79 [0.55, 1.11] |
| 9.3 Both anthropometrics and biomarkers | 3 | 75 | Risk Ratio (M‐H, Random, 95% CI) | 0.66 [0.14, 3.07] |
| 9.4 Characterised by other means | 119 | 20944 | Risk Ratio (M‐H, Random, 95% CI) | 0.94 [0.89, 1.00] |
| 10 All‐cause mortality ‐ randomisation year Show forest plot | 141 | 23170 | Risk Ratio (M‐H, Random, 95% CI) | 0.93 [0.88, 0.99] |
| 10.1 Before 1960 | 0 | 0 | Risk Ratio (M‐H, Random, 95% CI) | 0.0 [0.0, 0.0] |
| 10.2 1960 to 1979 | 6 | 237 | Risk Ratio (M‐H, Random, 95% CI) | 1.07 [0.52, 2.23] |
| 10.3 1980 to 1999 | 86 | 12055 | Risk Ratio (M‐H, Random, 95% CI) | 0.92 [0.86, 1.00] |
| 10.4 After 1999 | 49 | 10878 | Risk Ratio (M‐H, Random, 95% CI) | 0.93 [0.81, 1.06] |
| 11 All‐cause mortality ‐ trials where the intervention lasts fewer than three days compared with trials where the intervention lasts three days or more Show forest plot | 141 | 23170 | Risk Ratio (M‐H, Random, 95% CI) | 0.93 [0.88, 0.99] |
| 11.1 Three days or more | 127 | 22394 | Risk Ratio (M‐H, Random, 95% CI) | 0.93 [0.88, 0.99] |
| 11.2 Fewer than three days | 12 | 699 | Risk Ratio (M‐H, Random, 95% CI) | 1.05 [0.72, 1.54] |
| 11.3 Unknown | 2 | 77 | Risk Ratio (M‐H, Random, 95% CI) | 0.25 [0.01, 5.00] |
| 12 All‐cause mortality ‐ 'best‐worst case' scenario Show forest plot | 141 | 23700 | Risk Ratio (M‐H, Random, 95% CI) | 0.77 [0.69, 0.85] |
| 13 All‐cause mortality ‐ 'worst‐best case' scenario Show forest plot | 141 | 23700 | Risk Ratio (M‐H, Random, 95% CI) | 1.09 [0.98, 1.23] |
| 14 All‐cause mortality co‐interventions Show forest plot | 141 | 23170 | Risk Ratio (M‐H, Fixed, 95% CI) | 0.92 [0.86, 0.98] |
| 14.1 received nutrition support as co‐intervention | 13 | 5475 | Risk Ratio (M‐H, Fixed, 95% CI) | 0.95 [0.82, 1.08] |
| 14.2 did not receive nutrition support as co‐intervention | 125 | 17462 | Risk Ratio (M‐H, Fixed, 95% CI) | 0.91 [0.85, 0.98] |
| 14.3 delayed versus early nutrition support | 3 | 233 | Risk Ratio (M‐H, Fixed, 95% CI) | 0.99 [0.53, 1.83] |
| Outcome or subgroup title | No. of studies | No. of participants | Statistical method | Effect size |
| 1 Serious adverse events ‐ overall Show forest plot | 137 | 22087 | Risk Ratio (M‐H, Random, 95% CI) | 0.93 [0.86, 1.01] |
| 2 Serious adverse events ‐ bias Show forest plot | 137 | 22087 | Risk Ratio (M‐H, Random, 95% CI) | 0.93 [0.86, 1.01] |
| 2.1 High risk of bias | 137 | 22087 | Risk Ratio (M‐H, Random, 95% CI) | 0.93 [0.86, 1.01] |
| 2.2 Low risk of bias | 0 | 0 | Risk Ratio (M‐H, Random, 95% CI) | 0.0 [0.0, 0.0] |
| 3 Serious adverse events ‐ mode of delivery Show forest plot | 137 | 22087 | Risk Ratio (M‐H, Random, 95% CI) | 0.93 [0.86, 1.01] |
| 3.1 General nutrition support | 6 | 1420 | Risk Ratio (M‐H, Random, 95% CI) | 1.19 [0.79, 1.78] |
| 3.2 Fortified | 2 | 290 | Risk Ratio (M‐H, Random, 95% CI) | 1.24 [0.61, 2.54] |
| 3.3 Oral | 33 | 8569 | Risk Ratio (M‐H, Random, 95% CI) | 0.92 [0.79, 1.06] |
| 3.4 Enteral | 43 | 3935 | Risk Ratio (M‐H, Random, 95% CI) | 0.85 [0.74, 0.98] |
| 3.5 Parenteral | 48 | 7519 | Risk Ratio (M‐H, Random, 95% CI) | 0.98 [0.85, 1.14] |
| 3.6 Mixed | 5 | 354 | Risk Ratio (M‐H, Random, 95% CI) | 0.77 [0.33, 1.76] |
| 4 Serious adverse events ‐ by medical specialty Show forest plot | 137 | 22087 | Risk Ratio (M‐H, Random, 95% CI) | 0.93 [0.86, 1.01] |
| 4.1 Cardiology | 0 | 0 | Risk Ratio (M‐H, Random, 95% CI) | 0.0 [0.0, 0.0] |
| 4.2 Medical gastroenterology and hepatology | 10 | 518 | Risk Ratio (M‐H, Random, 95% CI) | 0.90 [0.60, 1.36] |
| 4.3 High risk | 0 | 0 | Risk Ratio (M‐H, Random, 95% CI) | 0.0 [0.0, 0.0] |
| 4.4 Geriatrics | 13 | 2554 | Risk Ratio (M‐H, Random, 95% CI) | 0.85 [0.66, 1.08] |
| 4.5 Pulmonary disease | 3 | 118 | Risk Ratio (M‐H, Random, 95% CI) | 0.44 [0.15, 1.28] |
| 4.6 Endocrinology | 0 | 0 | Risk Ratio (M‐H, Random, 95% CI) | 0.0 [0.0, 0.0] |
| 4.7 Infectious diseases | 1 | 56 | Risk Ratio (M‐H, Random, 95% CI) | 1.23 [0.52, 2.93] |
| 4.8 Rheumatology | 0 | 0 | Risk Ratio (M‐H, Random, 95% CI) | 0.0 [0.0, 0.0] |
| 4.9 Haematology | 0 | 0 | Risk Ratio (M‐H, Random, 95% CI) | 0.0 [0.0, 0.0] |
| 4.10 Nephrology | 0 | 0 | Risk Ratio (M‐H, Random, 95% CI) | 0.0 [0.0, 0.0] |
| 4.11 Gastroenterologic surgery | 57 | 4320 | Risk Ratio (M‐H, Random, 95% CI) | 0.86 [0.72, 1.02] |
| 4.12 Trauma surgery | 5 | 225 | Risk Ratio (M‐H, Random, 95% CI) | 0.93 [0.55, 1.57] |
| 4.13 Ortopaedics | 12 | 1210 | Risk Ratio (M‐H, Random, 95% CI) | 1.39 [0.90, 2.14] |
| 4.14 Plastic, reconstructive, and aesthetic surgery | 0 | 0 | Risk Ratio (M‐H, Random, 95% CI) | 0.0 [0.0, 0.0] |
| 4.15 Vascular surgery | 3 | 48 | Risk Ratio (M‐H, Random, 95% CI) | 0.5 [0.05, 4.67] |
| 4.16 Transplant surgery | 3 | 84 | Risk Ratio (M‐H, Random, 95% CI) | 0.58 [0.23, 1.50] |
| 4.17 Urology | 0 | 0 | Risk Ratio (M‐H, Random, 95% CI) | 0.0 [0.0, 0.0] |
| 4.18 Thoracic surgery | 3 | 592 | Risk Ratio (M‐H, Random, 95% CI) | 0.47 [0.06, 3.62] |
| 4.19 Neurological surgery | 0 | 0 | Risk Ratio (M‐H, Random, 95% CI) | 0.0 [0.0, 0.0] |
| 4.20 Oro‐maxillo‐facial surgery | 1 | 32 | Risk Ratio (M‐H, Random, 95% CI) | 0.88 [0.44, 1.78] |
| 4.21 Anaesthesiology | 0 | 0 | Risk Ratio (M‐H, Random, 95% CI) | 0.0 [0.0, 0.0] |
| 4.22 Emergency medicine | 7 | 5198 | Risk Ratio (M‐H, Random, 95% CI) | 0.99 [0.80, 1.22] |
| 4.23 Psychiatry | 0 | 0 | Risk Ratio (M‐H, Random, 95% CI) | 0.0 [0.0, 0.0] |
| 4.24 Neurology | 7 | 5168 | Risk Ratio (M‐H, Random, 95% CI) | 0.78 [0.58, 1.06] |
| 4.25 Oncology | 5 | 309 | Risk Ratio (M‐H, Random, 95% CI) | 1.12 [0.51, 2.44] |
| 4.26 Dermatology | 0 | 0 | Risk Ratio (M‐H, Random, 95% CI) | 0.0 [0.0, 0.0] |
| 4.27 Gynaecology | 0 | 0 | Risk Ratio (M‐H, Random, 95% CI) | 0.0 [0.0, 0.0] |
| 4.28 Mixed | 7 | 1655 | Risk Ratio (M‐H, Random, 95% CI) | 1.24 [0.92, 1.67] |
| 5 Serious adverse events ‐ based on adequacy of the amount of calories Show forest plot | 137 | 22087 | Risk Ratio (M‐H, Random, 95% CI) | 0.93 [0.86, 1.01] |
| 5.1 Clearly adequate in intervention and clearly inadequate in control | 28 | 7405 | Risk Ratio (M‐H, Random, 95% CI) | 0.95 [0.80, 1.11] |
| 5.2 Inadequate in the experimental or adequate in the control | 28 | 7335 | Risk Ratio (M‐H, Random, 95% CI) | 0.97 [0.84, 1.13] |
| 5.3 Experimental group is overfed | 6 | 224 | Risk Ratio (M‐H, Random, 95% CI) | 0.85 [0.44, 1.67] |
| 5.4 Unclear intake in control or experimental | 75 | 7123 | Risk Ratio (M‐H, Random, 95% CI) | 0.83 [0.70, 0.98] |
| 6 Serious adverse events ‐ different screening tools Show forest plot | 137 | 22087 | Risk Ratio (M‐H, Random, 95% CI) | 0.93 [0.86, 1.01] |
| 6.1 NRS 2002 | 4 | 5064 | Risk Ratio (M‐H, Random, 95% CI) | 1.06 [0.87, 1.31] |
| 6.2 MUST | 0 | 0 | Risk Ratio (M‐H, Random, 95% CI) | 0.0 [0.0, 0.0] |
| 6.3 MNA | 2 | 117 | Risk Ratio (M‐H, Random, 95% CI) | 0.61 [0.12, 3.18] |
| 6.4 SGA | 3 | 1175 | Risk Ratio (M‐H, Random, 95% CI) | 0.82 [0.35, 1.92] |
| 6.5 Other means | 128 | 15731 | Risk Ratio (M‐H, Random, 95% CI) | 0.90 [0.82, 0.98] |
| 7 Serious adverse events ‐ participants characterised as 'at nutritional risk' due to one of the following conditions Show forest plot | 137 | 22087 | Risk Ratio (M‐H, Random, 95% CI) | 0.93 [0.86, 1.01] |
| 7.1 Major surgery | 65 | 5180 | Risk Ratio (M‐H, Random, 95% CI) | 0.84 [0.71, 0.99] |
| 7.2 Stroke | 6 | 5139 | Risk Ratio (M‐H, Random, 95% CI) | 0.78 [0.58, 1.06] |
| 7.3 ICU participants including trauma | 12 | 5423 | Risk Ratio (M‐H, Random, 95% CI) | 0.98 [0.81, 1.19] |
| 7.4 Frail elderly participants with less severe conditions known to increase protein requirements | 19 | 2406 | Risk Ratio (M‐H, Random, 95% CI) | 0.97 [0.75, 1.26] |
| 7.5 Participants do not fall into one of the categories above | 35 | 3939 | Risk Ratio (M‐H, Random, 95% CI) | 1.01 [0.85, 1.21] |
| 8 Serious adverse events ‐ participants characterised as 'at nutritional risk' due to one of the following criteria Show forest plot | 137 | 22087 | Risk Ratio (M‐H, Random, 95% CI) | 0.93 [0.86, 1.01] |
| 8.1 BMI less than 20.5 kg/m2 | 2 | 247 | Risk Ratio (M‐H, Random, 95% CI) | 1.19 [0.58, 2.45] |
| 8.2 Weight loss of at least 5% during the last three months | 1 | 32 | Risk Ratio (M‐H, Random, 95% CI) | 0.0 [0.0, 0.0] |
| 8.3 Weight loss of at least 10% during the last six months | 1 | 32 | Risk Ratio (M‐H, Random, 95% CI) | 0.88 [0.44, 1.78] |
| 8.4 Insufficient food intake during the last week (50% of requirements or less) | 0 | 0 | Risk Ratio (M‐H, Random, 95% CI) | 0.0 [0.0, 0.0] |
| 8.5 Participants characterised as 'at nutritional risk' by other means | 133 | 21776 | Risk Ratio (M‐H, Random, 95% CI) | 0.93 [0.86, 1.01] |
| 9 Serious adverse events ‐ participants characterised as 'at nutritional risk' due to biomarkers or anthropometrics Show forest plot | 137 | 22087 | Risk Ratio (M‐H, Random, 95% CI) | 0.93 [0.86, 1.01] |
| 9.1 Biomarkers | 8 | 703 | Risk Ratio (M‐H, Random, 95% CI) | 0.39 [0.16, 0.95] |
| 9.2 Anthropometric measures | 15 | 1677 | Risk Ratio (M‐H, Random, 95% CI) | 0.90 [0.68, 1.20] |
| 9.3 Mixed | 0 | 0 | Risk Ratio (M‐H, Random, 95% CI) | 0.0 [0.0, 0.0] |
| 9.4 Characterised by other means | 114 | 19707 | Risk Ratio (M‐H, Random, 95% CI) | 0.94 [0.86, 1.02] |
| 10 Serious adverse events ‐ randomisation year Show forest plot | 137 | 22087 | Risk Ratio (M‐H, Random, 95% CI) | 0.93 [0.86, 1.01] |
| 10.1 Before 1960 | 0 | 0 | Risk Ratio (M‐H, Random, 95% CI) | 0.0 [0.0, 0.0] |
| 10.2 1960 to 1979 | 5 | 184 | Risk Ratio (M‐H, Random, 95% CI) | 1.40 [0.70, 2.78] |
| 10.3 1980 to 1999 | 86 | 11472 | Risk Ratio (M‐H, Random, 95% CI) | 0.91 [0.82, 1.00] |
| 10.4 After 1999 | 46 | 10431 | Risk Ratio (M‐H, Random, 95% CI) | 0.89 [0.75, 1.06] |
| 11 Serious adverse events ‐ trials where the intervention lasts fewer than three days compared with trials where the intervention lasts three days or more Show forest plot | 137 | 22087 | Risk Ratio (M‐H, Random, 95% CI) | 0.93 [0.86, 1.01] |
| 11.1 Three days or more | 125 | 21408 | Risk Ratio (M‐H, Random, 95% CI) | 0.94 [0.86, 1.02] |
| 11.2 Less than three days | 10 | 602 | Risk Ratio (M‐H, Random, 95% CI) | 0.67 [0.39, 1.16] |
| 11.3 Unknown | 2 | 77 | Risk Ratio (M‐H, Random, 95% CI) | 0.25 [0.01, 5.00] |
| 12 Serious adverse events ‐ 'best‐worst case' scenario Show forest plot | 137 | 22557 | Risk Ratio (M‐H, Random, 95% CI) | 0.74 [0.65, 0.83] |
| 13 Serious adverse events ‐ 'worst‐best case' scenario Show forest plot | 137 | 22557 | Risk Ratio (M‐H, Random, 95% CI) | 1.06 [0.92, 1.21] |
| 14 Serious adverse events co‐interventions Show forest plot | 137 | 22087 | Risk Ratio (M‐H, Fixed, 95% CI) | 0.91 [0.84, 0.99] |
| 14.1 received nutrition support as co‐intervention | 11 | 5337 | Risk Ratio (M‐H, Fixed, 95% CI) | 0.95 [0.79, 1.15] |
| 14.2 did not receive nutrition support as co‐intervention | 119 | 16327 | Risk Ratio (M‐H, Fixed, 95% CI) | 0.90 [0.83, 0.99] |
| 14.3 delayed versus early nutrition support | 7 | 423 | Risk Ratio (M‐H, Fixed, 95% CI) | 0.89 [0.51, 1.57] |
| Outcome or subgroup title | No. of studies | No. of participants | Statistical method | Effect size |
| 1 Serious adverse events ‐ overall Show forest plot | 152 | 23413 | Risk Ratio (M‐H, Random, 95% CI) | 0.91 [0.85, 0.97] |
| 2 Serious adverse events ‐ bias Show forest plot | 152 | 23413 | Risk Ratio (M‐H, Random, 95% CI) | 0.91 [0.85, 0.97] |
| 2.1 High risk of bias | 152 | 23413 | Risk Ratio (M‐H, Random, 95% CI) | 0.91 [0.85, 0.97] |
| 2.2 Low risk of bias | 0 | 0 | Risk Ratio (M‐H, Random, 95% CI) | 0.0 [0.0, 0.0] |
| 3 Serious adverse events ‐ mode of delivery Show forest plot | 152 | 23413 | Risk Ratio (M‐H, Random, 95% CI) | 0.91 [0.85, 0.97] |
| 3.1 General nutrition support | 7 | 1544 | Risk Ratio (M‐H, Random, 95% CI) | 1.04 [0.76, 1.44] |
| 3.2 Fortified nutrition | 2 | 290 | Risk Ratio (M‐H, Random, 95% CI) | 1.24 [0.61, 2.54] |
| 3.3 Oral nutrition support | 33 | 8541 | Risk Ratio (M‐H, Random, 95% CI) | 0.89 [0.74, 1.07] |
| 3.4 Enteral nutrition | 49 | 4425 | Risk Ratio (M‐H, Random, 95% CI) | 0.82 [0.73, 0.91] |
| 3.5 Parenteral nutrition | 56 | 8263 | Risk Ratio (M‐H, Random, 95% CI) | 0.98 [0.90, 1.07] |
| 3.6 Mixed | 5 | 350 | Risk Ratio (M‐H, Random, 95% CI) | 0.74 [0.37, 1.48] |
| 4 Serious adverse events ‐ by medical specialty Show forest plot | 152 | 23413 | Risk Ratio (M‐H, Random, 95% CI) | 0.91 [0.85, 0.97] |
| 4.1 Cardiology | 0 | 0 | Risk Ratio (M‐H, Random, 95% CI) | 0.0 [0.0, 0.0] |
| 4.2 Medical gastroenterology and hepatology | 13 | 706 | Risk Ratio (M‐H, Random, 95% CI) | 0.94 [0.75, 1.17] |
| 4.3 Geriatrics | 13 | 2547 | Risk Ratio (M‐H, Random, 95% CI) | 0.88 [0.67, 1.17] |
| 4.4 Pulmonary disease | 3 | 118 | Risk Ratio (M‐H, Random, 95% CI) | 0.44 [0.15, 1.28] |
| 4.5 Endocrinology | 0 | 0 | Risk Ratio (M‐H, Random, 95% CI) | 0.0 [0.0, 0.0] |
| 4.6 Infectious diseases | 1 | 56 | Risk Ratio (M‐H, Random, 95% CI) | 1.23 [0.52, 2.93] |
| 4.7 Rheumatology | 0 | 0 | Risk Ratio (M‐H, Random, 95% CI) | 0.0 [0.0, 0.0] |
| 4.8 Haematology | 0 | 0 | Risk Ratio (M‐H, Random, 95% CI) | 0.0 [0.0, 0.0] |
| 4.9 Nephrology | 0 | 0 | Risk Ratio (M‐H, Random, 95% CI) | 0.0 [0.0, 0.0] |
| 4.10 Gastroenterologic surgery | 59 | 4835 | Risk Ratio (M‐H, Random, 95% CI) | 0.83 [0.71, 0.97] |
| 4.11 Trauma surgery | 7 | 290 | Risk Ratio (M‐H, Random, 95% CI) | 0.86 [0.55, 1.34] |
| 4.12 Ortopaedics | 12 | 1196 | Risk Ratio (M‐H, Random, 95% CI) | 0.98 [0.63, 1.51] |
| 4.13 Plastic, reconstructive, and aesthetic surgery | 0 | 0 | Risk Ratio (M‐H, Random, 95% CI) | 0.0 [0.0, 0.0] |
| 4.14 Vascular surgery | 3 | 48 | Risk Ratio (M‐H, Random, 95% CI) | 0.5 [0.05, 4.67] |
| 4.15 Transplant surgery | 3 | 84 | Risk Ratio (M‐H, Random, 95% CI) | 0.54 [0.22, 1.31] |
| 4.16 Urology | 0 | 0 | Risk Ratio (M‐H, Random, 95% CI) | 0.0 [0.0, 0.0] |
| 4.17 Thoracic surgery | 3 | 592 | Risk Ratio (M‐H, Random, 95% CI) | 0.47 [0.06, 3.62] |
| 4.18 Neurological surgery | 0 | 0 | Risk Ratio (M‐H, Random, 95% CI) | 0.0 [0.0, 0.0] |
| 4.19 Oro‐maxillo‐facial surgery | 1 | 32 | Risk Ratio (M‐H, Random, 95% CI) | 0.88 [0.44, 1.78] |
| 4.20 Anaesthesiology | 0 | 0 | Risk Ratio (M‐H, Random, 95% CI) | 0.0 [0.0, 0.0] |
| 4.21 Emergency medicine | 11 | 5421 | Risk Ratio (M‐H, Random, 95% CI) | 0.96 [0.84, 1.10] |
| 4.22 Psychiatry | 0 | 0 | Risk Ratio (M‐H, Random, 95% CI) | 0.0 [0.0, 0.0] |
| 4.23 Neurology | 9 | 5426 | Risk Ratio (M‐H, Random, 95% CI) | 0.75 [0.58, 0.98] |
| 4.24 Oncology | 7 | 407 | Risk Ratio (M‐H, Random, 95% CI) | 1.02 [0.87, 1.20] |
| 4.25 Dermatology | 0 | 0 | Risk Ratio (M‐H, Random, 95% CI) | 0.0 [0.0, 0.0] |
| 4.26 Gynaecology | 0 | 0 | Risk Ratio (M‐H, Random, 95% CI) | 0.0 [0.0, 0.0] |
| 4.27 Mixed | 7 | 1655 | Risk Ratio (M‐H, Random, 95% CI) | 1.29 [0.97, 1.71] |
| 5 Serious adverse events ‐ based on adequacy of the amount of calories Show forest plot | 152 | 23413 | Risk Ratio (M‐H, Random, 95% CI) | 0.91 [0.85, 0.97] |
| 5.1 Clearly adequate in intervention and clearly inadequate in control | 31 | 7623 | Risk Ratio (M‐H, Random, 95% CI) | 0.95 [0.86, 1.05] |
| 5.2 Inadequate in the experimental or adequate in the control | 29 | 7395 | Risk Ratio (M‐H, Random, 95% CI) | 0.95 [0.85, 1.05] |
| 5.3 Experimental group is overfed | 11 | 867 | Risk Ratio (M‐H, Random, 95% CI) | 0.92 [0.72, 1.19] |
| 5.4 Unclear intake in control or experimental | 81 | 7528 | Risk Ratio (M‐H, Random, 95% CI) | 0.81 [0.70, 0.94] |
| 6 Serious adverse events ‐ different screening tools Show forest plot | 152 | 23413 | Risk Ratio (M‐H, Random, 95% CI) | 0.91 [0.85, 0.97] |
| 6.1 NRS 2002 | 4 | 5064 | Risk Ratio (M‐H, Random, 95% CI) | 1.03 [0.89, 1.21] |
| 6.2 MUST | 1 | 124 | Risk Ratio (M‐H, Random, 95% CI) | 1.37 [0.64, 2.92] |
| 6.3 MNA | 2 | 117 | Risk Ratio (M‐H, Random, 95% CI) | 0.61 [0.12, 3.18] |
| 6.4 SGA | 0 | 0 | Risk Ratio (M‐H, Random, 95% CI) | 0.0 [0.0, 0.0] |
| 6.5 Other means | 145 | 18108 | Risk Ratio (M‐H, Random, 95% CI) | 0.89 [0.82, 0.95] |
| 7 Serious adverse events ‐ participants characterised as 'at nutritional risk' due to one of the following conditions Show forest plot | 152 | 23413 | Risk Ratio (M‐H, Random, 95% CI) | 0.91 [0.85, 0.97] |
| 7.1 Major surgery | 72 | 5936 | Risk Ratio (M‐H, Random, 95% CI) | 0.82 [0.71, 0.94] |
| 7.2 Stroke | 8 | 5397 | Risk Ratio (M‐H, Random, 95% CI) | 0.75 [0.58, 0.98] |
| 7.3 ICU participants including trauma | 16 | 5667 | Risk Ratio (M‐H, Random, 95% CI) | 0.96 [0.84, 1.10] |
| 7.4 Frail elderly participants with less severe conditions known to increase protein requirements | 19 | 2385 | Risk Ratio (M‐H, Random, 95% CI) | 0.82 [0.65, 1.03] |
| 7.5 Participants do not fall into one of the categories above | 37 | 4028 | Risk Ratio (M‐H, Random, 95% CI) | 1.03 [0.92, 1.15] |
| 8 Serious adverse events ‐ participants characterised as 'at nutritional risk' due to one of the following criteria Show forest plot | 152 | 23413 | Risk Ratio (M‐H, Random, 95% CI) | 0.91 [0.85, 0.97] |
| 8.1 BMI less than 20.5 kg/m2 | 2 | 247 | Risk Ratio (M‐H, Random, 95% CI) | 1.19 [0.58, 2.45] |
| 8.2 Weight loss of at least 5% during the last three months | 1 | 32 | Risk Ratio (M‐H, Random, 95% CI) | 0.0 [0.0, 0.0] |
| 8.3 Weight loss of at least 10% during the last six months | 3 | 124 | Risk Ratio (M‐H, Random, 95% CI) | 0.84 [0.42, 1.67] |
| 8.4 Insufficient food intake during the last week (50% of requirements or less) | 0 | 0 | Risk Ratio (M‐H, Random, 95% CI) | 0.0 [0.0, 0.0] |
| 8.5 Participants characterised as 'at nutritional risk' by other means | 146 | 23010 | Risk Ratio (M‐H, Random, 95% CI) | 0.90 [0.84, 0.97] |
| 9 Serious adverse events ‐ participants characterised as 'at nutritional risk' due to biomarkers or anthropometrics Show forest plot | 152 | 23413 | Risk Ratio (M‐H, Random, 95% CI) | 0.91 [0.85, 0.97] |
| 9.1 Biomarkers | 10 | 795 | Risk Ratio (M‐H, Random, 95% CI) | 0.37 [0.16, 0.85] |
| 9.2 Anthropometric measures | 12 | 1402 | Risk Ratio (M‐H, Random, 95% CI) | 0.76 [0.54, 1.08] |
| 9.3 Both | 3 | 75 | Risk Ratio (M‐H, Random, 95% CI) | 0.66 [0.14, 3.07] |
| 9.4 Characterised by other means | 127 | 21141 | Risk Ratio (M‐H, Random, 95% CI) | 0.91 [0.85, 0.98] |
| 10 Serious adverse events ‐ randomisation year Show forest plot | 152 | 23413 | Risk Ratio (M‐H, Random, 95% CI) | 0.91 [0.85, 0.97] |
| 10.1 Before 1960 | 0 | 0 | Risk Ratio (M‐H, Random, 95% CI) | 0.0 [0.0, 0.0] |
| 10.2 1960 to 1979 | 6 | 240 | Risk Ratio (M‐H, Random, 95% CI) | 1.18 [0.65, 2.14] |
| 10.3 1980 to 1999 | 93 | 12128 | Risk Ratio (M‐H, Random, 95% CI) | 0.92 [0.86, 0.99] |
| 10.4 After 1999 | 53 | 11045 | Risk Ratio (M‐H, Random, 95% CI) | 0.83 [0.72, 0.97] |
| 11 Serious adverse events ‐ trials where the intervention lasts fewer than three days compared with trials where the intervention lasts three days or more Show forest plot | 152 | 23413 | Risk Ratio (M‐H, Random, 95% CI) | 0.91 [0.85, 0.97] |
| 11.1 Three days or more | 138 | 22637 | Risk Ratio (M‐H, Random, 95% CI) | 0.90 [0.84, 0.97] |
| 11.2 Less than three days | 12 | 699 | Risk Ratio (M‐H, Random, 95% CI) | 0.90 [0.66, 1.23] |
| 11.3 Unknown | 2 | 77 | Risk Ratio (M‐H, Random, 95% CI) | 0.25 [0.01, 5.00] |
| 12 Serious adverse events ‐ 'best‐worst case' scenario Show forest plot | 152 | 24315 | Risk Ratio (M‐H, Random, 95% CI) | 0.72 [0.65, 0.79] |
| 13 Serious adverse events ‐ 'worst‐best case' scenario Show forest plot | 152 | 24082 | Risk Ratio (M‐H, Random, 95% CI) | 1.05 [0.94, 1.17] |
| 14 Serious adverse events co‐interventions Show forest plot | 152 | 23413 | Risk Ratio (M‐H, Fixed, 95% CI) | 0.89 [0.84, 0.95] |
| 14.1 Received nutrition support as co‐intervention | 12 | 5459 | Risk Ratio (M‐H, Fixed, 95% CI) | 0.93 [0.81, 1.06] |
| 14.2 did not receive nutrition support as co‐intervention | 132 | 17493 | Risk Ratio (M‐H, Fixed, 95% CI) | 0.88 [0.82, 0.94] |
| 14.3 delayed versus early nutrition support | 8 | 461 | Risk Ratio (M‐H, Fixed, 95% CI) | 1.09 [0.75, 1.59] |
| 15 Serious adverse events ‐ 'best‐worse case' scenario (enteral nutrition) Show forest plot | 46 | 4415 | Risk Ratio (M‐H, Random, 95% CI) | 0.62 [0.51, 0.75] |
| 16 Serious adverse events ‐ 'worst‐best case' scenario (enteral nutrition) Show forest plot | 46 | 4415 | Risk Ratio (M‐H, Random, 95% CI) | 0.81 [0.69, 0.96] |
| Outcome or subgroup title | No. of studies | No. of participants | Statistical method | Effect size |
| 1 Quality of life ‐ overall Show forest plot | 2 | 242 | Mean Difference (IV, Random, 95% CI) | 2.35 [‐2.94, 7.65] |
| Outcome or subgroup title | No. of studies | No. of participants | Statistical method | Effect size |
| 1 Quality of life ‐ overall Show forest plot | 3 | 289 | Mean Difference (IV, Random, 95% CI) | 1.54 [‐2.47, 5.55] |
| Outcome or subgroup title | No. of studies | No. of participants | Statistical method | Effect size |
| 1 Quality of life ‐ overall Show forest plot | 2 | 242 | Mean Difference (IV, Random, 95% CI) | ‐0.90 [‐3.92, 2.13] |
| Outcome or subgroup title | No. of studies | No. of participants | Statistical method | Effect size |
| 1 Quality of life ‐ overall Show forest plot | 3 | 289 | Mean Difference (IV, Random, 95% CI) | ‐0.25 [‐3.02, 2.53] |
| Outcome or subgroup title | No. of studies | No. of participants | Statistical method | Effect size |
| 1 Quality of life ‐ overall Show forest plot | 2 | 3961 | Mean Difference (IV, Random, 95% CI) | ‐0.01 [‐0.03, 0.01] |
| Outcome or subgroup title | No. of studies | No. of participants | Statistical method | Effect size |
| 1 Pneumonia Show forest plot | 28 | 12443 | Risk Ratio (M‐H, Random, 95% CI) | 1.06 [0.96, 1.16] |
| Outcome or subgroup title | No. of studies | No. of participants | Statistical method | Effect size |
| 1 Wound dehiscence Show forest plot | 14 | 2280 | Risk Ratio (M‐H, Random, 95% CI) | 0.71 [0.40, 1.24] |
| Outcome or subgroup title | No. of studies | No. of participants | Statistical method | Effect size |
| 1 Renal failure Show forest plot | 5 | 6359 | Risk Ratio (M‐H, Random, 95% CI) | 1.00 [0.83, 1.20] |
| Outcome or subgroup title | No. of studies | No. of participants | Statistical method | Effect size |
| 1 Wound infection Show forest plot | 28 | 8324 | Risk Ratio (M‐H, Random, 95% CI) | 0.81 [0.60, 1.10] |
| Outcome or subgroup title | No. of studies | No. of participants | Statistical method | Effect size |
| 1 Heart failure Show forest plot | 3 | 1041 | Risk Ratio (M‐H, Random, 95% CI) | 1.11 [0.34, 3.61] |
| Outcome or subgroup title | No. of studies | No. of participants | Statistical method | Effect size |
| 1 AcM ‐ EoI Show forest plot | 6 | 5578 | Risk Ratio (M‐H, Fixed, 95% CI) | 1.01 [0.81, 1.25] |
| 2 AcM ‐ MF Show forest plot | 6 | 5578 | Risk Ratio (M‐H, Random, 95% CI) | 1.01 [0.86, 1.18] |
| 3 SaE ‐ EoI Show forest plot | 6 | 5578 | Risk Ratio (M‐H, Fixed, 95% CI) | 0.96 [0.78, 1.19] |
| 4 SaE ‐ MF Show forest plot | 6 | 5578 | Risk Ratio (M‐H, Random, 95% CI) | 0.98 [0.84, 1.14] |
| Outcome or subgroup title | No. of studies | No. of participants | Statistical method | Effect size |
| 1 AcM ‐ EoI Show forest plot | 17 | 6760 | Risk Ratio (M‐H, Random, 95% CI) | 0.99 [0.82, 1.20] |
| 2 AcM ‐ MF Show forest plot | 20 | 6978 | Risk Ratio (M‐H, Random, 95% CI) | 0.95 [0.82, 1.09] |
| 3 SaE ‐ EoI Show forest plot | 20 | 6794 | Risk Ratio (M‐H, Fixed, 95% CI) | 0.96 [0.81, 1.14] |
| 4 SaE ‐ MF Show forest plot | 23 | 7012 | Risk Ratio (M‐H, Random, 95% CI) | 0.91 [0.80, 1.03] |
| Outcome or subgroup title | No. of studies | No. of participants | Statistical method | Effect size |
| 1 All‐cause mortality ‐ overall Show forest plot | 33 | 8529 | Risk Ratio (M‐H, Random, 95% CI) | 0.94 [0.79, 1.11] |
| 2 All‐cause mortality ‐ bias Show forest plot | 33 | 8529 | Risk Ratio (M‐H, Random, 95% CI) | 0.94 [0.79, 1.11] |
| 2.1 High risk of bias | 33 | 8529 | Risk Ratio (M‐H, Random, 95% CI) | 0.94 [0.79, 1.11] |
| 2.2 Low risk of bias | 0 | 0 | Risk Ratio (M‐H, Random, 95% CI) | 0.0 [0.0, 0.0] |
| 3 All‐cause mortality ‐ medical speciality Show forest plot | 33 | 8529 | Risk Ratio (M‐H, Random, 95% CI) | 0.95 [0.80, 1.12] |
| 3.1 Cardiology | 0 | 0 | Risk Ratio (M‐H, Random, 95% CI) | 0.0 [0.0, 0.0] |
| 3.2 Medical gastroenterology and hepatology | 1 | 36 | Risk Ratio (M‐H, Random, 95% CI) | 0.45 [0.10, 2.01] |
| 3.3 Geriatrics | 9 | 1559 | Risk Ratio (M‐H, Random, 95% CI) | 0.75 [0.56, 0.99] |
| 3.4 Pulmonary disease | 2 | 93 | Risk Ratio (M‐H, Random, 95% CI) | 0.49 [0.16, 1.54] |
| 3.5 Endocrinology | 0 | 0 | Risk Ratio (M‐H, Random, 95% CI) | 0.0 [0.0, 0.0] |
| 3.6 Infectious diseases | 0 | 0 | Risk Ratio (M‐H, Random, 95% CI) | 0.0 [0.0, 0.0] |
| 3.7 Rheumatology | 0 | 0 | Risk Ratio (M‐H, Random, 95% CI) | 0.0 [0.0, 0.0] |
| 3.8 Haematology | 0 | 0 | Risk Ratio (M‐H, Random, 95% CI) | 0.0 [0.0, 0.0] |
| 3.9 Nephrology | 0 | 0 | Risk Ratio (M‐H, Random, 95% CI) | 0.0 [0.0, 0.0] |
| 3.10 Gastroenterologic surgery | 11 | 1267 | Risk Ratio (M‐H, Random, 95% CI) | 1.24 [0.65, 2.38] |
| 3.11 Trauma surgery | 0 | 0 | Risk Ratio (M‐H, Random, 95% CI) | 0.0 [0.0, 0.0] |
| 3.12 Orthopaedics | 4 | 371 | Risk Ratio (M‐H, Random, 95% CI) | 1.69 [0.53, 5.36] |
| 3.13 Plastic, reconstructive and aesthetic surgery | 0 | 0 | Risk Ratio (M‐H, Random, 95% CI) | 0.0 [0.0, 0.0] |
| 3.14 Vascular surgery | 0 | 0 | Risk Ratio (M‐H, Random, 95% CI) | 0.0 [0.0, 0.0] |
| 3.15 Transplant surgery | 1 | 37 | Risk Ratio (M‐H, Random, 95% CI) | 0.35 [0.02, 8.09] |
| 3.16 Urology | 0 | 0 | Risk Ratio (M‐H, Random, 95% CI) | 0.0 [0.0, 0.0] |
| 3.17 Thoracic surgery | 0 | 0 | Risk Ratio (M‐H, Random, 95% CI) | 0.0 [0.0, 0.0] |
| 3.18 Neurological surgery | 0 | 0 | Risk Ratio (M‐H, Random, 95% CI) | 0.0 [0.0, 0.0] |
| 3.19 Oro‐maxillo‐facial surgery | 0 | 0 | Risk Ratio (M‐H, Random, 95% CI) | 0.0 [0.0, 0.0] |
| 3.20 Anaesthesiology | 0 | 0 | Risk Ratio (M‐H, Random, 95% CI) | 0.0 [0.0, 0.0] |
| 3.21 Emergency medicine | 0 | 0 | Risk Ratio (M‐H, Random, 95% CI) | 0.0 [0.0, 0.0] |
| 3.22 Psychiatry | 0 | 0 | Risk Ratio (M‐H, Random, 95% CI) | 0.0 [0.0, 0.0] |
| 3.23 Neurology | 3 | 4092 | Risk Ratio (M‐H, Random, 95% CI) | 0.99 [0.76, 1.27] |
| 3.24 Oncology | 0 | 0 | Risk Ratio (M‐H, Random, 95% CI) | 0.0 [0.0, 0.0] |
| 3.25 Dermatology | 0 | 0 | Risk Ratio (M‐H, Random, 95% CI) | 0.0 [0.0, 0.0] |
| 3.26 Gynaecology | 0 | 0 | Risk Ratio (M‐H, Random, 95% CI) | 0.0 [0.0, 0.0] |
| 3.27 Mixed | 2 | 1074 | Risk Ratio (M‐H, Random, 95% CI) | 1.24 [0.73, 2.12] |
| 4 All‐cause mortality ‐ based on adequacy of the amount of calories Show forest plot | 33 | 8529 | Risk Ratio (M‐H, Random, 95% CI) | 0.94 [0.79, 1.11] |
| 4.1 Clearly adequate in experimental group and clearly inadequate in control group | 4 | 260 | Risk Ratio (M‐H, Random, 95% CI) | 1.08 [0.34, 3.47] |
| 4.2 Inadequate in the experimental group or adequate in the control group | 12 | 5540 | Risk Ratio (M‐H, Random, 95% CI) | 0.94 [0.76, 1.17] |
| 4.3 Experimental group is overfed | 2 | 69 | Risk Ratio (M‐H, Random, 95% CI) | 0.53 [0.14, 1.98] |
| 4.4 Unclear intake in experimental group or control group | 15 | 2660 | Risk Ratio (M‐H, Random, 95% CI) | 0.93 [0.62, 1.38] |
| 5 All‐cause mortality ‐ different screening tools Show forest plot | 33 | 8529 | Risk Ratio (M‐H, Random, 95% CI) | 0.94 [0.79, 1.11] |
| 5.1 NRS 2002 | 0 | 0 | Risk Ratio (M‐H, Random, 95% CI) | 0.0 [0.0, 0.0] |
| 5.2 MUST | 0 | 0 | Risk Ratio (M‐H, Random, 95% CI) | 0.0 [0.0, 0.0] |
| 5.3 MNA | 2 | 117 | Risk Ratio (M‐H, Random, 95% CI) | 0.61 [0.12, 3.18] |
| 5.4 SGA | 1 | 525 | Risk Ratio (M‐H, Random, 95% CI) | 1.51 [0.99, 2.31] |
| 5.5 Other means | 30 | 7887 | Risk Ratio (M‐H, Random, 95% CI) | 0.87 [0.73, 1.04] |
| 6 All‐cause mortality ‐ participants characterised as 'at nutritional risk' due to one of the following conditions Show forest plot | 33 | 8529 | Risk Ratio (M‐H, Random, 95% CI) | 0.94 [0.79, 1.11] |
| 6.1 Major surgery | 13 | 1364 | Risk Ratio (M‐H, Random, 95% CI) | 0.92 [0.49, 1.72] |
| 6.2 Stroke | 2 | 4063 | Risk Ratio (M‐H, Random, 95% CI) | 0.96 [0.74, 1.24] |
| 6.3 ICU participants including trauma | 0 | 0 | Risk Ratio (M‐H, Random, 95% CI) | 0.0 [0.0, 0.0] |
| 6.4 Frail elderly participants with less severe conditions known to increase protein requirements | 9 | 953 | Risk Ratio (M‐H, Random, 95% CI) | 0.85 [0.55, 1.30] |
| 6.5 Participants do not fall into one of the categories above | 9 | 2149 | Risk Ratio (M‐H, Random, 95% CI) | 0.93 [0.62, 1.39] |
| 7 All‐cause mortality ‐ participants characterised as 'at nutritional risk' due to one of the following criteria Show forest plot | 33 | 8529 | Risk Ratio (M‐H, Random, 95% CI) | 0.94 [0.79, 1.11] |
| 7.1 BMI less than 20.5 kg/m2 | 1 | 37 | Risk Ratio (M‐H, Random, 95% CI) | 0.35 [0.02, 8.09] |
| 7.2 Weight loss of at least 5% during the last three months | 0 | 0 | Risk Ratio (M‐H, Random, 95% CI) | 0.0 [0.0, 0.0] |
| 7.3 Weight loss of at least 10% during the last six months | 0 | 0 | Risk Ratio (M‐H, Random, 95% CI) | 0.0 [0.0, 0.0] |
| 7.4 Insufficient food intake during the last week (50% of requirements or less) | 0 | 0 | Risk Ratio (M‐H, Random, 95% CI) | 0.0 [0.0, 0.0] |
| 7.5 Participants characterised as 'at nutritional risk' by other means | 32 | 8492 | Risk Ratio (M‐H, Random, 95% CI) | 0.94 [0.79, 1.12] |
| 8 All‐cause mortality ‐ participants characterised as 'at nutritional risk' due to biomarkers or anthropometrics Show forest plot | 33 | 8529 | Risk Ratio (M‐H, Random, 95% CI) | 0.94 [0.79, 1.11] |
| 8.1 Biomarkers | 1 | 60 | Risk Ratio (M‐H, Random, 95% CI) | 0.43 [0.12, 1.50] |
| 8.2 Anthropometric measures | 6 | 1111 | Risk Ratio (M‐H, Random, 95% CI) | 0.78 [0.52, 1.16] |
| 8.3 Characterised by other means | 26 | 7358 | Risk Ratio (M‐H, Random, 95% CI) | 1.00 [0.80, 1.25] |
| 9 All‐cause mortality ‐ randomisation year Show forest plot | 33 | 8529 | Risk Ratio (M‐H, Random, 95% CI) | 0.94 [0.79, 1.11] |
| 9.1 Before 1960 | 0 | 0 | Risk Ratio (M‐H, Random, 95% CI) | 0.0 [0.0, 0.0] |
| 9.2 1960‐1979 | 1 | 60 | Risk Ratio (M‐H, Random, 95% CI) | 0.76 [0.24, 2.43] |
| 9.3 1980‐1999 | 18 | 7002 | Risk Ratio (M‐H, Random, 95% CI) | 0.87 [0.72, 1.04] |
| 9.4 After 1999 | 14 | 1467 | Risk Ratio (M‐H, Random, 95% CI) | 1.11 [0.64, 1.92] |
| 10 All‐cause mortality ‐ trials where the intervention lasts fewer than three days compared with trials where the intervention lasts three days or more Show forest plot | 33 | 8529 | Risk Ratio (M‐H, Random, 95% CI) | 0.94 [0.79, 1.11] |
| 10.1 Three days or more | 26 | 7797 | Risk Ratio (M‐H, Random, 95% CI) | 0.87 [0.74, 1.04] |
| 10.2 Less than three days | 6 | 207 | Risk Ratio (M‐H, Random, 95% CI) | 0.18 [0.01, 3.91] |
| 10.3 Unknown | 1 | 525 | Risk Ratio (M‐H, Random, 95% CI) | 1.51 [0.99, 2.31] |
| 11 All‐cause mortality ‐ 'best‐worst case' scenario Show forest plot | 33 | 8793 | Risk Ratio (M‐H, Random, 95% CI) | 0.72 [0.55, 0.95] |
| 12 All‐cause mortality ‐ 'worst‐best case' scenario Show forest plot | 33 | 8793 | Risk Ratio (M‐H, Random, 95% CI) | 1.33 [0.95, 1.86] |
| 13 All‐cause mortality co‐interventions Show forest plot | 33 | 8529 | Risk Ratio (M‐H, Random, 95% CI) | 0.94 [0.79, 1.11] |
| 13.1 received nutrition support as co‐intervention | 1 | 60 | Risk Ratio (M‐H, Random, 95% CI) | 0.43 [0.12, 1.50] |
| 13.2 did not receive nutrition support as co‐intervention | 32 | 8469 | Risk Ratio (M‐H, Random, 95% CI) | 0.95 [0.81, 1.12] |
| 13.3 delayed versus early nutrition support | 0 | 0 | Risk Ratio (M‐H, Random, 95% CI) | 0.0 [0.0, 0.0] |
| Outcome or subgroup title | No. of studies | No. of participants | Statistical method | Effect size |
| 1 All‐cause mortality ‐ overall Show forest plot | 32 | 8501 | Risk Ratio (M‐H, Random, 95% CI) | 0.94 [0.77, 1.15] |
| 2 All‐cause mortality ‐ bias Show forest plot | 32 | 8501 | Risk Ratio (M‐H, Random, 95% CI) | 0.94 [0.77, 1.15] |
| 2.1 High risk of bias | 32 | 8501 | Risk Ratio (M‐H, Random, 95% CI) | 0.94 [0.77, 1.15] |
| 2.2 Low risk of bias | 0 | 0 | Risk Ratio (M‐H, Random, 95% CI) | 0.0 [0.0, 0.0] |
| 3 All‐cause mortality ‐ medical speciality Show forest plot | 32 | 8501 | Risk Ratio (M‐H, Random, 95% CI) | 0.94 [0.77, 1.15] |
| 3.1 Cardiology | 0 | 0 | Risk Ratio (M‐H, Random, 95% CI) | 0.0 [0.0, 0.0] |
| 3.2 Medical gastroenterology and hepatology | 1 | 36 | Risk Ratio (M‐H, Random, 95% CI) | 0.45 [0.10, 2.01] |
| 3.3 Geriatrics | 9 | 1552 | Risk Ratio (M‐H, Random, 95% CI) | 0.81 [0.55, 1.19] |
| 3.4 Pulmonary disease | 2 | 93 | Risk Ratio (M‐H, Random, 95% CI) | 0.49 [0.16, 1.54] |
| 3.5 Endocrinology | 0 | 0 | Risk Ratio (M‐H, Random, 95% CI) | 0.0 [0.0, 0.0] |
| 3.6 Infectious diseases | 0 | 0 | Risk Ratio (M‐H, Random, 95% CI) | 0.0 [0.0, 0.0] |
| 3.7 Rheumatology | 0 | 0 | Risk Ratio (M‐H, Random, 95% CI) | 0.0 [0.0, 0.0] |
| 3.8 Haematology | 0 | 0 | Risk Ratio (M‐H, Random, 95% CI) | 0.0 [0.0, 0.0] |
| 3.9 Nephrology | 0 | 0 | Risk Ratio (M‐H, Random, 95% CI) | 0.0 [0.0, 0.0] |
| 3.10 Gastroenterologic surgery | 10 | 1267 | Risk Ratio (M‐H, Random, 95% CI) | 1.14 [0.61, 2.12] |
| 3.11 Trauma surgery | 0 | 0 | Risk Ratio (M‐H, Random, 95% CI) | 0.0 [0.0, 0.0] |
| 3.12 Ortopaedics | 4 | 361 | Risk Ratio (M‐H, Random, 95% CI) | 1.80 [0.92, 3.52] |
| 3.13 Plastic, reconstructive, and aesthetic surgery | 0 | 0 | Risk Ratio (M‐H, Random, 95% CI) | 0.0 [0.0, 0.0] |
| 3.14 Vascular surgery | 0 | 0 | Risk Ratio (M‐H, Random, 95% CI) | 0.0 [0.0, 0.0] |
| 3.15 Transplant surgery | 1 | 37 | Risk Ratio (M‐H, Random, 95% CI) | 0.35 [0.02, 8.09] |
| 3.16 Urology | 0 | 0 | Risk Ratio (M‐H, Random, 95% CI) | 0.0 [0.0, 0.0] |
| 3.17 Thoracic surgery | 0 | 0 | Risk Ratio (M‐H, Random, 95% CI) | 0.0 [0.0, 0.0] |
| 3.18 Neurological surgery | 0 | 0 | Risk Ratio (M‐H, Random, 95% CI) | 0.0 [0.0, 0.0] |
| 3.19 Oro‐maxillo‐facial surgery | 0 | 0 | Risk Ratio (M‐H, Random, 95% CI) | 0.0 [0.0, 0.0] |
| 3.20 Anaesthesiology | 0 | 0 | Risk Ratio (M‐H, Random, 95% CI) | 0.0 [0.0, 0.0] |
| 3.21 Emergency medicine | 0 | 0 | Risk Ratio (M‐H, Random, 95% CI) | 0.0 [0.0, 0.0] |
| 3.22 Psychiatry | 0 | 0 | Risk Ratio (M‐H, Random, 95% CI) | 0.0 [0.0, 0.0] |
| 3.23 Neurology | 3 | 4081 | Risk Ratio (M‐H, Random, 95% CI) | 0.65 [0.22, 1.93] |
| 3.24 Oncology | 0 | 0 | Risk Ratio (M‐H, Random, 95% CI) | 0.0 [0.0, 0.0] |
| 3.25 Dermatology | 0 | 0 | Risk Ratio (M‐H, Random, 95% CI) | 0.0 [0.0, 0.0] |
| 3.26 Gynaecology | 0 | 0 | Risk Ratio (M‐H, Random, 95% CI) | 0.0 [0.0, 0.0] |
| 3.27 Mixed | 2 | 1074 | Risk Ratio (M‐H, Random, 95% CI) | 1.24 [0.73, 2.12] |
| 4 All‐cause mortality ‐ based on adequacy of the amount of calories Show forest plot | 32 | 8501 | Risk Ratio (M‐H, Random, 95% CI) | 0.94 [0.77, 1.15] |
| 4.1 Clearly adequate in intervention and clearly inadequate in control | 4 | 260 | Risk Ratio (M‐H, Random, 95% CI) | 0.80 [0.17, 3.70] |
| 4.2 Inadequate in the experimental or adequate in the control | 12 | 5512 | Risk Ratio (M‐H, Random, 95% CI) | 0.94 [0.76, 1.17] |
| 4.3 Experimental group is overfed | 2 | 69 | Risk Ratio (M‐H, Random, 95% CI) | 0.53 [0.14, 1.98] |
| 4.4 Unclear intake in control or experimental | 14 | 2660 | Risk Ratio (M‐H, Random, 95% CI) | 0.95 [0.65, 1.38] |
| 5 All‐cause mortality ‐ different screening tools Show forest plot | 32 | 8501 | Risk Ratio (M‐H, Random, 95% CI) | 0.94 [0.77, 1.15] |
| 5.1 NRS 2002 | 0 | 0 | Risk Ratio (M‐H, Random, 95% CI) | 0.0 [0.0, 0.0] |
| 5.2 MUST | 0 | 0 | Risk Ratio (M‐H, Random, 95% CI) | 0.0 [0.0, 0.0] |
| 5.3 MNA | 2 | 117 | Risk Ratio (M‐H, Random, 95% CI) | 0.61 [0.12, 3.18] |
| 5.4 SGA | 1 | 525 | Risk Ratio (M‐H, Random, 95% CI) | 1.51 [0.99, 2.31] |
| 5.5 Other means | 29 | 7859 | Risk Ratio (M‐H, Random, 95% CI) | 0.89 [0.73, 1.09] |
| 6 All‐cause mortality ‐ participants characterised as 'at nutritional risk' due to one of the following conditions Show forest plot | 32 | 8501 | Risk Ratio (M‐H, Random, 95% CI) | 0.94 [0.77, 1.15] |
| 6.1 Major surgery | 11 | 1304 | Risk Ratio (M‐H, Random, 95% CI) | 1.09 [0.59, 2.00] |
| 6.2 Stroke | 2 | 4052 | Risk Ratio (M‐H, Random, 95% CI) | 0.65 [0.22, 1.93] |
| 6.3 ICU participants including trauma | 0 | 0 | Risk Ratio (M‐H, Random, 95% CI) | 0.0 [0.0, 0.0] |
| 6.4 Frail elderly participants with less severe conditions known to increase protein requirements | 10 | 996 | Risk Ratio (M‐H, Random, 95% CI) | 0.87 [0.57, 1.34] |
| 6.5 Participants do not fall into one of the categories above | 9 | 2149 | Risk Ratio (M‐H, Random, 95% CI) | 0.96 [0.64, 1.46] |
| 7 All‐cause mortality ‐ participants characterised as 'at nutritional risk' due to one of the following criteria Show forest plot | 32 | 8501 | Risk Ratio (M‐H, Random, 95% CI) | 0.94 [0.77, 1.15] |
| 7.1 BMI less than 20.5 kg/m2 | 1 | 37 | Risk Ratio (M‐H, Random, 95% CI) | 0.35 [0.02, 8.09] |
| 7.2 Weight loss of at least 5% during the last three months | 0 | 0 | Risk Ratio (M‐H, Random, 95% CI) | 0.0 [0.0, 0.0] |
| 7.3 Weight loss of at least 10% during the last six months | 0 | 0 | Risk Ratio (M‐H, Random, 95% CI) | 0.0 [0.0, 0.0] |
| 7.4 Insufficient food intake during the last week (50% of requirements or less) | 0 | 0 | Risk Ratio (M‐H, Random, 95% CI) | 0.0 [0.0, 0.0] |
| 7.5 Participants characterised as 'at nutritional risk' by other means | 31 | 8464 | Risk Ratio (M‐H, Random, 95% CI) | 0.94 [0.77, 1.16] |
| 8 All‐cause mortality ‐ participants characterised as 'at nutritional risk' due to biomarkers or anthropometrics Show forest plot | 32 | 8501 | Risk Ratio (M‐H, Random, 95% CI) | 0.94 [0.77, 1.15] |
| 8.1 Biomarkers | 1 | 60 | Risk Ratio (M‐H, Random, 95% CI) | 0.43 [0.12, 1.50] |
| 8.2 Anthropometric measures | 6 | 1111 | Risk Ratio (M‐H, Random, 95% CI) | 0.78 [0.52, 1.16] |
| 8.3 Both anthropometrics and biomarkers | 0 | 0 | Risk Ratio (M‐H, Random, 95% CI) | 0.0 [0.0, 0.0] |
| 8.4 Characterised by other means | 25 | 7330 | Risk Ratio (M‐H, Random, 95% CI) | 0.99 [0.77, 1.26] |
| 9 All‐cause mortality ‐ randomisation year Show forest plot | 32 | 8501 | Risk Ratio (M‐H, Random, 95% CI) | 0.94 [0.77, 1.15] |
| 9.1 Before 1960 | 0 | 0 | Risk Ratio (M‐H, Random, 95% CI) | 0.0 [0.0, 0.0] |
| 9.2 1960 to 1979 | 1 | 60 | Risk Ratio (M‐H, Random, 95% CI) | 0.76 [0.24, 2.43] |
| 9.3 1980 to 1999 | 18 | 6974 | Risk Ratio (M‐H, Random, 95% CI) | 0.86 [0.71, 1.05] |
| 9.4 After 1999 | 13 | 1467 | Risk Ratio (M‐H, Random, 95% CI) | 1.19 [0.77, 1.83] |
| 10 All‐cause mortality ‐ trials where the intervention lasts fewer than three days compared with trials where the intervention lasts three days or more Show forest plot | 32 | 8501 | Risk Ratio (M‐H, Random, 95% CI) | 0.94 [0.77, 1.15] |
| 10.1 Three days or more | 31 | 8462 | Risk Ratio (M‐H, Random, 95% CI) | 0.94 [0.77, 1.15] |
| 10.2 Less than three days | 1 | 39 | Risk Ratio (M‐H, Random, 95% CI) | 0.0 [0.0, 0.0] |
| 10.3 Unknown | 0 | 0 | Risk Ratio (M‐H, Random, 95% CI) | 0.0 [0.0, 0.0] |
| 11 All‐cause mortality ‐ 'best‐worst case' scenario Show forest plot | 32 | 8793 | Risk Ratio (M‐H, Random, 95% CI) | 0.70 [0.54, 0.91] |
| 12 All‐cause mortality ‐ 'worst‐best case' scenario Show forest plot | 32 | 8793 | Risk Ratio (M‐H, Random, 95% CI) | 1.27 [0.93, 1.73] |
| 13 All‐cause mortality co‐interventions Show forest plot | 131 | 22435 | Risk Ratio (M‐H, Fixed, 95% CI) | 0.91 [0.86, 0.98] |
| 13.1 received nutrition support as co‐intervention | 8 | 5185 | Risk Ratio (M‐H, Fixed, 95% CI) | 0.93 [0.80, 1.08] |
| 13.2 did not receive nutrition support as co‐intervention | 120 | 17017 | Risk Ratio (M‐H, Fixed, 95% CI) | 0.91 [0.84, 0.98] |
| 13.3 delayed versus early nutrition support | 3 | 233 | Risk Ratio (M‐H, Fixed, 95% CI) | 0.99 [0.53, 1.83] |
| Outcome or subgroup title | No. of studies | No. of participants | Statistical method | Effect size |
| 1 Serious adverse events ‐ overall Show forest plot | 33 | 8569 | Risk Ratio (M‐H, Random, 95% CI) | 0.92 [0.79, 1.06] |
| 2 Serious adverse events ‐ bias Show forest plot | 33 | 8569 | Risk Ratio (M‐H, Random, 95% CI) | 0.92 [0.79, 1.06] |
| 2.1 High risk of bias | 33 | 8569 | Risk Ratio (M‐H, Random, 95% CI) | 0.92 [0.79, 1.06] |
| 2.2 Low risk of bias | 0 | 0 | Risk Ratio (M‐H, Random, 95% CI) | 0.0 [0.0, 0.0] |
| 3 Serious adverse events ‐ by medical specialty Show forest plot | 33 | 8569 | Risk Ratio (M‐H, Random, 95% CI) | 0.92 [0.79, 1.06] |
| 3.1 Cardiology | 0 | 0 | Risk Ratio (M‐H, Random, 95% CI) | 0.0 [0.0, 0.0] |
| 3.2 Medical gastroenterology and hepatology | 1 | 36 | Risk Ratio (M‐H, Random, 95% CI) | 0.45 [0.10, 2.01] |
| 3.3 Geriatrics | 10 | 1609 | Risk Ratio (M‐H, Random, 95% CI) | 0.74 [0.56, 0.97] |
| 3.4 Pulmonary disease | 2 | 93 | Risk Ratio (M‐H, Random, 95% CI) | 0.49 [0.16, 1.54] |
| 3.5 Endocrinology | 0 | 0 | Risk Ratio (M‐H, Random, 95% CI) | 0.0 [0.0, 0.0] |
| 3.6 Infectious diseases | 0 | 0 | Risk Ratio (M‐H, Random, 95% CI) | 0.0 [0.0, 0.0] |
| 3.7 Rheumatology | 0 | 0 | Risk Ratio (M‐H, Random, 95% CI) | 0.0 [0.0, 0.0] |
| 3.8 Haematology | 0 | 0 | Risk Ratio (M‐H, Random, 95% CI) | 0.0 [0.0, 0.0] |
| 3.9 Nephrology | 0 | 0 | Risk Ratio (M‐H, Random, 95% CI) | 0.0 [0.0, 0.0] |
| 3.10 Gastroenterologic surgery | 10 | 1253 | Risk Ratio (M‐H, Random, 95% CI) | 0.91 [0.66, 1.25] |
| 3.11 Trauma surgery | 0 | 0 | Risk Ratio (M‐H, Random, 95% CI) | 0.0 [0.0, 0.0] |
| 3.12 Ortopaedics | 4 | 371 | Risk Ratio (M‐H, Random, 95% CI) | 1.69 [0.53, 5.36] |
| 3.13 Plastic, reconstructive, and aesthetic surgery | 0 | 0 | Risk Ratio (M‐H, Random, 95% CI) | 0.0 [0.0, 0.0] |
| 3.14 Vascular surgery | 0 | 0 | Risk Ratio (M‐H, Random, 95% CI) | 0.0 [0.0, 0.0] |
| 3.15 Transplant surgery | 1 | 37 | Risk Ratio (M‐H, Random, 95% CI) | 0.35 [0.02, 8.09] |
| 3.16 Urology | 0 | 0 | Risk Ratio (M‐H, Random, 95% CI) | 0.0 [0.0, 0.0] |
| 3.17 Thoracic surgery | 0 | 0 | Risk Ratio (M‐H, Random, 95% CI) | 0.0 [0.0, 0.0] |
| 3.18 Neurological surgery | 0 | 0 | Risk Ratio (M‐H, Random, 95% CI) | 0.0 [0.0, 0.0] |
| 3.19 Oro‐maxillo‐facial surgery | 0 | 0 | Risk Ratio (M‐H, Random, 95% CI) | 0.0 [0.0, 0.0] |
| 3.20 Anaesthesiology | 0 | 0 | Risk Ratio (M‐H, Random, 95% CI) | 0.0 [0.0, 0.0] |
| 3.21 Emergency medicine | 0 | 0 | Risk Ratio (M‐H, Random, 95% CI) | 0.0 [0.0, 0.0] |
| 3.22 Psychiatry | 0 | 0 | Risk Ratio (M‐H, Random, 95% CI) | 0.0 [0.0, 0.0] |
| 3.23 Neurology | 3 | 4092 | Risk Ratio (M‐H, Random, 95% CI) | 0.96 [0.74, 1.24] |
| 3.24 Oncology | 0 | 0 | Risk Ratio (M‐H, Random, 95% CI) | 0.0 [0.0, 0.0] |
| 3.25 Dermatology | 0 | 0 | Risk Ratio (M‐H, Random, 95% CI) | 0.0 [0.0, 0.0] |
| 3.26 Gynaecology | 0 | 0 | Risk Ratio (M‐H, Random, 95% CI) | 0.0 [0.0, 0.0] |
| 3.27 Mixed | 2 | 1078 | Risk Ratio (M‐H, Random, 95% CI) | 1.24 [0.73, 2.12] |
| 4 Serious adverse events ‐ based on adequacy of the amount of calories Show forest plot | 33 | 8569 | Risk Ratio (M‐H, Random, 95% CI) | 0.92 [0.79, 1.06] |
| 4.1 Clearly adequate in intervention and clearly inadequate in control | 4 | 246 | Risk Ratio (M‐H, Random, 95% CI) | 0.99 [0.33, 3.02] |
| 4.2 Inadequate in the experimental or adequate in the control | 13 | 5590 | Risk Ratio (M‐H, Random, 95% CI) | 0.91 [0.76, 1.10] |
| 4.3 Experimental group is overfed | 2 | 69 | Risk Ratio (M‐H, Random, 95% CI) | 0.53 [0.14, 1.98] |
| 4.4 Unclear intake in control or experimental | 14 | 2664 | Risk Ratio (M‐H, Random, 95% CI) | 0.92 [0.63, 1.34] |
| 5 Serious adverse events ‐ different screening tools Show forest plot | 33 | 8569 | Risk Ratio (M‐H, Random, 95% CI) | 0.92 [0.79, 1.06] |
| 5.1 NRS 2002 | 0 | 0 | Risk Ratio (M‐H, Random, 95% CI) | 0.0 [0.0, 0.0] |
| 5.2 MUST | 0 | 0 | Risk Ratio (M‐H, Random, 95% CI) | 0.0 [0.0, 0.0] |
| 5.3 MNA | 2 | 117 | Risk Ratio (M‐H, Random, 95% CI) | 0.61 [0.12, 3.18] |
| 5.4 SGA | 1 | 529 | Risk Ratio (M‐H, Random, 95% CI) | 1.51 [0.99, 2.31] |
| 5.5 Other means | 30 | 7923 | Risk Ratio (M‐H, Random, 95% CI) | 0.86 [0.74, 1.01] |
| 6 Serious adverse events ‐ participants characterised as 'at nutritional risk' due to one of the following conditions Show forest plot | 33 | 8569 | Risk Ratio (M‐H, Random, 95% CI) | 0.92 [0.79, 1.06] |
| 6.1 Major surgery | 10 | 612 | Risk Ratio (M‐H, Random, 95% CI) | 0.67 [0.22, 2.08] |
| 6.2 Stroke | 2 | 4063 | Risk Ratio (M‐H, Random, 95% CI) | 0.96 [0.74, 1.24] |
| 6.3 ICU participants including trauma | 0 | 0 | Risk Ratio (M‐H, Random, 95% CI) | 0.0 [0.0, 0.0] |
| 6.4 Frail elderly participants with less severe conditions known to increase protein requirements | 11 | 1063 | Risk Ratio (M‐H, Random, 95% CI) | 0.77 [0.52, 1.15] |
| 6.5 Participants do not fall into one of the categories above | 10 | 2831 | Risk Ratio (M‐H, Random, 95% CI) | 0.94 [0.70, 1.26] |
| 7 Serious adverse events ‐ participants characterised as 'at nutritional risk' due to one of the following criteria Show forest plot | 33 | 8569 | Risk Ratio (M‐H, Random, 95% CI) | 0.92 [0.79, 1.06] |
| 7.1 BMI less than 20.5 kg/m2 | 1 | 37 | Risk Ratio (M‐H, Random, 95% CI) | 0.35 [0.02, 8.09] |
| 7.2 Weight loss of at least 5% during the last three months | 0 | 0 | Risk Ratio (M‐H, Random, 95% CI) | 0.0 [0.0, 0.0] |
| 7.3 Weight loss of at least 10% during the last six months | 0 | 0 | Risk Ratio (M‐H, Random, 95% CI) | 0.0 [0.0, 0.0] |
| 7.4 Insufficient food intake during the last week (50% of requirements or less) | 0 | 0 | Risk Ratio (M‐H, Random, 95% CI) | 0.0 [0.0, 0.0] |
| 7.5 Participants characterised as 'at nutritional risk' by other means | 32 | 8532 | Risk Ratio (M‐H, Random, 95% CI) | 0.92 [0.79, 1.06] |
| 8 Serious adverse events ‐ participants characterised as 'at nutritional risk' due to biomarkers or anthropometrics Show forest plot | 33 | 8569 | Risk Ratio (M‐H, Random, 95% CI) | 0.92 [0.79, 1.06] |
| 8.1 Biomarkers | 1 | 60 | Risk Ratio (M‐H, Random, 95% CI) | 0.43 [0.12, 1.50] |
| 8.2 Anthropometric measures | 6 | 1111 | Risk Ratio (M‐H, Random, 95% CI) | 0.78 [0.52, 1.16] |
| 8.3 Mixed | 0 | 0 | Risk Ratio (M‐H, Random, 95% CI) | 0.0 [0.0, 0.0] |
| 8.4 Characterised by other means | 26 | 7398 | Risk Ratio (M‐H, Random, 95% CI) | 0.95 [0.81, 1.12] |
| 9 Serious adverse events ‐ randomisation year Show forest plot | 33 | 8569 | Risk Ratio (M‐H, Random, 95% CI) | 0.92 [0.79, 1.06] |
| 9.1 Before 1960 | 0 | 0 | Risk Ratio (M‐H, Random, 95% CI) | 0.0 [0.0, 0.0] |
| 9.2 1960 to 1979 | 1 | 60 | Risk Ratio (M‐H, Random, 95% CI) | 0.76 [0.24, 2.43] |
| 9.3 1980 to 1999 | 18 | 6988 | Risk Ratio (M‐H, Random, 95% CI) | 0.86 [0.73, 1.01] |
| 9.4 After 1999 | 14 | 1521 | Risk Ratio (M‐H, Random, 95% CI) | 1.05 [0.61, 1.82] |
| 10 Serious adverse events ‐ trials where the intervention lasts fewer than three days compared with trials where the intervention lasts three days or more Show forest plot | 33 | 8569 | Risk Ratio (M‐H, Random, 95% CI) | 0.92 [0.79, 1.06] |
| 10.1 Three days or more | 31 | 8480 | Risk Ratio (M‐H, Random, 95% CI) | 0.92 [0.80, 1.06] |
| 10.2 Less than three days | 1 | 39 | Risk Ratio (M‐H, Random, 95% CI) | 0.0 [0.0, 0.0] |
| 10.3 Unknown | 1 | 50 | Risk Ratio (M‐H, Random, 95% CI) | 0.25 [0.01, 5.00] |
| 11 Serious adverse events ‐ 'best‐worst case' scenario Show forest plot | 33 | 8844 | Risk Ratio (M‐H, Random, 95% CI) | 0.67 [0.52, 0.86] |
| 12 Serious adverse events ‐ 'worst‐best case' scenario Show forest plot | 33 | 8844 | Risk Ratio (M‐H, Random, 95% CI) | 1.27 [0.92, 1.75] |
| 13 Serious adverse events co‐interventions Show forest plot | 134 | 21960 | Risk Ratio (M‐H, Fixed, 95% CI) | 0.91 [0.84, 0.99] |
| 13.1 received nutrition support as co‐intervention | 8 | 5178 | Risk Ratio (M‐H, Fixed, 95% CI) | 0.96 [0.79, 1.17] |
| 13.2 did not receive nutrition support as co‐intervention | 119 | 16359 | Risk Ratio (M‐H, Fixed, 95% CI) | 0.90 [0.83, 0.99] |
| 13.3 delayed versus early nutrition support | 7 | 423 | Risk Ratio (M‐H, Fixed, 95% CI) | 0.89 [0.51, 1.57] |
| Outcome or subgroup title | No. of studies | No. of participants | Statistical method | Effect size |
| 1 Serious adverse events ‐ overall Show forest plot | 33 | 8541 | Risk Ratio (M‐H, Random, 95% CI) | 0.89 [0.74, 1.07] |
| 2 Serious adverse events ‐ bias Show forest plot | 33 | 8541 | Risk Ratio (M‐H, Random, 95% CI) | 0.89 [0.74, 1.07] |
| 2.1 High risk of bias | 33 | 8541 | Risk Ratio (M‐H, Random, 95% CI) | 0.89 [0.74, 1.07] |
| 2.2 Low risk of bias | 0 | 0 | Risk Ratio (M‐H, Random, 95% CI) | 0.0 [0.0, 0.0] |
| 3 Serious adverse events ‐ by medical speciality Show forest plot | 33 | 8541 | Risk Ratio (M‐H, Random, 95% CI) | 0.89 [0.74, 1.07] |
| 3.1 Cardiology | 0 | 0 | Risk Ratio (M‐H, Random, 95% CI) | 0.0 [0.0, 0.0] |
| 3.2 Medical gastroenterology and hepatology | 1 | 36 | Risk Ratio (M‐H, Random, 95% CI) | 0.45 [0.10, 2.01] |
| 3.3 Geriatrics | 10 | 1602 | Risk Ratio (M‐H, Random, 95% CI) | 0.80 [0.55, 1.15] |
| 3.4 Pulmonary disease | 2 | 93 | Risk Ratio (M‐H, Random, 95% CI) | 0.49 [0.16, 1.54] |
| 3.5 Endocrinology | 0 | 0 | Risk Ratio (M‐H, Random, 95% CI) | 0.0 [0.0, 0.0] |
| 3.6 Infectious diseases | 0 | 0 | Risk Ratio (M‐H, Random, 95% CI) | 0.0 [0.0, 0.0] |
| 3.7 Rheumatology | 0 | 0 | Risk Ratio (M‐H, Random, 95% CI) | 0.0 [0.0, 0.0] |
| 3.8 Haematology | 0 | 0 | Risk Ratio (M‐H, Random, 95% CI) | 0.0 [0.0, 0.0] |
| 3.9 Nephrology | 0 | 0 | Risk Ratio (M‐H, Random, 95% CI) | 0.0 [0.0, 0.0] |
| 3.10 Gastroenterologic surgery | 10 | 1253 | Risk Ratio (M‐H, Random, 95% CI) | 0.83 [0.61, 1.12] |
| 3.11 Trauma surgery | 0 | 0 | Risk Ratio (M‐H, Random, 95% CI) | 0.0 [0.0, 0.0] |
| 3.12 Ortopaedics | 4 | 361 | Risk Ratio (M‐H, Random, 95% CI) | 1.80 [0.92, 3.52] |
| 3.13 Plastic, reconstructive, and aesthetic surgery | 0 | 0 | Risk Ratio (M‐H, Random, 95% CI) | 0.0 [0.0, 0.0] |
| 3.14 Vascular surgery | 0 | 0 | Risk Ratio (M‐H, Random, 95% CI) | 0.0 [0.0, 0.0] |
| 3.15 Transplant surgery | 1 | 37 | Risk Ratio (M‐H, Random, 95% CI) | 0.35 [0.02, 8.09] |
| 3.16 Urology | 0 | 0 | Risk Ratio (M‐H, Random, 95% CI) | 0.0 [0.0, 0.0] |
| 3.17 Thoracic surgery | 0 | 0 | Risk Ratio (M‐H, Random, 95% CI) | 0.0 [0.0, 0.0] |
| 3.18 Neurological surgery | 0 | 0 | Risk Ratio (M‐H, Random, 95% CI) | 0.0 [0.0, 0.0] |
| 3.19 Oro‐maxillo‐facial surgery | 0 | 0 | Risk Ratio (M‐H, Random, 95% CI) | 0.0 [0.0, 0.0] |
| 3.20 Anaesthesiology | 0 | 0 | Risk Ratio (M‐H, Random, 95% CI) | 0.0 [0.0, 0.0] |
| 3.21 Emergency medicine | 0 | 0 | Risk Ratio (M‐H, Random, 95% CI) | 0.0 [0.0, 0.0] |
| 3.22 Psychiatry | 0 | 0 | Risk Ratio (M‐H, Random, 95% CI) | 0.0 [0.0, 0.0] |
| 3.23 Neurology | 3 | 4081 | Risk Ratio (M‐H, Random, 95% CI) | 0.65 [0.22, 1.93] |
| 3.24 Oncology | 0 | 0 | Risk Ratio (M‐H, Random, 95% CI) | 0.0 [0.0, 0.0] |
| 3.25 Dermatology | 0 | 0 | Risk Ratio (M‐H, Random, 95% CI) | 0.0 [0.0, 0.0] |
| 3.26 Gynaecology | 0 | 0 | Risk Ratio (M‐H, Random, 95% CI) | 0.0 [0.0, 0.0] |
| 3.27 Mixed | 2 | 1078 | Risk Ratio (M‐H, Random, 95% CI) | 1.24 [0.73, 2.12] |
| 4 Serious adverse events ‐ based on adequacy of the amount of calories Show forest plot | 33 | 8541 | Risk Ratio (M‐H, Random, 95% CI) | 0.89 [0.74, 1.07] |
| 4.1 Clearly adequate in intervention and clearly inadequate in control | 4 | 246 | Risk Ratio (M‐H, Random, 95% CI) | 0.64 [0.20, 2.00] |
| 4.2 Inadequate in the experimental or adequate in the control | 13 | 5562 | Risk Ratio (M‐H, Random, 95% CI) | 0.93 [0.81, 1.06] |
| 4.3 Experimental group is overfed | 2 | 69 | Risk Ratio (M‐H, Random, 95% CI) | 0.53 [0.14, 1.98] |
| 4.4 Unclear intake in control or experimental | 14 | 2664 | Risk Ratio (M‐H, Random, 95% CI) | 0.83 [0.56, 1.23] |
| 5 Serious adverse events ‐ different screening tools Show forest plot | 33 | 8541 | Risk Ratio (M‐H, Random, 95% CI) | 0.89 [0.74, 1.07] |
| 5.1 NRS 2002 | 0 | 0 | Risk Ratio (M‐H, Random, 95% CI) | 0.0 [0.0, 0.0] |
| 5.2 MUST | 0 | 0 | Risk Ratio (M‐H, Random, 95% CI) | 0.0 [0.0, 0.0] |
| 5.3 MNA | 2 | 117 | Risk Ratio (M‐H, Random, 95% CI) | 0.61 [0.12, 3.18] |
| 5.4 SGA | 0 | 0 | Risk Ratio (M‐H, Random, 95% CI) | 0.0 [0.0, 0.0] |
| 5.5 Other means | 31 | 8424 | Risk Ratio (M‐H, Random, 95% CI) | 0.89 [0.74, 1.08] |
| 6 Serious adverse events ‐ participants characterised as 'at nutritional risk' due to one of the following conditions Show forest plot | 33 | 8541 | Risk Ratio (M‐H, Random, 95% CI) | 0.89 [0.74, 1.07] |
| 6.1 Major surgery | 11 | 1290 | Risk Ratio (M‐H, Random, 95% CI) | 0.82 [0.61, 1.11] |
| 6.2 Stroke | 2 | 4052 | Risk Ratio (M‐H, Random, 95% CI) | 0.65 [0.22, 1.93] |
| 6.3 ICU participants including trauma | 0 | 0 | Risk Ratio (M‐H, Random, 95% CI) | 0.0 [0.0, 0.0] |
| 6.4 Frail elderly participants with less severe conditions known to increase protein requirements | 11 | 1046 | Risk Ratio (M‐H, Random, 95% CI) | 0.85 [0.57, 1.27] |
| 6.5 Participants do not fall into one of the categories above | 9 | 2153 | Risk Ratio (M‐H, Random, 95% CI) | 0.96 [0.64, 1.46] |
| 7 Serious adverse events ‐ participants characterised as 'at nutritional risk' due to one of the following criteria Show forest plot | 33 | 8541 | Risk Ratio (M‐H, Random, 95% CI) | 0.89 [0.74, 1.07] |
| 7.1 BMI less than 20.5 kg/m2 | 1 | 37 | Risk Ratio (M‐H, Random, 95% CI) | 0.35 [0.02, 8.09] |
| 7.2 Weight loss of at least 5% during the last three months | 0 | 0 | Risk Ratio (M‐H, Random, 95% CI) | 0.0 [0.0, 0.0] |
| 7.3 Weight loss of at least 10% during the last six months | 0 | 0 | Risk Ratio (M‐H, Random, 95% CI) | 0.0 [0.0, 0.0] |
| 7.4 Insufficient food intake during the last week (50% of requirements or less) | 0 | 0 | Risk Ratio (M‐H, Random, 95% CI) | 0.0 [0.0, 0.0] |
| 7.5 Participants characterised as 'at nutritional risk' by other means | 32 | 8504 | Risk Ratio (M‐H, Random, 95% CI) | 0.89 [0.74, 1.07] |
| 8 Serious adverse events ‐ participants characterised as 'at nutritional risk' due to biomarkers or anthropometrics Show forest plot | 33 | 8541 | Risk Ratio (M‐H, Random, 95% CI) | 0.89 [0.74, 1.07] |
| 8.1 Biomarkers | 1 | 60 | Risk Ratio (M‐H, Random, 95% CI) | 0.43 [0.12, 1.50] |
| 8.2 Anthropometric measures | 6 | 1111 | Risk Ratio (M‐H, Random, 95% CI) | 0.78 [0.52, 1.16] |
| 8.3 Both | 0 | 0 | Risk Ratio (M‐H, Random, 95% CI) | 0.0 [0.0, 0.0] |
| 8.4 Characterised by other means | 26 | 7370 | Risk Ratio (M‐H, Random, 95% CI) | 0.91 [0.72, 1.13] |
| 9 Serious adverse events ‐ randomisation year Show forest plot | 33 | 8541 | Risk Ratio (M‐H, Random, 95% CI) | 0.89 [0.74, 1.07] |
| 9.1 Before 1960 | 0 | 0 | Risk Ratio (M‐H, Random, 95% CI) | 0.0 [0.0, 0.0] |
| 9.2 1960 to 1979 | 1 | 60 | Risk Ratio (M‐H, Random, 95% CI) | 0.76 [0.24, 2.43] |
| 9.3 1980 to 1999 | 18 | 6960 | Risk Ratio (M‐H, Random, 95% CI) | 0.88 [0.78, 1.00] |
| 9.4 After 1999 | 14 | 1521 | Risk Ratio (M‐H, Random, 95% CI) | 0.79 [0.45, 1.39] |
| 10 Serious adverse events ‐ trials where the intervention lasts fewer than three days compared with trials where the intervention lasts three days or more Show forest plot | 32 | 8501 | Risk Ratio (M‐H, Random, 95% CI) | 0.89 [0.74, 1.07] |
| 10.1 Three days or more | 30 | 8412 | Risk Ratio (M‐H, Random, 95% CI) | 0.89 [0.74, 1.07] |
| 10.2 Less than three days | 1 | 39 | Risk Ratio (M‐H, Random, 95% CI) | 0.0 [0.0, 0.0] |
| 10.3 Unknown | 1 | 50 | Risk Ratio (M‐H, Random, 95% CI) | 0.25 [0.01, 5.00] |
| 11 Serious adverse events ‐ 'best‐worst case' scenario Show forest plot | 33 | 8844 | Risk Ratio (M‐H, Random, 95% CI) | 0.64 [0.50, 0.81] |
| 12 Serious adverse events ‐ 'worst‐best case' scenario Show forest plot | 33 | 8844 | Risk Ratio (M‐H, Random, 95% CI) | 1.15 [0.86, 1.55] |
| 13 Serious adverse events co‐interventions Show forest plot | 33 | 8541 | Risk Ratio (M‐H, Fixed, 95% CI) | 0.92 [0.82, 1.03] |
| 13.1 Received nutrition support as co‐intervention | 1 | 60 | Risk Ratio (M‐H, Fixed, 95% CI) | 0.43 [0.12, 1.50] |
| 13.2 did not receive nutrition support as co‐intervention | 32 | 8481 | Risk Ratio (M‐H, Fixed, 95% CI) | 0.92 [0.82, 1.04] |
| 13.3 delayed versus early nutrition support | 0 | 0 | Risk Ratio (M‐H, Fixed, 95% CI) | 0.0 [0.0, 0.0] |
| Outcome or subgroup title | No. of studies | No. of participants | Statistical method | Effect size |
| 1 All‐cause mortality ‐ overall Show forest plot | 36 | 3722 | Risk Ratio (M‐H, Random, 95% CI) | 0.88 [0.75, 1.03] |
| 2 All‐cause mortality ‐ bias Show forest plot | 36 | 3722 | Risk Ratio (M‐H, Random, 95% CI) | 0.88 [0.75, 1.03] |
| 2.1 High risk of bias | 36 | 3722 | Risk Ratio (M‐H, Random, 95% CI) | 0.88 [0.75, 1.03] |
| 2.2 Low risk of bias | 0 | 0 | Risk Ratio (M‐H, Random, 95% CI) | 0.0 [0.0, 0.0] |
| 3 All‐cause mortality ‐ medical speciality Show forest plot | 36 | 3722 | Risk Ratio (M‐H, Random, 95% CI) | 0.88 [0.75, 1.03] |
| 3.1 Cardiology | 0 | 0 | Risk Ratio (M‐H, Random, 95% CI) | 0.0 [0.0, 0.0] |
| 3.2 Medical gastroenterology and hepatology | 4 | 289 | Risk Ratio (M‐H, Random, 95% CI) | 0.75 [0.40, 1.42] |
| 3.3 Geriatrics | 0 | 0 | Risk Ratio (M‐H, Random, 95% CI) | 0.0 [0.0, 0.0] |
| 3.4 Pulmonary disease | 0 | 0 | Risk Ratio (M‐H, Random, 95% CI) | 0.0 [0.0, 0.0] |
| 3.5 Endocrinology | 0 | 0 | Risk Ratio (M‐H, Random, 95% CI) | 0.0 [0.0, 0.0] |
| 3.6 Infectious diseases | 1 | 56 | Risk Ratio (M‐H, Random, 95% CI) | 1.61 [0.66, 3.92] |
| 3.7 Rheumatology | 0 | 0 | Risk Ratio (M‐H, Random, 95% CI) | 0.0 [0.0, 0.0] |
| 3.8 Haematology | 0 | 0 | Risk Ratio (M‐H, Random, 95% CI) | 0.0 [0.0, 0.0] |
| 3.9 Nephrology | 0 | 0 | Risk Ratio (M‐H, Random, 95% CI) | 0.0 [0.0, 0.0] |
| 3.10 Gastroenterologic surgery | 13 | 1063 | Risk Ratio (M‐H, Random, 95% CI) | 0.72 [0.44, 1.18] |
| 3.11 Trauma surgery | 2 | 139 | Risk Ratio (M‐H, Random, 95% CI) | 0.50 [0.20, 1.28] |
| 3.12 Orthopaedics | 4 | 248 | Risk Ratio (M‐H, Random, 95% CI) | 0.89 [0.21, 3.81] |
| 3.13 Plastic, reconstructive and aesthetic surgery | 0 | 0 | Risk Ratio (M‐H, Random, 95% CI) | 0.0 [0.0, 0.0] |
| 3.14 Vascular surgery | 1 | 13 | Risk Ratio (M‐H, Random, 95% CI) | 0.0 [0.0, 0.0] |
| 3.15 Transplant surgery | 0 | 0 | Risk Ratio (M‐H, Random, 95% CI) | 0.0 [0.0, 0.0] |
| 3.16 Urology | 0 | 0 | Risk Ratio (M‐H, Random, 95% CI) | 0.0 [0.0, 0.0] |
| 3.17 Thoracic surgery | 2 | 548 | Risk Ratio (M‐H, Random, 95% CI) | 0.22 [0.03, 1.86] |
| 3.18 Neurological surgery | 0 | 0 | Risk Ratio (M‐H, Random, 95% CI) | 0.0 [0.0, 0.0] |
| 3.19 Oro‐maxillo‐facial surgery | 1 | 32 | Risk Ratio (M‐H, Random, 95% CI) | 3.38 [0.15, 77.12] |
| 3.20 Anaesthesiology | 0 | 0 | Risk Ratio (M‐H, Random, 95% CI) | 0.0 [0.0, 0.0] |
| 3.21 Emergency medicine | 3 | 154 | Risk Ratio (M‐H, Random, 95% CI) | 0.77 [0.31, 1.94] |
| 3.22 Psychiatry | 0 | 0 | Risk Ratio (M‐H, Random, 95% CI) | 0.0 [0.0, 0.0] |
| 3.23 Neurology | 3 | 1027 | Risk Ratio (M‐H, Random, 95% CI) | 0.67 [0.33, 1.37] |
| 3.24 Oncology | 0 | 0 | Risk Ratio (M‐H, Random, 95% CI) | 0.0 [0.0, 0.0] |
| 3.25 Dermatology | 0 | 0 | Risk Ratio (M‐H, Random, 95% CI) | 0.0 [0.0, 0.0] |
| 3.26 Gynaecology | 0 | 0 | Risk Ratio (M‐H, Random, 95% CI) | 0.0 [0.0, 0.0] |
| 3.27 Mixed | 2 | 153 | Risk Ratio (M‐H, Random, 95% CI) | 0.32 [0.03, 2.99] |
| 4 All‐cause mortality ‐ based on adequacy of the amount of calories Show forest plot | 36 | 3722 | Risk Ratio (M‐H, Random, 95% CI) | 0.88 [0.75, 1.03] |
| 4.1 Clearly adequate in experimental group and clearly inadequate in control group | 7 | 736 | Risk Ratio (M‐H, Random, 95% CI) | 0.70 [0.40, 1.25] |
| 4.2 Inadequate in the experimental group or adequate in the control group | 7 | 410 | Risk Ratio (M‐H, Random, 95% CI) | 0.72 [0.28, 1.85] |
| 4.3 Experimental group is overfed | 2 | 74 | Risk Ratio (M‐H, Random, 95% CI) | 0.76 [0.15, 3.79] |
| 4.4 Unclear intake in experimental group or control group | 20 | 2502 | Risk Ratio (M‐H, Random, 95% CI) | 0.89 [0.73, 1.08] |
| 5 All‐cause mortality ‐ different screening tools Show forest plot | 36 | 3722 | Risk Ratio (M‐H, Random, 95% CI) | 0.88 [0.75, 1.03] |
| 5.1 NRS 2002 | 0 | 0 | Risk Ratio (M‐H, Random, 95% CI) | 0.0 [0.0, 0.0] |
| 5.2 MUST | 0 | 0 | Risk Ratio (M‐H, Random, 95% CI) | 0.0 [0.0, 0.0] |
| 5.3 MNA | 0 | 0 | Risk Ratio (M‐H, Random, 95% CI) | 0.0 [0.0, 0.0] |
| 5.4 SGA | 1 | 323 | Risk Ratio (M‐H, Random, 95% CI) | 0.75 [0.13, 4.44] |
| 5.5 Other means | 35 | 3399 | Risk Ratio (M‐H, Random, 95% CI) | 0.88 [0.75, 1.03] |
| 6 All‐cause mortality ‐ participants characterised as 'at nutritional risk' due to one of the following conditions Show forest plot | 36 | 3722 | Risk Ratio (M‐H, Random, 95% CI) | 0.88 [0.75, 1.03] |
| 6.1 Major surgery | 18 | 1746 | Risk Ratio (M‐H, Random, 95% CI) | 0.69 [0.45, 1.06] |
| 6.2 Stroke | 3 | 1027 | Risk Ratio (M‐H, Random, 95% CI) | 0.67 [0.33, 1.37] |
| 6.3 ICU participants including trauma | 5 | 293 | Risk Ratio (M‐H, Random, 95% CI) | 0.62 [0.32, 1.21] |
| 6.4 Frail elderly participants with less severe conditions known to increase protein requirements | 2 | 126 | Risk Ratio (M‐H, Random, 95% CI) | 1.59 [0.02, 125.73] |
| 6.5 Participants do not fall into one of the categories above | 8 | 530 | Risk Ratio (M‐H, Random, 95% CI) | 0.95 [0.58, 1.56] |
| 7 All‐cause mortality ‐ participants characterised as 'at nutritional risk' due to one of the following criteria Show forest plot | 36 | 3722 | Risk Ratio (M‐H, Random, 95% CI) | 0.88 [0.75, 1.03] |
| 7.1 BMI less than 20.5 kg/m2 | 0 | 0 | Risk Ratio (M‐H, Random, 95% CI) | 0.0 [0.0, 0.0] |
| 7.2 Weight loss of at least 5% during the last three months | 0 | 0 | Risk Ratio (M‐H, Random, 95% CI) | 0.0 [0.0, 0.0] |
| 7.3 Weight loss of at least 10% during the last six months | 1 | 32 | Risk Ratio (M‐H, Random, 95% CI) | 3.38 [0.15, 77.12] |
| 7.4 Insufficient food intake during the last week (50% of requirements or less) | 0 | 0 | Risk Ratio (M‐H, Random, 95% CI) | 0.0 [0.0, 0.0] |
| 7.5 Participants characterised as 'at nutritional risk' by other means | 35 | 3690 | Risk Ratio (M‐H, Random, 95% CI) | 0.88 [0.75, 1.02] |
| 8 All‐cause mortality ‐ participants characterised as 'at nutritional risk' due to biomarkers or anthropometrics Show forest plot | 36 | 3722 | Risk Ratio (M‐H, Random, 95% CI) | 0.88 [0.75, 1.03] |
| 8.1 Biomarkers | 1 | 520 | Risk Ratio (M‐H, Random, 95% CI) | 0.15 [0.01, 2.84] |
| 8.2 Anthropometric measures | 2 | 122 | Risk Ratio (M‐H, Random, 95% CI) | 0.71 [0.24, 2.08] |
| 8.3 Characterised by other means | 33 | 3080 | Risk Ratio (M‐H, Random, 95% CI) | 0.89 [0.76, 1.04] |
| 9 All‐cause mortality ‐ randomisation year Show forest plot | 36 | 3722 | Risk Ratio (M‐H, Random, 95% CI) | 0.88 [0.75, 1.03] |
| 9.1 Before 1960 | 0 | 0 | Risk Ratio (M‐H, Random, 95% CI) | 0.0 [0.0, 0.0] |
| 9.2 1960‐1979 | 1 | 26 | Risk Ratio (M‐H, Random, 95% CI) | 0.44 [0.02, 9.98] |
| 9.3 1980‐1999 | 23 | 2463 | Risk Ratio (M‐H, Random, 95% CI) | 0.93 [0.78, 1.11] |
| 9.4 After 1999 | 12 | 1233 | Risk Ratio (M‐H, Random, 95% CI) | 0.73 [0.52, 1.00] |
| 10 All‐cause mortality ‐ trials where the intervention lasts fewer than three days compared with trials where the intervention lasts three days or more Show forest plot | 36 | 3722 | Risk Ratio (M‐H, Random, 95% CI) | 0.88 [0.75, 1.03] |
| 10.1 Three days or more | 30 | 3287 | Risk Ratio (M‐H, Random, 95% CI) | 0.88 [0.75, 1.03] |
| 10.2 Less than three days | 6 | 435 | Risk Ratio (M‐H, Random, 95% CI) | 0.68 [0.28, 1.65] |
| 10.3 Unknown | 0 | 0 | Risk Ratio (M‐H, Random, 95% CI) | 0.0 [0.0, 0.0] |
| 11 All‐cause mortality ‐ 'best‐worst case' scenario Show forest plot | 36 | 3759 | Risk Ratio (M‐H, Random, 95% CI) | 0.84 [0.72, 0.98] |
| 12 All‐cause mortality ‐ 'worst‐best case' scenario Show forest plot | 36 | 3759 | Risk Ratio (M‐H, Fixed, 95% CI) | 0.92 [0.79, 1.06] |
| 13 All‐cause mortality co‐interventions Show forest plot | 36 | 3722 | Risk Ratio (M‐H, Random, 95% CI) | 0.88 [0.75, 1.03] |
| 13.1 received nutrition support as co‐intervention | 3 | 126 | Risk Ratio (M‐H, Random, 95% CI) | 0.60 [0.28, 1.28] |
| 13.2 did not receive nutrition support as co‐intervention | 27 | 3253 | Risk Ratio (M‐H, Random, 95% CI) | 0.79 [0.62, 1.02] |
| 13.3 delayed versus early nutrition support | 6 | 343 | Risk Ratio (M‐H, Random, 95% CI) | 1.06 [0.57, 1.97] |
| Outcome or subgroup title | No. of studies | No. of participants | Statistical method | Effect size |
| 1 All‐cause mortality ‐ overall Show forest plot | 42 | 4212 | Risk Ratio (M‐H, Random, 95% CI) | 0.84 [0.75, 0.95] |
| 2 All‐cause mortality ‐ bias Show forest plot | 42 | 4212 | Risk Ratio (M‐H, Random, 95% CI) | 0.84 [0.75, 0.95] |
| 2.1 High risk of bias | 42 | 4212 | Risk Ratio (M‐H, Random, 95% CI) | 0.84 [0.75, 0.95] |
| 2.2 Low risk of bias | 0 | 0 | Risk Ratio (M‐H, Random, 95% CI) | 0.0 [0.0, 0.0] |
| 3 All‐cause mortality ‐ medical speciality Show forest plot | 42 | 4212 | Risk Ratio (M‐H, Random, 95% CI) | 0.84 [0.75, 0.95] |
| 3.1 Cardiology | 0 | 0 | Risk Ratio (M‐H, Random, 95% CI) | 0.0 [0.0, 0.0] |
| 3.2 Medical gastroenterology and hepatology | 4 | 289 | Risk Ratio (M‐H, Random, 95% CI) | 0.88 [0.63, 1.21] |
| 3.3 Geriatrics | 0 | 0 | Risk Ratio (M‐H, Random, 95% CI) | 0.0 [0.0, 0.0] |
| 3.4 Pulmonary disease | 0 | 0 | Risk Ratio (M‐H, Random, 95% CI) | 0.0 [0.0, 0.0] |
| 3.5 Endocrinology | 0 | 0 | Risk Ratio (M‐H, Random, 95% CI) | 0.0 [0.0, 0.0] |
| 3.6 Infectious diseases | 1 | 56 | Risk Ratio (M‐H, Random, 95% CI) | 1.61 [0.66, 3.92] |
| 3.7 Rheumatology | 0 | 0 | Risk Ratio (M‐H, Random, 95% CI) | 0.0 [0.0, 0.0] |
| 3.8 Haematology | 0 | 0 | Risk Ratio (M‐H, Random, 95% CI) | 0.0 [0.0, 0.0] |
| 3.9 Nephrology | 0 | 0 | Risk Ratio (M‐H, Random, 95% CI) | 0.0 [0.0, 0.0] |
| 3.10 Gastroenterologic surgery | 15 | 1284 | Risk Ratio (M‐H, Random, 95% CI) | 0.75 [0.48, 1.16] |
| 3.11 Trauma surgery | 4 | 204 | Risk Ratio (M‐H, Random, 95% CI) | 0.58 [0.30, 1.11] |
| 3.12 Ortopaedics | 4 | 248 | Risk Ratio (M‐H, Random, 95% CI) | 0.82 [0.18, 3.75] |
| 3.13 Plastic, reconstructive, and aesthetic surgery | 0 | 0 | Risk Ratio (M‐H, Random, 95% CI) | 0.0 [0.0, 0.0] |
| 3.14 Vascular surgery | 1 | 13 | Risk Ratio (M‐H, Random, 95% CI) | 0.0 [0.0, 0.0] |
| 3.15 Transplant surgery | 0 | 0 | Risk Ratio (M‐H, Random, 95% CI) | 0.0 [0.0, 0.0] |
| 3.16 Urology | 0 | 0 | Risk Ratio (M‐H, Random, 95% CI) | 0.0 [0.0, 0.0] |
| 3.17 Thoracic surgery | 2 | 548 | Risk Ratio (M‐H, Random, 95% CI) | 0.22 [0.03, 1.86] |
| 3.18 Neurological surgery | 0 | 0 | Risk Ratio (M‐H, Random, 95% CI) | 0.0 [0.0, 0.0] |
| 3.19 Oro‐maxillo‐facial surgery | 1 | 32 | Risk Ratio (M‐H, Random, 95% CI) | 3.38 [0.15, 77.12] |
| 3.20 Anaesthesiology | 0 | 0 | Risk Ratio (M‐H, Random, 95% CI) | 0.0 [0.0, 0.0] |
| 3.21 Emergency medicine | 4 | 213 | Risk Ratio (M‐H, Random, 95% CI) | 1.07 [0.61, 1.89] |
| 3.22 Psychiatry | 0 | 0 | Risk Ratio (M‐H, Random, 95% CI) | 0.0 [0.0, 0.0] |
| 3.23 Neurology | 4 | 1172 | Risk Ratio (M‐H, Random, 95% CI) | 0.57 [0.31, 1.05] |
| 3.24 Oncology | 0 | 0 | Risk Ratio (M‐H, Random, 95% CI) | 0.0 [0.0, 0.0] |
| 3.25 Dermatology | 0 | 0 | Risk Ratio (M‐H, Random, 95% CI) | 0.0 [0.0, 0.0] |
| 3.26 Gynaecology | 0 | 0 | Risk Ratio (M‐H, Random, 95% CI) | 0.0 [0.0, 0.0] |
| 3.27 Mixed | 2 | 153 | Risk Ratio (M‐H, Random, 95% CI) | 0.63 [0.18, 2.21] |
| 4 All‐cause mortality ‐ based on adequacy of the amount of calories Show forest plot | 42 | 4212 | Risk Ratio (M‐H, Random, 95% CI) | 0.84 [0.75, 0.95] |
| 4.1 Clearly adequate in intervention and clearly inadequate in control | 10 | 954 | Risk Ratio (M‐H, Random, 95% CI) | 0.75 [0.46, 1.23] |
| 4.2 Inadequate in the experimental or adequate in the control | 7 | 410 | Risk Ratio (M‐H, Random, 95% CI) | 0.72 [0.28, 1.85] |
| 4.3 Experimental group is overfed | 3 | 174 | Risk Ratio (M‐H, Random, 95% CI) | 1.01 [0.49, 2.08] |
| 4.4 Unclear intake in control or experimental | 22 | 2674 | Risk Ratio (M‐H, Random, 95% CI) | 0.82 [0.67, 0.99] |
| 5 All‐cause mortality ‐ different screening tools Show forest plot | 42 | 4212 | Risk Ratio (M‐H, Random, 95% CI) | 0.84 [0.75, 0.95] |
| 5.1 NRS 2002 | 0 | 0 | Risk Ratio (M‐H, Random, 95% CI) | 0.0 [0.0, 0.0] |
| 5.2 MUST | 0 | 0 | Risk Ratio (M‐H, Random, 95% CI) | 0.0 [0.0, 0.0] |
| 5.3 MNA | 0 | 0 | Risk Ratio (M‐H, Random, 95% CI) | 0.0 [0.0, 0.0] |
| 5.4 SGA | 1 | 323 | Risk Ratio (M‐H, Random, 95% CI) | 0.75 [0.13, 4.44] |
| 5.5 Other means | 41 | 3889 | Risk Ratio (M‐H, Random, 95% CI) | 0.84 [0.75, 0.95] |
| 6 All‐cause mortality ‐ participants characterised as 'at nutritional risk' due to one of the following conditions Show forest plot | 42 | 4212 | Risk Ratio (M‐H, Random, 95% CI) | 0.84 [0.75, 0.95] |
| 6.1 Major surgery | 20 | 1967 | Risk Ratio (M‐H, Random, 95% CI) | 0.71 [0.48, 1.06] |
| 6.2 Stroke | 4 | 1172 | Risk Ratio (M‐H, Random, 95% CI) | 0.57 [0.31, 1.05] |
| 6.3 ICU participants including trauma | 8 | 417 | Risk Ratio (M‐H, Random, 95% CI) | 0.82 [0.54, 1.26] |
| 6.4 Frail elderly participants with less severe conditions known to increase protein requirements | 2 | 126 | Risk Ratio (M‐H, Random, 95% CI) | 1.25 [0.01, 150.42] |
| 6.5 Participants do not fall into one of the categories above | 8 | 530 | Risk Ratio (M‐H, Random, 95% CI) | 0.93 [0.69, 1.25] |
| 7 All‐cause mortality ‐ participants characterised as 'at nutritional risk' due to one of the following criteria Show forest plot | 42 | 4212 | Risk Ratio (M‐H, Random, 95% CI) | 0.84 [0.75, 0.95] |
| 7.1 BMI less than 20.5 kg/m2 | 0 | 0 | Risk Ratio (M‐H, Random, 95% CI) | 0.0 [0.0, 0.0] |
| 7.2 Weight loss of at least 5% during the last three months | 0 | 0 | Risk Ratio (M‐H, Random, 95% CI) | 0.0 [0.0, 0.0] |
| 7.3 Weight loss of at least 10% during the last six months | 1 | 32 | Risk Ratio (M‐H, Random, 95% CI) | 3.38 [0.15, 77.12] |
| 7.4 Insufficient food intake during the last week (50% of requirements or less) | 0 | 0 | Risk Ratio (M‐H, Random, 95% CI) | 0.0 [0.0, 0.0] |
| 7.5 Participants characterised as 'at nutritional risk' by other means | 41 | 4180 | Risk Ratio (M‐H, Random, 95% CI) | 0.84 [0.75, 0.95] |
| 8 All‐cause mortality ‐ participants characterised as 'at nutritional risk' due to biomarkers or anthropometrics Show forest plot | 42 | 4212 | Risk Ratio (M‐H, Random, 95% CI) | 0.84 [0.75, 0.95] |
| 8.1 Biomarkers | 1 | 520 | Risk Ratio (M‐H, Random, 95% CI) | 0.15 [0.01, 2.84] |
| 8.2 Anthropometric measures | 2 | 122 | Risk Ratio (M‐H, Random, 95% CI) | 0.71 [0.24, 2.08] |
| 8.3 Both anthropometrics and biomarkers | 0 | 0 | Risk Ratio (M‐H, Random, 95% CI) | 0.0 [0.0, 0.0] |
| 8.4 Characterised by other means | 39 | 3570 | Risk Ratio (M‐H, Random, 95% CI) | 0.85 [0.75, 0.96] |
| 9 All‐cause mortality ‐ randomisation year Show forest plot | 42 | 4212 | Risk Ratio (M‐H, Random, 95% CI) | 0.84 [0.75, 0.95] |
| 9.1 Before 1960 | 0 | 0 | Risk Ratio (M‐H, Random, 95% CI) | 0.0 [0.0, 0.0] |
| 9.2 1960 to 1979 | 1 | 26 | Risk Ratio (M‐H, Random, 95% CI) | 0.44 [0.02, 9.98] |
| 9.3 1980 to 1999 | 24 | 2500 | Risk Ratio (M‐H, Random, 95% CI) | 0.87 [0.69, 1.08] |
| 9.4 After 1999 | 17 | 1686 | Risk Ratio (M‐H, Random, 95% CI) | 0.76 [0.60, 0.96] |
| 10 All‐cause mortality ‐ trials where the intervention lasts fewer than three days compared with trials where the intervention lasts three days or more Show forest plot | 42 | 4212 | Risk Ratio (M‐H, Random, 95% CI) | 0.84 [0.75, 0.95] |
| 10.1 Three days or more | 34 | 3680 | Risk Ratio (M‐H, Random, 95% CI) | 0.82 [0.71, 0.94] |
| 10.2 Less than three days | 8 | 532 | Risk Ratio (M‐H, Random, 95% CI) | 1.03 [0.66, 1.63] |
| 10.3 Unknown | 0 | 0 | Risk Ratio (M‐H, Random, 95% CI) | 0.0 [0.0, 0.0] |
| 11 All‐cause mortality ‐ 'best‐worst case' scenario Show forest plot | 42 | 4269 | Risk Ratio (M‐H, Random, 95% CI) | 0.75 [0.63, 0.89] |
| 12 All‐cause mortality ‐ 'worst‐best case' scenario Show forest plot | 42 | 4269 | Risk Ratio (M‐H, Random, 95% CI) | 0.84 [0.68, 1.03] |
| 13 All‐cause mortality co‐interventions Show forest plot | 42 | 4212 | Risk Ratio (M‐H, Fixed, 95% CI) | 0.82 [0.73, 0.92] |
| 13.1 received nutrition support as co‐intervention | 5 | 262 | Risk Ratio (M‐H, Fixed, 95% CI) | 1.03 [0.66, 1.60] |
| 13.2 did not receive nutrition support as co‐intervention | 35 | 3797 | Risk Ratio (M‐H, Fixed, 95% CI) | 0.81 [0.71, 0.91] |
| 13.3 delayed versus early nutrition support | 2 | 153 | Risk Ratio (M‐H, Fixed, 95% CI) | 0.61 [0.17, 2.12] |
| Outcome or subgroup title | No. of studies | No. of participants | Statistical method | Effect size |
| 1 Serious adverse events ‐ overall Show forest plot | 43 | 3935 | Risk Ratio (M‐H, Random, 95% CI) | 0.85 [0.74, 0.98] |
| 2 Serious adverse events ‐ bias Show forest plot | 43 | 3935 | Risk Ratio (M‐H, Random, 95% CI) | 0.85 [0.74, 0.98] |
| 2.1 High risk of bias | 43 | 3935 | Risk Ratio (M‐H, Random, 95% CI) | 0.85 [0.74, 0.98] |
| 2.2 Low risk of bias | 0 | 0 | Risk Ratio (M‐H, Random, 95% CI) | 0.0 [0.0, 0.0] |
| 3 Serious adverse events ‐ by medical specialty Show forest plot | 43 | 3935 | Risk Ratio (M‐H, Random, 95% CI) | 0.85 [0.74, 0.98] |
| 3.1 Cardiology | 0 | 0 | Risk Ratio (M‐H, Random, 95% CI) | 0.0 [0.0, 0.0] |
| 3.2 Medical gastroenterology and hepatology | 4 | 289 | Risk Ratio (M‐H, Random, 95% CI) | 0.79 [0.32, 1.96] |
| 3.3 High risk | 0 | 0 | Risk Ratio (M‐H, Random, 95% CI) | 0.0 [0.0, 0.0] |
| 3.4 Geriatrics | 0 | 0 | Risk Ratio (M‐H, Random, 95% CI) | 0.0 [0.0, 0.0] |
| 3.5 Pulmonary disease | 0 | 0 | Risk Ratio (M‐H, Random, 95% CI) | 0.0 [0.0, 0.0] |
| 3.6 Endocrinology | 0 | 0 | Risk Ratio (M‐H, Random, 95% CI) | 0.0 [0.0, 0.0] |
| 3.7 Infectious diseases | 1 | 56 | Risk Ratio (M‐H, Random, 95% CI) | 1.23 [0.52, 2.93] |
| 3.8 Rheumatology | 0 | 0 | Risk Ratio (M‐H, Random, 95% CI) | 0.0 [0.0, 0.0] |
| 3.9 Haematology | 0 | 0 | Risk Ratio (M‐H, Random, 95% CI) | 0.0 [0.0, 0.0] |
| 3.10 Nephrology | 0 | 0 | Risk Ratio (M‐H, Random, 95% CI) | 0.0 [0.0, 0.0] |
| 3.11 Gastroenterologic surgery | 19 | 1235 | Risk Ratio (M‐H, Random, 95% CI) | 0.75 [0.54, 1.03] |
| 3.12 Trauma surgery | 3 | 180 | Risk Ratio (M‐H, Random, 95% CI) | 0.50 [0.20, 1.28] |
| 3.13 Ortopaedics | 4 | 248 | Risk Ratio (M‐H, Random, 95% CI) | 1.05 [0.34, 3.26] |
| 3.14 Plastic, reconstructive, and aesthetic surgery | 0 | 0 | Risk Ratio (M‐H, Random, 95% CI) | 0.0 [0.0, 0.0] |
| 3.15 Vascular surgery | 1 | 13 | Risk Ratio (M‐H, Random, 95% CI) | 0.0 [0.0, 0.0] |
| 3.16 Transplant surgery | 0 | 0 | Risk Ratio (M‐H, Random, 95% CI) | 0.0 [0.0, 0.0] |
| 3.17 Urology | 0 | 0 | Risk Ratio (M‐H, Random, 95% CI) | 0.0 [0.0, 0.0] |
| 3.18 Thoracic surgery | 2 | 548 | Risk Ratio (M‐H, Random, 95% CI) | 0.15 [0.02, 1.27] |
| 3.19 Neurological surgery | 0 | 0 | Risk Ratio (M‐H, Random, 95% CI) | 0.0 [0.0, 0.0] |
| 3.20 Oro‐maxillo‐facial surgery | 1 | 32 | Risk Ratio (M‐H, Random, 95% CI) | 0.88 [0.44, 1.78] |
| 3.21 Anaesthesiology | 0 | 0 | Risk Ratio (M‐H, Random, 95% CI) | 0.0 [0.0, 0.0] |
| 3.22 Emergency medicine | 3 | 154 | Risk Ratio (M‐H, Random, 95% CI) | 0.77 [0.31, 1.94] |
| 3.23 Psychiatry | 0 | 0 | Risk Ratio (M‐H, Random, 95% CI) | 0.0 [0.0, 0.0] |
| 3.24 Neurology | 3 | 1027 | Risk Ratio (M‐H, Random, 95% CI) | 0.67 [0.37, 1.24] |
| 3.25 Oncology | 0 | 0 | Risk Ratio (M‐H, Random, 95% CI) | 0.0 [0.0, 0.0] |
| 3.26 Dermatology | 0 | 0 | Risk Ratio (M‐H, Random, 95% CI) | 0.0 [0.0, 0.0] |
| 3.27 Gynaecology | 0 | 0 | Risk Ratio (M‐H, Random, 95% CI) | 0.0 [0.0, 0.0] |
| 3.28 Mixed | 2 | 153 | Risk Ratio (M‐H, Random, 95% CI) | 0.32 [0.03, 2.99] |
| 4 Serious adverse events ‐ based on adequacy of the amount of calories Show forest plot | 43 | 3935 | Risk Ratio (M‐H, Random, 95% CI) | 0.85 [0.74, 0.98] |
| 4.1 Clearly adequate in intervention and clearly inadequate in control | 9 | 769 | Risk Ratio (M‐H, Random, 95% CI) | 0.77 [0.54, 1.10] |
| 4.2 Inadequate in the experimental or adequate in the control | 8 | 411 | Risk Ratio (M‐H, Random, 95% CI) | 0.86 [0.55, 1.35] |
| 4.3 Experimental group is overfed | 3 | 115 | Risk Ratio (M‐H, Random, 95% CI) | 0.64 [0.13, 3.12] |
| 4.4 Unclear intake in control or experimental | 23 | 2640 | Risk Ratio (M‐H, Random, 95% CI) | 0.73 [0.55, 0.98] |
| 5 Serious adverse events ‐ different screening tools Show forest plot | 43 | 3935 | Risk Ratio (M‐H, Random, 95% CI) | 0.85 [0.74, 0.98] |
| 5.1 NRS 2002 | 0 | 0 | Risk Ratio (M‐H, Random, 95% CI) | 0.0 [0.0, 0.0] |
| 5.2 MUST | 0 | 0 | Risk Ratio (M‐H, Random, 95% CI) | 0.0 [0.0, 0.0] |
| 5.3 MNA | 0 | 0 | Risk Ratio (M‐H, Random, 95% CI) | 0.0 [0.0, 0.0] |
| 5.4 SGA | 1 | 323 | Risk Ratio (M‐H, Random, 95% CI) | 0.38 [0.13, 1.06] |
| 5.5 Other means | 42 | 3612 | Risk Ratio (M‐H, Random, 95% CI) | 0.87 [0.75, 1.00] |
| 6 Serious adverse events ‐ participants characterised as 'at nutritional risk' due to one of the following conditions Show forest plot | 43 | 3935 | Risk Ratio (M‐H, Random, 95% CI) | 0.85 [0.74, 0.98] |
| 6.1 Major surgery | 24 | 1918 | Risk Ratio (M‐H, Random, 95% CI) | 0.72 [0.53, 0.97] |
| 6.2 Stroke | 3 | 1027 | Risk Ratio (M‐H, Random, 95% CI) | 0.67 [0.37, 1.24] |
| 6.3 ICU participants including trauma | 6 | 334 | Risk Ratio (M‐H, Random, 95% CI) | 0.62 [0.32, 1.21] |
| 6.4 Frail elderly participants with less severe conditions known to increase protein requirements | 2 | 126 | Risk Ratio (M‐H, Random, 95% CI) | 2.84 [0.12, 66.14] |
| 6.5 Participants do not fall into one of the categories above | 8 | 530 | Risk Ratio (M‐H, Random, 95% CI) | 0.87 [0.58, 1.30] |
| 7 Serious adverse events ‐ participants characterised as 'at nutritional risk' due to one of the following criteria Show forest plot | 43 | 3935 | Risk Ratio (M‐H, Random, 95% CI) | 0.85 [0.74, 0.98] |
| 7.1 BMI less than 20.5 kg/m2 | 0 | 0 | Risk Ratio (M‐H, Random, 95% CI) | 0.0 [0.0, 0.0] |
| 7.2 Weight loss of at least 5% during the last three months | 0 | 0 | Risk Ratio (M‐H, Random, 95% CI) | 0.0 [0.0, 0.0] |
| 7.3 Weight loss of at least 10% during the last six months | 1 | 32 | Risk Ratio (M‐H, Random, 95% CI) | 0.88 [0.44, 1.78] |
| 7.4 Insufficient food intake during the last week (50% of requirements or less) | 0 | 0 | Risk Ratio (M‐H, Random, 95% CI) | 0.0 [0.0, 0.0] |
| 7.5 Participants characterised as 'at nutritional risk' by other means | 42 | 3903 | Risk Ratio (M‐H, Random, 95% CI) | 0.85 [0.74, 0.98] |
| 8 Serious adverse events ‐ participants characterised as 'at nutritional risk' due to biomarkers or anthropometrics Show forest plot | 43 | 3935 | Risk Ratio (M‐H, Random, 95% CI) | 0.85 [0.74, 0.98] |
| 8.1 Biomarkers | 3 | 551 | Risk Ratio (M‐H, Random, 95% CI) | 0.16 [0.02, 1.26] |
| 8.2 Anthropometric measures | 2 | 122 | Risk Ratio (M‐H, Random, 95% CI) | 0.71 [0.24, 2.08] |
| 8.3 Mixed | 0 | 0 | Risk Ratio (M‐H, Random, 95% CI) | 0.0 [0.0, 0.0] |
| 8.4 Characterised by other means | 38 | 3262 | Risk Ratio (M‐H, Random, 95% CI) | 0.86 [0.75, 1.00] |
| 9 Serious adverse events ‐ randomisation year Show forest plot | 43 | 3935 | Risk Ratio (M‐H, Random, 95% CI) | 0.85 [0.74, 0.98] |
| 9.1 Before 1960 | 0 | 0 | Risk Ratio (M‐H, Random, 95% CI) | 0.0 [0.0, 0.0] |
| 9.2 1960 to 1979 | 1 | 26 | Risk Ratio (M‐H, Random, 95% CI) | 1.36 [0.10, 19.50] |
| 9.3 1980 to 1999 | 28 | 2749 | Risk Ratio (M‐H, Random, 95% CI) | 0.92 [0.79, 1.08] |
| 9.4 After 1999 | 14 | 1160 | Risk Ratio (M‐H, Random, 95% CI) | 0.60 [0.43, 0.83] |
| 10 Serious adverse events ‐ trials where the intervention lasts fewer than three days compared with trials where the intervention lasts three days or more Show forest plot | 43 | 3935 | Risk Ratio (M‐H, Random, 95% CI) | 0.85 [0.74, 0.98] |
| 10.1 Three days or more | 37 | 3500 | Risk Ratio (M‐H, Random, 95% CI) | 0.86 [0.75, 1.00] |
| 10.2 Less than three days | 6 | 435 | Risk Ratio (M‐H, Random, 95% CI) | 0.71 [0.39, 1.27] |
| 10.3 Unknown | 0 | 0 | Risk Ratio (M‐H, Random, 95% CI) | 0.0 [0.0, 0.0] |
| 11 Serious adverse events ‐ 'best‐worst case' scenario Show forest plot | 43 | 3977 | Risk Ratio (M‐H, Random, 95% CI) | 0.82 [0.72, 0.94] |
| 12 Serious adverse events ‐ 'worst‐best case' scenario Show forest plot | 43 | 3977 | Risk Ratio (M‐H, Random, 95% CI) | 0.83 [0.70, 0.99] |
| 13 Serious adverse events co‐interventions Show forest plot | 43 | 3935 | Risk Ratio (M‐H, Fixed, 95% CI) | 0.83 [0.72, 0.95] |
| 13.1 received nutrition support as co‐intervention | 3 | 126 | Risk Ratio (M‐H, Fixed, 95% CI) | 0.66 [0.39, 1.12] |
| 13.2 did not receive nutrition support as co‐intervention | 34 | 3466 | Risk Ratio (M‐H, Fixed, 95% CI) | 0.83 [0.72, 0.96] |
| 13.3 delayed versus early nutrition support | 6 | 343 | Risk Ratio (M‐H, Fixed, 95% CI) | 0.93 [0.51, 1.69] |
| Outcome or subgroup title | No. of studies | No. of participants | Statistical method | Effect size |
| 1 Serious adverse events ‐ overall Show forest plot | 49 | 4425 | Risk Ratio (M‐H, Random, 95% CI) | 0.82 [0.73, 0.91] |
| 2 Serious adverse events ‐ bias Show forest plot | 49 | 4425 | Risk Ratio (M‐H, Random, 95% CI) | 0.82 [0.73, 0.91] |
| 2.1 High risk of bias | 49 | 4425 | Risk Ratio (M‐H, Random, 95% CI) | 0.82 [0.73, 0.91] |
| 2.2 Low risk of bias | 0 | 0 | Risk Ratio (M‐H, Random, 95% CI) | 0.0 [0.0, 0.0] |
| 3 Serious adverse events ‐ by medical speciality Show forest plot | 49 | 4425 | Risk Ratio (M‐H, Random, 95% CI) | 0.82 [0.73, 0.91] |
| 3.1 Cardiology | 0 | 0 | Risk Ratio (M‐H, Random, 95% CI) | 0.0 [0.0, 0.0] |
| 3.2 Medical gastroenterology and hepatology | 4 | 289 | Risk Ratio (M‐H, Random, 95% CI) | 0.89 [0.65, 1.23] |
| 3.3 Geriatrics | 0 | 0 | Risk Ratio (M‐H, Random, 95% CI) | 0.0 [0.0, 0.0] |
| 3.4 Pulmonary disease | 0 | 0 | Risk Ratio (M‐H, Random, 95% CI) | 0.0 [0.0, 0.0] |
| 3.5 Endocrinology | 0 | 0 | Risk Ratio (M‐H, Random, 95% CI) | 0.0 [0.0, 0.0] |
| 3.6 Infectious diseases | 1 | 56 | Risk Ratio (M‐H, Random, 95% CI) | 1.23 [0.52, 2.93] |
| 3.7 Rheumatology | 0 | 0 | Risk Ratio (M‐H, Random, 95% CI) | 0.0 [0.0, 0.0] |
| 3.8 Haematology | 0 | 0 | Risk Ratio (M‐H, Random, 95% CI) | 0.0 [0.0, 0.0] |
| 3.9 Nephrology | 0 | 0 | Risk Ratio (M‐H, Random, 95% CI) | 0.0 [0.0, 0.0] |
| 3.10 Gastroenterologic surgery | 21 | 1456 | Risk Ratio (M‐H, Random, 95% CI) | 0.68 [0.51, 0.91] |
| 3.11 Trauma surgery | 5 | 245 | Risk Ratio (M‐H, Random, 95% CI) | 0.58 [0.30, 1.11] |
| 3.12 Ortopaedics | 4 | 248 | Risk Ratio (M‐H, Random, 95% CI) | 0.91 [0.28, 2.96] |
| 3.13 Plastic, reconstructive, and aesthetic surgery | 0 | 0 | Risk Ratio (M‐H, Random, 95% CI) | 0.0 [0.0, 0.0] |
| 3.14 Vascular surgery | 1 | 13 | Risk Ratio (M‐H, Random, 95% CI) | 0.0 [0.0, 0.0] |
| 3.15 Transplant surgery | 0 | 0 | Risk Ratio (M‐H, Random, 95% CI) | 0.0 [0.0, 0.0] |
| 3.16 Urology | 0 | 0 | Risk Ratio (M‐H, Random, 95% CI) | 0.0 [0.0, 0.0] |
| 3.17 Thoracic surgery | 2 | 548 | Risk Ratio (M‐H, Random, 95% CI) | 0.15 [0.02, 1.27] |
| 3.18 Neurological surgery | 0 | 0 | Risk Ratio (M‐H, Random, 95% CI) | 0.0 [0.0, 0.0] |
| 3.19 Oro‐maxillo‐facial surgery | 1 | 32 | Risk Ratio (M‐H, Random, 95% CI) | 0.88 [0.44, 1.78] |
| 3.20 Anaesthesiology | 0 | 0 | Risk Ratio (M‐H, Random, 95% CI) | 0.0 [0.0, 0.0] |
| 3.21 Emergency medicine | 4 | 213 | Risk Ratio (M‐H, Random, 95% CI) | 0.92 [0.60, 1.40] |
| 3.22 Psychiatry | 0 | 0 | Risk Ratio (M‐H, Random, 95% CI) | 0.0 [0.0, 0.0] |
| 3.23 Neurology | 4 | 1172 | Risk Ratio (M‐H, Random, 95% CI) | 0.58 [0.34, 1.00] |
| 3.24 Oncology | 0 | 0 | Risk Ratio (M‐H, Random, 95% CI) | 0.0 [0.0, 0.0] |
| 3.25 Dermatology | 0 | 0 | Risk Ratio (M‐H, Random, 95% CI) | 0.0 [0.0, 0.0] |
| 3.26 Gynaecology | 0 | 0 | Risk Ratio (M‐H, Random, 95% CI) | 0.0 [0.0, 0.0] |
| 3.27 Mixed | 2 | 153 | Risk Ratio (M‐H, Random, 95% CI) | 0.63 [0.18, 2.21] |
| 4 Serious adverse events ‐ based on adequacy of the amount of calories Show forest plot | 49 | 4425 | Risk Ratio (M‐H, Random, 95% CI) | 0.82 [0.73, 0.91] |
| 4.1 Clearly adequate in intervention and clearly inadequate in control | 12 | 987 | Risk Ratio (M‐H, Random, 95% CI) | 0.72 [0.54, 0.96] |
| 4.2 Inadequate in the experimental or adequate in the control | 8 | 411 | Risk Ratio (M‐H, Random, 95% CI) | 0.86 [0.55, 1.35] |
| 4.3 Experimental group is overfed | 4 | 215 | Risk Ratio (M‐H, Random, 95% CI) | 0.77 [0.42, 1.42] |
| 4.4 Unclear intake in control or experimental | 25 | 2812 | Risk Ratio (M‐H, Random, 95% CI) | 0.75 [0.60, 0.94] |
| 5 Serious adverse events ‐ different screening tools Show forest plot | 49 | 4425 | Risk Ratio (M‐H, Random, 95% CI) | 0.82 [0.73, 0.91] |
| 5.1 NRS 2002 | 0 | 0 | Risk Ratio (M‐H, Random, 95% CI) | 0.0 [0.0, 0.0] |
| 5.2 MUST | 0 | 0 | Risk Ratio (M‐H, Random, 95% CI) | 0.0 [0.0, 0.0] |
| 5.3 MNA | 0 | 0 | Risk Ratio (M‐H, Random, 95% CI) | 0.0 [0.0, 0.0] |
| 5.4 SGA | 1 | 323 | Risk Ratio (M‐H, Random, 95% CI) | 0.38 [0.13, 1.06] |
| 5.5 Other means | 48 | 4102 | Risk Ratio (M‐H, Random, 95% CI) | 0.82 [0.74, 0.92] |
| 6 Serious adverse events ‐ participants characterised as 'at nutritional risk' due to one of the following conditions Show forest plot | 49 | 4425 | Risk Ratio (M‐H, Random, 95% CI) | 0.82 [0.73, 0.91] |
| 6.1 Major surgery | 26 | 2139 | Risk Ratio (M‐H, Random, 95% CI) | 0.67 [0.51, 0.88] |
| 6.2 Stroke | 4 | 1172 | Risk Ratio (M‐H, Random, 95% CI) | 0.58 [0.34, 1.00] |
| 6.3 ICU participants including trauma | 9 | 458 | Risk Ratio (M‐H, Random, 95% CI) | 0.80 [0.56, 1.14] |
| 6.4 Frail elderly participants with less severe conditions known to increase protein requirements | 2 | 126 | Risk Ratio (M‐H, Random, 95% CI) | 2.24 [0.05, 95.92] |
| 6.5 Participants do not fall into one of the categories above | 8 | 530 | Risk Ratio (M‐H, Random, 95% CI) | 0.90 [0.69, 1.19] |
| 7 Serious adverse events ‐ participants characterised as 'at nutritional risk' due to one of the following criteria Show forest plot | 49 | 4425 | Risk Ratio (M‐H, Random, 95% CI) | 0.82 [0.73, 0.91] |
| 7.1 BMI less than 20.5 kg/m2 | 0 | 0 | Risk Ratio (M‐H, Random, 95% CI) | 0.0 [0.0, 0.0] |
| 7.2 Weight loss of at least 5% during the last three months | 0 | 0 | Risk Ratio (M‐H, Random, 95% CI) | 0.0 [0.0, 0.0] |
| 7.3 Weight loss of at least 10% during the last six months | 1 | 32 | Risk Ratio (M‐H, Random, 95% CI) | 0.88 [0.44, 1.78] |
| 7.4 Insufficient food intake during the last week (50% of requirements or less) | 0 | 0 | Risk Ratio (M‐H, Random, 95% CI) | 0.0 [0.0, 0.0] |
| 7.5 Participants characterised as 'at nutritional risk' by other means | 48 | 4393 | Risk Ratio (M‐H, Random, 95% CI) | 0.81 [0.72, 0.91] |
| 8 Serious adverse events ‐ participants characterised as 'at nutritional risk' due to biomarkers or anthropometrics Show forest plot | 49 | 4425 | Risk Ratio (M‐H, Random, 95% CI) | 0.82 [0.73, 0.91] |
| 8.1 Biomarkers | 3 | 551 | Risk Ratio (M‐H, Random, 95% CI) | 0.16 [0.02, 1.26] |
| 8.2 Anthropometric measures | 2 | 122 | Risk Ratio (M‐H, Random, 95% CI) | 0.71 [0.24, 2.08] |
| 8.3 Both | 0 | 0 | Risk Ratio (M‐H, Random, 95% CI) | 0.0 [0.0, 0.0] |
| 8.4 Characterised by other means | 44 | 3752 | Risk Ratio (M‐H, Random, 95% CI) | 0.82 [0.74, 0.92] |
| 9 Serious adverse events ‐ randomisation year Show forest plot | 49 | 4425 | Risk Ratio (M‐H, Random, 95% CI) | 0.82 [0.73, 0.91] |
| 9.1 Before 1960 | 0 | 0 | Risk Ratio (M‐H, Random, 95% CI) | 0.0 [0.0, 0.0] |
| 9.2 1960 to 1979 | 1 | 26 | Risk Ratio (M‐H, Random, 95% CI) | 1.36 [0.10, 19.50] |
| 9.3 1980 to 1999 | 28 | 2591 | Risk Ratio (M‐H, Random, 95% CI) | 0.88 [0.77, 1.00] |
| 9.4 After 1999 | 20 | 1808 | Risk Ratio (M‐H, Random, 95% CI) | 0.70 [0.58, 0.85] |
| 10 Serious adverse events ‐ trials where the intervention lasts fewer than three days compared with trials where the intervention lasts three days or more Show forest plot | 49 | 4425 | Risk Ratio (M‐H, Random, 95% CI) | 0.82 [0.73, 0.91] |
| 10.1 Three days or more | 41 | 3893 | Risk Ratio (M‐H, Random, 95% CI) | 0.77 [0.66, 0.89] |
| 10.2 Less than three days | 8 | 532 | Risk Ratio (M‐H, Random, 95% CI) | 0.86 [0.60, 1.22] |
| 10.3 Unknown | 0 | 0 | Risk Ratio (M‐H, Random, 95% CI) | 0.0 [0.0, 0.0] |
| 11 Serious adverse events co‐interventions Show forest plot | 49 | 4425 | Risk Ratio (M‐H, Fixed, 95% CI) | 0.78 [0.70, 0.87] |
| 11.1 Received nutrition support as co‐intervention | 3 | 126 | Risk Ratio (M‐H, Fixed, 95% CI) | 0.66 [0.39, 1.12] |
| 11.2 did not receive nutrition support as co‐intervention | 39 | 3918 | Risk Ratio (M‐H, Fixed, 95% CI) | 0.77 [0.68, 0.86] |
| 11.3 delayed versus early nutrition support | 7 | 381 | Risk Ratio (M‐H, Fixed, 95% CI) | 1.06 [0.68, 1.64] |
| 12 Serious adverse events ‐ 'best‐worse case' scenario (enteral nutrition) Show forest plot | 48 | 4489 | Risk Ratio (M‐H, Random, 95% CI) | 0.62 [0.51, 0.75] |
| 13 Serious adverse events ‐ 'worst‐best case' scenario (enteral nutrition) Show forest plot | 48 | 4489 | Risk Ratio (M‐H, Random, 95% CI) | 0.81 [0.69, 0.95] |
| Outcome or subgroup title | No. of studies | No. of participants | Statistical method | Effect size |
| 1 All‐cause mortality ‐ overall Show forest plot | 43 | 7313 | Risk Ratio (M‐H, Random, 95% CI) | 0.98 [0.83, 1.16] |
| 2 All‐cause mortality ‐ bias Show forest plot | 43 | 7313 | Risk Ratio (M‐H, Random, 95% CI) | 0.98 [0.83, 1.16] |
| 2.1 High risk of bias | 43 | 7313 | Risk Ratio (M‐H, Random, 95% CI) | 0.98 [0.83, 1.16] |
| 2.2 Low risk of bias | 0 | 0 | Risk Ratio (M‐H, Random, 95% CI) | 0.0 [0.0, 0.0] |
| 3 All‐cause mortality ‐ medical speciality Show forest plot | 43 | 7313 | Risk Ratio (M‐H, Random, 95% CI) | 0.98 [0.83, 1.16] |
| 3.1 Cardiology | 0 | 0 | Risk Ratio (M‐H, Random, 95% CI) | 0.0 [0.0, 0.0] |
| 3.2 Medical gastroenterology and hepatology | 7 | 259 | Risk Ratio (M‐H, Random, 95% CI) | 1.17 [0.58, 2.37] |
| 3.3 Geriatrics | 0 | 0 | Risk Ratio (M‐H, Random, 95% CI) | 0.0 [0.0, 0.0] |
| 3.4 Pulmonary disease | 1 | 25 | Risk Ratio (M‐H, Random, 95% CI) | 0.22 [0.01, 4.08] |
| 3.5 Endocrinology | 0 | 0 | Risk Ratio (M‐H, Random, 95% CI) | 0.0 [0.0, 0.0] |
| 3.6 Infectious diseases | 0 | 0 | Risk Ratio (M‐H, Random, 95% CI) | 0.0 [0.0, 0.0] |
| 3.7 Rheumatology | 0 | 0 | Risk Ratio (M‐H, Random, 95% CI) | 0.0 [0.0, 0.0] |
| 3.8 Haematology | 0 | 0 | Risk Ratio (M‐H, Random, 95% CI) | 0.0 [0.0, 0.0] |
| 3.9 Nephrology | 0 | 0 | Risk Ratio (M‐H, Random, 95% CI) | 0.0 [0.0, 0.0] |
| 3.10 Gastroenterologic surgery | 21 | 1553 | Risk Ratio (M‐H, Random, 95% CI) | 0.79 [0.52, 1.20] |
| 3.11 Trauma surgery | 2 | 45 | Risk Ratio (M‐H, Random, 95% CI) | 1.22 [0.66, 2.25] |
| 3.12 Orthopaedics | 0 | 0 | Risk Ratio (M‐H, Random, 95% CI) | 0.0 [0.0, 0.0] |
| 3.13 Plastic, reconstructive and aesthetic surgery | 0 | 0 | Risk Ratio (M‐H, Random, 95% CI) | 0.0 [0.0, 0.0] |
| 3.14 Vascular surgery | 1 | 15 | Risk Ratio (M‐H, Random, 95% CI) | 0.0 [0.0, 0.0] |
| 3.15 Transplant surgery | 2 | 47 | Risk Ratio (M‐H, Random, 95% CI) | 0.61 [0.23, 1.65] |
| 3.16 Urology | 0 | 0 | Risk Ratio (M‐H, Random, 95% CI) | 0.0 [0.0, 0.0] |
| 3.17 Thoracic surgery | 1 | 44 | Risk Ratio (M‐H, Random, 95% CI) | 1.6 [0.40, 6.32] |
| 3.18 Neurological surgery | 0 | 0 | Risk Ratio (M‐H, Random, 95% CI) | 0.0 [0.0, 0.0] |
| 3.19 Oro‐maxillo‐facial surgery | 0 | 0 | Risk Ratio (M‐H, Random, 95% CI) | 0.0 [0.0, 0.0] |
| 3.20 Anaesthesiology | 0 | 0 | Risk Ratio (M‐H, Random, 95% CI) | 0.0 [0.0, 0.0] |
| 3.21 Emergency medicine | 4 | 5044 | Risk Ratio (M‐H, Random, 95% CI) | 1.00 [0.81, 1.24] |
| 3.22 Psychiatry | 0 | 0 | Risk Ratio (M‐H, Random, 95% CI) | 0.0 [0.0, 0.0] |
| 3.23 Neurology | 0 | 0 | Risk Ratio (M‐H, Random, 95% CI) | 0.0 [0.0, 0.0] |
| 3.24 Oncology | 4 | 281 | Risk Ratio (M‐H, Random, 95% CI) | 1.19 [0.44, 3.21] |
| 3.25 Dermatology | 0 | 0 | Risk Ratio (M‐H, Random, 95% CI) | 0.0 [0.0, 0.0] |
| 3.26 Gynaecology | 0 | 0 | Risk Ratio (M‐H, Random, 95% CI) | 0.0 [0.0, 0.0] |
| 3.27 Mixed | 0 | 0 | Risk Ratio (M‐H, Random, 95% CI) | 0.0 [0.0, 0.0] |
| 4 All‐cause mortality ‐ based on adequacy of the amount of calories Show forest plot | 43 | 7313 | Risk Ratio (M‐H, Random, 95% CI) | 0.98 [0.83, 1.16] |
| 4.1 Clearly adequate in experimental group and clearly inadequate in control group | 7 | 5641 | Risk Ratio (M‐H, Random, 95% CI) | 0.98 [0.80, 1.20] |
| 4.2 Inadequate in the experimental group or adequate in the control group | 1 | 53 | Risk Ratio (M‐H, Random, 95% CI) | 1.16 [0.40, 3.33] |
| 4.3 Experimental group is overfed | 0 | 0 | Risk Ratio (M‐H, Random, 95% CI) | 0.0 [0.0, 0.0] |
| 4.4 Unclear intake in experimental group or control group | 35 | 1619 | Risk Ratio (M‐H, Random, 95% CI) | 0.95 [0.68, 1.32] |
| 5 All‐cause mortality ‐ different screening tools Show forest plot | 43 | 7313 | Risk Ratio (M‐H, Random, 95% CI) | 0.98 [0.83, 1.16] |
| 5.1 NRS 2002 | 1 | 4640 | Risk Ratio (M‐H, Random, 95% CI) | 1.04 [0.83, 1.30] |
| 5.2 MUST | 0 | 0 | Risk Ratio (M‐H, Random, 95% CI) | 0.0 [0.0, 0.0] |
| 5.3 MNA | 0 | 0 | Risk Ratio (M‐H, Random, 95% CI) | 0.0 [0.0, 0.0] |
| 5.4 SGA | 1 | 323 | Risk Ratio (M‐H, Random, 95% CI) | 0.75 [0.13, 4.44] |
| 5.5 Other means | 41 | 2350 | Risk Ratio (M‐H, Random, 95% CI) | 0.90 [0.69, 1.17] |
| 6 All‐cause mortality ‐ participants characterised as 'at nutritional risk' due to one of the following conditions Show forest plot | 43 | 7313 | Risk Ratio (M‐H, Random, 95% CI) | 0.98 [0.83, 1.16] |
| 6.1 Major surgery | 26 | 1822 | Risk Ratio (M‐H, Random, 95% CI) | 0.80 [0.56, 1.15] |
| 6.2 Stroke | 0 | 0 | Risk Ratio (M‐H, Random, 95% CI) | 0.0 [0.0, 0.0] |
| 6.3 ICU participants including trauma | 6 | 5089 | Risk Ratio (M‐H, Random, 95% CI) | 1.02 [0.84, 1.25] |
| 6.4 Frail elderly participants with less severe conditions known to increase protein requirements | 1 | 34 | Risk Ratio (M‐H, Random, 95% CI) | 3.35 [0.15, 76.93] |
| 6.5 Participants do not fall into one of the categories above | 10 | 368 | Risk Ratio (M‐H, Random, 95% CI) | 1.12 [0.60, 2.10] |
| 7 All‐cause mortality ‐ participants characterised as 'at nutritional risk' due to one of the following criteria Show forest plot | 43 | 7313 | Risk Ratio (M‐H, Random, 95% CI) | 0.98 [0.83, 1.16] |
| 7.1 BMI less than 20.5 kg/m2 | 0 | 0 | Risk Ratio (M‐H, Random, 95% CI) | 0.0 [0.0, 0.0] |
| 7.2 Weight loss of at least 5% during the last three months | 0 | 0 | Risk Ratio (M‐H, Random, 95% CI) | 0.0 [0.0, 0.0] |
| 7.3 Weight loss of at least 10% during the last six months | 0 | 0 | Risk Ratio (M‐H, Random, 95% CI) | 0.0 [0.0, 0.0] |
| 7.4 Insufficient food intake during the last week (50% of requirements or less) | 0 | 0 | Risk Ratio (M‐H, Random, 95% CI) | 0.0 [0.0, 0.0] |
| 7.5 Participants characterised as 'at nutritional risk' by other means | 43 | 7313 | Risk Ratio (M‐H, Random, 95% CI) | 0.98 [0.83, 1.16] |
| 8 All‐cause mortality ‐ participants characterised as 'at nutritional risk' due to biomarkers or anthropometrics Show forest plot | 43 | 7313 | Risk Ratio (M‐H, Random, 95% CI) | 0.98 [0.83, 1.16] |
| 8.1 Biomarkers | 2 | 43 | Risk Ratio (M‐H, Random, 95% CI) | 0.22 [0.01, 4.08] |
| 8.2 Anthropometric measures | 3 | 137 | Risk Ratio (M‐H, Random, 95% CI) | 1.31 [0.38, 4.58] |
| 8.3 Both | 3 | 75 | Risk Ratio (M‐H, Random, 95% CI) | 0.66 [0.14, 3.07] |
| 8.4 Characterised by other means | 35 | 7058 | Risk Ratio (M‐H, Random, 95% CI) | 0.98 [0.83, 1.17] |
| 9 All‐cause mortality ‐ randomisation year Show forest plot | 43 | 7313 | Risk Ratio (M‐H, Random, 95% CI) | 0.98 [0.83, 1.16] |
| 9.1 Before 1960 | 0 | 0 | Risk Ratio (M‐H, Random, 95% CI) | 0.0 [0.0, 0.0] |
| 9.2 1960‐1979 | 3 | 95 | Risk Ratio (M‐H, Random, 95% CI) | 1.85 [0.58, 5.88] |
| 9.3 1980‐1999 | 34 | 1694 | Risk Ratio (M‐H, Random, 95% CI) | 0.91 [0.68, 1.21] |
| 9.4 After 1999 | 6 | 5524 | Risk Ratio (M‐H, Random, 95% CI) | 1.00 [0.81, 1.23] |
| 10 All‐cause mortality ‐ trials where the intervention lasts fewer than three days compared with trials where the intervention lasts three days or more Show forest plot | 43 | 7313 | Risk Ratio (M‐H, Random, 95% CI) | 0.98 [0.83, 1.16] |
| 10.1 Three days or more | 41 | 7206 | Risk Ratio (M‐H, Random, 95% CI) | 0.98 [0.83, 1.16] |
| 10.2 Less than three days | 1 | 80 | Risk Ratio (M‐H, Random, 95% CI) | 0.67 [0.12, 3.78] |
| 10.3 Unknown | 1 | 27 | Risk Ratio (M‐H, Random, 95% CI) | 0.0 [0.0, 0.0] |
| 11 All‐cause mortality ‐ 'best‐worst case' scenario Show forest plot | 43 | 7432 | Risk Ratio (M‐H, Random, 95% CI) | 0.73 [0.56, 0.97] |
| 12 All‐cause mortality ‐ 'worst‐best case' scenario Show forest plot | 43 | 7432 | Risk Ratio (M‐H, Random, 95% CI) | 1.20 [0.98, 1.47] |
| 13 All‐cause mortality co‐interventions Show forest plot | 43 | 7313 | Risk Ratio (M‐H, Fixed, 95% CI) | 0.98 [0.82, 1.16] |
| 13.1 received nutrition support as co‐intervention | 6 | 5066 | Risk Ratio (M‐H, Fixed, 95% CI) | 1.03 [0.83, 1.26] |
| 13.2 did not receive nutrition support as co‐intervention | 36 | 2167 | Risk Ratio (M‐H, Fixed, 95% CI) | 0.88 [0.66, 1.18] |
| 13.3 delayed versus early nutrition support | 1 | 80 | Risk Ratio (M‐H, Fixed, 95% CI) | 0.67 [0.12, 3.78] |
| Outcome or subgroup title | No. of studies | No. of participants | Statistical method | Effect size |
| 1 All‐cause mortality ‐ overall Show forest plot | 51 | 8121 | Risk Ratio (M‐H, Random, 95% CI) | 0.99 [0.90, 1.09] |
| 2 All‐cause mortality ‐ bias Show forest plot | 51 | 8121 | Risk Ratio (M‐H, Random, 95% CI) | 0.99 [0.90, 1.09] |
| 2.1 High risk of bias | 51 | 8121 | Risk Ratio (M‐H, Random, 95% CI) | 0.99 [0.90, 1.09] |
| 2.2 Low risk of bias | 0 | 0 | Risk Ratio (M‐H, Random, 95% CI) | 0.0 [0.0, 0.0] |
| 3 All‐cause mortality ‐ medical speciality Show forest plot | 51 | 8121 | Risk Ratio (M‐H, Random, 95% CI) | 0.99 [0.90, 1.09] |
| 3.1 Cardiology | 0 | 0 | Risk Ratio (M‐H, Random, 95% CI) | 0.0 [0.0, 0.0] |
| 3.2 Medical gastroenterology and hepatology | 7 | 254 | Risk Ratio (M‐H, Random, 95% CI) | 1.02 [0.74, 1.42] |
| 3.3 Geriatrics | 0 | 0 | Risk Ratio (M‐H, Random, 95% CI) | 0.0 [0.0, 0.0] |
| 3.4 Pulmonary disease | 1 | 25 | Risk Ratio (M‐H, Random, 95% CI) | 0.22 [0.01, 4.08] |
| 3.5 Endocrinology | 0 | 0 | Risk Ratio (M‐H, Random, 95% CI) | 0.0 [0.0, 0.0] |
| 3.6 Infectious diseases | 0 | 0 | Risk Ratio (M‐H, Random, 95% CI) | 0.0 [0.0, 0.0] |
| 3.7 Rheumatology | 0 | 0 | Risk Ratio (M‐H, Random, 95% CI) | 0.0 [0.0, 0.0] |
| 3.8 Haematology | 0 | 0 | Risk Ratio (M‐H, Random, 95% CI) | 0.0 [0.0, 0.0] |
| 3.9 Nephrology | 0 | 0 | Risk Ratio (M‐H, Random, 95% CI) | 0.0 [0.0, 0.0] |
| 3.10 Gastroenterologic surgery | 24 | 2104 | Risk Ratio (M‐H, Random, 95% CI) | 0.93 [0.68, 1.28] |
| 3.11 Trauma surgery | 2 | 45 | Risk Ratio (M‐H, Random, 95% CI) | 1.22 [0.66, 2.25] |
| 3.12 Ortopaedics | 0 | 0 | Risk Ratio (M‐H, Random, 95% CI) | 0.0 [0.0, 0.0] |
| 3.13 Plastic, reconstructive, and aesthetic surgery | 0 | 0 | Risk Ratio (M‐H, Random, 95% CI) | 0.0 [0.0, 0.0] |
| 3.14 Vascular surgery | 1 | 15 | Risk Ratio (M‐H, Random, 95% CI) | 0.0 [0.0, 0.0] |
| 3.15 Transplant surgery | 2 | 47 | Risk Ratio (M‐H, Random, 95% CI) | 0.56 [0.22, 1.42] |
| 3.16 Urology | 0 | 0 | Risk Ratio (M‐H, Random, 95% CI) | 0.0 [0.0, 0.0] |
| 3.17 Thoracic surgery | 1 | 44 | Risk Ratio (M‐H, Random, 95% CI) | 1.6 [0.40, 6.32] |
| 3.18 Neurological surgery | 0 | 0 | Risk Ratio (M‐H, Random, 95% CI) | 0.0 [0.0, 0.0] |
| 3.19 Oro‐maxillo‐facial surgery | 0 | 0 | Risk Ratio (M‐H, Random, 95% CI) | 0.0 [0.0, 0.0] |
| 3.20 Anaesthesiology | 0 | 0 | Risk Ratio (M‐H, Random, 95% CI) | 0.0 [0.0, 0.0] |
| 3.21 Emergency medicine | 7 | 5208 | Risk Ratio (M‐H, Random, 95% CI) | 0.97 [0.84, 1.12] |
| 3.22 Psychiatry | 0 | 0 | Risk Ratio (M‐H, Random, 95% CI) | 0.0 [0.0, 0.0] |
| 3.23 Neurology | 0 | 0 | Risk Ratio (M‐H, Random, 95% CI) | 0.0 [0.0, 0.0] |
| 3.24 Oncology | 6 | 379 | Risk Ratio (M‐H, Random, 95% CI) | 1.03 [0.87, 1.21] |
| 3.25 Dermatology | 0 | 0 | Risk Ratio (M‐H, Random, 95% CI) | 0.0 [0.0, 0.0] |
| 3.26 Gynaecology | 0 | 0 | Risk Ratio (M‐H, Random, 95% CI) | 0.0 [0.0, 0.0] |
| 3.27 Mixed | 0 | 0 | Risk Ratio (M‐H, Random, 95% CI) | 0.0 [0.0, 0.0] |
| 4 All‐cause mortality ‐ based on adequacy of the amount of calories Show forest plot | 51 | 8121 | Risk Ratio (M‐H, Random, 95% CI) | 0.99 [0.90, 1.09] |
| 4.1 Clearly adequate in intervention and clearly inadequate in control | 7 | 5641 | Risk Ratio (M‐H, Random, 95% CI) | 0.98 [0.88, 1.10] |
| 4.2 Inadequate in the experimental or adequate in the control | 4 | 165 | Risk Ratio (M‐H, Random, 95% CI) | 1.17 [0.80, 1.72] |
| 4.3 Experimental group is overfed | 4 | 272 | Risk Ratio (M‐H, Random, 95% CI) | 0.56 [0.23, 1.34] |
| 4.4 Unclear intake in control or experimental | 36 | 2043 | Risk Ratio (M‐H, Random, 95% CI) | 0.99 [0.80, 1.22] |
| 5 All‐cause mortality ‐ different screening tools Show forest plot | 51 | 8121 | Risk Ratio (M‐H, Random, 95% CI) | 0.99 [0.90, 1.09] |
| 5.1 NRS 2002 | 1 | 4640 | Risk Ratio (M‐H, Random, 95% CI) | 1.00 [0.85, 1.18] |
| 5.2 MUST | 0 | 0 | Risk Ratio (M‐H, Random, 95% CI) | 0.0 [0.0, 0.0] |
| 5.3 MNA | 0 | 0 | Risk Ratio (M‐H, Random, 95% CI) | 0.0 [0.0, 0.0] |
| 5.4 SGA | 1 | 323 | Risk Ratio (M‐H, Random, 95% CI) | 0.75 [0.13, 4.44] |
| 5.5 Other means | 49 | 3158 | Risk Ratio (M‐H, Random, 95% CI) | 0.98 [0.88, 1.11] |
| 6 All‐cause mortality ‐ participants characterised as 'at nutritional risk' due to one of the following conditions Show forest plot | 51 | 8121 | Risk Ratio (M‐H, Random, 95% CI) | 0.99 [0.90, 1.09] |
| 6.1 Major surgery | 30 | 2381 | Risk Ratio (M‐H, Random, 95% CI) | 0.88 [0.67, 1.15] |
| 6.2 Stroke | 0 | 0 | Risk Ratio (M‐H, Random, 95% CI) | 0.0 [0.0, 0.0] |
| 6.3 ICU participants including trauma | 7 | 5209 | Risk Ratio (M‐H, Random, 95% CI) | 0.99 [0.86, 1.14] |
| 6.4 Frail elderly participants with less severe conditions known to increase protein requirements | 1 | 34 | Risk Ratio (M‐H, Random, 95% CI) | 3.35 [0.15, 76.93] |
| 6.5 Participants do not fall into one of the categories above | 13 | 497 | Risk Ratio (M‐H, Random, 95% CI) | 1.02 [0.88, 1.18] |
| 7 All‐cause mortality ‐ participants characterised as 'at nutritional risk' due to one of the following criteria Show forest plot | 51 | 8121 | Risk Ratio (M‐H, Random, 95% CI) | 0.99 [0.90, 1.09] |
| 7.1 BMI less than 20.5 kg/m2 | 0 | 0 | Risk Ratio (M‐H, Random, 95% CI) | 0.0 [0.0, 0.0] |
| 7.2 Weight loss of at least 5% during the last three months | 0 | 0 | Risk Ratio (M‐H, Random, 95% CI) | 0.0 [0.0, 0.0] |
| 7.3 Weight loss of at least 10% during the last six months | 2 | 92 | Risk Ratio (M‐H, Random, 95% CI) | 0.33 [0.01, 7.78] |
| 7.4 Insufficient food intake during the last week (50% of requirements or less) | 0 | 0 | Risk Ratio (M‐H, Random, 95% CI) | 0.0 [0.0, 0.0] |
| 7.5 Participants characterised as 'at nutritional risk' by other means | 49 | 8029 | Risk Ratio (M‐H, Random, 95% CI) | 0.99 [0.90, 1.09] |
| 8 All‐cause mortality ‐ participants characterised as 'at nutritional risk' due to biomarkers or anthropometrics Show forest plot | 51 | 8121 | Risk Ratio (M‐H, Random, 95% CI) | 0.99 [0.90, 1.09] |
| 8.1 Biomarkers | 5 | 169 | Risk Ratio (M‐H, Random, 95% CI) | 0.47 [0.10, 2.12] |
| 8.2 Anthropometric measures | 3 | 137 | Risk Ratio (M‐H, Random, 95% CI) | 0.93 [0.32, 2.75] |
| 8.3 Both anthropometrics and biomarkers | 3 | 75 | Risk Ratio (M‐H, Random, 95% CI) | 0.66 [0.14, 3.07] |
| 8.4 Characterised by other means | 40 | 7740 | Risk Ratio (M‐H, Random, 95% CI) | 0.99 [0.90, 1.09] |
| 9 All‐cause mortality ‐ randomisation year Show forest plot | 51 | 8121 | Risk Ratio (M‐H, Random, 95% CI) | 0.99 [0.90, 1.09] |
| 9.1 Before 1960 | 0 | 0 | Risk Ratio (M‐H, Random, 95% CI) | 0.0 [0.0, 0.0] |
| 9.2 1960 to 1979 | 4 | 151 | Risk Ratio (M‐H, Random, 95% CI) | 1.50 [0.56, 4.03] |
| 9.3 1980 to 1999 | 41 | 2446 | Risk Ratio (M‐H, Random, 95% CI) | 0.99 [0.88, 1.12] |
| 9.4 After 1999 | 6 | 5524 | Risk Ratio (M‐H, Random, 95% CI) | 0.98 [0.84, 1.13] |
| 10 All‐cause mortality ‐ trials where the intervention lasts fewer than three days compared with trials where the intervention lasts three days or more Show forest plot | 51 | 8121 | Risk Ratio (M‐H, Random, 95% CI) | 0.99 [0.90, 1.09] |
| 10.1 Three days or more | 49 | 8014 | Risk Ratio (M‐H, Random, 95% CI) | 0.99 [0.89, 1.08] |
| 10.2 Less than three days | 1 | 80 | Risk Ratio (M‐H, Random, 95% CI) | 1.2 [0.59, 2.45] |
| 10.3 Unknown | 1 | 27 | Risk Ratio (M‐H, Random, 95% CI) | 0.0 [0.0, 0.0] |
| 11 All‐cause mortality ‐ 'best‐worst case' scenario Show forest plot | 51 | 8240 | Risk Ratio (M‐H, Random, 95% CI) | 0.87 [0.74, 1.02] |
| 12 All‐cause mortality ‐ 'worst‐best case' scenario Show forest plot | 51 | 8240 | Risk Ratio (M‐H, Random, 95% CI) | 1.06 [0.95, 1.19] |
| 13 All‐cause mortality co‐interventions Show forest plot | 51 | 8121 | Risk Ratio (M‐H, Fixed, 95% CI) | 0.97 [0.87, 1.09] |
| 13.1 received nutrition support as co‐intervention | 5 | 5044 | Risk Ratio (M‐H, Fixed, 95% CI) | 0.97 [0.84, 1.13] |
| 13.2 did not receive nutrition support as co‐intervention | 45 | 2997 | Risk Ratio (M‐H, Fixed, 95% CI) | 0.96 [0.81, 1.14] |
| 13.3 delayed versus early nutrition support | 1 | 80 | Risk Ratio (M‐H, Fixed, 95% CI) | 1.2 [0.59, 2.45] |
| Outcome or subgroup title | No. of studies | No. of participants | Statistical method | Effect size |
| 1 Serious adverse events ‐ overall Show forest plot | 48 | 7519 | Risk Ratio (M‐H, Random, 95% CI) | 0.98 [0.85, 1.14] |
| 2 Serious adverse events ‐ bias Show forest plot | 48 | 7519 | Risk Ratio (M‐H, Random, 95% CI) | 0.98 [0.85, 1.14] |
| 2.1 High risk of bias | 48 | 7519 | Risk Ratio (M‐H, Random, 95% CI) | 0.98 [0.85, 1.14] |
| 2.2 Low risk of bias | 0 | 0 | Risk Ratio (M‐H, Random, 95% CI) | 0.0 [0.0, 0.0] |
| 3 Serious adverse events ‐ by medical specialty Show forest plot | 48 | 7519 | Risk Ratio (M‐H, Random, 95% CI) | 0.98 [0.85, 1.14] |
| 3.1 Cardiology | 0 | 0 | Risk Ratio (M‐H, Random, 95% CI) | 0.0 [0.0, 0.0] |
| 3.2 Medical gastroenterology and hepatology | 7 | 259 | Risk Ratio (M‐H, Random, 95% CI) | 1.29 [0.73, 2.29] |
| 3.3 High risk | 0 | 0 | Risk Ratio (M‐H, Random, 95% CI) | 0.0 [0.0, 0.0] |
| 3.4 Geriatrics | 0 | 0 | Risk Ratio (M‐H, Random, 95% CI) | 0.0 [0.0, 0.0] |
| 3.5 Pulmonary disease | 1 | 25 | Risk Ratio (M‐H, Random, 95% CI) | 0.22 [0.01, 4.08] |
| 3.6 Endocrinology | 0 | 0 | Risk Ratio (M‐H, Random, 95% CI) | 0.0 [0.0, 0.0] |
| 3.7 Infectious diseases | 0 | 0 | Risk Ratio (M‐H, Random, 95% CI) | 0.0 [0.0, 0.0] |
| 3.8 Rheumatology | 0 | 0 | Risk Ratio (M‐H, Random, 95% CI) | 0.0 [0.0, 0.0] |
| 3.9 Haematology | 0 | 0 | Risk Ratio (M‐H, Random, 95% CI) | 0.0 [0.0, 0.0] |
| 3.10 Nephrology | 0 | 0 | Risk Ratio (M‐H, Random, 95% CI) | 0.0 [0.0, 0.0] |
| 3.11 Gastroenterologic surgery | 24 | 1663 | Risk Ratio (M‐H, Random, 95% CI) | 0.78 [0.56, 1.10] |
| 3.12 Trauma surgery | 2 | 45 | Risk Ratio (M‐H, Random, 95% CI) | 1.22 [0.66, 2.25] |
| 3.13 Ortopaedics | 1 | 80 | Risk Ratio (M‐H, Random, 95% CI) | 0.0 [0.0, 0.0] |
| 3.14 Plastic, reconstructive, and aesthetic surgery | 0 | 0 | Risk Ratio (M‐H, Random, 95% CI) | 0.0 [0.0, 0.0] |
| 3.15 Vascular surgery | 2 | 35 | Risk Ratio (M‐H, Random, 95% CI) | 0.5 [0.05, 4.67] |
| 3.16 Transplant surgery | 2 | 47 | Risk Ratio (M‐H, Random, 95% CI) | 0.61 [0.23, 1.65] |
| 3.17 Urology | 0 | 0 | Risk Ratio (M‐H, Random, 95% CI) | 0.0 [0.0, 0.0] |
| 3.18 Thoracic surgery | 1 | 44 | Risk Ratio (M‐H, Random, 95% CI) | 1.6 [0.40, 6.32] |
| 3.19 Neurological surgery | 0 | 0 | Risk Ratio (M‐H, Random, 95% CI) | 0.0 [0.0, 0.0] |
| 3.20 Oro‐maxillo‐facial surgery | 0 | 0 | Risk Ratio (M‐H, Random, 95% CI) | 0.0 [0.0, 0.0] |
| 3.21 Anaesthesiology | 0 | 0 | Risk Ratio (M‐H, Random, 95% CI) | 0.0 [0.0, 0.0] |
| 3.22 Emergency medicine | 4 | 5044 | Risk Ratio (M‐H, Random, 95% CI) | 1.00 [0.81, 1.24] |
| 3.23 Psychiatry | 0 | 0 | Risk Ratio (M‐H, Random, 95% CI) | 0.0 [0.0, 0.0] |
| 3.24 Neurology | 0 | 0 | Risk Ratio (M‐H, Random, 95% CI) | 0.0 [0.0, 0.0] |
| 3.25 Oncology | 4 | 277 | Risk Ratio (M‐H, Random, 95% CI) | 1.12 [0.51, 2.44] |
| 3.26 Dermatology | 0 | 0 | Risk Ratio (M‐H, Random, 95% CI) | 0.0 [0.0, 0.0] |
| 3.27 Gynaecology | 0 | 0 | Risk Ratio (M‐H, Random, 95% CI) | 0.0 [0.0, 0.0] |
| 3.28 Mixed | 0 | 0 | Risk Ratio (M‐H, Random, 95% CI) | 0.0 [0.0, 0.0] |
| 4 Serious adverse events ‐ based on adequacy of the amount of calories Show forest plot | 48 | 7519 | Risk Ratio (M‐H, Random, 95% CI) | 0.98 [0.85, 1.14] |
| 4.1 Clearly adequate in intervention and clearly inadequate in control | 9 | 5736 | Risk Ratio (M‐H, Random, 95% CI) | 0.98 [0.80, 1.19] |
| 4.2 Inadequate in the experimental or adequate in the control | 5 | 218 | Risk Ratio (M‐H, Random, 95% CI) | 1.20 [0.74, 1.95] |
| 4.3 Experimental group is overfed | 1 | 124 | Risk Ratio (M‐H, Random, 95% CI) | 0.52 [0.19, 1.47] |
| 4.4 Unclear intake in control or experimental | 33 | 1441 | Risk Ratio (M‐H, Random, 95% CI) | 0.89 [0.65, 1.23] |
| 5 Serious adverse events ‐ different screening tools Show forest plot | 48 | 7519 | Risk Ratio (M‐H, Random, 95% CI) | 0.98 [0.85, 1.14] |
| 5.1 NRS 2002 | 1 | 4640 | Risk Ratio (M‐H, Random, 95% CI) | 1.04 [0.83, 1.30] |
| 5.2 MUST | 0 | 0 | Risk Ratio (M‐H, Random, 95% CI) | 0.0 [0.0, 0.0] |
| 5.3 MNA | 0 | 0 | Risk Ratio (M‐H, Random, 95% CI) | 0.0 [0.0, 0.0] |
| 5.4 SGA | 1 | 323 | Risk Ratio (M‐H, Random, 95% CI) | 0.72 [0.28, 1.83] |
| 5.5 Other means | 46 | 2556 | Risk Ratio (M‐H, Random, 95% CI) | 0.95 [0.77, 1.17] |
| 6 Serious adverse events ‐ participants characterised as 'at nutritional risk' due to one of the following conditions Show forest plot | 48 | 7519 | Risk Ratio (M‐H, Random, 95% CI) | 0.98 [0.85, 1.14] |
| 6.1 Major surgery | 30 | 1952 | Risk Ratio (M‐H, Random, 95% CI) | 0.86 [0.66, 1.13] |
| 6.2 Stroke | 0 | 0 | Risk Ratio (M‐H, Random, 95% CI) | 0.0 [0.0, 0.0] |
| 6.3 ICU participants including trauma | 6 | 5089 | Risk Ratio (M‐H, Random, 95% CI) | 1.02 [0.84, 1.25] |
| 6.4 Frail elderly participants with less severe conditions known to increase protein requirements | 2 | 114 | Risk Ratio (M‐H, Random, 95% CI) | 0.56 [0.06, 5.63] |
| 6.5 Participants do not fall into one of the categories above | 10 | 364 | Risk Ratio (M‐H, Random, 95% CI) | 1.18 [0.69, 2.02] |
| 7 Serious adverse events ‐ participants characterised as 'at nutritional risk' due to one of the following criteria Show forest plot | 48 | 7519 | Risk Ratio (M‐H, Random, 95% CI) | 0.98 [0.85, 1.14] |
| 7.1 BMI less than 20.5 kg/m2 | 0 | 0 | Risk Ratio (M‐H, Random, 95% CI) | 0.0 [0.0, 0.0] |
| 7.2 Weight loss of at least 5% during the last three months | 0 | 0 | Risk Ratio (M‐H, Random, 95% CI) | 0.0 [0.0, 0.0] |
| 7.3 Weight loss of at least 10% during the last six months | 0 | 0 | Risk Ratio (M‐H, Random, 95% CI) | 0.0 [0.0, 0.0] |
| 7.4 Insufficient food intake during the last week (50% of requirements or less) | 0 | 0 | Risk Ratio (M‐H, Random, 95% CI) | 0.0 [0.0, 0.0] |
| 7.5 Participants characterised as 'at nutritional risk' by other means | 48 | 7519 | Risk Ratio (M‐H, Random, 95% CI) | 0.98 [0.85, 1.14] |
| 8 Serious adverse events ‐ participants characterised as 'at nutritional risk' due to biomarkers or anthropometrics Show forest plot | 48 | 7519 | Risk Ratio (M‐H, Random, 95% CI) | 0.98 [0.85, 1.14] |
| 8.1 Biomarkers | 3 | 77 | Risk Ratio (M‐H, Random, 95% CI) | 0.39 [0.06, 2.39] |
| 8.2 Anthropometric measures | 3 | 137 | Risk Ratio (M‐H, Random, 95% CI) | 0.69 [0.16, 3.01] |
| 8.3 Mixed | 3 | 75 | Risk Ratio (M‐H, Random, 95% CI) | 0.66 [0.14, 3.07] |
| 8.4 Characterised by other means | 39 | 7230 | Risk Ratio (M‐H, Random, 95% CI) | 1.00 [0.86, 1.16] |
| 9 Serious adverse events ‐ randomisation year Show forest plot | 48 | 7519 | Risk Ratio (M‐H, Random, 95% CI) | 0.98 [0.85, 1.14] |
| 9.1 Before 1960 | 0 | 0 | Risk Ratio (M‐H, Random, 95% CI) | 0.0 [0.0, 0.0] |
| 9.2 1960 to 1979 | 3 | 98 | Risk Ratio (M‐H, Random, 95% CI) | 2.02 [0.82, 4.98] |
| 9.3 1980 to 1999 | 37 | 1754 | Risk Ratio (M‐H, Random, 95% CI) | 0.95 [0.76, 1.19] |
| 9.4 After 1999 | 8 | 5667 | Risk Ratio (M‐H, Random, 95% CI) | 0.97 [0.79, 1.20] |
| 10 Serious adverse events ‐ trials where the intervention lasts fewer than three days compared with trials where the intervention lasts three days or more Show forest plot | 48 | 7519 | Risk Ratio (M‐H, Random, 95% CI) | 0.98 [0.85, 1.14] |
| 10.1 Three days or more | 46 | 7412 | Risk Ratio (M‐H, Random, 95% CI) | 0.99 [0.85, 1.15] |
| 10.2 Less than three days | 1 | 80 | Risk Ratio (M‐H, Random, 95% CI) | 0.67 [0.12, 3.78] |
| 10.3 Unknown | 1 | 27 | Risk Ratio (M‐H, Random, 95% CI) | 0.0 [0.0, 0.0] |
| 11 Serious adverse events ‐ 'best‐worst case' scenario Show forest plot | 48 | 8293 | Risk Ratio (M‐H, Random, 95% CI) | 0.78 [0.63, 0.98] |
| 12 Serious adverse events ‐ 'worst‐best case' scenario Show forest plot | 48 | 8293 | Risk Ratio (M‐H, Random, 95% CI) | 1.16 [0.95, 1.42] |
| 13 Serious adverse events co‐interventions Show forest plot | 48 | 7519 | Risk Ratio (M‐H, Fixed, 95% CI) | 0.94 [0.81, 1.09] |
| 13.1 received nutrition support as co‐intervention | 5 | 5049 | Risk Ratio (M‐H, Fixed, 95% CI) | 1.02 [0.83, 1.26] |
| 13.2 did not receive nutrition support as co‐intervention | 42 | 2390 | Risk Ratio (M‐H, Fixed, 95% CI) | 0.87 [0.70, 1.07] |
| 13.3 delayed versus early nutrition support | 1 | 80 | Risk Ratio (M‐H, Fixed, 95% CI) | 0.67 [0.12, 3.78] |
| Outcome or subgroup title | No. of studies | No. of participants | Statistical method | Effect size |
| 1 Serious adverse events ‐ overall Show forest plot | 56 | 8263 | Risk Ratio (M‐H, Random, 95% CI) | 0.98 [0.90, 1.07] |
| 2 Serious adverse events ‐ bias Show forest plot | 56 | 8263 | Risk Ratio (M‐H, Random, 95% CI) | 0.98 [0.90, 1.07] |
| 2.1 High risk of bias | 56 | 8263 | Risk Ratio (M‐H, Random, 95% CI) | 0.98 [0.90, 1.07] |
| 2.2 Low risk of bias | 0 | 0 | Risk Ratio (M‐H, Random, 95% CI) | 0.0 [0.0, 0.0] |
| 3 Serious adverse events ‐ by medical speciality Show forest plot | 56 | 8263 | Risk Ratio (M‐H, Random, 95% CI) | 0.98 [0.90, 1.07] |
| 3.1 Cardiology | 0 | 0 | Risk Ratio (M‐H, Random, 95% CI) | 0.0 [0.0, 0.0] |
| 3.2 Medical gastroenterology and hepatology | 7 | 338 | Risk Ratio (M‐H, Random, 95% CI) | 0.96 [0.69, 1.33] |
| 3.3 Geriatrics | 0 | 0 | Risk Ratio (M‐H, Random, 95% CI) | 0.0 [0.0, 0.0] |
| 3.4 Pulmonary disease | 1 | 25 | Risk Ratio (M‐H, Random, 95% CI) | 0.22 [0.01, 4.08] |
| 3.5 Endocrinology | 0 | 0 | Risk Ratio (M‐H, Random, 95% CI) | 0.0 [0.0, 0.0] |
| 3.6 Infectious diseases | 0 | 0 | Risk Ratio (M‐H, Random, 95% CI) | 0.0 [0.0, 0.0] |
| 3.7 Rheumatology | 0 | 0 | Risk Ratio (M‐H, Random, 95% CI) | 0.0 [0.0, 0.0] |
| 3.8 Haematology | 0 | 0 | Risk Ratio (M‐H, Random, 95% CI) | 0.0 [0.0, 0.0] |
| 3.9 Nephrology | 0 | 0 | Risk Ratio (M‐H, Random, 95% CI) | 0.0 [0.0, 0.0] |
| 3.10 Gastroenterologic surgery | 27 | 2066 | Risk Ratio (M‐H, Random, 95% CI) | 0.91 [0.72, 1.16] |
| 3.11 Trauma surgery | 2 | 45 | Risk Ratio (M‐H, Random, 95% CI) | 1.22 [0.66, 2.25] |
| 3.12 Ortopaedics | 1 | 80 | Risk Ratio (M‐H, Random, 95% CI) | 0.0 [0.0, 0.0] |
| 3.13 Plastic, reconstructive, and aesthetic surgery | 0 | 0 | Risk Ratio (M‐H, Random, 95% CI) | 0.0 [0.0, 0.0] |
| 3.14 Vascular surgery | 2 | 35 | Risk Ratio (M‐H, Random, 95% CI) | 0.5 [0.05, 4.67] |
| 3.15 Transplant surgery | 2 | 47 | Risk Ratio (M‐H, Random, 95% CI) | 0.56 [0.22, 1.42] |
| 3.16 Urology | 0 | 0 | Risk Ratio (M‐H, Random, 95% CI) | 0.0 [0.0, 0.0] |
| 3.17 Thoracic surgery | 1 | 44 | Risk Ratio (M‐H, Random, 95% CI) | 1.6 [0.40, 6.32] |
| 3.18 Neurological surgery | 0 | 0 | Risk Ratio (M‐H, Random, 95% CI) | 0.0 [0.0, 0.0] |
| 3.19 Oro‐maxillo‐facial surgery | 0 | 0 | Risk Ratio (M‐H, Random, 95% CI) | 0.0 [0.0, 0.0] |
| 3.20 Anaesthesiology | 0 | 0 | Risk Ratio (M‐H, Random, 95% CI) | 0.0 [0.0, 0.0] |
| 3.21 Emergency medicine | 7 | 5208 | Risk Ratio (M‐H, Random, 95% CI) | 0.97 [0.84, 1.12] |
| 3.22 Psychiatry | 0 | 0 | Risk Ratio (M‐H, Random, 95% CI) | 0.0 [0.0, 0.0] |
| 3.23 Neurology | 0 | 0 | Risk Ratio (M‐H, Random, 95% CI) | 0.0 [0.0, 0.0] |
| 3.24 Oncology | 6 | 375 | Risk Ratio (M‐H, Random, 95% CI) | 1.02 [0.87, 1.20] |
| 3.25 Dermatology | 0 | 0 | Risk Ratio (M‐H, Random, 95% CI) | 0.0 [0.0, 0.0] |
| 3.26 Gynaecology | 0 | 0 | Risk Ratio (M‐H, Random, 95% CI) | 0.0 [0.0, 0.0] |
| 3.27 Mixed | 0 | 0 | Risk Ratio (M‐H, Random, 95% CI) | 0.0 [0.0, 0.0] |
| 4 Serious adverse events ‐ based on adequacy of the amount of calories Show forest plot | 56 | 8263 | Risk Ratio (M‐H, Random, 95% CI) | 0.98 [0.90, 1.07] |
| 4.1 Clearly adequate in intervention and clearly inadequate in control | 9 | 5736 | Risk Ratio (M‐H, Random, 95% CI) | 0.98 [0.88, 1.10] |
| 4.2 Inadequate in the experimental or adequate in the control | 4 | 165 | Risk Ratio (M‐H, Random, 95% CI) | 1.17 [0.80, 1.72] |
| 4.3 Experimental group is overfed | 5 | 583 | Risk Ratio (M‐H, Random, 95% CI) | 0.99 [0.74, 1.32] |
| 4.4 Unclear intake in control or experimental | 38 | 1779 | Risk Ratio (M‐H, Random, 95% CI) | 0.90 [0.73, 1.11] |
| 5 Serious adverse events ‐ different screening tools Show forest plot | 56 | 8263 | Risk Ratio (M‐H, Random, 95% CI) | 0.98 [0.90, 1.07] |
| 5.1 NRS 2002 | 1 | 4640 | Risk Ratio (M‐H, Random, 95% CI) | 1.00 [0.85, 1.18] |
| 5.2 MUST | 0 | 0 | Risk Ratio (M‐H, Random, 95% CI) | 0.0 [0.0, 0.0] |
| 5.3 MNA | 0 | 0 | Risk Ratio (M‐H, Random, 95% CI) | 0.0 [0.0, 0.0] |
| 5.4 SGA | 1 | 323 | Risk Ratio (M‐H, Random, 95% CI) | 0.72 [0.28, 1.83] |
| 5.5 Other means | 54 | 3300 | Risk Ratio (M‐H, Random, 95% CI) | 0.97 [0.88, 1.08] |
| 6 Serious adverse events ‐ participants characterised as 'at nutritional risk' due to one of the following conditions Show forest plot | 56 | 8263 | Risk Ratio (M‐H, Random, 95% CI) | 0.98 [0.90, 1.07] |
| 6.1 Major surgery | 34 | 2447 | Risk Ratio (M‐H, Random, 95% CI) | 0.90 [0.75, 1.09] |
| 6.2 Stroke | 0 | 0 | Risk Ratio (M‐H, Random, 95% CI) | 0.0 [0.0, 0.0] |
| 6.3 ICU participants including trauma | 7 | 5209 | Risk Ratio (M‐H, Random, 95% CI) | 0.99 [0.86, 1.14] |
| 6.4 Frail elderly participants with less severe conditions known to increase protein requirements | 2 | 114 | Risk Ratio (M‐H, Random, 95% CI) | 0.56 [0.06, 5.63] |
| 6.5 Participants do not fall into one of the categories above | 13 | 493 | Risk Ratio (M‐H, Random, 95% CI) | 1.02 [0.88, 1.18] |
| 7 Serious adverse events ‐ participants characterised as 'at nutritional risk' due to one of the following criteria Show forest plot | 56 | 8263 | Risk Ratio (M‐H, Random, 95% CI) | 0.98 [0.90, 1.07] |
| 7.1 BMI less than 20.5 kg/m2 | 0 | 0 | Risk Ratio (M‐H, Random, 95% CI) | 0.0 [0.0, 0.0] |
| 7.2 Weight loss of at least 5% during the last three months | 0 | 0 | Risk Ratio (M‐H, Random, 95% CI) | 0.0 [0.0, 0.0] |
| 7.3 Weight loss of at least 10% during the last six months | 2 | 92 | Risk Ratio (M‐H, Random, 95% CI) | 0.33 [0.01, 7.78] |
| 7.4 Insufficient food intake during the last week (50% of requirements or less) | 0 | 0 | Risk Ratio (M‐H, Random, 95% CI) | 0.0 [0.0, 0.0] |
| 7.5 Participants characterised as 'at nutritional risk' by other means | 54 | 8171 | Risk Ratio (M‐H, Random, 95% CI) | 0.98 [0.90, 1.07] |
| 8 Serious adverse events ‐ participants characterised as 'at nutritional risk' due to biomarkers or anthropometrics Show forest plot | 56 | 8263 | Risk Ratio (M‐H, Random, 95% CI) | 0.98 [0.90, 1.07] |
| 8.1 Biomarkers | 6 | 184 | Risk Ratio (M‐H, Random, 95% CI) | 0.45 [0.13, 1.57] |
| 8.2 Anthropometric measures | 3 | 137 | Risk Ratio (M‐H, Random, 95% CI) | 0.74 [0.29, 1.89] |
| 8.3 Both | 3 | 75 | Risk Ratio (M‐H, Random, 95% CI) | 0.66 [0.14, 3.07] |
| 8.4 Characterised by other means | 44 | 7867 | Risk Ratio (M‐H, Random, 95% CI) | 0.99 [0.90, 1.08] |
| 9 Serious adverse events ‐ randomisation year Show forest plot | 56 | 8263 | Risk Ratio (M‐H, Random, 95% CI) | 0.98 [0.90, 1.07] |
| 9.1 Before 1960 | 0 | 0 | Risk Ratio (M‐H, Random, 95% CI) | 0.0 [0.0, 0.0] |
| 9.2 1960 to 1979 | 4 | 154 | Risk Ratio (M‐H, Random, 95% CI) | 1.38 [0.67, 2.83] |
| 9.3 1980 to 1999 | 44 | 2442 | Risk Ratio (M‐H, Random, 95% CI) | 0.98 [0.88, 1.10] |
| 9.4 After 1999 | 8 | 5667 | Risk Ratio (M‐H, Random, 95% CI) | 0.96 [0.83, 1.12] |
| 10 Serious adverse events ‐ trials where the intervention lasts fewer than three days compared with trials where the intervention lasts three days or more Show forest plot | 56 | 8263 | Risk Ratio (M‐H, Random, 95% CI) | 0.98 [0.90, 1.07] |
| 10.1 Three days or more | 54 | 8156 | Risk Ratio (M‐H, Random, 95% CI) | 0.98 [0.89, 1.07] |
| 10.2 Less than three days | 1 | 80 | Risk Ratio (M‐H, Random, 95% CI) | 1.2 [0.59, 2.45] |
| 10.3 Unknown | 1 | 27 | Risk Ratio (M‐H, Random, 95% CI) | 0.0 [0.0, 0.0] |
| 11 Serious adverse events ‐ 'best‐worst case' scenario Show forest plot | 56 | 8452 | Risk Ratio (M‐H, Random, 95% CI) | 0.80 [0.68, 0.94] |
| 12 Serious adverse events ‐ 'worst‐best case' scenario Show forest plot | 56 | 8452 | Risk Ratio (M‐H, Random, 95% CI) | 1.12 [0.96, 1.30] |
| 13 Serious adverse events co‐interventions Show forest plot | 56 | 8263 | Risk Ratio (M‐H, Fixed, 95% CI) | 0.94 [0.85, 1.04] |
| 13.1 Received nutrition support as co‐intervention | 6 | 5164 | Risk Ratio (M‐H, Fixed, 95% CI) | 0.97 [0.85, 1.12] |
| 13.2 did not receive nutrition support as co‐intervention | 49 | 3019 | Risk Ratio (M‐H, Fixed, 95% CI) | 0.90 [0.77, 1.04] |
| 13.3 delayed versus early nutrition support | 1 | 80 | Risk Ratio (M‐H, Fixed, 95% CI) | 1.2 [0.59, 2.45] |
| Outcome or subgroup title | No. of studies | No. of participants | Statistical method | Effect size |
| 1 Morbidity ‐ overall Show forest plot | 1 | 124 | Risk Ratio (M‐H, Random, 95% CI) | 0.63 [0.42, 0.94] |
| Outcome or subgroup title | No. of studies | No. of participants | Statistical method | Effect size |
| 1 Morbidity ‐ overall Show forest plot | 2 | 245 | Risk Ratio (M‐H, Random, 95% CI) | 0.71 [0.53, 0.95] |
| Outcome or subgroup title | No. of studies | No. of participants | Statistical method | Effect size |
| 1 BMI ‐ overall Show forest plot | 15 | 1008 | Mean Difference (IV, Random, 95% CI) | 0.57 [0.38, 0.77] |
| 2 BMI ‐ bias Show forest plot | 15 | 1008 | Mean Difference (IV, Random, 95% CI) | 0.57 [0.38, 0.77] |
| 2.1 High risk of bias | 15 | 1008 | Mean Difference (IV, Random, 95% CI) | 0.57 [0.38, 0.77] |
| 2.2 Low risk of bias | 0 | 0 | Mean Difference (IV, Random, 95% CI) | 0.0 [0.0, 0.0] |
| 3 BMI ‐ mode of administration Show forest plot | 15 | 1008 | Mean Difference (IV, Random, 95% CI) | 0.57 [0.38, 0.77] |
| 3.1 General nutrition support | 1 | 132 | Mean Difference (IV, Random, 95% CI) | 1.0 [‐0.67, 2.67] |
| 3.2 Fortified nutrition | 1 | 146 | Mean Difference (IV, Random, 95% CI) | 1.10 [‐0.24, 2.44] |
| 3.3 Oral nutrition support | 7 | 363 | Mean Difference (IV, Random, 95% CI) | 0.63 [‐0.09, 1.35] |
| 3.4 Enteral nutrition | 5 | 288 | Mean Difference (IV, Random, 95% CI) | 0.53 [0.32, 0.75] |
| 3.5 Parenteral nutrition | 0 | 0 | Mean Difference (IV, Random, 95% CI) | 0.0 [0.0, 0.0] |
| 3.6 Mixed nutrition support | 1 | 79 | Mean Difference (IV, Random, 95% CI) | 1.12 [‐0.15, 2.39] |
| 4 BMI ‐ by medical delivery Show forest plot | 15 | 1008 | Mean Difference (IV, Random, 95% CI) | 0.57 [0.38, 0.77] |
| 4.1 Cardiology | 0 | 0 | Mean Difference (IV, Random, 95% CI) | 0.0 [0.0, 0.0] |
| 4.2 Medical gastroenterology and hepatology | 2 | 101 | Mean Difference (IV, Random, 95% CI) | 1.77 [‐0.19, 3.72] |
| 4.3 Geriatrics | 3 | 227 | Mean Difference (IV, Random, 95% CI) | 0.86 [‐0.10, 1.82] |
| 4.4 Pulmonary disease | 0 | 0 | Mean Difference (IV, Random, 95% CI) | 0.0 [0.0, 0.0] |
| 4.5 Endocrinology | 0 | 0 | Mean Difference (IV, Random, 95% CI) | 0.0 [0.0, 0.0] |
| 4.6 Infectious diseases | 0 | 0 | Mean Difference (IV, Random, 95% CI) | 0.0 [0.0, 0.0] |
| 4.7 Rheumatology | 0 | 0 | Mean Difference (IV, Random, 95% CI) | 0.0 [0.0, 0.0] |
| 4.8 Haematology | 0 | 0 | Mean Difference (IV, Random, 95% CI) | 0.0 [0.0, 0.0] |
| 4.9 Nephrology | 0 | 0 | Mean Difference (IV, Random, 95% CI) | 0.0 [0.0, 0.0] |
| 4.10 Gastroenterologic surgery | 5 | 279 | Mean Difference (IV, Random, 95% CI) | 0.48 [0.25, 0.70] |
| 4.11 Trauma surgery | 2 | 184 | Mean Difference (IV, Random, 95% CI) | 0.64 [0.10, 1.18] |
| 4.12 Ortopaedics | 0 | 0 | Mean Difference (IV, Random, 95% CI) | 0.0 [0.0, 0.0] |
| 4.13 Plastic, reconstructive, and aesthetic surgery | 1 | 37 | Mean Difference (IV, Random, 95% CI) | 1.30 [0.04, 2.56] |
| 4.14 Vascular surgery | 0 | 0 | Mean Difference (IV, Random, 95% CI) | 0.0 [0.0, 0.0] |
| 4.15 Transplant surgery | 0 | 0 | Mean Difference (IV, Random, 95% CI) | 0.0 [0.0, 0.0] |
| 4.16 Urology | 0 | 0 | Mean Difference (IV, Random, 95% CI) | 0.0 [0.0, 0.0] |
| 4.17 Thoracic surgery | 0 | 0 | Mean Difference (IV, Random, 95% CI) | 0.0 [0.0, 0.0] |
| 4.18 Neurological surgery | 0 | 0 | Mean Difference (IV, Random, 95% CI) | 0.0 [0.0, 0.0] |
| 4.19 Oro‐maxillo‐facial surgery | 0 | 0 | Mean Difference (IV, Random, 95% CI) | 0.0 [0.0, 0.0] |
| 4.20 Anaesthesiology | 0 | 0 | Mean Difference (IV, Random, 95% CI) | 0.0 [0.0, 0.0] |
| 4.21 Emergency medicine | 0 | 0 | Mean Difference (IV, Random, 95% CI) | 0.0 [0.0, 0.0] |
| 4.22 Psychiatry | 0 | 0 | Mean Difference (IV, Random, 95% CI) | 0.0 [0.0, 0.0] |
| 4.23 Neurology | 1 | 48 | Mean Difference (IV, Random, 95% CI) | 1.0 [‐1.11, 3.11] |
| 4.24 Oncology | 0 | 0 | Mean Difference (IV, Random, 95% CI) | 0.0 [0.0, 0.0] |
| 4.25 Dermatology | 0 | 0 | Mean Difference (IV, Random, 95% CI) | 0.0 [0.0, 0.0] |
| 4.26 Gynaecology | 0 | 0 | Mean Difference (IV, Random, 95% CI) | 0.0 [0.0, 0.0] |
| 4.27 Mixed | 1 | 132 | Mean Difference (IV, Random, 95% CI) | 1.0 [‐0.67, 2.67] |
| 5 BMI ‐ based on adequacy of the amount of calories Show forest plot | 15 | 1008 | Mean Difference (IV, Random, 95% CI) | 0.57 [0.38, 0.77] |
| 5.1 Clearly adequate in intervention and clearly inadequate in control | 7 | 544 | Mean Difference (IV, Random, 95% CI) | 0.90 [0.23, 1.58] |
| 5.2 Inadequate in the experimental or adequate in the control | 1 | 37 | Mean Difference (IV, Random, 95% CI) | 1.30 [0.04, 2.56] |
| 5.3 Experimental group is overfed | 1 | 46 | Mean Difference (IV, Random, 95% CI) | 0.0 [0.0, 0.0] |
| 5.4 Unclear intake in control or experimental | 6 | 381 | Mean Difference (IV, Random, 95% CI) | 0.52 [0.31, 0.73] |
| 6 BMI ‐ different screening tools Show forest plot | 15 | 1008 | Mean Difference (IV, Random, 95% CI) | 0.57 [0.38, 0.77] |
| 6.1 NRS 2002 | 2 | 211 | Mean Difference (IV, Random, 95% CI) | 1.08 [0.06, 2.09] |
| 6.2 MUST | 0 | 0 | Mean Difference (IV, Random, 95% CI) | 0.0 [0.0, 0.0] |
| 6.3 MNA | 1 | 35 | Mean Difference (IV, Random, 95% CI) | 0.60 [‐0.78, 1.98] |
| 6.4 SGA | 0 | 0 | Mean Difference (IV, Random, 95% CI) | 0.0 [0.0, 0.0] |
| 6.5 Other means | 12 | 762 | Mean Difference (IV, Random, 95% CI) | 0.55 [0.35, 0.76] |
| 7 BMI ‐ participants characterised as 'at nutritional risk' due to one of the following conditions Show forest plot | 15 | 1008 | Mean Difference (IV, Random, 95% CI) | 0.57 [0.38, 0.77] |
| 7.1 Major surgery | 6 | 316 | Mean Difference (IV, Random, 95% CI) | 0.50 [0.28, 0.73] |
| 7.2 Stroke | 1 | 48 | Mean Difference (IV, Random, 95% CI) | 1.0 [‐1.11, 3.11] |
| 7.3 ICU participants including trauma | 1 | 64 | Mean Difference (IV, Random, 95% CI) | 0.40 [‐1.22, 2.02] |
| 7.4 Frail elderly participants with less severe conditions known to increase protein requirements | 2 | 199 | Mean Difference (IV, Random, 95% CI) | 0.75 [0.22, 1.27] |
| 7.5 Participants do not fall into one of the categories above | 5 | 381 | Mean Difference (IV, Random, 95% CI) | 1.06 [0.26, 1.87] |
| 8 BMI ‐ participants characterised as 'at nutritional risk' due to one of the following criteria Show forest plot | 15 | 1008 | Mean Difference (IV, Random, 95% CI) | 0.57 [0.38, 0.77] |
| 8.1 BMI less than 20.5 kg/m2 | 3 | 229 | Mean Difference (IV, Random, 95% CI) | 1.21 [0.29, 2.12] |
| 8.2 Weight loss of at least 5% during the last three months | 0 | 0 | Mean Difference (IV, Random, 95% CI) | 0.0 [0.0, 0.0] |
| 8.3 Weight loss of at least 10% during the last six months | 0 | 0 | Mean Difference (IV, Random, 95% CI) | 0.0 [0.0, 0.0] |
| 8.4 Insufficient food intake during the last week (50% of requirements or less) | 0 | 0 | Mean Difference (IV, Random, 95% CI) | 0.0 [0.0, 0.0] |
| 8.5 Participants characterised as 'at nutritional risk' by other means | 12 | 779 | Mean Difference (IV, Random, 95% CI) | 0.54 [0.34, 0.75] |
| 9 BMI ‐ participants characterised as 'at nutritional risk' due to biomarkers of anthropometrics Show forest plot | 15 | 1008 | Mean Difference (IV, Random, 95% CI) | 0.57 [0.38, 0.77] |
| 9.1 Biomarkers | 0 | 0 | Mean Difference (IV, Random, 95% CI) | 0.0 [0.0, 0.0] |
| 9.2 Anthropometric measures | 3 | 229 | Mean Difference (IV, Random, 95% CI) | 1.21 [0.29, 2.12] |
| 9.3 Characterised by other means | 12 | 779 | Mean Difference (IV, Random, 95% CI) | 0.54 [0.34, 0.75] |
| 10 BMI ‐ randomisation year Show forest plot | 15 | 1008 | Mean Difference (IV, Random, 95% CI) | 0.57 [0.38, 0.77] |
| 10.1 Before 1960 | 0 | 0 | Mean Difference (IV, Random, 95% CI) | 0.0 [0.0, 0.0] |
| 10.2 1960 to 1979 | 0 | 0 | Mean Difference (IV, Random, 95% CI) | 0.0 [0.0, 0.0] |
| 10.3 1980 to 1999 | 4 | 182 | Mean Difference (IV, Random, 95% CI) | 1.03 [‐0.91, 2.97] |
| 10.4 After 1999 | 11 | 826 | Mean Difference (IV, Random, 95% CI) | 0.56 [0.36, 0.76] |
| 11 BMI ‐ trials where the intervention lasts fewer than three days compared with trials where the intervention lasts three days or more Show forest plot | 15 | 1008 | Mean Difference (IV, Random, 95% CI) | 0.57 [0.38, 0.77] |
| 11.1 Three days or more | 15 | 1008 | Mean Difference (IV, Random, 95% CI) | 0.57 [0.38, 0.77] |
| 11.2 Less than three days | 0 | 0 | Mean Difference (IV, Random, 95% CI) | 0.0 [0.0, 0.0] |
| Outcome or subgroup title | No. of studies | No. of participants | Statistical method | Effect size |
| 1 BMI ‐ overall Show forest plot | 20 | 1528 | Mean Difference (IV, Random, 95% CI) | 0.40 [‐0.02, 0.83] |
| 2 BMI ‐ bias Show forest plot | 20 | 1528 | Mean Difference (IV, Random, 95% CI) | 0.44 [0.02, 0.87] |
| 2.1 High risk of bias | 20 | 1528 | Mean Difference (IV, Random, 95% CI) | 0.44 [0.02, 0.87] |
| 2.2 Low risk of bias | 0 | 0 | Mean Difference (IV, Random, 95% CI) | 0.0 [0.0, 0.0] |
| 3 BMI ‐ mode of delivery Show forest plot | 20 | 1528 | Mean Difference (IV, Random, 95% CI) | 0.44 [0.02, 0.87] |
| 3.1 General nutrition support | 2 | 196 | Mean Difference (IV, Random, 95% CI) | 0.92 [0.26, 1.57] |
| 3.2 Fortified nutrition | 1 | 146 | Mean Difference (IV, Random, 95% CI) | 1.10 [‐0.24, 2.44] |
| 3.3 Oral nutrition support | 8 | 588 | Mean Difference (IV, Random, 95% CI) | 0.43 [‐0.16, 1.02] |
| 3.4 Enteral nutrition | 8 | 519 | Mean Difference (IV, Random, 95% CI) | 0.17 [‐0.60, 0.93] |
| 3.5 Parenteral nutrition | 0 | 0 | Mean Difference (IV, Random, 95% CI) | 0.0 [0.0, 0.0] |
| 3.6 Mixed nutrition support | 1 | 79 | Mean Difference (IV, Random, 95% CI) | 1.12 [‐0.15, 2.39] |
| 4 BMI ‐ by medical speciality Show forest plot | 20 | 1528 | Mean Difference (IV, Random, 95% CI) | 0.44 [0.02, 0.87] |
| 4.1 Cardiology | 0 | 0 | Mean Difference (IV, Random, 95% CI) | 0.0 [0.0, 0.0] |
| 4.2 Medical gastroenterology and hepatology | 3 | 201 | Mean Difference (IV, Random, 95% CI) | 1.02 [0.13, 1.90] |
| 4.3 Geriatrics | 4 | 452 | Mean Difference (IV, Random, 95% CI) | 0.47 [‐0.24, 1.17] |
| 4.4 Pulmonary disease | 0 | 0 | Mean Difference (IV, Random, 95% CI) | 0.0 [0.0, 0.0] |
| 4.5 Endocrinology | 0 | 0 | Mean Difference (IV, Random, 95% CI) | 0.0 [0.0, 0.0] |
| 4.6 Infectious diseases | 0 | 0 | Mean Difference (IV, Random, 95% CI) | 0.0 [0.0, 0.0] |
| 4.7 Rheumatology | 0 | 0 | Mean Difference (IV, Random, 95% CI) | 0.0 [0.0, 0.0] |
| 4.8 Haematology | 0 | 0 | Mean Difference (IV, Random, 95% CI) | 0.0 [0.0, 0.0] |
| 4.9 Nephrology | 0 | 0 | Mean Difference (IV, Random, 95% CI) | 0.0 [0.0, 0.0] |
| 4.10 Gastroenterologic surgery | 6 | 346 | Mean Difference (IV, Random, 95% CI) | ‐0.52 [‐2.16, 1.11] |
| 4.11 Trauma surgery | 2 | 184 | Mean Difference (IV, Random, 95% CI) | 0.64 [0.10, 1.18] |
| 4.12 Ortopaedics | 0 | 0 | Mean Difference (IV, Random, 95% CI) | 0.0 [0.0, 0.0] |
| 4.13 Plastic, reconstructive, and aesthetic surgery | 1 | 37 | Mean Difference (IV, Random, 95% CI) | 1.30 [0.04, 2.56] |
| 4.14 Vascular surgery | 0 | 0 | Mean Difference (IV, Random, 95% CI) | 0.0 [0.0, 0.0] |
| 4.15 Transplant surgery | 0 | 0 | Mean Difference (IV, Random, 95% CI) | 0.0 [0.0, 0.0] |
| 4.16 Urology | 0 | 0 | Mean Difference (IV, Random, 95% CI) | 0.0 [0.0, 0.0] |
| 4.17 Thoracic surgery | 0 | 0 | Mean Difference (IV, Random, 95% CI) | 0.0 [0.0, 0.0] |
| 4.18 Neurological surgery | 0 | 0 | Mean Difference (IV, Random, 95% CI) | 0.0 [0.0, 0.0] |
| 4.19 Oro‐maxillo‐facial surgery | 0 | 0 | Mean Difference (IV, Random, 95% CI) | 0.0 [0.0, 0.0] |
| 4.20 Anaesthesiology | 0 | 0 | Mean Difference (IV, Random, 95% CI) | 0.0 [0.0, 0.0] |
| 4.21 Emergency medicine | 0 | 0 | Mean Difference (IV, Random, 95% CI) | 0.0 [0.0, 0.0] |
| 4.22 Psychiatry | 0 | 0 | Mean Difference (IV, Random, 95% CI) | 0.0 [0.0, 0.0] |
| 4.23 Neurology | 2 | 112 | Mean Difference (IV, Random, 95% CI) | 0.91 [0.24, 1.58] |
| 4.24 Oncology | 1 | 64 | Mean Difference (IV, Random, 95% CI) | 0.40 [‐1.40, 2.20] |
| 4.25 Dermatology | 0 | 0 | Mean Difference (IV, Random, 95% CI) | 0.0 [0.0, 0.0] |
| 4.26 Gynaecology | 0 | 0 | Mean Difference (IV, Random, 95% CI) | 0.0 [0.0, 0.0] |
| 4.27 Mixed | 1 | 132 | Mean Difference (IV, Random, 95% CI) | 1.0 [‐0.67, 2.67] |
| 5 BMI ‐ based on adequacy of the amount of calories Show forest plot | 20 | 1528 | Mean Difference (IV, Random, 95% CI) | 0.40 [‐0.02, 0.83] |
| 5.1 Clearly adequate in intervention and clearly inadequate in control | 9 | 686 | Mean Difference (IV, Random, 95% CI) | 0.54 [0.33, 0.74] |
| 5.2 Inadequate in the experimental or adequate in the control | 2 | 101 | Mean Difference (IV, Random, 95% CI) | 1.00 [0.38, 1.61] |
| 5.3 Experimental group is overfed | 1 | 46 | Mean Difference (IV, Random, 95% CI) | 0.0 [0.0, 0.0] |
| 5.4 Unclear intake in control or experimental | 8 | 695 | Mean Difference (IV, Random, 95% CI) | ‐0.04 [‐1.11, 1.03] |
| 6 BMI ‐ different screening tools Show forest plot | 20 | 1528 | Mean Difference (IV, Random, 95% CI) | 0.44 [0.02, 0.87] |
| 6.1 NRS 2002 | 2 | 211 | Mean Difference (IV, Random, 95% CI) | 1.08 [0.06, 2.09] |
| 6.2 MUST | 1 | 64 | Mean Difference (IV, Random, 95% CI) | 0.90 [0.19, 1.61] |
| 6.3 MNA | 1 | 35 | Mean Difference (IV, Random, 95% CI) | 0.60 [‐0.78, 1.98] |
| 6.4 SGA | 0 | 0 | Mean Difference (IV, Random, 95% CI) | 0.0 [0.0, 0.0] |
| 6.5 Other means | 16 | 1218 | Mean Difference (IV, Random, 95% CI) | 0.30 [‐0.22, 0.83] |
| 7 BMI ‐ participants characterised as 'at nutritional risk' due to one of the following conditions Show forest plot | 20 | 1528 | Mean Difference (IV, Random, 95% CI) | 0.44 [0.02, 0.87] |
| 7.1 Major surgery | 7 | 383 | Mean Difference (IV, Random, 95% CI) | ‐0.23 [‐1.55, 1.09] |
| 7.2 Stroke | 2 | 112 | Mean Difference (IV, Random, 95% CI) | 0.91 [0.24, 1.58] |
| 7.3 ICU participants including trauma | 1 | 64 | Mean Difference (IV, Random, 95% CI) | 0.40 [‐1.22, 2.02] |
| 7.4 Frail elderly participants with less severe conditions known to increase protein requirements | 2 | 199 | Mean Difference (IV, Random, 95% CI) | 0.75 [0.22, 1.27] |
| 7.5 Participants do not fall into one of the categories above | 8 | 770 | Mean Difference (IV, Random, 95% CI) | 0.65 [0.22, 1.09] |
| 8 BMI ‐ participants characterised as 'at nutritional risk' due to one of the following criteria Show forest plot | 20 | 1528 | Mean Difference (IV, Random, 95% CI) | 0.44 [0.02, 0.87] |
| 8.1 BMI less than 20.5 kg/m2 | 3 | 229 | Mean Difference (IV, Random, 95% CI) | 1.21 [0.29, 2.12] |
| 8.2 Weight loss of at least 5% during the last three months | 0 | 0 | Mean Difference (IV, Random, 95% CI) | 0.0 [0.0, 0.0] |
| 8.3 Weight loss of at least 10% during the last six months | 0 | 0 | Mean Difference (IV, Random, 95% CI) | 0.0 [0.0, 0.0] |
| 8.4 Insufficient food intake during the last week (50% of requirements or less) | 0 | 0 | Mean Difference (IV, Random, 95% CI) | 0.0 [0.0, 0.0] |
| 8.5 Participants characterised as 'at nutritional risk' by other means | 17 | 1299 | Mean Difference (IV, Random, 95% CI) | 0.35 [‐0.11, 0.81] |
| 9 BMI ‐ participants characterised as 'at nutritional risk' due to biomarkers or anthropometrics Show forest plot | 20 | 1528 | Mean Difference (IV, Random, 95% CI) | 0.44 [0.02, 0.87] |
| 9.1 Biomarkers | 0 | 0 | Mean Difference (IV, Random, 95% CI) | 0.0 [0.0, 0.0] |
| 9.2 Anthropometric measures | 3 | 229 | Mean Difference (IV, Random, 95% CI) | 1.21 [0.29, 2.12] |
| 9.3 Characterised by other means | 17 | 1299 | Mean Difference (IV, Random, 95% CI) | 0.35 [‐0.11, 0.81] |
| 10 BMI ‐ randomisation year Show forest plot | 20 | 1528 | Mean Difference (IV, Random, 95% CI) | 0.44 [0.02, 0.87] |
| 10.1 Before 1960 | 0 | 0 | Mean Difference (IV, Random, 95% CI) | 0.0 [0.0, 0.0] |
| 10.2 1960 to 1979 | 0 | 0 | Mean Difference (IV, Random, 95% CI) | 0.0 [0.0, 0.0] |
| 10.3 1980 to 1999 | 5 | 249 | Mean Difference (IV, Random, 95% CI) | 0.02 [‐2.62, 2.67] |
| 10.4 After 1999 | 15 | 1279 | Mean Difference (IV, Random, 95% CI) | 0.57 [0.39, 0.75] |
| 11 BMI ‐ trials where the intervention lasts fewer than three days compared with trials where the intervention lasts three days or more Show forest plot | 20 | 1528 | Mean Difference (IV, Random, 95% CI) | 0.44 [0.02, 0.87] |
| 11.1 Three days or more | 20 | 1528 | Mean Difference (IV, Random, 95% CI) | 0.44 [0.02, 0.87] |
| 11.2 Less than three days | 0 | 0 | Mean Difference (IV, Random, 95% CI) | 0.0 [0.0, 0.0] |
| Outcome or subgroup title | No. of studies | No. of participants | Statistical method | Effect size |
| 1 Weight ‐ overall Show forest plot | 81 | 5445 | Mean Difference (IV, Random, 95% CI) | 1.32 [0.65, 2.00] |
| 2 Weight ‐ bias Show forest plot | 81 | 5445 | Mean Difference (IV, Random, 95% CI) | 1.32 [0.65, 2.00] |
| 2.1 High risk of bias | 81 | 5445 | Mean Difference (IV, Random, 95% CI) | 1.32 [0.65, 2.00] |
| 2.2 Low risk of bias | 0 | 0 | Mean Difference (IV, Random, 95% CI) | 0.0 [0.0, 0.0] |
| 3 Weight ‐ mode of delivery Show forest plot | 81 | 5445 | Mean Difference (IV, Random, 95% CI) | 1.32 [0.65, 2.00] |
| 3.1 General nutrition support | 4 | 962 | Mean Difference (IV, Random, 95% CI) | ‐0.00 [‐0.17, 0.16] |
| 3.2 Fortified nutrition | 2 | 230 | Mean Difference (IV, Random, 95% CI) | 1.45 [‐0.92, 3.83] |
| 3.3 Oral nutrition support | 31 | 1924 | Mean Difference (IV, Random, 95% CI) | 0.33 [‐0.21, 0.87] |
| 3.4 Enteral nutrition | 26 | 1616 | Mean Difference (IV, Random, 95% CI) | 2.62 [1.23, 4.01] |
| 3.5 Parenteral nutrition | 17 | 667 | Mean Difference (IV, Random, 95% CI) | 1.48 [‐0.20, 3.15] |
| 3.6 Mixed nutrition support | 1 | 46 | Mean Difference (IV, Random, 95% CI) | ‐3.90 [‐4.45, ‐3.35] |
| 4 Weight ‐ by medical speciality Show forest plot | 81 | 5445 | Mean Difference (IV, Random, 95% CI) | 1.32 [0.65, 2.00] |
| 4.1 Cardiology | 0 | 0 | Mean Difference (IV, Random, 95% CI) | 0.0 [0.0, 0.0] |
| 4.2 Medical gastroenterology and hepatology | 7 | 345 | Mean Difference (IV, Random, 95% CI) | 0.88 [‐0.03, 1.79] |
| 4.3 Geriatrics | 10 | 1422 | Mean Difference (IV, Random, 95% CI) | 0.62 [‐0.30, 1.54] |
| 4.4 Pulmonary disease | 4 | 91 | Mean Difference (IV, Random, 95% CI) | 0.95 [‐0.43, 2.33] |
| 4.5 Endocrinology | 0 | 0 | Mean Difference (IV, Random, 95% CI) | 0.0 [0.0, 0.0] |
| 4.6 Infectious diseases | 0 | 0 | Mean Difference (IV, Random, 95% CI) | 0.0 [0.0, 0.0] |
| 4.7 Rheumatology | 0 | 0 | Mean Difference (IV, Random, 95% CI) | 0.0 [0.0, 0.0] |
| 4.8 Haematology | 0 | 0 | Mean Difference (IV, Random, 95% CI) | 0.0 [0.0, 0.0] |
| 4.9 Nephrology | 0 | 0 | Mean Difference (IV, Random, 95% CI) | 0.0 [0.0, 0.0] |
| 4.10 Gastroenterologic surgery | 35 | 1423 | Mean Difference (IV, Random, 95% CI) | 1.26 [‐0.12, 2.63] |
| 4.11 Trauma surgery | 0 | 0 | Mean Difference (IV, Random, 95% CI) | 0.0 [0.0, 0.0] |
| 4.12 Ortopaedics | 7 | 395 | Mean Difference (IV, Random, 95% CI) | 2.79 [1.36, 4.23] |
| 4.13 Plastic, reconstructive, and aesthetic surgery | 0 | 0 | Mean Difference (IV, Random, 95% CI) | 0.0 [0.0, 0.0] |
| 4.14 Vascular surgery | 0 | 0 | Mean Difference (IV, Random, 95% CI) | 0.0 [0.0, 0.0] |
| 4.15 Transplant surgery | 1 | 29 | Mean Difference (IV, Random, 95% CI) | ‐4.60 [‐15.21, 6.01] |
| 4.16 Urology | 0 | 0 | Mean Difference (IV, Random, 95% CI) | 0.0 [0.0, 0.0] |
| 4.17 Thoracic surgery | 2 | 548 | Mean Difference (IV, Random, 95% CI) | 0.06 [‐2.39, 2.51] |
| 4.18 Neurological surgery | 1 | 48 | Mean Difference (IV, Random, 95% CI) | 10.53 [6.72, 14.34] |
| 4.19 Oro‐maxillo‐facial surgery | 1 | 32 | Mean Difference (IV, Random, 95% CI) | 0.6 [‐1.10, 2.30] |
| 4.20 Anaesthesiology | 0 | 0 | Mean Difference (IV, Random, 95% CI) | 0.0 [0.0, 0.0] |
| 4.21 Emergency medicine | 0 | 0 | Mean Difference (IV, Random, 95% CI) | 0.0 [0.0, 0.0] |
| 4.22 Psychiatry | 0 | 0 | Mean Difference (IV, Random, 95% CI) | 0.0 [0.0, 0.0] |
| 4.23 Neurology | 5 | 247 | Mean Difference (IV, Random, 95% CI) | 0.74 [‐2.15, 3.63] |
| 4.24 Oncology | 1 | 23 | Mean Difference (IV, Random, 95% CI) | ‐1.0 [‐7.41, 5.41] |
| 4.25 Dermatology | 0 | 0 | Mean Difference (IV, Random, 95% CI) | 0.0 [0.0, 0.0] |
| 4.26 Gynaecology | 0 | 0 | Mean Difference (IV, Random, 95% CI) | 0.0 [0.0, 0.0] |
| 4.27 Mixed | 7 | 842 | Mean Difference (IV, Random, 95% CI) | 0.21 [‐0.58, 1.00] |
| 5 Weight ‐ based on adequacy of the amount of calories Show forest plot | 81 | 5445 | Mean Difference (IV, Random, 95% CI) | 1.32 [0.65, 2.00] |
| 5.1 Clearly adequate in intervention and clearly inadequate in control | 20 | 1287 | Mean Difference (IV, Random, 95% CI) | 1.46 [‐0.19, 3.12] |
| 5.2 Inadequate in the experimental or adequate in the control | 19 | 1626 | Mean Difference (IV, Random, 95% CI) | 0.79 [0.06, 1.51] |
| 5.3 Experimental group is overfed | 5 | 151 | Mean Difference (IV, Random, 95% CI) | 0.64 [‐0.86, 2.13] |
| 5.4 Unclear intake in control or experimental | 37 | 2381 | Mean Difference (IV, Random, 95% CI) | 1.61 [0.50, 2.72] |
| 6 Weight ‐ different screening tools Show forest plot | 81 | 5445 | Mean Difference (IV, Random, 95% CI) | 1.32 [0.65, 2.00] |
| 6.1 NRS 2002 | 4 | 353 | Mean Difference (IV, Random, 95% CI) | 1.12 [‐0.29, 2.53] |
| 6.2 MUST | 0 | 0 | Mean Difference (IV, Random, 95% CI) | 0.0 [0.0, 0.0] |
| 6.3 MNA | 2 | 104 | Mean Difference (IV, Random, 95% CI) | 1.45 [‐0.02, 2.91] |
| 6.4 SGA | 2 | 445 | Mean Difference (IV, Random, 95% CI) | ‐0.65 [‐3.30, 2.00] |
| 6.5 Other means | 73 | 4543 | Mean Difference (IV, Random, 95% CI) | 1.41 [0.68, 2.15] |
| 7 Weight ‐ participants characterised as 'at nutritional risk' due to one of the following conditions Show forest plot | 81 | 5445 | Mean Difference (IV, Random, 95% CI) | 1.32 [0.65, 2.00] |
| 7.1 Major surgery | 40 | 2213 | Mean Difference (IV, Random, 95% CI) | 1.24 [0.11, 2.37] |
| 7.2 Stroke | 3 | 181 | Mean Difference (IV, Random, 95% CI) | 0.39 [‐2.75, 3.54] |
| 7.3 ICU participants including trauma | 0 | 0 | Mean Difference (IV, Random, 95% CI) | 0.0 [0.0, 0.0] |
| 7.4 Frail elderly participants with less severe conditions known to increase protein requirements | 8 | 1256 | Mean Difference (IV, Random, 95% CI) | 1.83 [0.71, 2.96] |
| 7.5 Participants do not fall into one of the categories above | 30 | 1795 | Mean Difference (IV, Random, 95% CI) | 0.93 [0.38, 1.48] |
| 8 Weight ‐ participants characterised as 'at nutritional risk' due to one of the following criteria Show forest plot | 81 | 5445 | Mean Difference (IV, Random, 95% CI) | 1.32 [0.65, 2.00] |
| 8.1 BMI less than 20.5 kg/m2 | 5 | 309 | Mean Difference (IV, Random, 95% CI) | 3.97 [1.06, 6.89] |
| 8.2 Weight loss of at least 5% during the last three months | 0 | 0 | Mean Difference (IV, Random, 95% CI) | 0.0 [0.0, 0.0] |
| 8.3 Weight loss of at least 10% during the last six months | 2 | 79 | Mean Difference (IV, Random, 95% CI) | 0.30 [‐0.36, 0.96] |
| 8.4 Insufficient food intake during the last week (50% of requirements or less) | 0 | 0 | Mean Difference (IV, Random, 95% CI) | 0.0 [0.0, 0.0] |
| 8.5 Participants characterised as 'at nutritional risk' by other means | 74 | 5057 | Mean Difference (IV, Random, 95% CI) | 1.30 [0.59, 2.00] |
| 9 Weight ‐ participants characterised as 'at nutritional risk' due to biomarkers or anthropometrics Show forest plot | 81 | 5445 | Mean Difference (IV, Random, 95% CI) | 1.32 [0.65, 2.00] |
| 9.1 Biomarkers | 9 | 750 | Mean Difference (IV, Random, 95% CI) | 4.37 [2.16, 6.58] |
| 9.2 Anthropometric measures | 15 | 996 | Mean Difference (IV, Random, 95% CI) | 1.04 [‐0.15, 2.23] |
| 9.3 Characterised by other means | 54 | 3639 | Mean Difference (IV, Random, 95% CI) | 0.66 [0.13, 1.20] |
| 9.4 Mixed | 3 | 60 | Mean Difference (IV, Random, 95% CI) | ‐0.37 [‐1.95, 1.22] |
| 10 Weight ‐ randomisation year Show forest plot | 81 | 5445 | Mean Difference (IV, Random, 95% CI) | 1.32 [0.65, 2.00] |
| 10.1 Before 1960 | 0 | 0 | Mean Difference (IV, Random, 95% CI) | 0.0 [0.0, 0.0] |
| 10.2 1960 to 1979 | 1 | 21 | Mean Difference (IV, Random, 95% CI) | 3.85 [1.69, 6.01] |
| 10.3 1980 to 1999 | 48 | 2365 | Mean Difference (IV, Random, 95% CI) | 1.23 [0.24, 2.22] |
| 10.4 After 1999 | 32 | 3059 | Mean Difference (IV, Random, 95% CI) | 1.07 [0.35, 1.79] |
| 11 Weight ‐ trials where the intervention lasts fewer than three days compared with trials where the intervention lasts three days or more Show forest plot | 81 | 5445 | Mean Difference (IV, Random, 95% CI) | 1.32 [0.65, 2.00] |
| 11.1 Three days or more | 76 | 5287 | Mean Difference (IV, Random, 95% CI) | 1.40 [0.70, 2.10] |
| 11.2 Less than three days | 5 | 158 | Mean Difference (IV, Random, 95% CI) | 0.15 [‐1.62, 1.92] |
| 12 Weight ‐ Missing SDs Show forest plot | 81 | 5445 | Mean Difference (IV, Random, 95% CI) | 1.40 [0.76, 2.03] |
| 12.1 missing SDs imputed from all trials | 81 | 5445 | Mean Difference (IV, Random, 95% CI) | 1.40 [0.76, 2.03] |
| Outcome or subgroup title | No. of studies | No. of participants | Statistical method | Effect size |
| 1 Weight ‐ overall Show forest plot | 94 | 6916 | Mean Difference (IV, Random, 95% CI) | 1.13 [0.50, 1.75] |
| 2 Weight ‐ bias Show forest plot | 94 | 6916 | Mean Difference (IV, Random, 95% CI) | 1.13 [0.50, 1.75] |
| 2.1 High risk of bias | 94 | 6916 | Mean Difference (IV, Random, 95% CI) | 1.13 [0.50, 1.75] |
| 2.2 Low risk of bias | 0 | 0 | Mean Difference (IV, Random, 95% CI) | 0.0 [0.0, 0.0] |
| 3 Weight ‐ mode of delivery Show forest plot | 94 | 6916 | Mean Difference (IV, Random, 95% CI) | 1.13 [0.50, 1.75] |
| 3.1 General nutrition support | 6 | 1328 | Mean Difference (IV, Random, 95% CI) | 0.41 [‐0.58, 1.41] |
| 3.2 Fortified nutrition | 2 | 230 | Mean Difference (IV, Random, 95% CI) | 1.45 [‐0.92, 3.83] |
| 3.3 Oral nutrition support | 32 | 2149 | Mean Difference (IV, Random, 95% CI) | 0.29 [‐0.22, 0.80] |
| 3.4 Enteral nutrition | 31 | 2081 | Mean Difference (IV, Random, 95% CI) | 1.98 [0.74, 3.22] |
| 3.5 Parenteral nutrition | 22 | 1082 | Mean Difference (IV, Random, 95% CI) | 1.25 [‐0.25, 2.75] |
| 3.6 Mixed | 1 | 46 | Mean Difference (IV, Random, 95% CI) | ‐3.90 [‐4.45, ‐3.35] |
| 4 Weight ‐ by medical speciality Show forest plot | 94 | 6916 | Mean Difference (IV, Random, 95% CI) | 1.13 [0.50, 1.75] |
| 4.1 Cardiology | 0 | 0 | Mean Difference (IV, Random, 95% CI) | 0.0 [0.0, 0.0] |
| 4.2 Medical gastroenterology and hepatology | 8 | 388 | Mean Difference (IV, Random, 95% CI) | 0.13 [‐1.05, 1.30] |
| 4.3 Geriatrics | 11 | 1647 | Mean Difference (IV, Random, 95% CI) | 0.61 [‐0.27, 1.50] |
| 4.4 Pulmonary disease | 4 | 91 | Mean Difference (IV, Random, 95% CI) | 0.95 [‐0.43, 2.33] |
| 4.5 Endocrinology | 0 | 0 | Mean Difference (IV, Random, 95% CI) | 0.0 [0.0, 0.0] |
| 4.6 Infectious diseases | 0 | 0 | Mean Difference (IV, Random, 95% CI) | 0.0 [0.0, 0.0] |
| 4.7 Rheumatology | 0 | 0 | Mean Difference (IV, Random, 95% CI) | 0.0 [0.0, 0.0] |
| 4.8 Haematology | 0 | 0 | Mean Difference (IV, Random, 95% CI) | 0.0 [0.0, 0.0] |
| 4.9 Nephrology | 0 | 0 | Mean Difference (IV, Random, 95% CI) | 0.0 [0.0, 0.0] |
| 4.10 Gastroenterologic surgery | 44 | 2260 | Mean Difference (IV, Random, 95% CI) | 1.09 [‐0.11, 2.29] |
| 4.11 Trauma surgery | 0 | 0 | Mean Difference (IV, Random, 95% CI) | 0.0 [0.0, 0.0] |
| 4.12 Ortopaedics | 8 | 697 | Mean Difference (IV, Random, 95% CI) | 2.62 [1.21, 4.02] |
| 4.13 Plastic, reconstructive, and aesthetic surgery | 0 | 0 | Mean Difference (IV, Random, 95% CI) | 0.0 [0.0, 0.0] |
| 4.14 Vascular surgery | 0 | 0 | Mean Difference (IV, Random, 95% CI) | 0.0 [0.0, 0.0] |
| 4.15 Transplant surgery | 1 | 29 | Mean Difference (IV, Random, 95% CI) | ‐4.60 [‐15.21, 6.01] |
| 4.16 Urology | 0 | 0 | Mean Difference (IV, Random, 95% CI) | 0.0 [0.0, 0.0] |
| 4.17 Thoracic surgery | 2 | 548 | Mean Difference (IV, Random, 95% CI) | 0.06 [‐2.39, 2.51] |
| 4.18 Neurological surgery | 1 | 48 | Mean Difference (IV, Random, 95% CI) | 10.53 [6.72, 14.34] |
| 4.19 Oro‐maxillo‐facial surgery | 1 | 32 | Mean Difference (IV, Random, 95% CI) | 0.6 [‐1.10, 2.30] |
| 4.20 Anaesthesiology | 0 | 0 | Mean Difference (IV, Random, 95% CI) | 0.0 [0.0, 0.0] |
| 4.21 Emergency medicine | 0 | 0 | Mean Difference (IV, Random, 95% CI) | 0.0 [0.0, 0.0] |
| 4.22 Psychiatry | 0 | 0 | Mean Difference (IV, Random, 95% CI) | 0.0 [0.0, 0.0] |
| 4.23 Neurology | 6 | 311 | Mean Difference (IV, Random, 95% CI) | 1.72 [0.19, 3.25] |
| 4.24 Oncology | 1 | 23 | Mean Difference (IV, Random, 95% CI) | ‐1.0 [‐7.41, 5.41] |
| 4.25 Dermatology | 0 | 0 | Mean Difference (IV, Random, 95% CI) | 0.0 [0.0, 0.0] |
| 4.26 Gynaecology | 0 | 0 | Mean Difference (IV, Random, 95% CI) | 0.0 [0.0, 0.0] |
| 4.27 Mixed | 7 | 842 | Mean Difference (IV, Random, 95% CI) | 0.22 [‐0.58, 1.02] |
| 5 Weight ‐ based on adequacy of the amount of nutrition Show forest plot | 94 | 6916 | Mean Difference (IV, Random, 95% CI) | 1.13 [0.50, 1.75] |
| 5.1 Clearly adequate in intervention and clearly inadequate in control | 22 | 1933 | Mean Difference (IV, Random, 95% CI) | 1.03 [‐0.41, 2.46] |
| 5.2 Inadequate in the experimental or adequate in the control | 21 | 1992 | Mean Difference (IV, Random, 95% CI) | 0.86 [0.16, 1.57] |
| 5.3 Experimental group is overfed | 5 | 151 | Mean Difference (IV, Random, 95% CI) | 0.64 [‐0.87, 2.14] |
| 5.4 Unclear intake in control or experimental | 46 | 2840 | Mean Difference (IV, Random, 95% CI) | 1.34 [0.35, 2.33] |
| 6 Weight ‐ different screening tools Show forest plot | 94 | 6916 | Mean Difference (IV, Random, 95% CI) | 1.13 [0.50, 1.75] |
| 6.1 NRS 2002 | 4 | 353 | Mean Difference (IV, Random, 95% CI) | 1.12 [‐0.29, 2.53] |
| 6.2 MUST | 1 | 64 | Mean Difference (IV, Random, 95% CI) | 2.10 [0.30, 3.90] |
| 6.3 MNA | 2 | 104 | Mean Difference (IV, Random, 95% CI) | 1.56 [0.09, 3.03] |
| 6.4 SGA | 4 | 1091 | Mean Difference (IV, Random, 95% CI) | ‐1.03 [‐2.12, 0.06] |
| 6.5 Other means | 83 | 5304 | Mean Difference (IV, Random, 95% CI) | 1.26 [0.56, 1.95] |
| 7 Weight ‐ participants characterised as 'at nutritional risk' due to one of the following conditions Show forest plot | 94 | 6916 | Mean Difference (IV, Random, 95% CI) | 1.13 [0.50, 1.75] |
| 7.1 Major surgery | 49 | 3050 | Mean Difference (IV, Random, 95% CI) | 1.08 [0.08, 2.09] |
| 7.2 Stroke | 4 | 245 | Mean Difference (IV, Random, 95% CI) | 1.68 [0.12, 3.24] |
| 7.3 ICU participants including trauma | 1 | 43 | Mean Difference (IV, Random, 95% CI) | ‐1.6 [‐2.37, ‐0.83] |
| 7.4 Frail elderly participants with less severe conditions known to increase protein requirements | 9 | 1558 | Mean Difference (IV, Random, 95% CI) | 1.61 [0.59, 2.64] |
| 7.5 Participants do not fall into one of the categories above | 31 | 2020 | Mean Difference (IV, Random, 95% CI) | 0.85 [0.33, 1.38] |
| 8 Weight ‐ participants characterised as 'at nutritional risk' due to one of the following criteria Show forest plot | 94 | 6916 | Mean Difference (IV, Random, 95% CI) | 1.13 [0.50, 1.75] |
| 8.1 BMI less than 20.5 kg/m2 | 5 | 309 | Mean Difference (IV, Random, 95% CI) | 3.97 [1.06, 6.89] |
| 8.2 Weight loss of at least 5% during the last three months | 2 | 30 | Mean Difference (IV, Random, 95% CI) | ‐5.83 [‐15.15, 3.48] |
| 8.3 Weight loss of at least 10% during the last six months | 2 | 79 | Mean Difference (IV, Random, 95% CI) | 0.30 [‐0.36, 0.96] |
| 8.4 Insufficient food intake during the last week (50% of requirements or less) | 0 | 0 | Mean Difference (IV, Random, 95% CI) | 0.0 [0.0, 0.0] |
| 8.5 Participants characterised as 'at nutritional risk' by other means | 85 | 6498 | Mean Difference (IV, Random, 95% CI) | 1.12 [0.48, 1.77] |
| 9 Weight ‐ participants characterised as 'at nutritional risk' due to biomarkers or anthropometrics Show forest plot | 94 | 6916 | Mean Difference (IV, Random, 95% CI) | 1.13 [0.50, 1.75] |
| 9.1 Biomarkers | 9 | 750 | Mean Difference (IV, Random, 95% CI) | 4.37 [2.16, 6.58] |
| 9.2 Anthropometric measures | 15 | 996 | Mean Difference (IV, Random, 95% CI) | 0.87 [‐0.30, 2.04] |
| 9.3 Characterised by other means | 67 | 5110 | Mean Difference (IV, Random, 95% CI) | 0.49 [0.01, 0.96] |
| 9.4 Mixed | 3 | 60 | Mean Difference (IV, Random, 95% CI) | ‐0.37 [‐1.95, 1.22] |
| 10 Weight ‐ randomisation year Show forest plot | 23 | 1940 | Mean Difference (IV, Random, 95% CI) | 0.48 [‐0.44, 1.39] |
| 10.1 Before 1960 | 0 | 0 | Mean Difference (IV, Random, 95% CI) | 0.0 [0.0, 0.0] |
| 10.2 1960 to 1979 | 1 | 21 | Mean Difference (IV, Random, 95% CI) | 3.83 [1.66, 6.00] |
| 10.3 1980 to 1999 | 14 | 372 | Mean Difference (IV, Random, 95% CI) | 0.34 [‐0.95, 1.64] |
| 10.4 After 1999 | 8 | 1547 | Mean Difference (IV, Random, 95% CI) | 0.01 [‐1.09, 1.12] |
| 11 Weight ‐ trials where the intervention lasts fewer than three days compared with trials where the intervention lasts three days or more Show forest plot | 94 | 6916 | Mean Difference (IV, Random, 95% CI) | 1.13 [0.50, 1.75] |
| 11.1 Three days or more | 89 | 6758 | Mean Difference (IV, Random, 95% CI) | 1.18 [0.54, 1.83] |
| 11.2 Less than three days | 5 | 158 | Mean Difference (IV, Random, 95% CI) | 0.15 [‐1.62, 1.92] |
| Outcome or subgroup title | No. of studies | No. of participants | Statistical method | Effect size |
| 1 Hand‐grip strength ‐ overall Show forest plot | 14 | 783 | Mean Difference (IV, Random, 95% CI) | 1.47 [0.58, 2.37] |
| Outcome or subgroup title | No. of studies | No. of participants | Statistical method | Effect size |
| 1 Hand‐grip strength ‐ overall Show forest plot | 18 | 1240 | Mean Difference (IV, Random, 95% CI) | 0.96 [0.15, 1.76] |
| Outcome or subgroup title | No. of studies | No. of participants | Statistical method | Effect size |
| 1 Six‐minute walking distance ‐ overall Show forest plot | 1 | 102 | Mean Difference (IV, Random, 95% CI) | 133.27 [24.32, 242.22] |