Репелленты от комаров для профилактики малярии
Referencias
References to studies included in this review
References to studies excluded from this review
References to ongoing studies
Additional references
Characteristics of studies
Characteristics of included studies [ordered by study ID]
| Methods | Cluster randomized controlled trial (RCT) Unit of randomization was household. Intra‐cluster correlation coefficient (ICC) was not reported. Trial duration: up to 8 months' follow‐up in 2009 and 2010 | |
| Participants | Adults or children living in endemic regions of Laos in Attapeu Sekong Provinces. Participants were not screened at start for P. vivax. | |
| Interventions | Topical repellent: 15% DEET and placebo Co‐interventions: LLINs Treatment arms: ‐ Repellent arm: 795 households; 3972 participants; and ‐ Placebo arm: 802 households; 4008 participants. | |
| Outcomes | ‐ Participants with malaria parasitaemia confirmed through mRDTs (P. falciparum or P. vivax); ‐ Time to first infection (mean time in person/months to first malaria infection); and ‐ Self‐reported adherence to regular usage of the intervention. | |
| Notes | Conducted in Laos. Trial registration number: NCT00938379 Funded by Population Services International. | |
| Risk of bias | ||
| Bias | Authors' judgement | Support for judgement |
| Random sequence generation (selection bias) | Low risk | Equal group allocation, stratified by village. Heads of households picked treatment codes through lottery system. |
| Allocation concealment (selection bias) | Low risk | Heads of households picked treatment codes out of a bowl. |
| Blinding of participants and personnel (performance bias) | Low risk | The treatment allocation was blinded to both participants and field staff. |
| Blinding of participants and personnel (performance bias) | Low risk | The treatment allocation was blinded to both participants and field staff. |
| Blinding of participants and personnel (performance bias) | Low risk | The treatment allocation was blinded to both participants and field staff. |
| Blinding of outcome assessment (detection bias) | Low risk | Assessment of parasitaemia or time to first infection are objective outcomes. “Field staff carrying out randomisation and follow‐up surveys and trial staff performing data entry and analysis were blinded for the length of the trial." |
| Blinding of outcome assessment (detection bias) | Low risk | Assessment of parasitaemia or time to first infection are not biased because these are objective outcomes. |
| Blinding of outcome assessment (detection bias) | Low risk | The treatment allocation was blinded to both participants and field staff. |
| Incomplete outcome data (attrition bias) | Low risk | Similar attrition between 2 groups: 11.7% in intervention and 13.2% in control groups were lost to follow‐up/excluded/withdrew. |
| Selective reporting (reporting bias) | Low risk | Primary outcome was reported as per protocol. Secondary outcomes included all‐cause fever, but this was not reported; however it is non‐essential information for this study. The data presented on compliance was self‐reported, there was no reporting of compliance measured through "sniff‐checks" although it was described in the Methods section. |
| Other bias | Low risk | Baseline imbalance Study arms had similar baseline characteristics. |
| Methods | Cluster‐RCT Unit of randomization: household ICC was not reported. Trial duration: 6 months from March to September 2003. | |
| Participants | Adults or children living in malaria‐endemic area | |
| Interventions | Topical repellent lotion containing 30% PMD versus placebo lotion. Co‐interventions: LLINs Treatment arms: ‐ Repellent arm (30% PMD) + LLINs: 424 households (1967 individuals) ‐ Placebo arm + LLINs: 436 households (2041 individuals) | |
| Outcomes | ‐ Participants with malaria parasitaemia confirmed through mRDTs (specific to P. falciparum); ‐ All‐cause fever; ‐ Self‐reported adherence to regular usage of the intervention; and ‐ Recorded adverse events. | |
| Notes | Conducted in the Bolivian Amazon, Vaca Diez and Pando Provinces Trial registration number: NCT00144716 Funded by Gates Malaria Partnership grant from London School of Hygiene and Tropical Medicine | |
| Risk of bias | ||
| Bias | Authors' judgement | Support for judgement |
| Random sequence generation (selection bias) | High risk | Sequence generation was not random. “Field staff followed the strict inclusion criteria to randomise participants at the household level following a basic sequential alternate A/B/A/B regimen. Field staff and study participants were blind to the group allocation.” |
| Allocation concealment (selection bias) | High risk | Sequence generation was alternated. Personnel knew which treatment was given next. “Field staff followed the strict inclusion criteria to randomise participants at the household level following a basic sequential alternate A/B/A/B regimen. Field staff and study participants were blind to the group allocation.” |
| Blinding of participants and personnel (performance bias) | Low risk | Field staff and participants were blinded to the treatment allocation. |
| Blinding of participants and personnel (performance bias) | Low risk | Field staff and participants were blinded to the treatment allocation. |
| Blinding of participants and personnel (performance bias) | Low risk | Field staff and participants were blinded to the treatment allocation. |
| Blinding of participants and personnel (performance bias) | Low risk | Field staff and participants were blinded to the treatment allocation. |
| Blinding of outcome assessment (detection bias) | Low risk | Primary outcome is objective (mRDT result), so although it is not described if the outcome assessor is blinded, lack of blinding was unlikely to bias the results. |
| Blinding of outcome assessment (detection bias) | Unclear risk | Blinding of outcome assessment for adherence to intervention is unclear. |
| Blinding of outcome assessment (detection bias) | Unclear risk | Blinding of outcome assessment for all‐cause fever is unclear. |
| Blinding of outcome assessment (detection bias) | Unclear risk | Blinding of outcome assessment for adverse events is unclear. |
| Incomplete outcome data (attrition bias) | Low risk | The number of participants lost to follow‐up was similar between treatment arms. |
| Selective reporting (reporting bias) | Low risk | All the outcomes set to be measured were reported. |
| Other bias | High risk | Baseline imbalance “There were no significant differences in most household characteristics (number of household members, roof material, water source, heating source, or possession of electricity, fridge, and radio) between the two groups (data not shown), but households allocated to the repellent group were slightly more likely to own a television than those allocated to the placebo group (P=0.056) (table 1). There were also no significant differences in age or sex between the groups but at baseline more participants in the repellent group were positive for P. falciparum (P=0.065) (table 1).” |
| Methods | Cluster‐RCT Unit of randomization: household ICC is not reported. Trial duration: 1 month baseline and 6 months' intervention from April to October 2007. | |
| Participants | Adults or children living in an endemic region Participants were screened forP. vivax and parasites were cleared at start. | |
| Interventions | Mosquito coils (0.03% transfluthrin) and no treatment. Co‐interventions: LLINs Treatment arms: ‐ Control (no treatments) arm ‒ 513 households ‐ 0.03% transfluthrin coils arm ‒ 512 households ‐ LLINs arm ‒ 513 households ‐ LLINs + 0.03% transfluthrin coils arm ‒ 514 households | |
| Outcomes | ‐ Participants with malaria parasitaemia confirmed through mRDTs (P. falciparum or P. vivax) and verified by external microscopist through thick film; ‐ Adherence to regular usage of the intervention measured through village leaders' reports and self‐reporting; and ‐ Reduction in indoor density of mosquitoes measured through collections using CDC light traps indoor households from the four treatment arms (monthly arithmetic mean of mosquito densities). | |
| Notes | Conducted in rural areas of China in the Ruili County, Yunnan Province, close to the Myanmar border. Trial registration number: NCT00442442 Funded by SC Johnson | |
| Risk of bias | ||
| Bias | Authors' judgement | Support for judgement |
| Random sequence generation (selection bias) | Low risk | Allocation was done using lottery system: “Households enrolled at baseline were randomly allocated by the lottery method to one of the four intervention arms (i) nothing, (ii) coils alone, (iii) LLINs alone or (iv) coils and LLINs.” |
| Allocation concealment (selection bias) | Low risk | Allocation was done using lottery system so allocation was concealed: “Households enrolled at baseline were randomly allocated by the lottery method to one of the four intervention arms (i) nothing, (ii) coils alone, (iii) LLINs alone or (iv) coils and LLINs.” |
| Blinding of participants and personnel (performance bias) | High risk | Participants and field staff were not blinded. Participants may have changed their behaviour if they knew to which treatment they had been allocated. “Field workers and participants were not blinded to treatment allocation, as this was impossible in practice. However, the field staff collecting monthly RDT data were not aware of the intervention which individuals had been using thus achieving single blinding (investigator) of the study.” |
| Blinding of participants and personnel (performance bias) | High risk | Participants and field staff were not blinded. Participants may have changed their behaviour by knowing the treatment they had been allocated to. "Field workers and participants were not blinded to treatment allocation, as this was impossible in practice. However, the field staff collecting monthly RDT data were not aware of the intervention which individuals had been using thus achieving single blinding (investigator) of the study.” ” …the untreated control group continued to use their own personal protection methods. It would be unethical to ask anyone not to do this but a record was kept of such ad‐hoc coil use in the negative control group and those reporting the use of one box or more (10 coils/5 nights) were excluded from the analysis for that round.(...) Conversely, those in the control arm were less likely to follow the request of the study directors to not use any intervention, with 13‐19% using local coils for 3 or more days in the month prior to the survey.” |
| Blinding of participants and personnel (performance bias) | High risk | The team collecting the mosquitoes could have been biased if they knew which houses belonged to each treatment. |
| Blinding of outcome assessment (detection bias) | Low risk | Staff assessing parasitaemia were blinded. "However, the field staff collecting monthly RDT data were not aware of the intervention which individuals had been using thus achieving single blinding (investigator) of the study.Furthermore, microscopist’s at Yunnan Institute of Parasitic diseases that verified positive RDTs by microscopy and the statistician was blind to the allocation.” |
| Blinding of outcome assessment (detection bias) | High risk | Compliance was measured indirectly through counting of empty boxes of coils. |
| Blinding of outcome assessment (detection bias) | Low risk | Data is objective therefore the risk of detection bias is low. |
| Incomplete outcome data (attrition bias) | Low risk | Loss to follow‐up was less than 2% in all treatment arms. |
| Selective reporting (reporting bias) | Low risk | All outcomes were reported. |
| Other bias | Low risk | Baseline imbalance Study arms had similar baseline characteristics. |
| Methods | RCT Trial duration: 17 months between April 1995 and September 1996. | |
| Participants | Participants were women who were 3 to 7 months' pregnant. Participants were not screened at start for P. vivax. | |
| Interventions | 20% DEET added to Thanaka (popular local cosmetic) compared to Thanaka alone. Co‐intervention: none Treatment arms: ‐ Thanaka containing 20% DEET arm ‒ 449; and ‐ Thanaka arm ‒ 448. | |
| Outcomes | ‐ Participants with malaria parasitaemia confirmed through blood smears (P. falciparum andP. vivax); ‐ Adherence to regular usage of the intervention measured through self‐reporting; ‐ Anaemia; and ‐ Recorded adverse events. | |
| Notes | The study was carried out in camps for displaced people of the Karen ethnic minority in endemic regions of Thailand. The project was funded by the Danish Bilharziasis Laboratory and was part of the Wellcome‒Mahidol University of Oxford Tropical Medicine Research Programme funded by the Wellcome Trust. | |
| Risk of bias | ||
| Bias | Authors' judgement | Support for judgement |
| Random sequence generation (selection bias) | Unclear risk | Not described |
| Allocation concealment (selection bias) | Unclear risk | Not described |
| Blinding of participants and personnel (performance bias) | Low risk | Double‐blinded RCT, both personnel and participants were blinded to the intervention. |
| Blinding of participants and personnel (performance bias) | Low risk | Double‐blinded RCT, both personnel and participants were blinded to the intervention. |
| Blinding of participants and personnel (performance bias) | Low risk | Double‐blinded RCT, both personnel and participants were blinded to the intervention. |
| Blinding of participants and personnel (performance bias) | Low risk | Double‐blinded RCT, both personnel and participants were blinded to the intervention. |
| Blinding of outcome assessment (detection bias) | Low risk | Double‐blinded RCT, both personnel and participants were blinded to the intervention. |
| Blinding of outcome assessment (detection bias) | Low risk | Double blinded RCT, both personnel and participants were blinded to the intervention. |
| Blinding of outcome assessment (detection bias) | Low risk | Double‐blinded RCT, both personnel and participants were blinded to the intervention. |
| Blinding of outcome assessment (detection bias) | Low risk | This is an objective outcome. |
| Incomplete outcome data (attrition bias) | Low risk | Attrition between arms was similar, data was not reported in the published but retrieved through communication with the author. |
| Selective reporting (reporting bias) | Low risk | Reporting was not clear in the published article but data of events between treatment arms was sent to us after communicating with the author. |
| Other bias | Low risk | Baseline imbalance "Between April 1995 and September 1996, 897 pregnant women were enrolled in the study, 449 into the DET and thanaka group and 448 into the thanaka alone group with no difference in baseline characteristics" |
| Methods | Cluster‐RCT Unit of randomization: household ICC was not reported. Trial duration: 16 weeks from July to November 1996 | |
| Participants | Adults or children living in malaria‐endemic regions Participants were not screened at start for P. vivax. | |
| Interventions | Treated clothing in the form of chaddars (permethrin 0.1 mg/cm²) versus placebo Co‐interventions: none Treatment arms: ‐ Treated chaddar arm: 51 households (438 individuals) ‐ Placebo arm: 51 households (387 individuals) | |
| Outcomes | ‐ Participants with clinical malaria confirmed through blood smears or rapid diagnostic tests (P. falciparum or P. vivax); and ‐ Recorded adverse events. | |
| Notes | Trial was conducted with Afghan refugees in Adizai settlement in north‐western Pakistan. Funded by HealthNet International’s Malaria and Leishmaniasis control and research programme. | |
| Risk of bias | ||
| Bias | Authors' judgement | Support for judgement |
| Random sequence generation (selection bias) | Low risk | Random number generator used against list of health centre family registration cards. “To achieve this sample size, 20% of refugee households were selected using a random number generator against the list of health centre family registration cards.” |
| Allocation concealment (selection bias) | Unclear risk | Not described. “Selected households were randomly divided into intervention and placebo groups, and if more than one family lived in a single house all families therein were allocated to the same treatment group.” |
| Blinding of participants and personnel (performance bias) | Low risk | Participants and staff were blinded. “Field workers were under the assumption that both placebo and permethrin were effective. Health centre staff did not know which families were in which group.” |
| Blinding of participants and personnel (performance bias) | Low risk | Participants and staff were blinded. “Field workers were under the assumption that both placebo and permethrin were effective. Health centre staff did not know which families were in which group.” |
| Blinding of outcome assessment (detection bias) | Low risk | “Health centre staff did not know which families were in which group" |
| Blinding of outcome assessment (detection bias) | Low risk | “Health centre staff did not know which families were in which group" |
| Incomplete outcome data (attrition bias) | Unclear risk | Not stated how many people were lost to follow‐up, or how/if this was measured. |
| Selective reporting (reporting bias) | Unclear risk | Protocol not available and author failed to communicate with the review team. |
| Other bias | Low risk | Baseline imbalance Study arms had similar baseline characteristics. |
| Methods | Cluster‐RCT Unit of randomizations: household Intra‐cluster correlation coefficient factor of 0.04. Trial duration: 7 months between August 1999 and February 2000. | |
| Participants | Adults and children living in malaria‐endemic regions Participants were not screened at start for P. vivax. | |
| Interventions | Topical repellent ‐ Mosbar soap (20% DEET + 0.5% permethrin) versus placebo lotion Co‐interventions: none Treatment arms: ‐ Mosbar soap (20% DEET + 0.5% permethrin) arm: 67 households (618 participants) ‐ Placebo arm: 60 households (530 participants) | |
| Outcomes | ‐ Participants with clinical malaria confirmed through blood smears or rapid diagnostic tests (P. falciparum or P. vivax); and ‐ Recorded adverse events. | |
| Notes | Trial was conducted with Afghan refugees in malaria‐endemic region of Pakistan. Funded by HealthNet International’s Malaria and Leishmaniasis control and research programme. | |
| Risk of bias | ||
| Bias | Authors' judgement | Support for judgement |
| Random sequence generation (selection bias) | Unclear risk | Not described "By applying simple randomisation 13% (67 of 510) of households were allocated to the repellent soap group and a similar proportion (12%, 60 of 510) to the placebo control." |
| Allocation concealment (selection bias) | Unclear risk | Not described |
| Blinding of participants and personnel (performance bias) | Low risk | Participants were blinded: although they had been given two different products, a soap or a lotion, they were not aware which one had repellent properties. |
| Blinding of participants and personnel (performance bias) | Low risk | Participants and personnel were blinded. |
| Blinding of outcome assessment (detection bias) | Low risk | Participants and personnel were blinded. |
| Blinding of outcome assessment (detection bias) | Low risk | Microscopists were blinded to the treatment allocation. |
| Incomplete outcome data (attrition bias) | Low risk | No losses to follow‐up were reported. |
| Selective reporting (reporting bias) | Unclear risk | Protocol not available and author failed to communicate with the review team. |
| Other bias | Low risk | Baseline imbalance Study arms had similar baseline characteristics. |
| Methods | Cluster‐RCT Unit of randomization: cluster of houses ICC is not reported. Trial duration: 14 months from July 2009 to August 2010 | |
| Participants | Adults or children living in endemic areas. | |
| Interventions | 15% DEET lotion versus placebo lotion Co‐interventions: LLINs Treatment arms: ‐ DEET 15% + LLINs arm ‒ 10 clusters, 468 households and 2224 participants ‐ Placebo + LLINs arm ‒ 10 clusters, 469 households and 2202 participants | |
| Outcomes | ‐ Participants with clinical malaria confirmed through blood smears or rapid diagnostic tests (P. falciparum); and ‐ Adherence to regular usage of the intervention. | |
| Notes | Trial was conducted in rural communities of the Ulanga district, Kilombero Valley, Tanzania. Trial registration number: ISRCTN92202008 Funded by Population Services International. | |
| Risk of bias | ||
| Bias | Authors' judgement | Support for judgement |
| Random sequence generation (selection bias) | High risk | Sequence generation was done using lottery system. |
| Allocation concealment (selection bias) | High risk | Allocation was not concealed. The method described was basic sequential alternate A/B/A/B. |
| Blinding of participants and personnel (performance bias) | Low risk | The treatment allocation was blinded to both participants and field staff. |
| Blinding of participants and personnel (performance bias) | Low risk | The treatment allocation was blinded to both participants and field staff. |
| Blinding of outcome assessment (detection bias) | High risk | Compliance was indirectly reported by measuring the amount of lotion remaining in the bottle. |
| Blinding of outcome assessment (detection bias) | Low risk | Clinical malaria was diagnosed by mRDT which is an objective method. |
| Incomplete outcome data (attrition bias) | Low risk | Loss to follow‐up and withdrawals were identical between treatment groups. |
| Selective reporting (reporting bias) | Low risk | All outcomes were reported. |
| Other bias | High risk | Baseline imbalance: “Bias was introduced into the study by an imbalance in socio‐economic status between the two study groups. The control group demonstrated a higher socio‐economic status than the control arm.” |
| Methods | Cluster‐RCT Unit of randomization: cluster of houses ICC was calculated per survey; survey 4 ICC was 0.0294. Trial duration: approximately 20 months from April 2012 until November 2013 inclusive. | |
| Participants | Adults and children living in malaria‐endemic regions. Participants were not screened at start for P. vivax. | |
| Interventions | Picaridin KBR3023 (topical repellent) versus no treatment Picaridin 10% for children < 10 years and Picaridin 20% in individuals < 10 years Co‐interventions: LLINs Treatment arms: ‐ Picaridin KBR3023 arm ‒ 49 clusters from 57 villages (5642 households, 25,051 individuals) ‐ No treatment arm ‒ 49 clusters from 56 villages (5287 households, 23,787 individuals) | |
| Outcomes | ‐ Participants with clinical malaria confirmed through blood smears or rapid diagnostic tests (P. falciparum or P. vivax); ‐ Participants with malaria parasitaemia confirmed through thick or thin blood smears, mRDTs or PCR (P. falciparum or P.vivax); ‐ Adherence to regular usage of the intervention through self‐reporting and observational studies; and ‐ Recorded adverse events. | |
| Notes | Trial was conducted in Ratanakiri province, Cambodia. Trial registration number: NCT01663831 Funded by the Bill and Melinda Gates Foundation. | |
| Risk of bias | ||
| Bias | Authors' judgement | Support for judgement |
| Random sequence generation (selection bias) | Low risk | Random sequence, calculation of restriction factor, and validity matrix was carried out in R using “onemillion_random.RData”. |
| Allocation concealment (selection bias) | Low risk | All clusters were allocated a treatment at start using a computer generated random sequence. |
| Blinding of participants and personnel (performance bias) | High risk | There was no placebo given to control group. |
| Blinding of participants and personnel (performance bias) | High risk | There was no placebo given to control group. |
| Blinding of participants and personnel (performance bias) | High risk | There was no placebo given to control group so it is unclear how compliance might have been affected. Control group was given LLIN and intervention group was given a topical repellent in addition to the LLIN. It is possible that participants felt they would be protected by the repellent and so would choose not to use their bed net. |
| Blinding of participants and personnel (performance bias) | High risk | There was no placebo given to control so those given repellent lotions might have felt more likely to suffer adverse effects. |
| Blinding of outcome assessment (detection bias) | Low risk | Parasitaemia was measured by PCR which is an objective test. |
| Blinding of outcome assessment (detection bias) | Unclear risk | Compliance was only measured in the treatment arm because there was no placebo. |
| Blinding of outcome assessment (detection bias) | High risk | Adverse effects were self‐reported and could have been influenced by the participant knowing that he/she had been given a fully effective mosquito repellent. |
| Blinding of outcome assessment (detection bias) | Unclear risk | The trial was not placebo‐controlled: individuals that received the repellent could have mentioned this to medical staff and influenced their diagnosis of clinical malaria. |
| Incomplete outcome data (attrition bias) | Low risk | Attrition was similar between groups. |
| Selective reporting (reporting bias) | Low risk | Reporting was done according to protocol. |
| Other bias | Low risk | Baseline imbalance. Restrained randomization controlled for baseline imbalances |
| Methods | RCT Duration of the trial: 3 to 5 weeks followed by 4 weeks' follow‐up | |
| Participants | Colombian Army members stationed in endemic areas | |
| Interventions | Insecticide treated clothing versus placebo Treatment arms: ‐ ITC ‒ 86 individuals; ‐ Placebo ‒ 86 individuals. | |
| Outcomes | ‐ Participants with clinical malaria confirmed through blood smears or rapid diagnostic tests (P. falciparum or P. vivax); and ‐ Recorded adverse events. | |
| Notes | Trial was conducted in the Colombian Amazon. | |
| Risk of bias | ||
| Bias | Authors' judgement | Support for judgement |
| Random sequence generation (selection bias) | Unclear risk | The randomization process is not described. Quote “troops were randomly assigned to receive either permethrin‐impregnated or non‐impregnated uniforms” |
| Allocation concealment (selection bias) | Unclear risk | Poorly described. |
| Blinding of participants and personnel (performance bias) | Low risk | Medical attendants and soldiers were blinded to the intervention. |
| Blinding of participants and personnel (performance bias) | Low risk | Medical attendants and soldiers were blinded to the intervention. |
| Blinding of outcome assessment (detection bias) | Low risk | Medical attendants and soldiers were blinded to the intervention. |
| Blinding of outcome assessment (detection bias) | Low risk | Medical attendants and soldiers were blinded to the intervention. |
| Incomplete outcome data (attrition bias) | Low risk | All patients completed the study and there were no losses to follow‐up, no treatment withdrawals, no trial group changes and no major adverse events. Adherence to instructions (wearing clothes) was not monitored so not possible to assess whether soldiers were compliant. |
| Selective reporting (reporting bias) | Unclear risk | Protocol not available and the corresponding author failed to communicate. |
| Other bias | Unclear risk | Baseline imbalance Both study arms recruited similar number of soldiers and deployed them to the same endemic area. However, the number of weeks soldiers in each study arm were deployed in the field was not reported per arm. "Each soldier was in the area of endemicity for 3‐8 weeks." |
| Methods | Matched pair cluster‐RCT, with the matching done according to village. Unit of randomization: cluster ICC not reported. Trial duration: 6 months | |
| Participants | Male adults between 18 and 60 years old, residents of malaria‐endemic regions. Participants were screened at start and parasites were cleared. | |
| Interventions | Mosquito coils (0.00975% metofluthrin) versus Placebo coils No co‐interventions Treatment arms: ‐ Metofluthrin treated coils: 2 clusters with total of 216 households, population of 1001 individuals and 83 participants (males 18 to 60 years old) enrolled for follow‐up; ‐ Placebo coils: 2 clusters with total of 229 households, population of 1119 and 87 participants (males 18 to 60 years old) enrolled for follow‐up. | |
| Outcomes | ‐ Participants with Plasmodium spp. parasitaemia confirmed through blood smear. ‐ Reduction in mosquito landings measured through human landing catch. ‐ Adverse events. | |
| Notes | Trial was conducted in Umbugendo and Wainyapu in Southwest Sumba District, East Nusa Tenggara Province, Indonesia. Funded by Bill and Melinda Gates Foundation | |
| Risk of bias | ||
| Bias | Authors' judgement | Support for judgement |
| Random sequence generation (selection bias) | Unclear risk | Randomization method was not described. |
| Allocation concealment (selection bias) | Low risk | The trial as a matched pair cRCT with matching done according to village level. There were only two clusters in each village: therefore after treatment was allocated to one cluster, it was obvious which treatment would be allocated to the next cluster. |
| Blinding of participants and personnel (performance bias) | Low risk | Blinding of both participants and personnel was in place. “The study administrator obtained a list of lot manufacturing codes from the coil manufacturer (S.C. Johnson Co., Ho Chi Minh, Vietnam) that identified coils as either active or placebo. The administrator then assigned a code specific to each home and labelled packages of coils corresponding to cluster assignment to active or placebo coil treatment. These assignments were kept in a sealed envelope in a secure location within the managing centre of the research program (Jakarta). Thus, the investigators, research team, study subjects, and residents were blinded as to which cluster received active versus placebo coils until after completion of the study.” |
| Blinding of participants and personnel (performance bias) | Low risk | Technicians collecting the mosquitoes were blinded to the interventions. |
| Blinding of participants and personnel (performance bias) | Low risk | Blinding of both participants and personnel was in place. |
| Blinding of outcome assessment (detection bias) | Low risk | Blinding of both participants and personnel was in place. Diagnosis was done through microscopy of blood smear. The method was not validated. |
| Blinding of outcome assessment (detection bias) | Low risk | Blinding of both participants and personnel was in place. |
| Blinding of outcome assessment (detection bias) | Low risk | Blinding of both participants and personnel was in place. |
| Incomplete outcome data (attrition bias) | Low risk | No withdrawals were reported. |
| Selective reporting (reporting bias) | Low risk | The primary outcomes set out by the author in the registered protocol match those reported in the paper. |
| Other bias | Low risk | Baseline imbalance Study arms had similar baseline characteristics. |
Abbreviations: RCT: randomized controlled trial.
Characteristics of excluded studies [ordered by study ID]
| Study | Reason for exclusion |
| The study only had two units of randomization. | |
| The study was not a randomized controlled trial (RCT). | |
| The study did not specify the repellent compound tested. | |
| The study was not a RCT. | |
| The study only had two units of randomization. | |
| The study only had two units of randomization. |
Abbreviations: RCT: randomized controlled trial.
Characteristics of ongoing studies [ordered by study ID]
| Trial name or title | Effectiveness of mosquito repellent delivered through village health volunteers on malaria incidence in artemisinin resistance containment programs in South‐East Myanmar |
| Methods | Open stepped‐wedge cluster‐randomized controlled trial (RCT) |
| Participants | Men and women of all ages residing in the study area. High‐risk populations (mobile and migrant people and residents who are also forest dwellers) will be targeted to receive the repellent. |
| Interventions | 12% DEET cream versus no treatment |
| Outcomes | The primary epidemiological outcomes will be incidence of Plasmodium spp. infection (diagnosed by an mRDT) and incidence of malaria illness. |
| Starting date | 01‐04‐2015 |
| Contact information | Freya Fowkes ([email protected]) |
| Notes | www.anzctr.org.au/Trial/Registration/TrialReview.aspx?ACTRN=12616001434482 |
| Trial name or title | Spatial Repellent Products for Control of Vector Borne Diseases ‐ Malaria ‐ Indonesia |
| Methods | Cluster‐RCT |
| Participants | Residents of malaria‐endemic regions of Indonesia |
| Interventions | Spatial repellent passive emanators versus placebo |
| Outcomes | The primary epidemiological endpoint will be the incidence density of first time malaria infections among human cohorts during the follow‐up period as detected by polymerase chain reaction assay (PCR). |
| Starting date | May 2015 |
| Contact information | Neil Lobo ([email protected]) |
| Notes | clinicaltrials.gov/ct2/show/NCT02294188 |
| Trial name or title | Malaria Elimination Pilot Study in Military Forces in Cambodia |
| Methods | Cluster‐RCT |
| Participants | Residents of military encampments on the Thai‐Cambodian border |
| Interventions | Focused screening and treatment, malaria prophylaxis and insecticide‐treated uniforms versus untreated uniforms |
| Outcomes | The primary epidemiological outcome will be the absolute risk reduction based on the proportion of subjects remaining malaria‐free at the end of 6 months between the study arms as diagnosed by PCR‐corrected malaria microscopy |
| Starting date | January 2016 |
| Contact information | Chanthap Lon ([email protected]) |
| Notes | clinicaltrials.gov/ct2/show/record/NCT02653898 |
| Trial name or title | Field Efficacy Of Insecticide Treated Uniforms And Skin Repellents for Malaria Prevention (URCT) |
| Methods | Cluster‐RCT using a 4‐arm non‐inferiority design with 12 months of follow‐up |
| Participants | Healthy recruits of the Tanzanian National Service Program JKT Mgambo Camp. |
| Interventions | Ultra 30 insect repellent lotion (30% Lipo DEET) in combination or not with permethrin factory‐treated army combat uniforms. |
| Outcomes | The primary epidemiological outcome will be the incidence of P. falciparum malaria through monthly measurement of malaria positivity by direct polymerase chain reaction (PCR) to detect parasite DNA. |
| Starting date | November 2017 |
| Contact information | Sarah Moore ([email protected]) |
| Notes | clinicaltrials.gov/ct2/show/record/NCT02938975 |
Abbreviations: RCT: randomized controlled trial.
Data and analyses
| Outcome or subgroup title | No. of studies | No. of participants | Statistical method | Effect size | ||||||||||||||||||||||||||||||||||||||||||
| 1 Clinical malaria caused by Plasmodium falciparum Show forest plot | 3 | 4447 | Risk Ratio (M‐H, Random, 95% CI) | 0.65 [0.40, 1.07] | ||||||||||||||||||||||||||||||||||||||||||
| Analysis 1.1  Comparison 1 Topical repellent compared to placebo or no treatment, Outcome 1 Clinical malaria caused by Plasmodium falciparum. | ||||||||||||||||||||||||||||||||||||||||||||||
| 1.1 Without LLINs | 1 | 869 | Risk Ratio (M‐H, Random, 95% CI) | 0.40 [0.23, 0.71] | ||||||||||||||||||||||||||||||||||||||||||
| 1.2 With LLINS | 2 | 3578 | Risk Ratio (M‐H, Random, 95% CI) | 0.84 [0.55, 1.27] | ||||||||||||||||||||||||||||||||||||||||||
| 2 Plasmodium falciparum parasitaemia Show forest plot | 4 | 13310 | Risk Ratio (M‐H, Fixed, 95% CI) | 0.84 [0.64, 1.12] | ||||||||||||||||||||||||||||||||||||||||||
| Analysis 1.2  Comparison 1 Topical repellent compared to placebo or no treatment, Outcome 2 Plasmodium falciparum parasitaemia. | ||||||||||||||||||||||||||||||||||||||||||||||
| 2.1 Without LLINs | 1 | 897 | Risk Ratio (M‐H, Fixed, 95% CI) | 0.78 [0.53, 1.16] | ||||||||||||||||||||||||||||||||||||||||||
| 2.2 With LLINs | 3 | 12413 | Risk Ratio (M‐H, Fixed, 95% CI) | 0.91 [0.60, 1.38] | ||||||||||||||||||||||||||||||||||||||||||
| 3 Clinical malaria caused by Plasmodium vivax Show forest plot | 2 | 3996 | Risk Ratio (M‐H, Fixed, 95% CI) | 1.32 [0.99, 1.76] | ||||||||||||||||||||||||||||||||||||||||||
| Analysis 1.3  Comparison 1 Topical repellent compared to placebo or no treatment, Outcome 3 Clinical malaria caused by Plasmodium vivax. | ||||||||||||||||||||||||||||||||||||||||||||||
| 3.1 Without LLINs | 1 | 869 | Risk Ratio (M‐H, Fixed, 95% CI) | 1.42 [1.02, 1.99] | ||||||||||||||||||||||||||||||||||||||||||
| 3.2 With LLINs | 1 | 3127 | Risk Ratio (M‐H, Fixed, 95% CI) | 1.11 [0.64, 1.94] | ||||||||||||||||||||||||||||||||||||||||||
| 4 Plasmodium vivax parasitaemia Show forest plot | 3 | 9589 | Risk Ratio (M‐H, Fixed, 95% CI) | 1.08 [0.81, 1.43] | ||||||||||||||||||||||||||||||||||||||||||
| Analysis 1.4  Comparison 1 Topical repellent compared to placebo or no treatment, Outcome 4 Plasmodium vivax parasitaemia. | ||||||||||||||||||||||||||||||||||||||||||||||
| 4.1 Without LLINs | 1 | 897 | Risk Ratio (M‐H, Fixed, 95% CI) | 0.98 [0.68, 1.40] | ||||||||||||||||||||||||||||||||||||||||||
| 4.2 With LLINs | 2 | 8692 | Risk Ratio (M‐H, Fixed, 95% CI) | 1.24 [0.78, 1.97] | ||||||||||||||||||||||||||||||||||||||||||
| 5 Anaemia Show forest plot | 1 | 587 | Risk Ratio (M‐H, Fixed, 95% CI) | 1.06 [0.91, 1.23] | ||||||||||||||||||||||||||||||||||||||||||
| Analysis 1.5 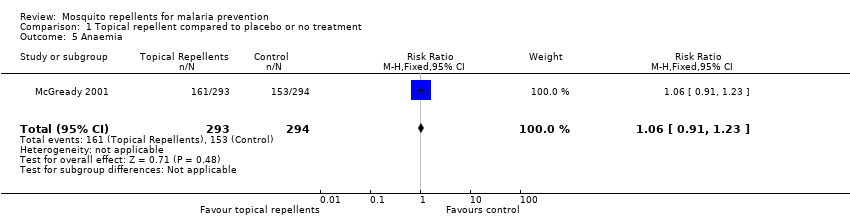 Comparison 1 Topical repellent compared to placebo or no treatment, Outcome 5 Anaemia. | ||||||||||||||||||||||||||||||||||||||||||||||
| 6 All‐cause fever Show forest plot | 1 | 3496 | Risk Ratio (M‐H, Fixed, 95% CI) | 0.44 [0.35, 0.55] | ||||||||||||||||||||||||||||||||||||||||||
| Analysis 1.6  Comparison 1 Topical repellent compared to placebo or no treatment, Outcome 6 All‐cause fever. | ||||||||||||||||||||||||||||||||||||||||||||||
| 7 Adherence to the intervention Show forest plot | Other data | No numeric data | ||||||||||||||||||||||||||||||||||||||||||||
| Analysis 1.7
Comparison 1 Topical repellent compared to placebo or no treatment, Outcome 7 Adherence to the intervention. | ||||||||||||||||||||||||||||||||||||||||||||||
| 8 Adverse events Show forest plot | Other data | No numeric data | ||||||||||||||||||||||||||||||||||||||||||||
| Analysis 1.8
Comparison 1 Topical repellent compared to placebo or no treatment, Outcome 8 Adverse events. | ||||||||||||||||||||||||||||||||||||||||||||||
| Outcome or subgroup title | No. of studies | No. of participants | Statistical method | Effect size | ||||||||||||||||||||||||||||
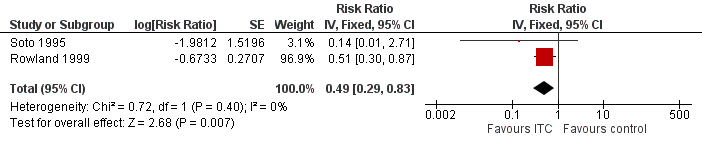
| 1 Clinical malaria caused by Plasmodium falciparum Show forest plot | 2 | Risk Ratio (Fixed, 95% CI) | 0.49 [0.29, 0.83] | |||||||||||||||||||||||||||||
| Analysis 2.1 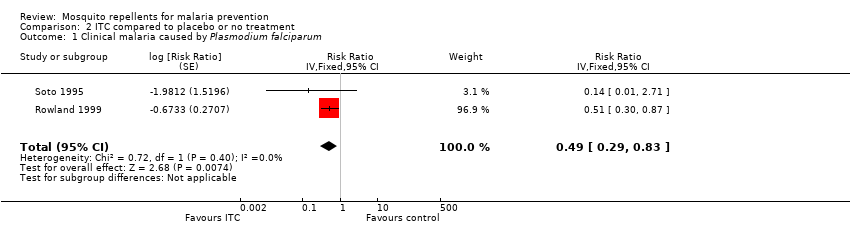 Comparison 2 ITC compared to placebo or no treatment, Outcome 1 Clinical malaria caused by Plasmodium falciparum. | ||||||||||||||||||||||||||||||||
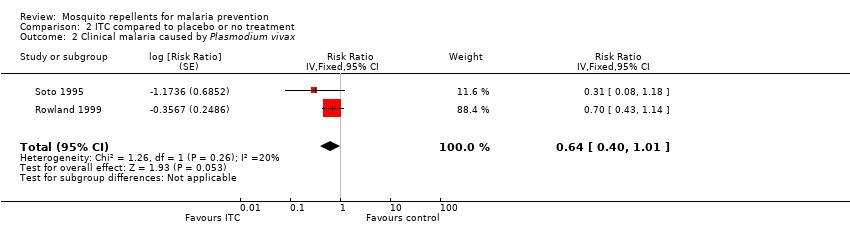
| 2 Clinical malaria caused by Plasmodium vivax Show forest plot | 2 | Risk Ratio (Fixed, 95% CI) | 0.64 [0.40, 1.01] | |||||||||||||||||||||||||||||
| Analysis 2.2  Comparison 2 ITC compared to placebo or no treatment, Outcome 2 Clinical malaria caused by Plasmodium vivax. | ||||||||||||||||||||||||||||||||
| 3 Adverse events Show forest plot | Other data | No numeric data | ||||||||||||||||||||||||||||||
| Analysis 2.3
Comparison 2 ITC compared to placebo or no treatment, Outcome 3 Adverse events. | ||||||||||||||||||||||||||||||||
| Outcome or subgroup title | No. of studies | No. of participants | Statistical method | Effect size | |||||||||||||||||||||
| 1 Plasmodium spp. parasitaemia Show forest plot | 2 | Risk Ratio (Random, 95% CI) | 0.24 [0.03, 1.72] | ||||||||||||||||||||||
| Analysis 3.1  Comparison 3 Spatial repellents compared to placebo or no treatment, Outcome 1 Plasmodium spp. parasitaemia. | |||||||||||||||||||||||||
| 2 Adherence to the intervention Show forest plot | Other data | No numeric data | |||||||||||||||||||||||
| Analysis 3.2
Comparison 3 Spatial repellents compared to placebo or no treatment, Outcome 2 Adherence to the intervention. | |||||||||||||||||||||||||
| 3 Reduction in mosquito bites Show forest plot | 1 | 16 | Mean Difference (IV, Fixed, 95% CI) | ‐10.8 [‐16.23, ‐5.37] | |||||||||||||||||||||
| Analysis 3.3  Comparison 3 Spatial repellents compared to placebo or no treatment, Outcome 3 Reduction in mosquito bites. | |||||||||||||||||||||||||
| 4 Adverse events Show forest plot | Other data | No numeric data | |||||||||||||||||||||||
| Analysis 3.4
Comparison 3 Spatial repellents compared to placebo or no treatment, Outcome 4 Adverse events. | |||||||||||||||||||||||||

Study flow diagram.

'Risk of bias' summary: review authors' judgements about each 'Risk of bias' item for each included study.

Forest plot of comparison: 1 Topical repellent compared to placebo or no treatment, outcome: 1.1 Clinical malaria caused by P. falciparum.

Forest plot of comparison: 1 Topical repellent compared to placebo or no treatment, outcome: 1.2 P. falciparum parasitaemia.

Forest plot of comparison: 1 Topical repellent compared to placebo or no treatment, outcome: 1.3 Clinical malaria caused by P. vivax.

Forest plot of comparison: 1 Topical repellent compared to placebo or no treatment, outcome: 1.4 P. vivax parasitaemia.
Forest plot of comparison: 2 ITC compared to placebo or no treatment, outcome: 2.1 Clinical malaria caused by P. falciparum.

Forest plot of comparison: 2 ITC compared to placebo or no treatment, outcome: 2.2 Clinical malaria caused by P. vivax.

Forest plot of comparison: 3 Spatial repellents compared to placebo or no treatment, outcome: 3.1 Plasmodium spp. parasitaemia.
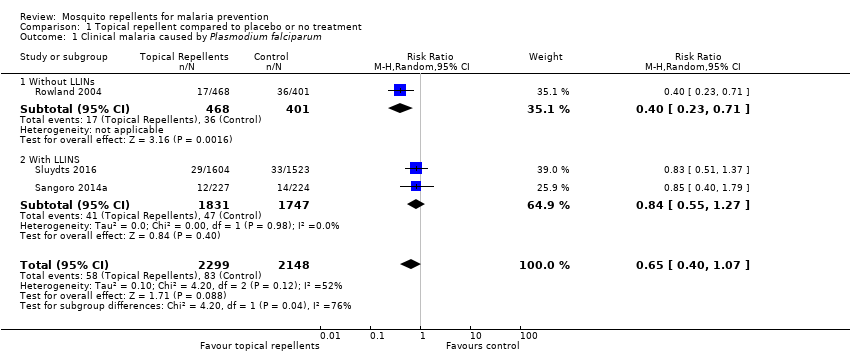
Comparison 1 Topical repellent compared to placebo or no treatment, Outcome 1 Clinical malaria caused by Plasmodium falciparum.

Comparison 1 Topical repellent compared to placebo or no treatment, Outcome 2 Plasmodium falciparum parasitaemia.
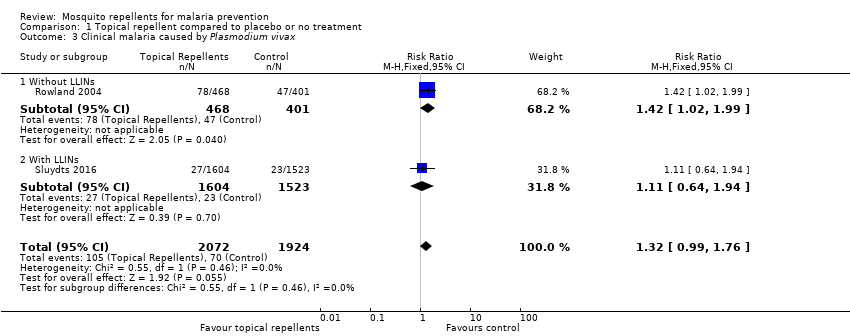
Comparison 1 Topical repellent compared to placebo or no treatment, Outcome 3 Clinical malaria caused by Plasmodium vivax.

Comparison 1 Topical repellent compared to placebo or no treatment, Outcome 4 Plasmodium vivax parasitaemia.

Comparison 1 Topical repellent compared to placebo or no treatment, Outcome 5 Anaemia.
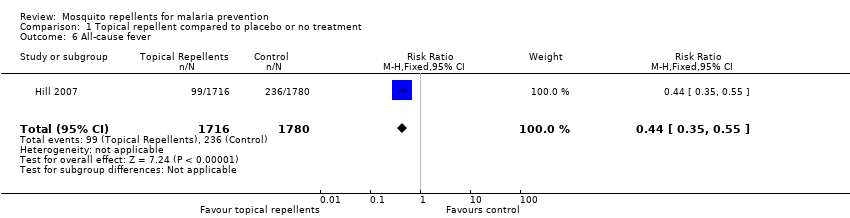
Comparison 1 Topical repellent compared to placebo or no treatment, Outcome 6 All‐cause fever.
| Study | Follow up length | Method | Compliance repellent arm | Compliance treatment arm |
| Chen‐Hussey 2013 | Monthly | Self reporting Estimating weight of repellent bottles. | 61.3% | 62.2% |
| Hill 2007 | Monthly | Self reporting Random unanounced "sniff check" Estimating weight of repellent bottles. | 98.5% | 98.5% |
| McGready 2001 | Weekly | Self reporting Random spot checks | Unclear | Unclear |
| Sangoro 2014a | Monthly | Self reporting Mean number of bottles issued to each household | Unclear | Unclear |
| Sluydts 2016 | Non‐periodic | Self reporting Observational studies | Unclear | Unclear |
Comparison 1 Topical repellent compared to placebo or no treatment, Outcome 7 Adherence to the intervention.
| Study | Follow up length | Method | Unit | Description of adverse events | Intervention arm | Control arm |
| Hill 2007 | Monthly surveys | Interview | Even per household | None reported | 0/424 | 0/436 |
| McGready 2001 | Weekly surveys | Interview | Unclear | 6% of the participants reported skin warming sensation. | Unclear | Unclear |
| Rowland 2004 | End of trial | Interviews and questionnaires to 20 households from each treatment arm | Event per household | Skin irritation | 1/20 | 0/20 |
| Sluydts 2016 | Unclear | Unclear | Unclear | Not described | 41/unclear | |
Comparison 1 Topical repellent compared to placebo or no treatment, Outcome 8 Adverse events.

Comparison 2 ITC compared to placebo or no treatment, Outcome 1 Clinical malaria caused by Plasmodium falciparum.
Comparison 2 ITC compared to placebo or no treatment, Outcome 2 Clinical malaria caused by Plasmodium vivax.
| Study | Follow up length | Method | Unit | Description of adverse events | Intervention arm | Control arm |
| Rowland 1999 | 16 weeks | Interview | Event per household | None reported | 0/438 | 0/387 |
| Soto 1995 | End of trial | Interview | Event per participant | Skin irritation | 2/229 | 0/229 |
Comparison 2 ITC compared to placebo or no treatment, Outcome 3 Adverse events.

Comparison 3 Spatial repellents compared to placebo or no treatment, Outcome 1 Plasmodium spp. parasitaemia.
| Study | Follow up length | Method | Compliance control arms | Compliance treatment arms |
| Hill 2014 | monthly survey | Self reporting Counting of empty coil boxes | No treatment arm: 89.3% LLINs only arm: 97.8% | Repellent coils arm: 98.6% Repellent coils + LLINs arm: 98.5% |
Comparison 3 Spatial repellents compared to placebo or no treatment, Outcome 2 Adherence to the intervention.
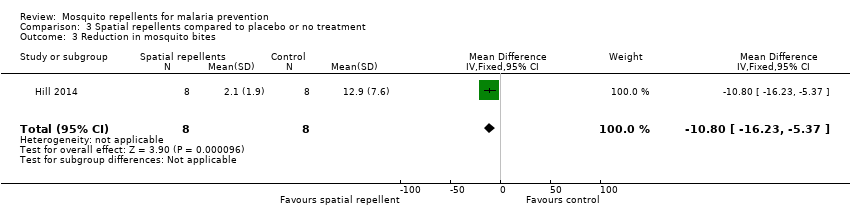
Comparison 3 Spatial repellents compared to placebo or no treatment, Outcome 3 Reduction in mosquito bites.
| Study | Follow‐up length | Method | Unit | Description of adverse events | Intervention arm | Control arm |
| Syafruddin 2014 | 6 months | Interviews | Random spot‐checks | None described | None reported | None reported |
Comparison 3 Spatial repellents compared to placebo or no treatment, Outcome 4 Adverse events.
| Topical repellents compared to placebo or no treatment for malaria prevention | ||||||
| Patient or population: malaria prevention | ||||||
| Outcomes | Anticipated absolute effects* (95% CI) | Relative effect | Number of participants | Certainty of the evidence | Comments | |
| Risk with Placebo or no treatment | Risk with Topical repellents | |||||
| Clinical malaria: P. falciparum | 39 per 1000 | 25 per 1000 | RR 0.65 | 4450 | ⊕⊝⊝⊝ Due to risk of bias, inconsistency and imprecision | We do not know if topical repellents have an effect on malaria cases caused by P. falciparum. We have very little confidence in the effect estimate. The true effect is likely to be substantially different from the estimate of effect. |
| Parasitaemia: P. falciparum | 15 per 1000 | 12 per 1000 | RR 0.84 | 13,310 | ⊕⊕⊝⊝ Due to risk of bias and imprecision | Topical repellents may or may not have a protective effect against P. falciparum parasitaemia. Our confidence in the effect estimate is limited. The true effect may be substantially different from the estimation of the effect. |
| Clinical malaria: P. vivax | 36 per 1000 | 48 per 1000 | RR 1.32 | 3996 | ⊕⊕⊝⊝ Due to risk of bias and imprecision | Topical repellents may increase the number of clinical cases caused by P. vivax. Our confidence in the effect estimate is limited. The true effect may be substantially different from the estimation of the effect. |
| Parasitaemia: P. vivax | 18 per 1000 | 19 per 1000 | RR 1.07 | 9434 | ⊕⊕⊝⊝ Due to risk of bias and imprecision | Topical repellents may or may not have a protective effect against P. vivax parasitaemia Our confidence in the effect estimation is limited. The true effect may be substantially different from the estimation of the effect. |
| *The risk in the intervention group (and its 95% CI) is based on the assumed risk in the comparison group and the relative effect of the intervention (and its 95% CI). | ||||||
| GRADE Working Group grades of evidence | ||||||
| 1Downgraded by 1 for risk of bias: Sangoro 2014a used alternate allocation and reported a baseline imbalance; random sequence generation and allocation concealment were not described by Rowland 2004; and Sluydts 2016 did not have a placebo so the intervention was not blinded. | ||||||
| ITC compared to placebo or no treatment for malaria prevention | ||||||
| Patient or population: malaria prevention | ||||||
| Outcomes | Anticipated absolute effects* (95% CI) | Relative effect | Number of participants | Certainty of the evidence | Comments | |
| Risk with placebo or no treatment | Risk with ITC | |||||
| Clinical malaria: P. falciparum | 35 per 1000 | 17 per 1000 | RR 0.49 | 997 | ⊕⊕⊝⊝ Due to risk of bias and imprecision | Insecticide‐treating clothing may have a protective effect against malaria caused by P. falciparum. Our confidence in the effect estimate is limited. The true effect may be substantially different from the estimate of the effect. |
| Clinical malaria: P. vivax | 116 per 1000 | 74 per 1000 | RR 0.64 | 997 | ⊕⊕⊝⊝ Due to risk of bias and imprecision | Insecticide‐treated clothing may have a protective effect against malaria caused by P. vivax. Our confidence in the effect estimate is limited. The true effect may be substantially different from the estimate of the effect. |
| *The risk in the intervention group (and its 95% CI) is based on the assumed risk in the comparison group and the relative effect of the intervention (and its 95% CI). | ||||||
| GRADE Working Group grades of evidence | ||||||
| 1Downgraded by 1 for risk of bias: Soto 1995 did not describe how randomization and allocation concealment was assured; and had unclear risk of baseline bias because did not report how long soldiers in each arm were deployed to malaria endemic areas. Rowland 1999 did not describe the method used for allocation concealment. | ||||||
| Spatial repellents compared to placebo or no treatment for malaria prevention | ||||||
| Patient or population: malaria prevention | ||||||
| Outcomes | Anticipated absolute effects* (95% CI) | Relative effect | Number of participants | Certainty of the evidence | Comments | |
| Risk with placebo or no treatment | Risk with Spatial repellents | |||||
| Parasitaemia Plasmodium spp. | 10 per 1000 | 2 per 1000 (0 to 18) | RR 0.24 (0.03 to 1.72) | 6683 (2 studies) | ⊕⊝⊝⊝ Due to risk of bias, imprecision and inconsistency | We do not know if spatial repellents protect against malaria. We have very little confidence in the effect estimate. The true effect is likely to be substantially different from the estimate of effect. |
| *The risk in the intervention group (and its 95% CI) is based on the assumed risk in the comparison group and the relative effect of the intervention (and its 95% CI). | ||||||
| GRADE Working Group grades of evidence | ||||||
| 1Downgraded by 1 for risk of bias: Hill 2014 was not blinded. | ||||||
| Study | Intervention group | Design | Method of assessing compliance | Unit | Follow‐up time | Compliance level1 | |
| Intervention arm | Placebo arm | ||||||
| Topical repellent | cRCT | Self‐reported compliance. Self‐reported combined with an estimation of the proportion of lotion used by the participant by weighing the returned bottles. | Percentage of self‐reported participants/night that adhered to the assigned treatment in a given month. Participants who reported to have used the repellent and confirmed by the weight of returned bottles. | Monthly surveys | Moderate: 61.3% | Moderate: 62.2% | |
| Topical repellent | cRCT | Self‐reported compliance through questionnaires combined with an estimation of the amount used by weighing the returned bottles, and verified by unannounced “sniff checks”. | Cumulative percentage of compliant households per month. A household was considered non‐compliant if they had reported to have not used the repellent 3 or more nights in a month or had more than 30 ml left in the bottle. | Monthly surveys | High: 98.5% (119/8164) | High: 98.5% (110/7876) | |
| Spatial repellent | cRCT | Daily recordings of compliance per household were reported by village leaders. Compliance was further confirmed by counting the number of empty mosquito coil boxes in each house. | Cumulative percentage of compliant households per month. A household was considered non‐compliant if it did not use the coils for 3 days or longer in one month. | Monthly surveys | High No treatment arm: 89.3% LLIN arm: 97.8% | High Repellent coils arm: 98.6% Repellent coils + LLINs: 98.5% | |
| Topical repellent | RCT | Weekly self‐reporting and random spot checks. | Cumulative percentage of compliant participants per week. | Weekly surveys | Unclear Compliance was reported to be similar across treatment arms (P = 0.24) but was not reported for each arm. Self‐reported compliance: 90.5% (87,715/96,955) Compliance measured by spot checks: 84.6% (1918/2267) | ||
| Topical repellent | cRCT | Self‐reported compliance through questionnaires combined with an estimation of the amount used by counting the empty returned bottles. | Mean number of bottles of repellent issued to each household per month. | Monthly surveys | Unclear Authors stated that self‐reported data was unreliable so they used the data from the empty bottles to estimate compliance. Compliance was poorly reported. The authors reported mean number of bottles issued per household per month rather than estimating the compliance level for each treatment arm: Repellent arm: 6.73 bottles (95% CI 6.51 to 6.95) Placebo arm: 6.92 bottles (95% CI 6.68 to 7.16) | ||
| Topical repellent | cRCT | Self‐reported compliance was assessed using questionnaires during 3 surveys in October 2012, March 2013 and October 2013. The repellent consumption rate was measured per family every 2 weeks during the repellent distribution by visual inspection of the leftover repellent divided into categories (for example, empty, half full, full). A social science study was done to assess the acceptability and use of repellents in 10 selected clusters. | Unit of measurement was not clearly defined. Self‐reported compliance is likely the percentage of compliant households during the survey period but was not defined in the article. The repellent consumption rate was not reported. Social study reported percentage of participants observed to comply with the application of the repellent from a small selection of 10 clusters in the intervention group. | Non‐periodic surveys (in October 2012, March 2013 and October 2013) along the duration of the trial. | Self‐reported compliance was reported around 70%. However, observational studies reported compliance between 6% and 15% . | No placebo | |
| 1Levels of compliance: high: > 80%; moderate: 50% to 79%; low: < 50%. | |||||||
| Study | Intervention | Design | Transmission intensity1,2 | Region | Main malaria vectors | Biting times | Efficacy of the intervention at repelling Anophelines tested at baseline? (V/N) |
| Topical repellent | cRCT | Hypoendemic 0.83% P. falciparum 0.4% P. vivax Measured through active case detection | South East Asia ‐ Laos | Anopheles dirus An. minimus An. maculatus | From 18:00 to 2:00 with peak biting time from 21.00 to 02.00. | No | |
| Topical repellent | cRCT | Hypoendemic 0.31% P. falciparum Measured through active case detection | South America: Bolivian Amazon Region | An. darlingi | Peak biting activity between 8 p.m. and 10 p.m. | Yes | |
| Spatial repellent | cRCT | Hypoendemic 0.06% P. falciparum 0.28% P. vivax Measured through active case detection | South East Asia: Yunnan Province of China | An. sinensis An. minimus An. kochi An. splendidus An barbirostris An. vagus An. jeyporiensis An. annularis An. philippinsis An. tessallatus An. maculatus An. barbumbrosus An. dirus An culicifacies | Given the diversity of vectors in the area the biting activity occurs from early evening extending to later in the night. | Yes | |
| Topical repellent | RCT | Mesoendemic 11.4% P. falciparum 11.8% P. vivax Measured through active case detection | South East Asia: Thailand | Not reported | Not reported | No | |
| Insecticide treated clothing | cRCT | Holoendemic 20.7% P. falciparum 17.6% P. vivax Measured through passive case detection | North Western Pakistan | An. nigerrimus An. subpictus An. stephensi | Not reported | Yes | |
| Topical repellent | cRCT | Mesoendemic 8.9% P. falciparum 11.7% P. vivax Measured through passive case detection | Asia: Pakistan | An. culicifacies An. stephensi An. nigerrimus An. pulcherrimus | Mosquito biting starts after dusk, peaks around 9 p.m. to 11 p.m. then declines gradually through the night. | Yes | |
| Topical repellent | cRCT | Mesoendemic 6.22% P. falciparum Measured through passive case detection | East Africa: Tanzania | An gambiae s.s. An arabiensis | Biting activity starts early evening and continues into the later hours of the night. | Yes | |
| Topical repellent | cRCT | Hypoendemic 1.33% P. falciparum 1.85% P. vivax Measured through active case detection | Southeast Asia: Cambodia | An. dirus s.s. An. maculatus An barbirostris An. minimus s.s. An. sawadwongporni An aconitus | Early evening biting was common. | Yes | |
| Insecticide‐treated clothing | RCT | Mesoendemic for P.vivax and Hypoenemic for P. falciparum 3.4% P. falciparum 10.4% P. vivax Measured through passive case detection | South America: Colombia | Unclear | Not reported | No | |
| Spatial repellent | cRCT | Holoendemic for Plasmodium spp. 70.1% Plasmodium spp. Measured through passive case detection | Asia: Indonesia | An. sundaicus An. subpictus s.l. An. indefinitus An. vagus An. barbirostris An. annularis An. maculatus An. aconitus An. kochi An. tessellatus | Early evening biting was common with peaks between 18:00 and 20:00 continuing throughout the night. The high diversity of vectors also reflected diverse biting patterns. | Yes | |
| 1Transmission intensity: holo‐endemic: malaria prevalence > 15%; meso‐endemic: malaria prevalence 5% to 15%; and hypo‐endemic: malaria prevalence < 5%. | |||||||
| Study | Intervention | Design | Diagnostic method | Validated | Plasmodium species in the region | Participants screened and cleared for vivax (Y/N) |
| Topical repellent | cRCT | mRDT | Yes, by PCR | 80% P. falciparum 20% P. vivax | No | |
| Topical repellent | cRCT | mRDT | No | P. falciparum P. vivax | No1 | |
| Spatial repellent | cRCT | mRDTs | Yes, positive RDTs were validated through thick blood slide. | 32% P. falciparum 58% P. vivax | Yes | |
| Topical repellent | RCT | Blood smear | No | P. falciparum P. vivax | No | |
| Insecticide‐treated clothing | cRCT | Blood smear | No | P. falciparum P. vivax | No | |
| Topical repellent | cRCT | Blood smear | No | P. falciparum P. vivax | No | |
| Topical repellent | cRCT | mRDT | Unclear if microscopy was used for validation of positive mRDTs | Mainly P. falciparum | No1 | |
| Topical repellent | cRCT | PCR | No | P. falciparum P. vivax | No | |
| Insecticide‐treated clothing | RCT | Blood smear | No | P. falciparum P. vivax | No | |
| Spatial repellent | cRCT | Blood smear | No | P. falciparum P. vivax | Yes | |
| 1mRDT was only specific for P. falciparum. | ||||||
| Outcome or subgroup title | No. of studies | No. of participants | Statistical method | Effect size |
| 1 Clinical malaria caused by Plasmodium falciparum Show forest plot | 3 | 4447 | Risk Ratio (M‐H, Random, 95% CI) | 0.65 [0.40, 1.07] |
| 1.1 Without LLINs | 1 | 869 | Risk Ratio (M‐H, Random, 95% CI) | 0.40 [0.23, 0.71] |
| 1.2 With LLINS | 2 | 3578 | Risk Ratio (M‐H, Random, 95% CI) | 0.84 [0.55, 1.27] |
| 2 Plasmodium falciparum parasitaemia Show forest plot | 4 | 13310 | Risk Ratio (M‐H, Fixed, 95% CI) | 0.84 [0.64, 1.12] |
| 2.1 Without LLINs | 1 | 897 | Risk Ratio (M‐H, Fixed, 95% CI) | 0.78 [0.53, 1.16] |
| 2.2 With LLINs | 3 | 12413 | Risk Ratio (M‐H, Fixed, 95% CI) | 0.91 [0.60, 1.38] |
| 3 Clinical malaria caused by Plasmodium vivax Show forest plot | 2 | 3996 | Risk Ratio (M‐H, Fixed, 95% CI) | 1.32 [0.99, 1.76] |
| 3.1 Without LLINs | 1 | 869 | Risk Ratio (M‐H, Fixed, 95% CI) | 1.42 [1.02, 1.99] |
| 3.2 With LLINs | 1 | 3127 | Risk Ratio (M‐H, Fixed, 95% CI) | 1.11 [0.64, 1.94] |
| 4 Plasmodium vivax parasitaemia Show forest plot | 3 | 9589 | Risk Ratio (M‐H, Fixed, 95% CI) | 1.08 [0.81, 1.43] |
| 4.1 Without LLINs | 1 | 897 | Risk Ratio (M‐H, Fixed, 95% CI) | 0.98 [0.68, 1.40] |
| 4.2 With LLINs | 2 | 8692 | Risk Ratio (M‐H, Fixed, 95% CI) | 1.24 [0.78, 1.97] |
| 5 Anaemia Show forest plot | 1 | 587 | Risk Ratio (M‐H, Fixed, 95% CI) | 1.06 [0.91, 1.23] |
| 6 All‐cause fever Show forest plot | 1 | 3496 | Risk Ratio (M‐H, Fixed, 95% CI) | 0.44 [0.35, 0.55] |
| 7 Adherence to the intervention Show forest plot | Other data | No numeric data | ||
| 8 Adverse events Show forest plot | Other data | No numeric data | ||
| Outcome or subgroup title | No. of studies | No. of participants | Statistical method | Effect size |
| 1 Clinical malaria caused by Plasmodium falciparum Show forest plot | 2 | Risk Ratio (Fixed, 95% CI) | 0.49 [0.29, 0.83] | |
| 2 Clinical malaria caused by Plasmodium vivax Show forest plot | 2 | Risk Ratio (Fixed, 95% CI) | 0.64 [0.40, 1.01] | |
| 3 Adverse events Show forest plot | Other data | No numeric data | ||
| Outcome or subgroup title | No. of studies | No. of participants | Statistical method | Effect size |
| 1 Plasmodium spp. parasitaemia Show forest plot | 2 | Risk Ratio (Random, 95% CI) | 0.24 [0.03, 1.72] | |
| 2 Adherence to the intervention Show forest plot | Other data | No numeric data | ||
| 3 Reduction in mosquito bites Show forest plot | 1 | 16 | Mean Difference (IV, Fixed, 95% CI) | ‐10.8 [‐16.23, ‐5.37] |
| 4 Adverse events Show forest plot | Other data | No numeric data | ||