Repelentes de mosquitos para la prevención del paludismo
Información
- DOI:
- https://doi.org/10.1002/14651858.CD011595.pub2Copiar DOI

- Base de datos:
-
- Cochrane Database of Systematic Reviews
- Versión publicada:
-
- 06 febrero 2018see what's new
- Tipo:
-
- Intervention
- Etapa:
-
- Review
- Grupo Editorial Cochrane:
-
Grupo Cochrane de Enfermedades infecciosas
- Clasificada:
-
- Actualizada
All studies incorporated from most recent search
All eligible published studies found in the last search (26 Jun, 2017) were included and four ongoing studies have been identified (see 'Characteristics of ongoing studies' section)Evaluada: 2 April 2019
- Actualizada
- Copyright:
-
- Copyright © 2018 The Authors. Cochrane Database of Systematic Reviews published by John Wiley & Sons, Ltd. on behalf of The Cochrane Collaboration.
- This is an open access article under the terms of the Creative Commons Attribution‐Non‐Commercial Licence, which permits use, distribution and reproduction in any medium, provided the original work is properly cited and is not used for commercial purposes.
Cifras del artículo
Altmetric:
Citado por:
Autores
Contributions of authors
MM, MV, and SJM developed the protocol with statistical input from MR. MM and MV screened search outputs, selected trials for inclusion, extracted the data, assessed risk of bias, analysed the data and prepared the draft manuscript. MR provided statistical support. CL and SJM critically engaged with the manuscript and provided comments.
SJM is an investigator on two of the studies included in this review; however the author was not involved in decisions regarding inclusion, assessment of risk of bias, data extraction or interpretation of the results of this trial. MM and MK evaluated the trials and conducted all tasks in regard to these studies with no input from SJM.
All review authors have seen and approved the final manuscript.
Sources of support
Internal sources
-
Cochrane Infectious Diseases Group, UK.
-
Liverpool School of Tropical Medicine, UK.
External sources
-
University of Notre Dame, USA.
Award number 261655. Salary of MM and SM.
-
Department of International Development (DFID), UK.
Grant: 5242
Declarations of interest
MM, MK, MR, and CL have no conflicts of interest in any way related to the content of the review. They have no financial interests in relation to repellents for mosquito avoidance, either in the form of participations or incomes from commercial activities, patents, or from any form of sponsorship.
SJM has received salary coverage from BMGF research grant and PSI for two studies included in this review. However she did not have any role in deciding inclusion, assessment of risk of bias, data extraction, or interpretation of the results of those trials. In addition, SJM currently holds a research grant funded by the Deployed War Fighters Protection Fund evaluating permethrin‐treated clothing, which has been included in the review as an on‐going study. SJM declares no further known conflicts of interest.
Acknowledgements
We are indebted to the mentorship of Prof. Paul Garner of the Liverpool School of Tropical Medicine.
This work was partly supported through a grant from the Global Malaria Programme, World Health Organization.
MM was supported by a fellowship offered by the Effective Health Care Research Consortium, supported by Cochrane South Africa and the South African Medical Research Council, to attend a five‐day workshop in Cape Town to work on this review. This Consortium and the editorial base for the Cochrane Infectious Diseases Group is funded by UKaid from the UK government for the benefit of low‐ and middle‐income countries (Grant: 5242). The views expressed in this publication do not necessarily reflect UK government policy.
Version history
| Published | Title | Stage | Authors | Version |
| 2018 Feb 06 | Mosquito repellents for malaria prevention | Review | Marta F Maia, Merav Kliner, Marty Richardson, Christian Lengeler, Sarah J Moore | |
| 2015 Apr 01 | Mosquito repellents for malaria prevention | Protocol | Marta F Maia, Merav Kliner, Marty Richardson, Christian Lengeler, Sarah J Moore | |
Differences between protocol and review
With regard to P. vivax infections, we had originally described in the protocol that data onP. vivax from studies that had not cleared parasites at start would be excluded. However only two of the included studies, which both focused on spatial repellents, cleared parasites at start. If a study undertook a proper randomization, recrudescent infections would be similar between treatment arms. For this reason we decided to include data on P. vivax regardless of whether infections had been cleared at start or not.
We also decided to subgroup by use or not of LLINs as a co‐intervention rather than by endemicity level, compliance and diagnostic methods, as described in the protocol. This was done because we believe there was heterogeneity between studies that included and did not include LLINs as co‐interventions. Also, given that current malaria control programmes all incorporate LLINs, we believe policy makers are mostly interested in the combined effect of LLINs with topical repellents rather than these on their own.
Keywords
MeSH
Medical Subject Headings (MeSH) Keywords
Medical Subject Headings Check Words
Animals;
PICO

Study flow diagram.

'Risk of bias' summary: review authors' judgements about each 'Risk of bias' item for each included study.

Forest plot of comparison: 1 Topical repellent compared to placebo or no treatment, outcome: 1.1 Clinical malaria caused by P. falciparum.

Forest plot of comparison: 1 Topical repellent compared to placebo or no treatment, outcome: 1.2 P. falciparum parasitaemia.

Forest plot of comparison: 1 Topical repellent compared to placebo or no treatment, outcome: 1.3 Clinical malaria caused by P. vivax.

Forest plot of comparison: 1 Topical repellent compared to placebo or no treatment, outcome: 1.4 P. vivax parasitaemia.
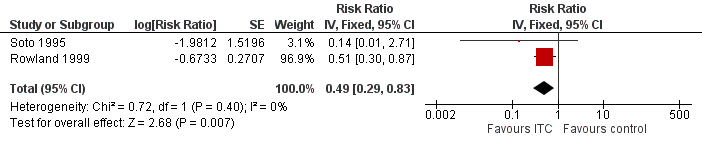
Forest plot of comparison: 2 ITC compared to placebo or no treatment, outcome: 2.1 Clinical malaria caused by P. falciparum.

Forest plot of comparison: 2 ITC compared to placebo or no treatment, outcome: 2.2 Clinical malaria caused by P. vivax.

Forest plot of comparison: 3 Spatial repellents compared to placebo or no treatment, outcome: 3.1 Plasmodium spp. parasitaemia.
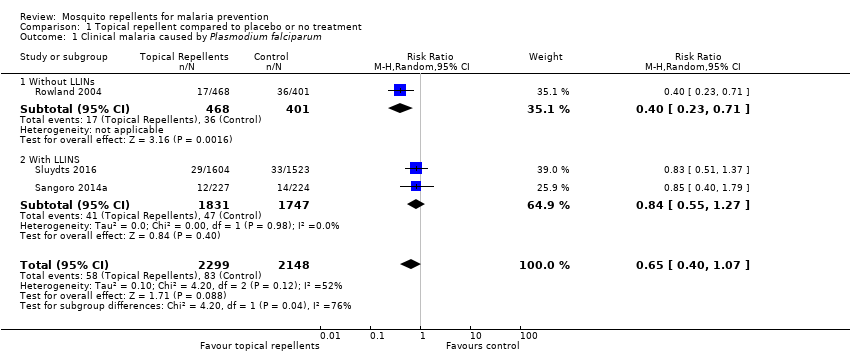
Comparison 1 Topical repellent compared to placebo or no treatment, Outcome 1 Clinical malaria caused by Plasmodium falciparum.

Comparison 1 Topical repellent compared to placebo or no treatment, Outcome 2 Plasmodium falciparum parasitaemia.
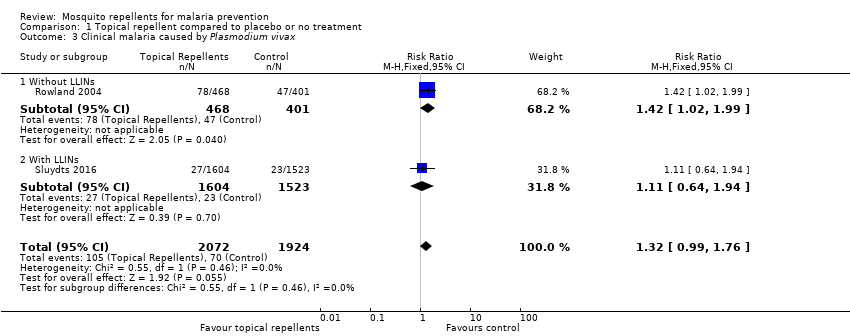
Comparison 1 Topical repellent compared to placebo or no treatment, Outcome 3 Clinical malaria caused by Plasmodium vivax.

Comparison 1 Topical repellent compared to placebo or no treatment, Outcome 4 Plasmodium vivax parasitaemia.

Comparison 1 Topical repellent compared to placebo or no treatment, Outcome 5 Anaemia.
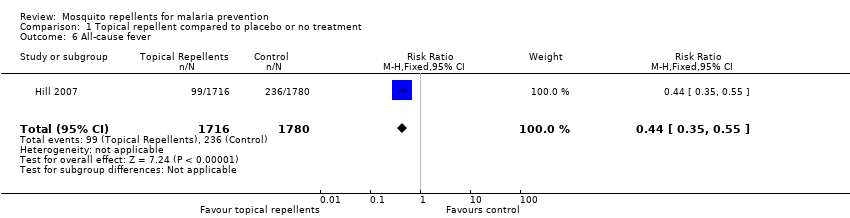
Comparison 1 Topical repellent compared to placebo or no treatment, Outcome 6 All‐cause fever.
| Study | Follow up length | Method | Compliance repellent arm | Compliance treatment arm |
| Chen‐Hussey 2013 | Monthly | Self reporting Estimating weight of repellent bottles. | 61.3% | 62.2% |
| Hill 2007 | Monthly | Self reporting Random unanounced "sniff check" Estimating weight of repellent bottles. | 98.5% | 98.5% |
| McGready 2001 | Weekly | Self reporting Random spot checks | Unclear | Unclear |
| Sangoro 2014a | Monthly | Self reporting Mean number of bottles issued to each household | Unclear | Unclear |
| Sluydts 2016 | Non‐periodic | Self reporting Observational studies | Unclear | Unclear |
Comparison 1 Topical repellent compared to placebo or no treatment, Outcome 7 Adherence to the intervention.
| Study | Follow up length | Method | Unit | Description of adverse events | Intervention arm | Control arm |
| Hill 2007 | Monthly surveys | Interview | Even per household | None reported | 0/424 | 0/436 |
| McGready 2001 | Weekly surveys | Interview | Unclear | 6% of the participants reported skin warming sensation. | Unclear | Unclear |
| Rowland 2004 | End of trial | Interviews and questionnaires to 20 households from each treatment arm | Event per household | Skin irritation | 1/20 | 0/20 |
| Sluydts 2016 | Unclear | Unclear | Unclear | Not described | 41/unclear | |
Comparison 1 Topical repellent compared to placebo or no treatment, Outcome 8 Adverse events.
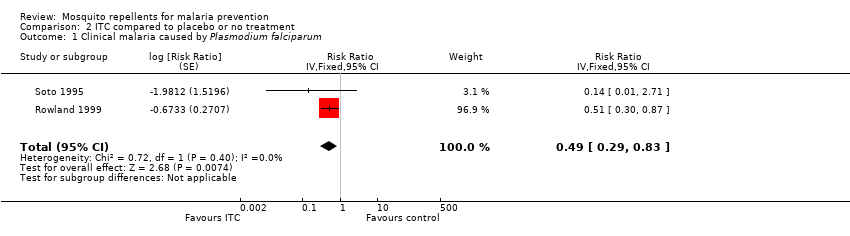
Comparison 2 ITC compared to placebo or no treatment, Outcome 1 Clinical malaria caused by Plasmodium falciparum.
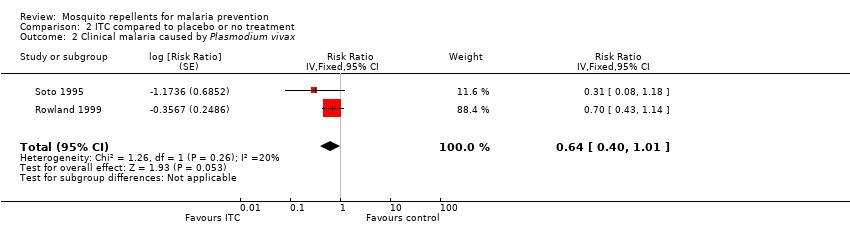
Comparison 2 ITC compared to placebo or no treatment, Outcome 2 Clinical malaria caused by Plasmodium vivax.
| Study | Follow up length | Method | Unit | Description of adverse events | Intervention arm | Control arm |
| Rowland 1999 | 16 weeks | Interview | Event per household | None reported | 0/438 | 0/387 |
| Soto 1995 | End of trial | Interview | Event per participant | Skin irritation | 2/229 | 0/229 |
Comparison 2 ITC compared to placebo or no treatment, Outcome 3 Adverse events.

Comparison 3 Spatial repellents compared to placebo or no treatment, Outcome 1 Plasmodium spp. parasitaemia.
| Study | Follow up length | Method | Compliance control arms | Compliance treatment arms |
| Hill 2014 | monthly survey | Self reporting Counting of empty coil boxes | No treatment arm: 89.3% LLINs only arm: 97.8% | Repellent coils arm: 98.6% Repellent coils + LLINs arm: 98.5% |
Comparison 3 Spatial repellents compared to placebo or no treatment, Outcome 2 Adherence to the intervention.
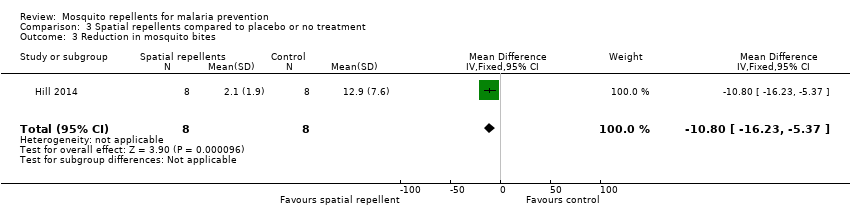
Comparison 3 Spatial repellents compared to placebo or no treatment, Outcome 3 Reduction in mosquito bites.
| Study | Follow‐up length | Method | Unit | Description of adverse events | Intervention arm | Control arm |
| Syafruddin 2014 | 6 months | Interviews | Random spot‐checks | None described | None reported | None reported |
Comparison 3 Spatial repellents compared to placebo or no treatment, Outcome 4 Adverse events.
| Topical repellents compared to placebo or no treatment for malaria prevention | ||||||
| Patient or population: malaria prevention | ||||||
| Outcomes | Anticipated absolute effects* (95% CI) | Relative effect | Number of participants | Certainty of the evidence | Comments | |
| Risk with Placebo or no treatment | Risk with Topical repellents | |||||
| Clinical malaria: P. falciparum | 39 per 1000 | 25 per 1000 | RR 0.65 | 4450 | ⊕⊝⊝⊝ Due to risk of bias, inconsistency and imprecision | We do not know if topical repellents have an effect on malaria cases caused by P. falciparum. We have very little confidence in the effect estimate. The true effect is likely to be substantially different from the estimate of effect. |
| Parasitaemia: P. falciparum | 15 per 1000 | 12 per 1000 | RR 0.84 | 13,310 | ⊕⊕⊝⊝ Due to risk of bias and imprecision | Topical repellents may or may not have a protective effect against P. falciparum parasitaemia. Our confidence in the effect estimate is limited. The true effect may be substantially different from the estimation of the effect. |
| Clinical malaria: P. vivax | 36 per 1000 | 48 per 1000 | RR 1.32 | 3996 | ⊕⊕⊝⊝ Due to risk of bias and imprecision | Topical repellents may increase the number of clinical cases caused by P. vivax. Our confidence in the effect estimate is limited. The true effect may be substantially different from the estimation of the effect. |
| Parasitaemia: P. vivax | 18 per 1000 | 19 per 1000 | RR 1.07 | 9434 | ⊕⊕⊝⊝ Due to risk of bias and imprecision | Topical repellents may or may not have a protective effect against P. vivax parasitaemia Our confidence in the effect estimation is limited. The true effect may be substantially different from the estimation of the effect. |
| *The risk in the intervention group (and its 95% CI) is based on the assumed risk in the comparison group and the relative effect of the intervention (and its 95% CI). | ||||||
| GRADE Working Group grades of evidence | ||||||
| 1Downgraded by 1 for risk of bias: Sangoro 2014a used alternate allocation and reported a baseline imbalance; random sequence generation and allocation concealment were not described by Rowland 2004; and Sluydts 2016 did not have a placebo so the intervention was not blinded. | ||||||
| ITC compared to placebo or no treatment for malaria prevention | ||||||
| Patient or population: malaria prevention | ||||||
| Outcomes | Anticipated absolute effects* (95% CI) | Relative effect | Number of participants | Certainty of the evidence | Comments | |
| Risk with placebo or no treatment | Risk with ITC | |||||
| Clinical malaria: P. falciparum | 35 per 1000 | 17 per 1000 | RR 0.49 | 997 | ⊕⊕⊝⊝ Due to risk of bias and imprecision | Insecticide‐treating clothing may have a protective effect against malaria caused by P. falciparum. Our confidence in the effect estimate is limited. The true effect may be substantially different from the estimate of the effect. |
| Clinical malaria: P. vivax | 116 per 1000 | 74 per 1000 | RR 0.64 | 997 | ⊕⊕⊝⊝ Due to risk of bias and imprecision | Insecticide‐treated clothing may have a protective effect against malaria caused by P. vivax. Our confidence in the effect estimate is limited. The true effect may be substantially different from the estimate of the effect. |
| *The risk in the intervention group (and its 95% CI) is based on the assumed risk in the comparison group and the relative effect of the intervention (and its 95% CI). | ||||||
| GRADE Working Group grades of evidence | ||||||
| 1Downgraded by 1 for risk of bias: Soto 1995 did not describe how randomization and allocation concealment was assured; and had unclear risk of baseline bias because did not report how long soldiers in each arm were deployed to malaria endemic areas. Rowland 1999 did not describe the method used for allocation concealment. | ||||||
| Spatial repellents compared to placebo or no treatment for malaria prevention | ||||||
| Patient or population: malaria prevention | ||||||
| Outcomes | Anticipated absolute effects* (95% CI) | Relative effect | Number of participants | Certainty of the evidence | Comments | |
| Risk with placebo or no treatment | Risk with Spatial repellents | |||||
| Parasitaemia Plasmodium spp. | 10 per 1000 | 2 per 1000 (0 to 18) | RR 0.24 (0.03 to 1.72) | 6683 (2 studies) | ⊕⊝⊝⊝ Due to risk of bias, imprecision and inconsistency | We do not know if spatial repellents protect against malaria. We have very little confidence in the effect estimate. The true effect is likely to be substantially different from the estimate of effect. |
| *The risk in the intervention group (and its 95% CI) is based on the assumed risk in the comparison group and the relative effect of the intervention (and its 95% CI). | ||||||
| GRADE Working Group grades of evidence | ||||||
| 1Downgraded by 1 for risk of bias: Hill 2014 was not blinded. | ||||||
| Study | Intervention group | Design | Method of assessing compliance | Unit | Follow‐up time | Compliance level1 | |
| Intervention arm | Placebo arm | ||||||
| Topical repellent | cRCT | Self‐reported compliance. Self‐reported combined with an estimation of the proportion of lotion used by the participant by weighing the returned bottles. | Percentage of self‐reported participants/night that adhered to the assigned treatment in a given month. Participants who reported to have used the repellent and confirmed by the weight of returned bottles. | Monthly surveys | Moderate: 61.3% | Moderate: 62.2% | |
| Topical repellent | cRCT | Self‐reported compliance through questionnaires combined with an estimation of the amount used by weighing the returned bottles, and verified by unannounced “sniff checks”. | Cumulative percentage of compliant households per month. A household was considered non‐compliant if they had reported to have not used the repellent 3 or more nights in a month or had more than 30 ml left in the bottle. | Monthly surveys | High: 98.5% (119/8164) | High: 98.5% (110/7876) | |
| Spatial repellent | cRCT | Daily recordings of compliance per household were reported by village leaders. Compliance was further confirmed by counting the number of empty mosquito coil boxes in each house. | Cumulative percentage of compliant households per month. A household was considered non‐compliant if it did not use the coils for 3 days or longer in one month. | Monthly surveys | High No treatment arm: 89.3% LLIN arm: 97.8% | High Repellent coils arm: 98.6% Repellent coils + LLINs: 98.5% | |
| Topical repellent | RCT | Weekly self‐reporting and random spot checks. | Cumulative percentage of compliant participants per week. | Weekly surveys | Unclear Compliance was reported to be similar across treatment arms (P = 0.24) but was not reported for each arm. Self‐reported compliance: 90.5% (87,715/96,955) Compliance measured by spot checks: 84.6% (1918/2267) | ||
| Topical repellent | cRCT | Self‐reported compliance through questionnaires combined with an estimation of the amount used by counting the empty returned bottles. | Mean number of bottles of repellent issued to each household per month. | Monthly surveys | Unclear Authors stated that self‐reported data was unreliable so they used the data from the empty bottles to estimate compliance. Compliance was poorly reported. The authors reported mean number of bottles issued per household per month rather than estimating the compliance level for each treatment arm: Repellent arm: 6.73 bottles (95% CI 6.51 to 6.95) Placebo arm: 6.92 bottles (95% CI 6.68 to 7.16) | ||
| Topical repellent | cRCT | Self‐reported compliance was assessed using questionnaires during 3 surveys in October 2012, March 2013 and October 2013. The repellent consumption rate was measured per family every 2 weeks during the repellent distribution by visual inspection of the leftover repellent divided into categories (for example, empty, half full, full). A social science study was done to assess the acceptability and use of repellents in 10 selected clusters. | Unit of measurement was not clearly defined. Self‐reported compliance is likely the percentage of compliant households during the survey period but was not defined in the article. The repellent consumption rate was not reported. Social study reported percentage of participants observed to comply with the application of the repellent from a small selection of 10 clusters in the intervention group. | Non‐periodic surveys (in October 2012, March 2013 and October 2013) along the duration of the trial. | Self‐reported compliance was reported around 70%. However, observational studies reported compliance between 6% and 15% . | No placebo | |
| 1Levels of compliance: high: > 80%; moderate: 50% to 79%; low: < 50%. | |||||||
| Study | Intervention | Design | Transmission intensity1,2 | Region | Main malaria vectors | Biting times | Efficacy of the intervention at repelling Anophelines tested at baseline? (V/N) |
| Topical repellent | cRCT | Hypoendemic 0.83% P. falciparum 0.4% P. vivax Measured through active case detection | South East Asia ‐ Laos | Anopheles dirus An. minimus An. maculatus | From 18:00 to 2:00 with peak biting time from 21.00 to 02.00. | No | |
| Topical repellent | cRCT | Hypoendemic 0.31% P. falciparum Measured through active case detection | South America: Bolivian Amazon Region | An. darlingi | Peak biting activity between 8 p.m. and 10 p.m. | Yes | |
| Spatial repellent | cRCT | Hypoendemic 0.06% P. falciparum 0.28% P. vivax Measured through active case detection | South East Asia: Yunnan Province of China | An. sinensis An. minimus An. kochi An. splendidus An barbirostris An. vagus An. jeyporiensis An. annularis An. philippinsis An. tessallatus An. maculatus An. barbumbrosus An. dirus An culicifacies | Given the diversity of vectors in the area the biting activity occurs from early evening extending to later in the night. | Yes | |
| Topical repellent | RCT | Mesoendemic 11.4% P. falciparum 11.8% P. vivax Measured through active case detection | South East Asia: Thailand | Not reported | Not reported | No | |
| Insecticide treated clothing | cRCT | Holoendemic 20.7% P. falciparum 17.6% P. vivax Measured through passive case detection | North Western Pakistan | An. nigerrimus An. subpictus An. stephensi | Not reported | Yes | |
| Topical repellent | cRCT | Mesoendemic 8.9% P. falciparum 11.7% P. vivax Measured through passive case detection | Asia: Pakistan | An. culicifacies An. stephensi An. nigerrimus An. pulcherrimus | Mosquito biting starts after dusk, peaks around 9 p.m. to 11 p.m. then declines gradually through the night. | Yes | |
| Topical repellent | cRCT | Mesoendemic 6.22% P. falciparum Measured through passive case detection | East Africa: Tanzania | An gambiae s.s. An arabiensis | Biting activity starts early evening and continues into the later hours of the night. | Yes | |
| Topical repellent | cRCT | Hypoendemic 1.33% P. falciparum 1.85% P. vivax Measured through active case detection | Southeast Asia: Cambodia | An. dirus s.s. An. maculatus An barbirostris An. minimus s.s. An. sawadwongporni An aconitus | Early evening biting was common. | Yes | |
| Insecticide‐treated clothing | RCT | Mesoendemic for P.vivax and Hypoenemic for P. falciparum 3.4% P. falciparum 10.4% P. vivax Measured through passive case detection | South America: Colombia | Unclear | Not reported | No | |
| Spatial repellent | cRCT | Holoendemic for Plasmodium spp. 70.1% Plasmodium spp. Measured through passive case detection | Asia: Indonesia | An. sundaicus An. subpictus s.l. An. indefinitus An. vagus An. barbirostris An. annularis An. maculatus An. aconitus An. kochi An. tessellatus | Early evening biting was common with peaks between 18:00 and 20:00 continuing throughout the night. The high diversity of vectors also reflected diverse biting patterns. | Yes | |
| 1Transmission intensity: holo‐endemic: malaria prevalence > 15%; meso‐endemic: malaria prevalence 5% to 15%; and hypo‐endemic: malaria prevalence < 5%. | |||||||
| Study | Intervention | Design | Diagnostic method | Validated | Plasmodium species in the region | Participants screened and cleared for vivax (Y/N) |
| Topical repellent | cRCT | mRDT | Yes, by PCR | 80% P. falciparum 20% P. vivax | No | |
| Topical repellent | cRCT | mRDT | No | P. falciparum P. vivax | No1 | |
| Spatial repellent | cRCT | mRDTs | Yes, positive RDTs were validated through thick blood slide. | 32% P. falciparum 58% P. vivax | Yes | |
| Topical repellent | RCT | Blood smear | No | P. falciparum P. vivax | No | |
| Insecticide‐treated clothing | cRCT | Blood smear | No | P. falciparum P. vivax | No | |
| Topical repellent | cRCT | Blood smear | No | P. falciparum P. vivax | No | |
| Topical repellent | cRCT | mRDT | Unclear if microscopy was used for validation of positive mRDTs | Mainly P. falciparum | No1 | |
| Topical repellent | cRCT | PCR | No | P. falciparum P. vivax | No | |
| Insecticide‐treated clothing | RCT | Blood smear | No | P. falciparum P. vivax | No | |
| Spatial repellent | cRCT | Blood smear | No | P. falciparum P. vivax | Yes | |
| 1mRDT was only specific for P. falciparum. | ||||||
| Outcome or subgroup title | No. of studies | No. of participants | Statistical method | Effect size |
| 1 Clinical malaria caused by Plasmodium falciparum Show forest plot | 3 | 4447 | Risk Ratio (M‐H, Random, 95% CI) | 0.65 [0.40, 1.07] |
| 1.1 Without LLINs | 1 | 869 | Risk Ratio (M‐H, Random, 95% CI) | 0.40 [0.23, 0.71] |
| 1.2 With LLINS | 2 | 3578 | Risk Ratio (M‐H, Random, 95% CI) | 0.84 [0.55, 1.27] |
| 2 Plasmodium falciparum parasitaemia Show forest plot | 4 | 13310 | Risk Ratio (M‐H, Fixed, 95% CI) | 0.84 [0.64, 1.12] |
| 2.1 Without LLINs | 1 | 897 | Risk Ratio (M‐H, Fixed, 95% CI) | 0.78 [0.53, 1.16] |
| 2.2 With LLINs | 3 | 12413 | Risk Ratio (M‐H, Fixed, 95% CI) | 0.91 [0.60, 1.38] |
| 3 Clinical malaria caused by Plasmodium vivax Show forest plot | 2 | 3996 | Risk Ratio (M‐H, Fixed, 95% CI) | 1.32 [0.99, 1.76] |
| 3.1 Without LLINs | 1 | 869 | Risk Ratio (M‐H, Fixed, 95% CI) | 1.42 [1.02, 1.99] |
| 3.2 With LLINs | 1 | 3127 | Risk Ratio (M‐H, Fixed, 95% CI) | 1.11 [0.64, 1.94] |
| 4 Plasmodium vivax parasitaemia Show forest plot | 3 | 9589 | Risk Ratio (M‐H, Fixed, 95% CI) | 1.08 [0.81, 1.43] |
| 4.1 Without LLINs | 1 | 897 | Risk Ratio (M‐H, Fixed, 95% CI) | 0.98 [0.68, 1.40] |
| 4.2 With LLINs | 2 | 8692 | Risk Ratio (M‐H, Fixed, 95% CI) | 1.24 [0.78, 1.97] |
| 5 Anaemia Show forest plot | 1 | 587 | Risk Ratio (M‐H, Fixed, 95% CI) | 1.06 [0.91, 1.23] |
| 6 All‐cause fever Show forest plot | 1 | 3496 | Risk Ratio (M‐H, Fixed, 95% CI) | 0.44 [0.35, 0.55] |
| 7 Adherence to the intervention Show forest plot | Other data | No numeric data | ||
| 8 Adverse events Show forest plot | Other data | No numeric data | ||
| Outcome or subgroup title | No. of studies | No. of participants | Statistical method | Effect size |
| 1 Clinical malaria caused by Plasmodium falciparum Show forest plot | 2 | Risk Ratio (Fixed, 95% CI) | 0.49 [0.29, 0.83] | |
| 2 Clinical malaria caused by Plasmodium vivax Show forest plot | 2 | Risk Ratio (Fixed, 95% CI) | 0.64 [0.40, 1.01] | |
| 3 Adverse events Show forest plot | Other data | No numeric data | ||
| Outcome or subgroup title | No. of studies | No. of participants | Statistical method | Effect size |
| 1 Plasmodium spp. parasitaemia Show forest plot | 2 | Risk Ratio (Random, 95% CI) | 0.24 [0.03, 1.72] | |
| 2 Adherence to the intervention Show forest plot | Other data | No numeric data | ||
| 3 Reduction in mosquito bites Show forest plot | 1 | 16 | Mean Difference (IV, Fixed, 95% CI) | ‐10.8 [‐16.23, ‐5.37] |
| 4 Adverse events Show forest plot | Other data | No numeric data | ||