Docelowe ciśnienie tętnicze krwi u starszych osób z nadciśnieniem tętniczym
Referencias
References to studies included in this review
References to studies excluded from this review
References to ongoing studies
Additional references
Characteristics of studies
Characteristics of included studies [ordered by study ID]
| Methods | PROBE study. Presumably multi‐centre (not stated) 4418 randomised and analysed | |
| Participants | Elderly Japanese outpatients 65‐85 years with baseline BP > 160 mmHg | |
| Interventions | 2 years lower BP target (systolic BP < 140 mmHg) versus higher BP target (systolic BP < 160 but ≥ 140 mmHg) Achieved BP at study completion 135.9/74.8 (lower) versus 145.6/78.1 (higher) | |
| Outcomes | The primary endpoint was the combined incidence of cerebrovascular disease (cerebral haemorrhage, cerebral infarction, transient ischaemic attack, and subarachnoid haemorrhage), cardiac and vascular disease (myocardial infarction, angina pectoris requiring hospitalisation, heart failure, sudden death, dissecting aneurysms of the aorta, and occlusive arterial disease), and renal failure (acute or chronic renal failure; doubling of the serum creatinine concentration to a value of 1.5 mg/dL or higher) Cerebrovascular disease was diagnosed based on neurological and radiological examinations. Cardiac and vascular diseases were diagnosed using radiographic, echocardiographic, and biochemical methods in addition to signs and symptoms. Sudden death, defined as death from instantaneous, unanticipated circulatory collapse within 1 h of initial symptoms, was also included in cardiac and vascular disease. Arrhythmias such as atrial fibrillation were not included in the primary endpoint, but were considered adverse events. All outcomes were assessed at 2 years. Participants who died within 28 days after the onset of any of the primary or secondary endpoints were considered to have died from these diseases. | |
| Notes | Dates: the registration period was from 1 April 2001‐31 December 2002. The treatment period ended on 31 December 2004. All participants followed for two years Funding Source: sponsored by Shionogi & Co Ltd (makers of efonidipine) | |
| Risk of bias | ||
| Bias | Authors' judgement | Support for judgement |
| Random sequence generation (selection bias) | Low risk | Randomly assigned the subject to either treatment group using a computer‐generated list |
| Allocation concealment (selection bias) | Low risk | "The investigators sent a registration form describing the clinical characteristics of eligible patients to the registration office by facsimile. Immediately after registration, the registration office randomly assigned the subject to either treatment group using a computer‐generated list and informed the investigators of the treatment assignments." |
| Blinding of participants and personnel (performance bias) | High risk | Participants and clinicians not blinded |
| Blinding of outcome assessment (detection bias) | Low risk | Endpoint assessment committee was blinded and reasonably objective outcomes were used |
| Incomplete outcome data (attrition bias) | Low risk | An ITT analysis was performed on all randomised participants with the exception of the 1.6% and 1.7% of participants that were lost to follow‐up. Unclear how those lost to follow‐up were handled in the analysis |
| Selective reporting (reporting bias) | Low risk | Reporting appears complete |
| Other bias | Low risk | The study was funded by the makers of efonidipine but the study question and design were not product focused |
| Methods | PROBE study. Multicenter 1545 lower, 1534 higher in analysis (after removing loss to follow‐up and those that withdrew) | |
| Participants | Japanese outpatients ≥ 70 and < 85 years with isolated systolic hypertension (systolic BP > 160 mm Hg and diastolic BP < 90 mm Hg) who were either previously untreated or who could be switched from their current medications to valsartan. It is unclear whether only participants that tolerated valsartan were randomised. Exclusions: secondary or malignant hypertension, seated systolic BP ≥ 200 mmHg or diastolic BP ≥ 90 mmHg, cerebrovascular disorder or myocardial infarction in the 6 months prior to enrolment, coronary arterioplasty 6 months prior to enrolment or coronary arteriography planned in the 6 months following enrolment, severe heart failure (≥ NYHA functional classification III), severe aortic stenosis or valvular heart disease, atrial fibrillation/flutter or serious arrhythmia, renal dysfunction with a serum creatinine level of ≥ 2 mg/dL, serious liver disease, history of hypersensitivity to valsartan, and "other patients who are judged to be inappropriate for the study by the investigator or subinvestigator". Mean age: 76.1 years. Baseline BP 170/81. 62.4% women, 13.0% had diabetes, 19.2% smoked | |
| Interventions | Blood pressure targets of < 140 (lower) versus 140 to ≤ 150 mmHg (higher) Staged dose adjustments: valsartan, 40‐80 mg once daily, was the first‐step therapy for all participants. If the target BP in each group was not achieved within 1‐2 months, the dose of valsartan was increased (if < 160 mg) and/or other antihypertensive agents (except angiotensin II type 1 receptor blockers) were added. Participants visited the clinic a minimum of once every 3 months for 2 years. 56.1% of lower participants & 57.6% of higher participants received valsartan only. 43.9% of lower participants and 42.4% of higher participants received additional BP meds (most commonly a CCB). Mean medications n = 1.6 for both groups Achieved BP at study completion: 136.6/74.8 (lower) versus 142/76.5 (higher) | |
| Outcomes | The primary end point of this study was a composite of cardiovascular events: sudden death, fatal or nonfatal stroke, fatal or nonfatal myocardial infarction, death because of heart failure, other cardiovascular death, unplanned hospitalisation for cardiovascular disease, and renal dysfunction (doubling of serum creatinine to a level > 2.0 mg per 100 mL or introduction of dialysis). | |
| Notes | Dates: participants were enrolled from February 2004‐August 2005 and followed up until March 2008 (median follow‐up 3.07 years) Funding Source: this study was funded by a grant from the Japan Cardiovascular Research Foundation and supported by the Japanese Society of Hypertension Declarations of potential conflicts of interest: all of the study authors report receiving lecture fees from various pharmaceutical companies in Japan, including Novartis Pharma Japan (maker of valsartan ‐ the first medication introduced) Other: unclear how the funding agencies are themselves funded | |
| Risk of bias | ||
| Bias | Authors' judgement | Support for judgement |
| Random sequence generation (selection bias) | Low risk | "Randomization of target BP levels, i.e., SBP of <140mmHg (L group) or ≥140mmHg and <150 mmHg (M group), will be performed with a minimization method based on the following assignment factors using a computer program: Sex: male or female; Age: younger than 75 years or 75 years or older; Seated SBP: less than 175 mmHg or 175 mmHg or higher; Antihypertensive therapy: not being treated or being treated; and Institution." |
| Allocation concealment (selection bias) | Unclear risk | “the patients were randomly assigned by the VALISH Data Center according to the following factors...” |
| Blinding of participants and personnel (performance bias) | High risk | Participants and clinicians were not blinded to treatment group |
| Blinding of outcome assessment (detection bias) | Low risk | “End points and adverse events were blindly evaluated according to the prospective, randomised, open‐label, blinded end point design by the endpoint committee and the safety committee, respectively.” |
| Incomplete outcome data (attrition bias) | Unclear risk | More participants (181 = 5.9%) withdrew or were lost to follow‐up than experienced the primary outcome. This included 82/1627 assigned to the lower (< 140 mmHg) BP target and 99/1633 assigned to the higher target. No sensitivity analysis was performed |
| Selective reporting (reporting bias) | Low risk | Reporting appears complete |
| Other bias | Unclear risk | How participants were selected for the per‐protocol analysis was neither described in the main publication of findings (VALISH 2010), nor pre‐defined in the preceding Rationale and Design publication which stated that the per‐protocol analysis would exclude participants "...according to judging a criteria drawn up by the Statistical Committee of this study". |
| Methods | PROBE study. Unclear if single site or multicenter 363 lower and 361 higher participants randomised and analysed by ITT | |
| Participants | Chinese general practice outpatients > 70 years with either SBP ≥ 150 mm Hg and/or diastolic BP ≥ 90 mm Hg or a diagnosis of hypertension and current antihypertensive medication | |
| Interventions | Lower BP target of < 140/90 versus higher BP target of < 150/90. Participants were started with single‐drug treatment of an ACE inhibitor (benzene enalapril 10 mg/d), a beta ‐blocker (bisoprolol 2.5–5 mg or metoprolol 50–100 mg/d), a CCB (amlodipine 5–10 mg/d), or a diuretic (indapamide 1.5–2.5 mg/d). Presumably initial choice of therapeutic was up to the treating physician (not stated). It is unclear whether, or how, participants already treated at baseline were switched to study medications. Achieved BP at study completion 135.7/76.2 (lower) versus 149.7/82.1 (higher) | |
| Outcomes | The primary outcome was the combined incidence of fatal/nonfatal stroke, acute myocardial infarction, and other cardiovascular deaths (sudden death and heart failure death). | |
| Notes | Dates: not reported. Mean follow‐up 4 years Funding Source: not reported Declarations of Interest: not reported Other: an abstract was published in 2011 (first author Jin, Wei 2013) with a completed analysis and no mention of Wei (the lead author of the final publication) as a co‐investigator. E‐mail queries to co‐authors confirm that first author Wei was a late addition to the project. | |
| Risk of bias | ||
| Bias | Authors' judgement | Support for judgement |
| Random sequence generation (selection bias) | Low risk | “...randomly assigned to either intensive antihypertensive treatment or standard treatment by using a computer‐generated table of random numbers.” |
| Allocation concealment (selection bias) | Unclear risk | Method of allocation not reported |
| Blinding of participants and personnel (performance bias) | High risk | Participants and clinicians were not blinded |
| Blinding of outcome assessment (detection bias) | Low risk | "In order to reduce investigation bias, endpoints were evaluated by the members of the Endpoint Evaluation Committee, who were blinded to the treatment assignments and the time course of BP." |
| Incomplete outcome data (attrition bias) | Low risk | Lower BP target: 2 discontinued treatment, 1 withdrew consent, 1 lost to follow‐up (1.1%) Although an ITT analysis was stated it is unclear how missing data was handled. |
| Selective reporting (reporting bias) | Low risk | Reported adverse events selectively only. Total serious adverse events not provided. |
| Other bias | High risk | An initial analysis of this study was published in abstract form with no mention of Wei (the lead author of the final publication) as a co‐investigator. E‐mail queries to co‐authors confirm that first author Wei was a late addition to the project. |
ACE: angiotensin‐converting enzyme; BP: blood pressure; CCB: calcium channel blocker; CHF: congestive heart failure; ITT: intention‐to‐treat; MI: myocardial infarction; NYHA: New York Heart Association; PROBE: Prospective Randomised Open Blinded End‐point assessment
Characteristics of excluded studies [ordered by study ID]
| Study | Reason for exclusion |
| Participants were not randomised to different BP targets | |
| Participants were not randomised to different BP targets | |
| Examined the data according to achieved BP but did not randomise to different BP targets (participants were instead randomised to intense treatment of all risk factors including systolic BP < 140 versus usual care by GP) | |
| Participants were not randomised to different BP targets | |
| Participants were not randomised to different BP targets | |
| Participants were not randomised to different BP targets | |
| Participants were not randomised to different BP targets | |
| Participants were not randomised to different BP targets | |
| Participants were not randomised to different BP targets | |
| Participants were not randomised to different BP targets | |
| Although an older adult subgroup was reported, subjects in this RCT were randomised to lower BP targets than considered in this review (< 120 vs < 140 mmHg systolic) | |
| Compared lower BP targets than considered in this review (< 120 vs < 140 mmHg systolic) | |
| Participants were not randomised to different BP targets |
BP: blood pressure; GP: general practitioner; SBP: systolic blood pressure
Characteristics of ongoing studies [ordered by study ID]
| Trial name or title | |
| Methods | |
| Participants | |
| Interventions | |
| Outcomes | |
| Starting date | |
| Contact information | |
| Notes | Trial registry only. Study is recruiting. May qualify for inclusion once complete (compares SBP 110‐130 mmHg to SBP 130‐150 mmHg). Estimated completion Dec 2021 |
| Trial name or title | |
| Methods | |
| Participants | |
| Interventions | |
| Outcomes | |
| Starting date | |
| Contact information | |
| Notes | Published protocol only. Recrutiment completed. Final data collection anticipated Sept 2018. Randomises to 24‐h SBP < 130 versus 24‐h SBP < 145. Does not appear to be examining cardiovascular outcomes (focuses on cognition and mobility) |
Data and analyses
| Outcome or subgroup title | No. of studies | No. of participants | Statistical method | Effect size |
| 1 All‐cause mortality Show forest plot | 3 | 8221 | Risk Ratio (M‐H, Fixed, 95% CI) | 1.24 [0.99, 1.54] |
| Analysis 1.1  Comparison 1 Higher (< 150‐160/95‐100 mmHg) versus lower (< 140/90 mmHg) BP target, Outcome 1 All‐cause mortality. | ||||
| 2 Stroke Show forest plot | 3 | 8221 | Risk Ratio (M‐H, Fixed, 95% CI) | 1.25 [0.94, 1.67] |
| Analysis 1.2 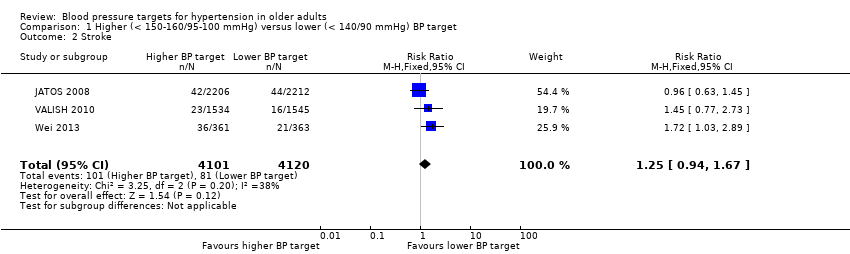 Comparison 1 Higher (< 150‐160/95‐100 mmHg) versus lower (< 140/90 mmHg) BP target, Outcome 2 Stroke. | ||||
| 3 Cardiovascular serious adverse events Show forest plot | 3 | 8221 | Risk Ratio (M‐H, Fixed, 95% CI) | 1.19 [0.98, 1.45] |
| Analysis 1.3  Comparison 1 Higher (< 150‐160/95‐100 mmHg) versus lower (< 140/90 mmHg) BP target, Outcome 3 Cardiovascular serious adverse events. | ||||
| 4 Cardiovascular mortality Show forest plot | 3 | 8221 | Risk Ratio (M‐H, Fixed, 95% CI) | 1.52 [1.06, 2.19] |
| Analysis 1.4  Comparison 1 Higher (< 150‐160/95‐100 mmHg) versus lower (< 140/90 mmHg) BP target, Outcome 4 Cardiovascular mortality. | ||||
| 5 Non‐cardiovascular mortality Show forest plot | 3 | 8221 | Risk Ratio (M‐H, Fixed, 95% CI) | 1.09 [0.81, 1.46] |
| Analysis 1.5  Comparison 1 Higher (< 150‐160/95‐100 mmHg) versus lower (< 140/90 mmHg) BP target, Outcome 5 Non‐cardiovascular mortality. | ||||
| 6 Unplanned hospitalisation Show forest plot | 1 | 3079 | Risk Ratio (M‐H, Fixed, 95% CI) | 1.18 [0.55, 2.53] |
| Analysis 1.6 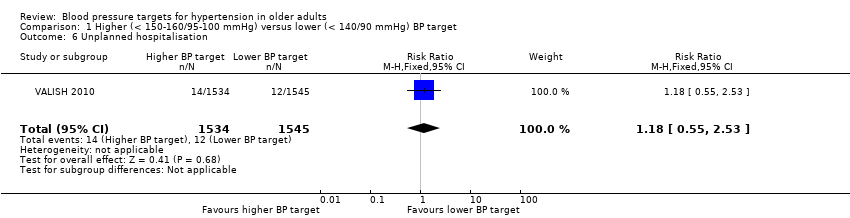 Comparison 1 Higher (< 150‐160/95‐100 mmHg) versus lower (< 140/90 mmHg) BP target, Outcome 6 Unplanned hospitalisation. | ||||
| 7 Cardiovascular serious adverse events (by component) Show forest plot | 3 | Risk Ratio (M‐H, Fixed, 95% CI) | Subtotals only | |
| Analysis 1.7 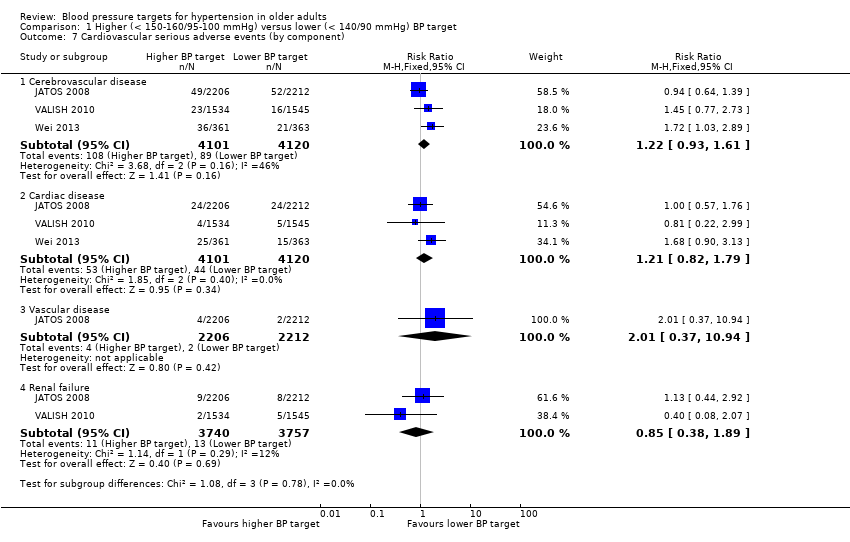 Comparison 1 Higher (< 150‐160/95‐100 mmHg) versus lower (< 140/90 mmHg) BP target, Outcome 7 Cardiovascular serious adverse events (by component). | ||||
| 7.1 Cerebrovascular disease | 3 | 8221 | Risk Ratio (M‐H, Fixed, 95% CI) | 1.22 [0.93, 1.61] |
| 7.2 Cardiac disease | 3 | 8221 | Risk Ratio (M‐H, Fixed, 95% CI) | 1.21 [0.82, 1.79] |
| 7.3 Vascular disease | 1 | 4418 | Risk Ratio (M‐H, Fixed, 95% CI) | 2.01 [0.37, 10.94] |
| 7.4 Renal failure | 2 | 7497 | Risk Ratio (M‐H, Fixed, 95% CI) | 0.85 [0.38, 1.89] |
| 8 Total serious adverse events Show forest plot | 1 | 3079 | Risk Ratio (M‐H, Fixed, 95% CI) | 0.93 [0.69, 1.24] |
| Analysis 1.8  Comparison 1 Higher (< 150‐160/95‐100 mmHg) versus lower (< 140/90 mmHg) BP target, Outcome 8 Total serious adverse events. | ||||
| 9 Total minor adverse events Show forest plot | 2 | 7497 | Risk Ratio (M‐H, Fixed, 95% CI) | 0.99 [0.91, 1.08] |
| Analysis 1.9  Comparison 1 Higher (< 150‐160/95‐100 mmHg) versus lower (< 140/90 mmHg) BP target, Outcome 9 Total minor adverse events. | ||||
| 10 Withdrawals due to adverse effects Show forest plot | 2 | 7497 | Risk Ratio (M‐H, Fixed, 95% CI) | 0.83 [0.58, 1.19] |
| Analysis 1.10  Comparison 1 Higher (< 150‐160/95‐100 mmHg) versus lower (< 140/90 mmHg) BP target, Outcome 10 Withdrawals due to adverse effects. | ||||
| 11 Mean systolic BP achieved Show forest plot | 3 | 8221 | Mean Difference (IV, Fixed, 95% CI) | 8.88 [8.38, 9.39] |
| Analysis 1.11 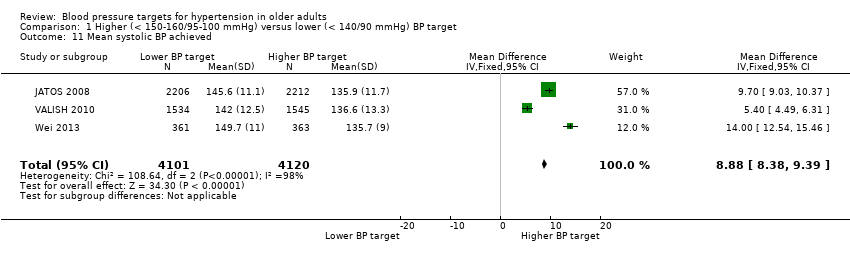 Comparison 1 Higher (< 150‐160/95‐100 mmHg) versus lower (< 140/90 mmHg) BP target, Outcome 11 Mean systolic BP achieved. | ||||
| 12 Mean diastolic BP achieved Show forest plot | 3 | 8221 | Mean Difference (IV, Fixed, 95% CI) | 3.09 [2.72, 3.47] |
| Analysis 1.12  Comparison 1 Higher (< 150‐160/95‐100 mmHg) versus lower (< 140/90 mmHg) BP target, Outcome 12 Mean diastolic BP achieved. | ||||

Study flow diagram

Risk of bias summary: review authors' judgements about each risk of bias item for each included study
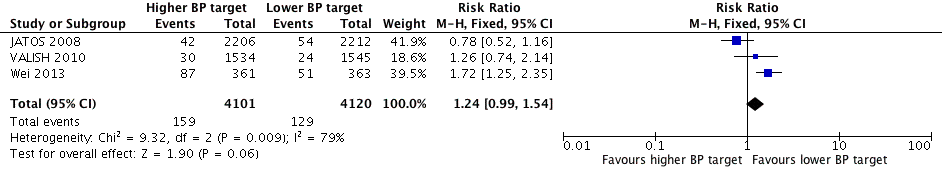
Forest plot of comparison higher (< 150‐160/95‐100 mmHg) versus lower (< 140/90 mmHg) BP target, outcome 1. All‐cause mortality.

Forest plot of comparison higher (< 150‐160/95‐100 mmHg) versus lower (< 140/90 mmHg) BP target, outcome 2. Stroke

Forest plot of comparison higher (< 150‐160/95‐100 mmHg) versus lower (< 140/90 mmHg) BP target, outcome 4. Cardiovascular serious adverse events

Forest plot of comparison higher (< 150‐160/95‐100 mmHg) versus lower (< 140/90 mmHg) BP target, outcome7. Withdrawals due to adverse effects
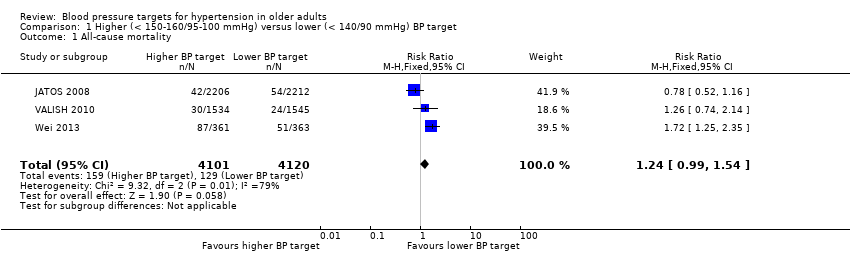
Comparison 1 Higher (< 150‐160/95‐100 mmHg) versus lower (< 140/90 mmHg) BP target, Outcome 1 All‐cause mortality.

Comparison 1 Higher (< 150‐160/95‐100 mmHg) versus lower (< 140/90 mmHg) BP target, Outcome 2 Stroke.
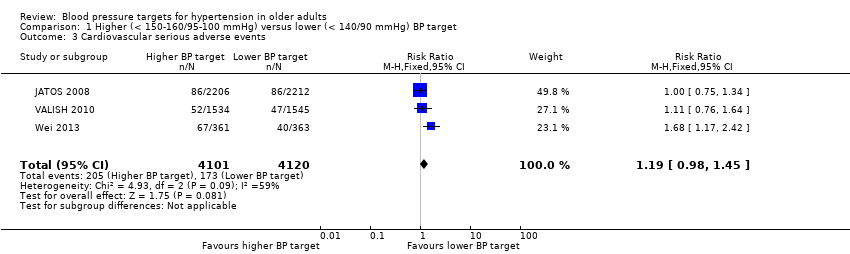
Comparison 1 Higher (< 150‐160/95‐100 mmHg) versus lower (< 140/90 mmHg) BP target, Outcome 3 Cardiovascular serious adverse events.

Comparison 1 Higher (< 150‐160/95‐100 mmHg) versus lower (< 140/90 mmHg) BP target, Outcome 4 Cardiovascular mortality.

Comparison 1 Higher (< 150‐160/95‐100 mmHg) versus lower (< 140/90 mmHg) BP target, Outcome 5 Non‐cardiovascular mortality.

Comparison 1 Higher (< 150‐160/95‐100 mmHg) versus lower (< 140/90 mmHg) BP target, Outcome 6 Unplanned hospitalisation.

Comparison 1 Higher (< 150‐160/95‐100 mmHg) versus lower (< 140/90 mmHg) BP target, Outcome 7 Cardiovascular serious adverse events (by component).
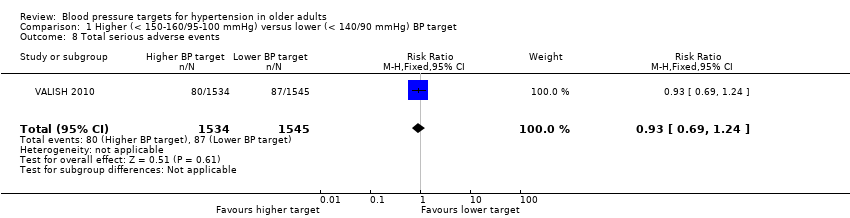
Comparison 1 Higher (< 150‐160/95‐100 mmHg) versus lower (< 140/90 mmHg) BP target, Outcome 8 Total serious adverse events.
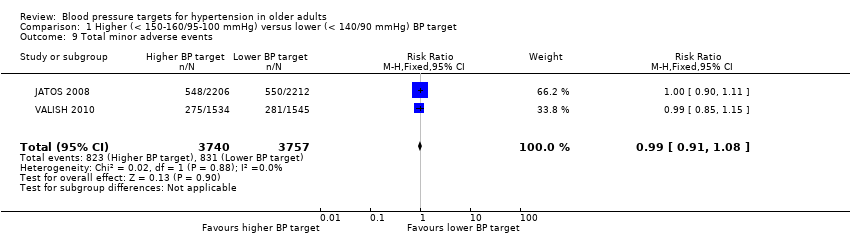
Comparison 1 Higher (< 150‐160/95‐100 mmHg) versus lower (< 140/90 mmHg) BP target, Outcome 9 Total minor adverse events.

Comparison 1 Higher (< 150‐160/95‐100 mmHg) versus lower (< 140/90 mmHg) BP target, Outcome 10 Withdrawals due to adverse effects.

Comparison 1 Higher (< 150‐160/95‐100 mmHg) versus lower (< 140/90 mmHg) BP target, Outcome 11 Mean systolic BP achieved.

Comparison 1 Higher (< 150‐160/95‐100 mmHg) versus lower (< 140/90 mmHg) BP target, Outcome 12 Mean diastolic BP achieved.
| Higher BP target (< 150‐160/95‐105 mmHg) compared with lower BP target (< 140/90 mmHg) for cardiovascular risk reduction | ||||||
| Patient or population: older adults with primary hypertension Settings: outpatient Intervention: higher BP target < 150‐160)/95‐105 mmHg Comparison: lower BP target < 140/90 mmHg | ||||||
| Outcomes | Illustrative comparative risks1 | Relative effect | No of participants | Quality of the evidence | Comments | |
| Assumed | Corresponding | |||||
| Lower | Higher | |||||
| All‐cause mortality Mean follow‐up: 2.6 years | 31 per 1000 | 39 per 1000 | RR 1.24 (0.99 to 1.54) | 8221 | ⊕⊕⊝⊝ | |
| Stroke Mean follow‐up: 2.6 years | 20 per 1000 | 25 per 1000 | RR 1.25 (0.94 to 1.67) | 8221 | ⊕⊕⊝⊝ | |
| Cardiovascular serious adverse events Mean follow‐up: 2.6 years | 42 per 1000 | 50 per 1000 | RR 1.19 (0.98 to 1.45) | 8221 | ⊕⊕⊝⊝ | |
| Withdrawals due to adverse effects Mean follow‐up: 2.4 years | 17 per 1000 | 14 per 1000 | RR 0.83 (0.58 to 1.19) | 7497 | ⊕⊕⊝⊝ | |
| The basis for the assumed risk is provided in footnote below. The corresponding risk (and its 95% CI) is based on the assumed risk in the comparison group and the relative effect of the intervention (and its 95% CI). | ||||||
| GRADE Working Group grades of evidence | ||||||
| 1Rationale for our choice of assumed risk: the risk of cardiovascular events in a hypertensive general population varies considerably across countries (Finegold 2013). With no reason to favour one country over another we have opted to use (now and for future updates) an assumed risk, which is the average across studies included in this review. | ||||||
| Outcome or subgroup title | No. of studies | No. of participants | Statistical method | Effect size |
| 1 All‐cause mortality Show forest plot | 3 | 8221 | Risk Ratio (M‐H, Fixed, 95% CI) | 1.24 [0.99, 1.54] |
| 2 Stroke Show forest plot | 3 | 8221 | Risk Ratio (M‐H, Fixed, 95% CI) | 1.25 [0.94, 1.67] |
| 3 Cardiovascular serious adverse events Show forest plot | 3 | 8221 | Risk Ratio (M‐H, Fixed, 95% CI) | 1.19 [0.98, 1.45] |
| 4 Cardiovascular mortality Show forest plot | 3 | 8221 | Risk Ratio (M‐H, Fixed, 95% CI) | 1.52 [1.06, 2.19] |
| 5 Non‐cardiovascular mortality Show forest plot | 3 | 8221 | Risk Ratio (M‐H, Fixed, 95% CI) | 1.09 [0.81, 1.46] |
| 6 Unplanned hospitalisation Show forest plot | 1 | 3079 | Risk Ratio (M‐H, Fixed, 95% CI) | 1.18 [0.55, 2.53] |
| 7 Cardiovascular serious adverse events (by component) Show forest plot | 3 | Risk Ratio (M‐H, Fixed, 95% CI) | Subtotals only | |
| 7.1 Cerebrovascular disease | 3 | 8221 | Risk Ratio (M‐H, Fixed, 95% CI) | 1.22 [0.93, 1.61] |
| 7.2 Cardiac disease | 3 | 8221 | Risk Ratio (M‐H, Fixed, 95% CI) | 1.21 [0.82, 1.79] |
| 7.3 Vascular disease | 1 | 4418 | Risk Ratio (M‐H, Fixed, 95% CI) | 2.01 [0.37, 10.94] |
| 7.4 Renal failure | 2 | 7497 | Risk Ratio (M‐H, Fixed, 95% CI) | 0.85 [0.38, 1.89] |
| 8 Total serious adverse events Show forest plot | 1 | 3079 | Risk Ratio (M‐H, Fixed, 95% CI) | 0.93 [0.69, 1.24] |
| 9 Total minor adverse events Show forest plot | 2 | 7497 | Risk Ratio (M‐H, Fixed, 95% CI) | 0.99 [0.91, 1.08] |
| 10 Withdrawals due to adverse effects Show forest plot | 2 | 7497 | Risk Ratio (M‐H, Fixed, 95% CI) | 0.83 [0.58, 1.19] |
| 11 Mean systolic BP achieved Show forest plot | 3 | 8221 | Mean Difference (IV, Fixed, 95% CI) | 8.88 [8.38, 9.39] |
| 12 Mean diastolic BP achieved Show forest plot | 3 | 8221 | Mean Difference (IV, Fixed, 95% CI) | 3.09 [2.72, 3.47] |