溃疡性结肠炎的诱导与维持治疗的安慰剂效应和缓解率的随机试验
Abstract
研究背景
在随机对照试验(RCTs)中尽量减少安慰剂率,以有效地检测干预措施之间的治疗差异非常重要。从历史上看,在溃疡性结肠炎(UC)的临床试验中观察到高的安慰剂率。更好地了解影响安慰剂率的因素可能会导向认知更完善的临床试验设计。
研究目的
通过系统综述和meta分析评估RCTs评价成人患者UC治疗的安慰剂效应及缓解率。
检索策略
检索电子数据库(包括 MEDLINE, EMBASE, 和 CENTRAL),从起始到2017年3月1日,没有使用任何语言限制。手工检索参考文献列表及主要的胃肠道会议的会议论文集,以便发现其他的研究。
标准/纳入排除标准
使用皮质类固醇、氨基水杨酸、免疫抑制剂或生物制剂治疗的成人UC患者的安慰剂‐对照RCTs为符合条件的试验,使用溃疡性结肠炎疾病活动指数(UCDAI)或Mayo Clinic评分 来进行登记和结果评估。诱导试验的最小试验持续时间为两周,维持试验的最小试验持续时间为四周。
数据收集与分析
两位作者独立地确定研究纳入资格,并提取数据,并通过协商一致解决任何分歧。感兴趣的结局包括临床反应和缓解患者的比例。记录试验的特点,如设计,受试者的人口统计学特征和疾病史,干预,以及注册和评价标准。使用Cochrane推荐的偏倚风险工具来评价纳入研究的方法学质量。使用二项‐正态分布模型计算合并的安慰剂效应及缓解率及95%置信区间(95%CI)。分别合并诱导缓解和维持研究。使用混合效应meta回归分析,以logit事件率作为结局变量,评估研究水平特征对安慰剂效应和缓解率的影响。使用基于发布日期的累积meta分析评估合并安慰剂率随时间的变化。使用漏斗图评估发表偏倚。
主要结果
筛选过程确定了61项试验,包括58个诱导期(5111例患者随机分配到安慰剂组)和12个维持期(1579例患者随机分配到安慰剂组)。对于诱导试验,安慰剂效应的合并估计值为33%(95%CI为30%˜36%),而安慰剂缓解的合并估计值为12%(95%CI为9%˜15%)。对于维持试验,安慰剂效应的合并估计值为23%(95%CI为19%˜28%),而安慰剂缓解的合并估计值为17%(95%CI为10%˜27%)。
高疾病活动度患者的研究,与纳入较低疾病活动度患者的研究相比,安慰剂缓解和效应率明显降低(缓解率27%比4%,OR值2.60,95%CI为1.25〜5.42,P=0.01,UCDAI endoscopy sub score ≥1组与≥2组比较;效应率27%比4%,OR值1.70,95%CI为1.02〜2.82,P=0.02,UCDAI endoscopy sub score ≥1组与≥2组比较)。关于药物类别,在评估皮质类固醇的试验中观察到最低的安慰剂效应和缓解率(23%;95%CI为19˜29%,5%;95%CI为2˜11%)。生物制剂试验的安慰剂效应率最高(35%;95%CI为30〜41%),评估氨基水杨酸酯的试验的安慰剂缓解率最高(18%;95%CI为12〜24%)。纳入试验前病程超过五年的患者与病程小于或等于五年的患者相比,有显著更低的安慰剂效应率(29%比47%;OR值0.54,95%CI为0.32˜0.92,P=0.02)。需要最小直肠出血评分作为试验入选指标的研究比未使用直肠出血作为试验入选指标的研究,其安慰剂效应率增加(37%比32%;OR值1.70,95%CI为1.02˜2.82,P=0.02)。主要结局评估的时间点与安慰剂缓解率有显著的相关,每增加一周终点评估时间,安慰剂缓解率增加6%(OR值1.06,95%CI为1.02˜1.10,P=0.01)。
累积meta分析显示,从1987年到2007年,安慰剂效应率持续上升(从13%升至33%),尽管2008年至2015年的比例保持不变(32%至34%)。同样,从1987年到2007年,安慰剂缓解率也有所上升(5%˜14%),但从2008年到2015年都保持恒定(12˜14%)。在meta回归方面,比较1987‐2007年和2008‐2015年,效应率(P=0.81)和缓解率(P=0.32)均无显著差异。
作者结论
安慰剂效应和缓解率因内镜下疾病的严重程度、进入试验时的直肠出血评分、药物类别、疾病持续时间和主要结局的时间点不同而异。这些观察结果对于UC的未来临床试验的设计和实施具有重要意义,并将帮助研究人员设计试验,确定所需的样本量,并为新试验设计提供有用的信息。
PICO
Plain language summary
溃疡性结肠炎的诱导与维持治疗的安慰剂效应和缓解率的随机试验
什么是溃疡性结肠炎?
溃疡性结肠炎(UC)是一种反复发作的慢性炎症性肠病,通常累及大肠(结肠)。症状包括腹痛,腹泻,血便,体重减轻和乏力。当症状停止时,患者被认为是在缓解期。UC的临床试验通常用来评估药物治疗是否带来了临床效应(临床症状改善)或缓解(通常在治疗八周时评估)或能够有助于维持临床效应或缓解较长一段时间(通常在治疗一年后评估)。
什么是安慰剂效应?
安慰剂效应发生在患者在接受一个模拟(非主动)治疗后,体验到实际的或感知上的改善。影响这一现象的因素尚不完全清楚,可能是因为接受治疗的心理效应,而不是治疗本身。了解安慰剂效应的大小以及影响安慰剂效应的因素很重要,因为在设计新药治疗的临床试验时,使用安慰剂效应发生率来计算需要的患者数量。理想情况下,在设计临床试验时,研究人员的目标是尽量减少安慰剂效应的大小,以最低数量的患者数最好地检测出活性药物和模拟治疗之间的真实差异。这意味着实施成本高昂的临床试验,可以设计得需要更少的患者数,效率更高,成本更低,最终能更快地给病人带来新的药物。
研究人员评估了什么?
研究人员对已发表的不同类别的UC药物的安慰剂‐对照试验进行系统综述,以量化安慰剂效应的总体水平,以及这些效应发生率随时间的变化。他们还研究了试验设计相关的因素、受试者、治疗或结局对UC试验的安慰剂效应率的影响。医学文献检索及分析截止到2017年3月1日。
研究人员发现了什么?
研究共纳入61项试验,评估了58个诱导期(共5111名患者随机分配到安慰剂组)及12个维持期(共1579名患者随机分配到安慰剂组)。研究人员发现,安慰剂效应及缓解率因药物类别不同而异,在生物药物(由活生物体制造的基因工程药物)中观察到的安慰剂效应率最高。在评估氨基水杨酸盐(一种抗炎药)的试验中,观察到的安慰剂缓解率最高。最低的安慰剂效应和缓解率是在评估皮质类固醇的试验中(抑制炎症和免疫的药物)。与未使用直肠出血作为试验可行性指标的试验相比,需要最小直肠出血评分作为研究可行性指标的研究与安慰剂效应率增加相关。主要结局评估的时间点与安慰剂缓解率有显著的相关,这样每增加一周终点评估时间都与安慰剂缓解率的增加有关。有几个试验设计特征与低安慰剂效应与缓解率相关。有一项关键发现,纳入进入试验时有更严重的内镜下病变(i.e.结肠镜确诊的炎症)的患者的试验与低安慰剂效应及缓解率相关,这说明了客观上确保纳入UC试验的患者有足够的疾病严重程度的重要性。纳入试验前病程超过五年的患者与病程小于或等于五年的患者相比,有显著更低的安慰剂效应率。研究人员还发现,从2008年到2015年,安慰剂率一直保持稳定。
综上所述,安慰剂效应和缓解率因内镜下疾病的严重程度、进入试验时的直肠出血评分、药物类别、疾病持续时间和主要结局的时间点不同而异。总体研究结果将有助于实施试验的研究人员进行研究设计,确定他们计划试验所需的患者数量,并提供关于试验设计特征的有用信息,在规划新的试验时应该考虑这些特征。
Authors' conclusions
Background
Description of the condition
Ulcerative colitis (UC) is a chronic, relapsing and remitting inflammatory disorder characterized by bloody diarrhoea, abdominal pain and fatigue. These symptoms can adversely affect schooling, work productivity, psychosocial well‐being and collectively contribute to a substantially reduced health related quality of life. Medical approaches to disease management include corticosteroids, 5‐aminosalicylates, immunosuppressants, tumour necrosis factor‐alpha (factor‐α) antagonists and anti‐integrin therapies.
In randomised controlled trials (RCTs) patients assigned to placebo treatments improve on average. This placebo effect is a complex phenomenon and incompletely understood. Several factors have been proposed to explain the response to placebo which include regression to the mean, natural variation in the disease process, as well as environmental factors such as the patient‐physician interaction and expectations of treatment benefit. Evidence from multiple therapeutic areas suggests that there are general trial design features capable of both attenuating and amplifying placebo response and remission rates (Enck 2013; See Table 1).
| Traditional design features | Novel design features | Other quality measures | |
| Increase in placebo response | Follow up > 12 months | Use of PROs | |
| Decrease in placebo response | Using treatment naive patients | Induction phases to identify drug non‐responders Adaptive group allocation Stepped wedge trial | Using biomarkers instead of PROs Enrolling patients with more severe disease Controlling for centre effects |
Table constructed from information presented in Enck 2013.
PRO: patient reported outcome
Whilst maximizing the placebo effect is desirable in clinical practice, in drug development the aim is to minimize this effect in order to best detect differences between drug and placebo that are attributable to treatment. Traditionally, there has been considerable variance in placebo response and remission rates across clinical trials of UC. Thus, understanding the factors which influence the placebo rate is essential to allow for more efficient study design.
A meta‐analysis published by Su 2007 included 40 trials published up to 2005 in which patients with active UC received medical therapy or placebo. Factors such as number of follow‐up visits and disease severity were found to influence placebo response and remission rates (Su 2007; See Table 2).
| Increase in placebo response and remission rate | Longer study duration |
| Decrease in placebo response and remission rate | Defining response as UCDAI ≥ 3 |
Table constructed from information presented in Su 2007
UCDAI: Ulcerative Colitis Disease Activity Index
Why it is important to do this review
The last review of this topic was published in 2007 and presented an analysis of 40 trials conducted up to 2005 (Su 2007). The researchers identified a number of factors that influence placebo response and remission rates such as number of follow‐up visits and disease duration. A decade has now elapsed since Su 2007 conducted their meta‐analysis. During this period the design of clinical trials and RCTs has evolved. More objective markers of disease activity such as inflammation measured by endoscopic assessment are used to enrol patients in RCTs rather than more subjective measures of disease activity such as symptom‐based diaries or disease activity indices.
Therapeutic trials for UC can be generally designed as induction, maintenance or integrated (incorporating both induction and maintenance phases) studies. While Su 2007 determined that study duration was positively associated with placebo remission rates, the meta‐analysis did not explore whether trial phase influenced placebo response. It is plausible that placebo response will vary depending on whether the study is an induction, maintenance or integrated trial.
Su 2007 included studies if there was a placebo arm and all patients had active disease at entry. This meta‐analysis reported the definitions of clinical response or remission used in each included study and the proportion of patients who achieved response or remission. In addition, the trials included in the review by Su 2007 assessed and pooled studies which used a variety of outcome measures to assess disease activity. For example, the outcome data from studies in which patients were enrolled and assessed using the Ulcerative Colitis Disease Activity Index (UCDAI), were pooled with outcomes from studies that used other disease activity indices (e.g. the Physician's Global Assessment (PGA) Scale and or the Rachmilewitz Index). To ensure that the measurement of patients' disease severity is similar across trials, the current review only included studies that utilized the UCDAI or the Mayo Score for enrolment and assessment. The UCDAI (Sutherland 1987a), and Mayo score (Schroeder 1987), are 12‐point scales incorporating four components of disease activity (stool frequency, rectal bleeding, mucosal appearance on sigmoidoscopy and physicians global assessment). These scores are sufficiently similar to be considered equivalent. The establishment of a well‐defined set of trial design criteria capable of consistently yielding accurate placebo response and remission rates in controlled trials of UC will aid in the interpretation of existing data and make it possible to design more efficient and cost‐effective clinical trials and RCTs in the future.
Objectives
The objective of this review is to conduct a meta‐analysis of RCTs to quantify placebo rates of response and remission, how these have evolved over time, and to conduct a meta‐regression to identify trial design features which affect the placebo response.
Methods
Criteria for considering studies for this review
Types of studies
Placebo‐controlled RCTs in UC incorporating an induction phase, maintenance phase or both and comparing an active drug with placebo were eligible for inclusion. A trial duration of a minimum of two weeks was required for induction trials, and four months for maintenance trials. Studies that did not use the UCDAI for enrolment and assessment were ineligible. Abstract publications were only included if sufficient information was provided in the abstract or authors could be contacted for further information.
Types of participants
Adult patients (aged > 18 years) with active or quiescent UC defined by the UCDAI were considered for inclusion. Trials of hospitalised patients with UC were excluded.
Types of interventions
RCTs that compared corticosteroids, 5‐aminosalicylates (5‐ASA), immunosuppressants, tumour necrosis factor‐α antagonists or other biologic agents to placebo were included. Trials of antibiotics, probiotics or complimentary therapies were excluded.
Types of outcome measures
Primary outcomes
The primary outcome measure was the proportion of patients in the placebo group achieving or maintaining clinical response or remission, as defined by the included studies and expressed as a percentage of the total number of patients randomised (i.e. intention‐to‐treat analysis).
Secondary outcomes
The secondary outcomes were the proportion of patients with endoscopic remission, endoscopic response, histological response and steroids free remission where reported.
Search methods for identification of studies
Electronic searches
We searched following databases for relevant studies:
1. MEDLINE (Ovid, 1946 to 1 March 2017);
2. EMBASE databases (1984 to 1 March 2017);
3. The Cochrane Central Register of Controlled Trials (1994 to 1 March 2017); and
4. The Cochrane IBD/FBD Group Specialized Trials Register (inception to 1 March 2017).
The search strategies are listed in Appendix 1.
Searching other resources
Manual searches of reference lists from potentially relevant trials and review articles were searched to identify additional studies. Abstracts from Digestive Disease Week and United European Gastroenterology Week were hand searched to identify studies reported in abstract form only.
Data collection and analysis
Selection of studies
Two authors (VJ and CP) independently screened titles and abstracts of publications identified by the literature search to determine eligibility based on the inclusion criteria described above (i.e. type of study, participants, and interventions). Disagreement was resolved by consensus.
Data extraction and management
A standardised data extraction form will was used to collect data from the included studies. The form was based on the Cochrane checklist of items to consider for data extraction (Higgins 2011a). Fourteen authors were paired into seven teams of two (TC and NA; TA and TA; PD and MA; MS and DH; AK and EM; MM and MA; SB and MG). Each team was provided a set of included studies from which they independently extracted data. Disagreement within each team was resolved through discussion until consensus was reached. Where consensus was not achieved, a third author (VJ or JKM) was consulted to resolve the disagreement. The authors of the original studies were contacted to provide further details in the case of unclear or missing data.
Data from five key areas were recorded from each included study as follows:
A. Trial design (publication year, number of treatment arms, trial phase, location, number of centres, number of patients randomised, blinding, number of screening visits, number of follow‐up visits, frequency of follow‐up visits, duration of follow‐up visits, disease severity score used, minimum UCDAI inclusion score at entry, endoscopy sub‐score for inclusion, bleeding sub‐score for inclusion, definition of response, time point to measure response, definition of remission, time point to measure remission, whether endoscopy was performed at entry, whether active disease was confirmed by central reading, whether active disease was confirmed by histology at entry);
B. Participants (age, gender, disease severity at enrolment, C‐reactive protein at entry, fecal calprotectin at entry, disease duration prior to enrolment, proportion of patients taking concurrent corticosteroids, proportion taking concurrent 5‐ASA drugs, proportion taking concurrent immunosuppressive drugs, proportion taking concurrent biological agents, proportion who took biological agents in the past, proportion with proctitis, proportion with left‐sided disease, proportion with extensive colitis or pancolitis);
C. Interventions (drug name, route of administration, active comparator, dose of active comparator, frequency of placebo administrations, number of placebo administrations, ratio of active treatment versus placebo, frequency of active drug administrations); and
D. Outcomes (number of participants in placebo arm, intention‐to‐treat analysis, proportion of drop‐outs post‐randomisation, number of patients in remission, proportion of patients in remission, number of patients with response, proportion of patients with response, proportion of patients in steroid‐free remission, proportion of patients with mucosal healing, proportion with histological improvement).
Assessment of risk of bias in included studies
The Cochrane risk of bias tool was used assess the methodological quality of the included studies (Higgins 2011b) Fourteen reviewers were paired into seven teams of two (TC and NA; TA and TA; PD and MA; MS and DH; AK and EM; MM and MA; SB and MG). Each team was provided a set of included studies for which they independently assessed the risk of bias. Disagreement within each team was resolved through discussion until consensus was reached. If the team was unable to reach consensus, a third author (VJ or JKM) was be consulted to resolve the disagreement. Factors assessed were:
-
Sequence generation (Selection bias);
-
Allocation concealment (selection bias);
-
Blinding of participants and personnel (performance bias);
-
Blinding of outcome assessment (detection bias);
-
Completeness of outcome data (attrition bias);
-
Selective reporting (reporting bias); and
-
Other sources of bias
These categories were rated as 'low risk', 'high risk' or 'unclear risk' for each study. Study authors were contacted if there was insufficient data to determine risk of bias.
We did not assess the overall quality of evidence using the GRADE approach since the current study is a meta‐analysis of proportions analysing placebo response, rather than an intervention‐based meta‐analysis.
Measures of treatment effect
Proportions and corresponding 95% confidence intervals (95% CI) were calculated for dichotomous outcomes. The potential effects of study level variables on the proportions were quantified using odds ratios (OR).
Unit of analysis issues
Where response or remission are defined at multiple time points, the primary outcome as defined in the study was abstracted. Where the primary outcome was not defined the result from the final assessment time point was recorded. If any cross‐over trials were included we extracted data from the first phase of the study only (i.e. before the cross‐over occurred).
Dealing with missing data
Study authors were contacted to supply missing data or to explain the reason for data loss. Data were analysed according to the intention‐to‐treat principle. Data that remained missing were assumed to be negative (i.e. treatment failure).
Assessment of heterogeneity
Potential heterogeneity in placebo response and remission rates across studies was investigated by visual inspection of forest plots and by calculating the Chi2 (a P value of 0.10 will be regarded as statistically significant heterogeneity) and I2 statistics (Higgins 2002). If significant heterogeneity was present (i.e. I2 ≥ 50%) we explored possible explanations using sensitivity analysis.
Assessment of reporting biases
Potential publication bias was assessed using funnel plots (Egger 1997a), and corrected using the trim and fill method if necessary (Duval 2000).
Data synthesis
The pooled proportions and corresponding 95% CI of placebo response and remission rates were calculated using a binomial normal model for proportions (Stijnen 2010). Induction of remission and maintenance studies were pooled separately. Mixed‐effects meta‐regression was conducted as appropriate to assess the effects of study‐level characteristics on placebo response and remission rates (Thompson 2002). The following study level characteristics were assessed: trial design features (including setting, design, country of origin, duration of follow up, number of study visits, time of outcome assessment, and publication date), inclusion criteria (including stringent versus less stringent criteria, disease severity, the presence of markers of active disease at enrolment, disease distribution, drug class, concomitant medications, and disease duration), and the assessment of response and remission (including stringent versus less stringent criteria and mucosal healing). P‐values of less than 0.05 were regarded as statistically significant. Analyses were conducted using SAS 9.3 (SAS Institute, Cary, NC) and Stata 12.1 (STATA Corp).
Subgroup analysis and investigation of heterogeneity
Subgroup analyses were performed to examine the effects of:
-
Higher versus lower baseline disease activity inclusion scores (i.e. moderate to severe disease versus mild to moderate disease);
-
Trials published after 2000 versus those published before 2000;
-
Class of drug; and
-
Use of endoscopic or histological criteria to define remission.
Sensitivity analysis
If sufficient data were available sensitivity analyses were conducted to determine the impact of excluding studies with lower methodological quality (i.e. trials with high or unclear risk of bias, trials with less than 50 patients and trials published in abstract form).
Results
Description of studies
The literature search was conducted on 1 March 2017. There were 8977 reports identified through database searching and 12 reports identified from other sources.
Results of the search
After 3924 duplicates were removed, the titles and abstracts of 5056 reports were independently screened by two authors (VJ and CP). Of these, 4811 reports were found to be non‐applicable and 254 full‐text reports were assessed for eligibility (see Figure 1).
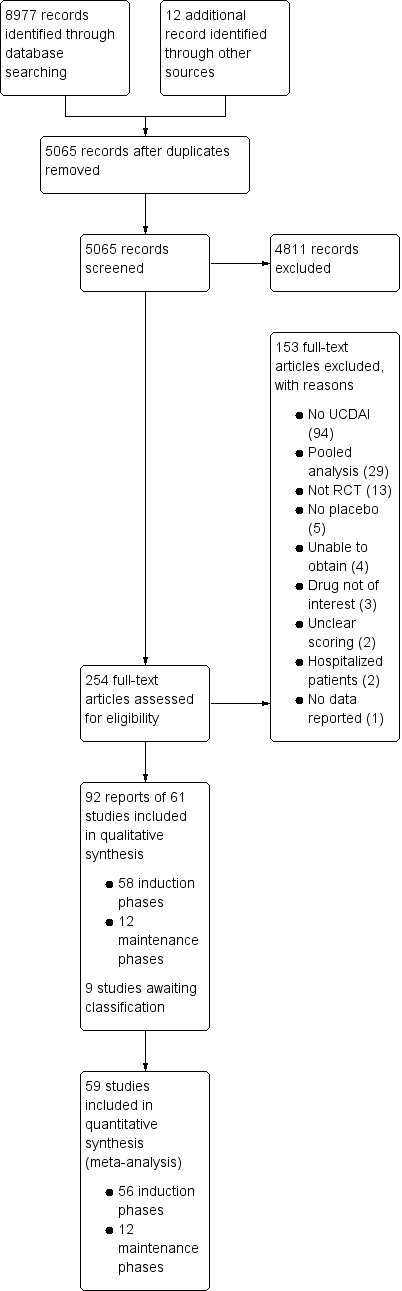
Study flow diagram.
Included studies
Ninety‐two reports of 61 studies met the inclusion criteria and were included in the review (See: Characteristics of included studies). The 61 included studies contained 58 induction phases and 12 maintenance phases. Two induction studies were reported in abstract form only and could not be included in the quantitative analysis (Aoyama 2015; Rubin 2015). Nine studies were identified that are awaiting classification and these studies will be considered for inclusion in a future update of this review (See Characteristics of studies awaiting classification).
Of the 56 induction phases (n = 5111) that were included in the quantitative analysis, response rates were reported in 50 trials. Remission rates were reported in 47 trials. Of the 12 maintenance phases (n = 1338), response rates were reported in six trials and remission rates were reported in nine trials. Given the small number of maintenance phases, meta‐regression to identify factors mediating placebo response rates was only conducted for induction phases. Baseline characteristics of the included induction and maintenance studies are reported in Table 3.
| Trial | Phase | Setting (number of centres) | Comparator | Placebo patients | Mean age | Follow‐up (weeks) | Mean entry UCDAI score | Response definition | Remission definition | |
| 1 | induction (1) | Multicenter, single country (NS) | Budesonide foam | NS | NS | 6 | NS | NS | RBS = 0, endoscopic sub score < 1 and stool frequency sub score = 0 or decrease > 1 | |
| 2 | induction (2) | Multicenter, multinational (4) | Aminosalicylate | 13 | 48 | 6 | 7.8 | Mean/median score improvement | NS | |
| 3 | induction (3) | Multicenter, multinational (26) | Methotrexate | 51 | NS | 24 | NS | NS | Mayo Clinic subscore < 2 with no item >1 | |
| 4 | induction (4) | Multicenter, multinational (30) | Tralokinumab | 55 | 41 | 24 | 8.3 | Decrease in Mayo ≥3 points and ≥30%; plus decrease in RBS of ≥1 point or absolute RBS 0 /1 | Mayo score ≤2 points; no individual sub score >1 point | |
| 5 | induction (5) | Multicenter, multinational (30) | Alicaforsen | 22 | 50 | 6 | 6.5 | Decrease in RBS of 0‐1or more from baseline | NS | |
| 6 | induction (6) | Multicenter (NS) | Alicaforsen | 8 | 4 | 7.5 | Percent reduction in DAI | NS | ||
| 7 | induction (7) | Multicenter, single country (NS) | Vedolizumab | 8 | NS | 4 | 8 | Improvement in Baron ≥ 2 points | Mayo 0; Modified Baron 0 | |
| 8 | induction (8) | Multicenter, single country (20) | Vedolizumab | 63 | 38.9 | 6 | 6.7 | Improvement in UCCS ≥ 3 points | UCCS ≤ 1 and a modified Baron ≤ 1 | |
| 9 | induction (9) | Multicenter, multinational (26) | Mesalamine | 141 | 40.4 | 10 | NS | UCDAI decrease by ≥3 points | UCDAI, SFS and RBS scores of 0, and no fecal urgency | |
| 10 | induction (10) | Multicenter, multinational (211) | Vedolizumab | 149 | 41.2 | 6 | 8.6 | Decrease in Mayo ≥3 points and ≥30%; plus decrease in RBS of ≥1 point or absolute RBS 0 /1 | Mayo score ≤ 2 points; no individual sub score > 1 point | |
| maintenance (1) | Multicenter, multinational (211) | Vedolizumab | 126 | 40.3 | 52 | 8.4 | Decrease in Mayo ≥3 points and ≥30%; plus decrease in RBS of ≥1 point or absolute RBS 0 /1 | Mayo score ≤ 2 points; no individual sub score > 1 point | ||
| 11 | maintenance (2) | Multicenter (9) | Mesalamine | 34 | 37.3 | 96 | NS | NS | UCDAI score = 0 was the definition of clinical and endoscopic remission Relapse defined as symptoms of rectal bleeding or increase in stool frequency for > 1 wk and endoscopic evidence of inflammation | |
| 12 | induction (11) | Single centre | Infliximab | 41 | 34.5 | 8 | NS | Decrease in total MCS > 3 points or > 30% from baseline, with a decrease in RBS > 1 point or an absolute RBS of 0 or 1 | Total Mayo score = 2 points with no individual sub score > 1 point | |
| maintenance (3) | Single centre | Infliximab | 41 | 34.5 | 30 | NS | Decrease in total MCS > 3 points or > 30% from baseline, with a decrease in RBS > 1 point or an absolute RBS of 0 or 1 | Total Mayo score of < 2 points with no individual sub score > 1 point | ||
| 13 | induction (12) | Multicenter. multinational (49) | MMX mesalamine | 86 | 43.2 | 8 | NS | UCDAI decrease by ≥3 points | UCDAI ≤1+ RBS=0 + SFS=0 ; and ≥1 point reduction in sigmoidoscopy score | |
| 14 | induction (13) | Single country (1) | Rituximab | 8 | 50 | 24 | 7.6 | Decrease in Mayo ≥ 3 points | Decrease in Mayo to ≤ 2 | |
| 15 | induction (14) | Multicenter, single country (15) | Rosiglitazone | 53 | 12 | NS | Decrease in Mayo ≥2 points | Mayo score ≤ 2 | ||
| 16 | induction (15) | Multicenter, multinational (52) | MMX mesalamine | 93 | 42.6 | 8 | NS | UCDAI decrease by ≥3 points | UCDAI ≤1+ RBS=0 + SFS=0 ; and ≥1 point reduction in sigmoidoscopy score | |
| 17 | maintenance (4) | Multicenter, multinational (48) | Mesalamine | 96 | 46 | 24 | NS | NS | Relapse free at 6 months | |
| 18 | induction (16) | Multicenter, multinational (43) | Mesalazine enema | 56 | NS | 8 | NS | UCDAI decrease by ≥2 points | UCDAI ≤1 | |
| 19 | induction (17) | Multicenter, multinational (54) | BMS‐936557 | 54 | 41.8 | 8 | 7.9 | Decrease in Mayo ≥3 points and ≥30%; plus decrease in RBS of ≥1 point or absolute RBS 0 /1 | Mayo score ≤2 points; no individual sub score >1 point | |
| 20 | induction (18) | Multicenter, multinational (6) | rIFN‐β‐1a | 7 | 6 | NS | Reduction of ≥3 points in the UCSS symptoms score and PGA | All clinical UCSS sub scores equal to 0, with a proctosigmoidoscopy score of 0 or 1 | ||
| 21 | induction (19) | Multicenter, single country (17) | Tacrolimus | 21 | 30 | 2 | 9.4 | Reduction in DAI of more than 4 points with improvement of all categories | Complete resolution of all symptoms (all assessment scores were zero) | |
| 22 | induction (20) | Multicenter, single country (NS) | Tacrolimus | 30 | NS | 2 | 9.1 | Reduction in DAI of more than 4 points with improvement of all categories | Total DAI score 2 with all individual sub scores of 0 or 1 | |
| 23 | induction (21) | Multicenter, single country (12) | Methotrexate | 37 | 38.9 | 36 | 6.8 | NS | MCS (including the endoscopic sub score) of < 3 with no steroid use, and without a score of < 2 without sigmoidoscopy results | |
| maintenance (5) | Multicenter, single country (12) | Methotrexate | 37 | 38.9 | 36 | 6.8 | NS | Relapse was an increase in the MCS of > 3 (not including sigmoidoscopy) and/or reintroduction of steroids at a dose of > 300 mg/month | ||
| 25 | induction (22) | Multicenter, multinational (4) | Infliximab | 20 | NS | 6 | 8.5 | Decrease in Baron of ≥ 1 | UCCS ≤ 2 AND/OR Baron score = 0 | |
| 25 | induction (23) | Multicenter, multinational (94) | Adalimumab | 130 | NS | 8 | 8.7 | Decrease in Mayo > 3 points and decrease in the RBS >1/absolute RBS of 0 or 1 | Mayo score < 2 with no individual sub score > 1 | |
| 26 | induction (24) | Multicenter, multinational (38) | Anrukinzumab | 21 | 36.6 | 32 | 6.6 | Decrease from baseline of ≥3 points in total Mayo score, with at least a 30% change, accompanied by ≥1 point decrease or absolute score of 0 or 1 in RBS | Defined as proportion of subjects with a total Mayo score ≤ 2, with no individual sub score > 1 | |
| 27 | induction (25) | NS | Budesonide MMX® | NS | NS | NS | rectal bleeding and stool frequency sub scores = 0 | |||
| 28 | induction (26) | Multicenter, multinational (62) | Infliximab | 121 | 41.4 | 8 | 8.4 | Decrease in Mayo ≥3 points and ≥30%; plus decrease in RBS of ≥1 point or absolute RBS 0 /1 | Mayo score ≤2 points; no individual sub score >1 point | |
| maintenance (6) | ||||||||||
| 29 | induction (27) | Multicenter, multinational (55) | Infliximab | 123 | 39.3 | 8 | 8.5 | Decrease in Mayo ≥3 points and ≥30%; plus decrease in RBS of ≥1 point or absolute RBS 0 /1 | Mayo score ≤2 points; no individual sub score >1 point | |
| maintenance (7) | ||||||||||
| 30 | induction (28) | Multicenter, multinational (15) | Etrolizumab | 5 | 30.2 | 4 | 9 | Decrease in Mayo ≥3 points and ≥30%; plus decrease in RBS of ≥1 point or absolute RBS 0 /1 | Mayo score ≤2 points; no individual sub score >1 point | |
| 31 | induction (29) | Multicenter, multinational (15) | Etrolizumab | 5 | 39 | 5 | 10 | Decrease in Mayo ≥3 points and ≥30%; plus decrease in RBS of ≥1 point or absolute RBS 0 /1 | Mayo score ≤2 points; no individual sub score >1 point | |
| 32 | induction (30) | |||||||||
| 33 | induction (31) | Single centre | Cyclosporin | 20 | 4 | NS | Reduction of ≥3 points in DAI | UCDAI=0 | ||
| 34 | induction (32) | Multicenter, single country (15) | Repifermin | 28 | NS | 6 | Decrease in Mayo ≥3 points compared with baseline at week 4 | A score of zero on the sigmoidoscopy all sub scores = 0 (SFS, PGA, RBS) | ||
| 35 | induction (33) | Multicenter, multinational (103) | Adalimumab | 260 | 41.3 | 8 | 8.9 | Decrease in Mayo ≥ 3 points and ≥30%; plus decrease in RBS of ≥1 point or absolute RBS 0 /1 | Mayo score ≤2 points; no individual sub score >1 point | |
| maintenance (8) | ||||||||||
| 36 | induction (34) | Multicenter, multinational (108) | Budesonide MMX | 128 | 8 | NS | ≥3‐point decrease in UCDAI, and ≥1‐point reduction in the endoscopy sub score | UCDAI ≤1+ RBS=0 + SFS=0; no mucosal on colonoscopy ; and ≥1 point reduction in sigmoidoscopy score | ||
| 37 | induction (35) | Multicenter, multinational (51) | Tofacitinib | 48 | 42.5 | 8 | 8.2 | Decrease in Mayo ≥3 points and ≥30%; plus decrease in RBS of ≥1 point or absolute RBS 0 /1 | MCS = 2 with no individual sub score> 1 | |
| 38 | induction (36) | Multicenter, multinational (142) | Abatacept | 140 | 40.9 | 12 | 8.8 | Decrease in Mayo ≥3 points and ≥30%; plus decrease in RBS of ≥1 point or absolute RBS 0 /1 | MCS = 2 with no individual sub score> 1 | |
| maintenance (9) | Multicenter, multinational (142) | Abatacept | 66 | NS | 52 | NS | NS | NS | ||
| 39 | induction (37) | Multicenter, multinational (NS) | Budesonide Foam | NS | NS | 7.9 | NS | Endoscopy score ≤ 1, RBS = 0 and improvement or no change from baseline in stool frequency subscales of MMDAI** | ||
| 40 | induction (38) | Multicenter, multinational (NS) | Budesonide Foam | NS | NS | NS | 8 | NS | Endoscopy score ≤ 1, RBS = 0 and improvement or no change from baseline in stool frequency subscales of MMDAI | |
| 41 | maintenance (10) | Multicenter, multinational (217) | Golimumab | 331 | 39 | 8 | 8.3 | Decrease in Mayo ≥3 points and ≥30%; plus decrease in RBS of ≥1 point or absolute RBS 0 /1 | Mayo score ≤2 points; no individual subscore >1 point | |
| 42 | induction (39) | Multicenter, multinational (251) | Golimumab | 156 | 40.2 | 54 | 8.3 | Decrease in Mayo ≥3 points and ≥30%; plus decrease in RBS of ≥1 point or absolute RBS 0 /1 | Mayo score ≤2 points; no individual subscore >1 point | |
| 43 | induction (40) | Multicenter, multinational (75) | Eldelumab | 83 | 42.7 | 11 | 8.6 | Mayo score < 2 points | Reduction | |
| 44 | induction (41) | Multicenter, multinational (46) | Basiliximab | 51 | 38 | 8 | NS | Decrease in Mayo ≥3 points and ≥30%; plus decrease in RBS of ≥1 point or absolute RBS 0 /1 | Mayo score ≤2 points; no individual subscore >1 point | |
| 45 | induction (42) | Multicenter, single country (55) | Balsalazide | 83 | 45.4 | 8 | 8 | ≥3 point improvement in modified Mayo, ≥1 point improvement in RBS | 0 for RBS and combined score of ≤2 for SFS and PGA using the Modified Mayo subscales | |
| 46 | induction (43) | Multicenter, single country (35) | Tetomilast | 62 | 45.5 | 8 | 7.5 | Reduction of ≥3 points in DAI | UCDAI ≤1 | |
| 47 | induction (44) | Single center | Mesalamine | 38 | 42.7 | 6 | NS | 'substantial' improvement in scores | Complete resolution of symptoms (total score 0) | |
| 48 | induction (45) | Multicenter, single country (9) | Mesalamine | 52 | 39.2 | 6 | NS | Reduction in the PGA score and in at least one other component score | Complete resolution of all symptoms with all assessment scores 0 | |
| 49 | induction (46) | Multicenter, single country (2) | Butyrate | 19 | 38.6 | 6 | 7.8 | Reduction of ≥2 points in UCDAI | UCDAI ≤1 | |
| 50 | induction (47) | Multicenter, multinational (8) | Aminosalicylate | 77 | 36 | 6 | NS | PGA, % drop in DAI from baseline (total and subscores) | NS§ | |
| 51 | induction (48) | Multicenter, single country (2) | Aminosalicylate | 30 | 36 | 6 | NS | PGA, mean DAI | NS | |
| 52 | induction (49) | Multicenter, multinational (7) | Aminosalicylate | 44 | 37.8 | 6 | 8.2 | PGA, mean DAI | NS | |
| 53 | maintenance (11) | Multicenter, single country (65) | Adalimumab | 96 | 41.3 | 52 | 8.5 | Decrease of > 3 points and > 30 % from | Full Mayo | |
| 54 | induction (51) | Multicenter, single country (NS) | Infliximab | 104 | NS | 8 | NS | NS | NS | |
| maintenance (12) | Multicenter, single country (NS) | Infliximab | 104 | NS | 30 | NS | NS | NS | ||
| 55 | induction (52) | Multicenter, multinational (69) | Budesonide MMX | 128 | 39.9 | 8 | 6.2 | ≥3‐point decrease in UCDAI, and ≥1‐point reduction in the endoscopy subscore | UCDAI ≤1+ RBS=0 + SFS=0; no mucosal on colonoscopy; and ≥1 point reduction in sigmoidoscopy score | |
| 56 | induction (53) | Multicenter, multinational (40) | Daclizumab | 56 | 40.7 | 20 | 8 | Decrease in Mayo ≥ 3 points | Mayo 0 for endoscopy and RBS; Mayo 0/1 for SFS† and PGA‡ | |
| 57 | induction (54) | Multicenter, multinational (17) | PF‐00547,659 | 20 | 47.9 | 4 | 7.5 | Decrease in Mayo ≥3 points and ≥30%; plus decrease in RBS of ≥1 point or absolute RBS 0 /1 | Mayo score ≤2 points; no individual subscore >1 point | |
| 58 | induction (55) | Multicenter. Multinational (40) | Etrolizumab | 43 | 37.5 | 10 | 9.1 | Decrease in Mayo ≥3 points and ≥30%; plus decrease in RBS of ≥1 point or absolute RBS 0 /1 | Mayo score ≤2 points; no individual subscore >1 point | |
| 59 | induction (56) | Multicenter, single country (45) | Aminosalicylate | 64 | 41.3 | 4 | 5.5 | NS | Rectal mucosal score of 0 or 1 | |
| 60 | induction (57) | Multicenter, single country (2) | NS | 13 | 42.7 | 6 | 7.4 | NS | DAI score of 0 | |
| 61 | induction (58) | Multicenter, single country (42) | AJM300 | 51 | 42.6 | 8 | 7.7 | Decrease in MCS of at least 3 points and | MCS of 2 or lower and no subscore higher than 1 |
NS: not stated
RBS: rectal bleeding score
DAI: Disease Activity Index
UCCS: Ulcerative Colitis Clinical Score
UCDAI: Ulcerative Colitis Disease Activity Index
SFS: stool frequency score
PGA: physician's global assessment
Excluded studies
One hundred and fifty‐three studies were excluded, with reasons (See Characteristics of excluded studies). A total of 94 studies did not use the UCDAI for enrolment of patients and outcome assessment; 29 studies were pooled analyses using data from other studies; 13 studies were not randomised controlled trials; 5 studies had no placebo arm; 4 studies were unobtainable; 3 studies evaluated drugs that were not of interest; 2 studies did not clearly report how outcome evaluation was conducted; 2 studies included hospitalised patients; and 1 study did not report on outcomes of interest.
Risk of bias in included studies
The risk of bias assessment is summarized in Figure 2.
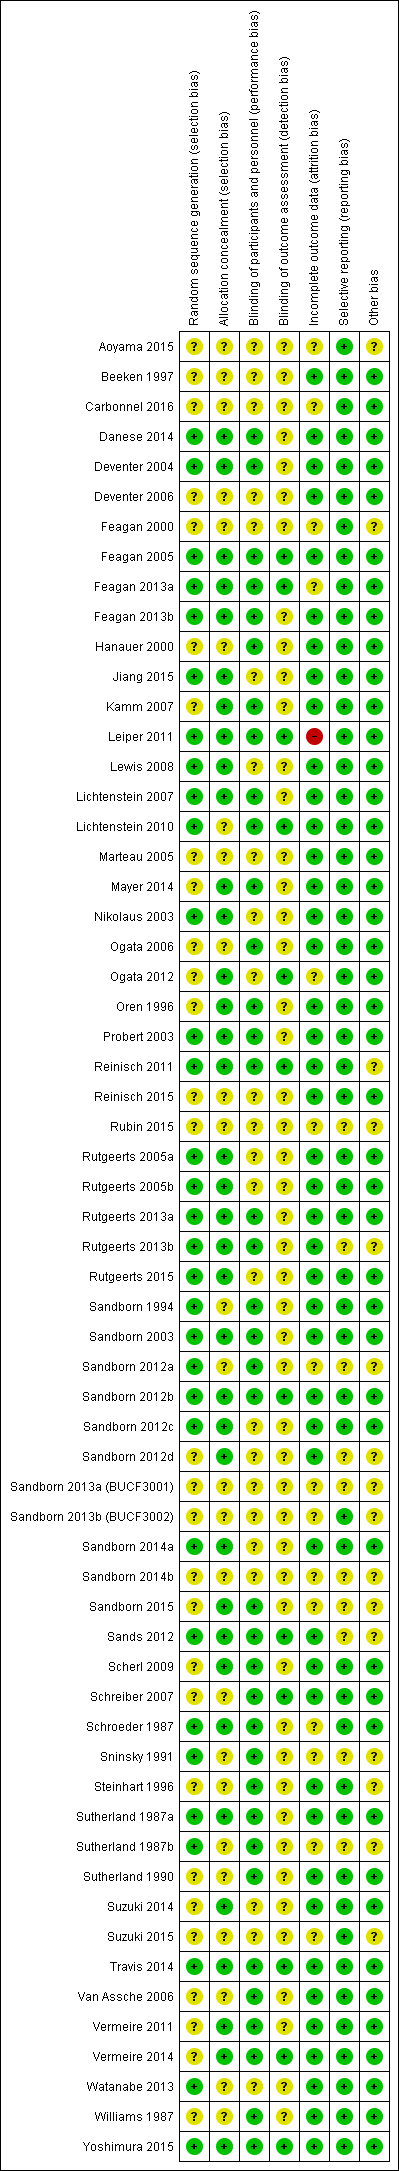
Risk of bias summary: review authors' judgements about each risk of bias item for each included study.
Allocation
A total of 32 studies were rated as 'low risk of bias' and 29 studies were rated as 'unclear risk of bias' with respect to random sequence generation. For allocation concealment, 36 studies were rated as 'low risk of bias' and 25 studies were rated as 'unclear risk of bias'.
Blinding
Thirty‐seven studies were rated as 'low risk of bias', and 24 studies were rated as 'unclear risk of bias' with regard to binding of study participants and personnel. Twelve studies were rated as 'low risk of bias' and 49 studies were rated as 'unclear risk of bias' with respect to blinding of outcome assessors.
Incomplete outcome data
For incomplete outcome, a total of 15 and 45 studies were rated as 'unclear risk of bias' and 'low risk of bias', respectively. One study was rated as 'high risk of bias'.
Selective reporting
A total of 51 studies were rated as 'low risk of bias' and 10 studies were rated as 'unclear risk of bias' with respect to selective reporting.
Other potential sources of bias
Forty‐five studies were rated as 'low risk of bias' and 16 studies were rated as 'unclear risk of bias' for the 'other sources of bias' item.
Effects of interventions
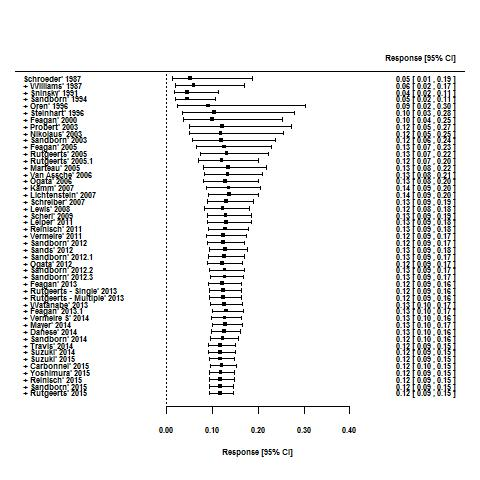
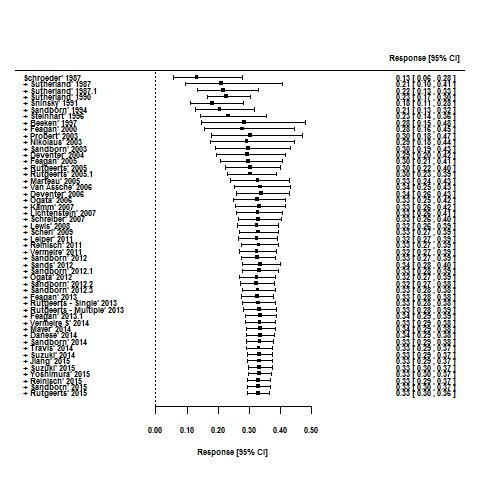
For the 56 induction trials that were included in the quantitative analysis, the pooled estimate of placebo response was 33% (95% CI 30% to 36%; Figure 3), while the pooled estimate of placebo remission was 12% (95% CI 9% to 15%; Figure 4). For maintenance trials, the pooled estimate of placebo response was 23% (95% CI 19% to 28%; Figure 5) while the pooled estimate of placebo remission was 17% (95% CI 10% to 27%; Figure 6).
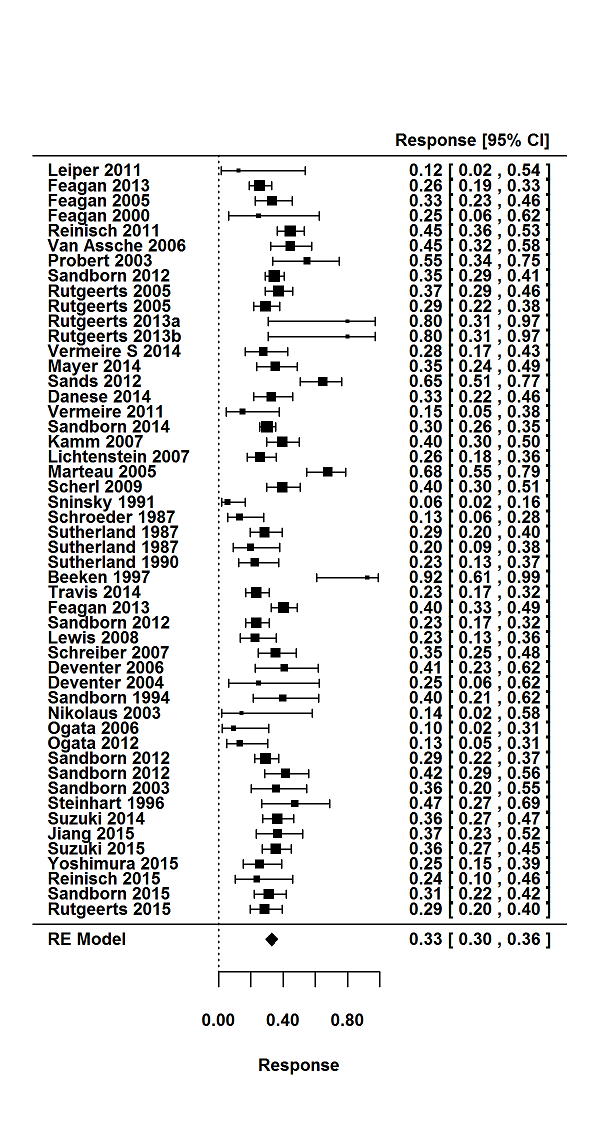
Response rates in induction phases.
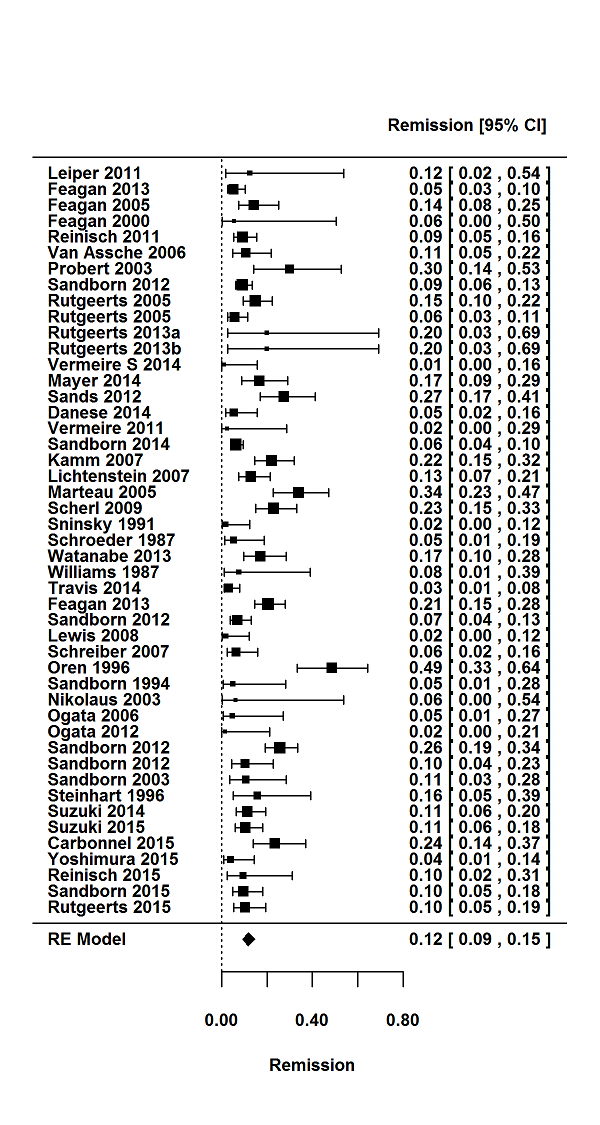
Remission rates in induction phases.
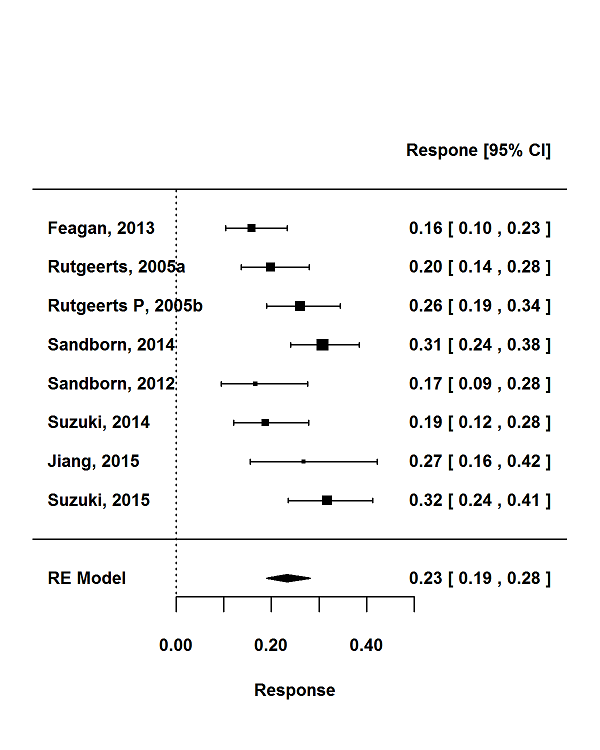
Response rates in maintenance phases.
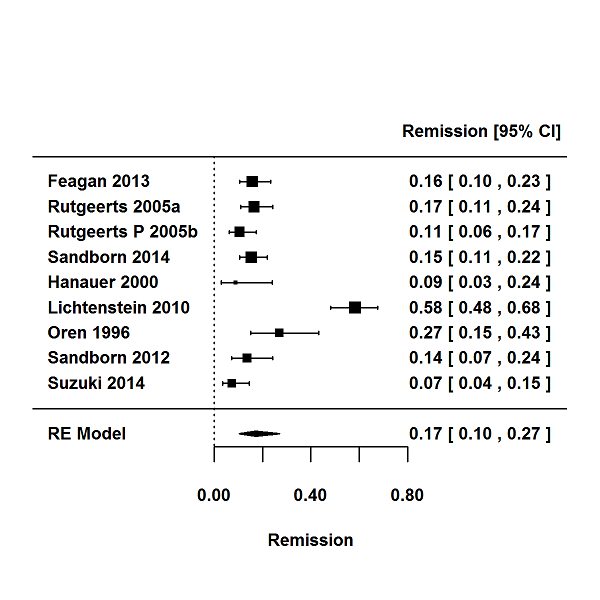
Remission rates in maintenance phases.
Due to the relatively small number of maintenance trials, pooled remission rates according to stratum‐specific variables and meta‐regression to identify factors influencing placebo rates were only conducted for induction trials.
Pooled remission rates according to stratum‐specific variables are reported in Table 4 and results of the univariable meta‐regression are reported in Table 5.
| Response | Remission | |||||||
| Trials | Pooled rate % (95% CI) | I2 % | 12 P value | Trials | Pooled rate % (95% CI) | I2 % | I2 P value | |
| All trials | 50 | 33 (30‐36) | 73 | < 0.001 | 47 | 12 (9‐15) | 75 | < 0.001 |
| Trial setting | ||||||||
| Multi‐centre, single‐country | 14 | 29 (23‐35) | 64 | 0.003 | 16 | 11 (7‐17) | 75 | < 0.001 |
| Multi‐centre, multi‐national | 31 | 35 (31‐40) | 78 | < 0.001 | 27 | 12 (10‐16) | 79 | < 0.001 |
| Single‐centre | 4 | 26 (14‐44) | 62 | 0.06 | 3 | 6(2‐16) | 0 | 0.74 |
| Design | ||||||||
| Stand‐alone induction | 38 | 34 (29‐39) | 76 | < 0.001 | 35 | 11 (9‐14) | 68 | < 0.001 |
| Induction and maintenance | 12 | 32 (29‐35) | 28 | 0.04 | 12 | 13 (8‐20) | 87 | < 0.001 |
| First author country | ||||||||
| North America | 26 | 32 (27‐36) | 73 | < 0.001 | 23 | 11 (9‐15) | 72 | < 0.001 |
| Europe | 18 | 37 (30‐44) | 73 | < 0.001 | 17 | 12 (8‐18) | 74 | < 0.001 |
| Other | 6 | 29 (22‐38) | 55 | < 0.05 | 7 | 12 (5‐25) | 86 | < 0.001 |
| Drug class | ||||||||
| Corticosteroid | 2 | 23 (19‐29) | 0 | 1.0 | 2 | 5 (2‐11) | 48 | < 0.17 |
| Amicosalicylate | 11 | 32 (20‐47) | 92 | < 0.001 | 9 | 18 (12‐24) | 67 | < 0.005 |
| Immunosuppressant | 3 | 19 (7‐43) | 68 | 0.04 | 5 | 13 (3‐38) | 86 | < 0.001 |
| Biological | 29 | 35 (31‐38) | 52 | < 0.001 | 28 | 11 (9‐14) | 61 | < 0.001 |
| Other | 5 | 34 (25‐44) | 29 | 0.26 | 3 | 7 (3‐18) | 47 | 0.14 |
| Route of administration | ||||||||
| Topical | 7 | 39 (27‐53) | 73 | < 0.001 | 5 | 18 (9‐31) | 59 | 0.04 |
| Oral | 17 | 28 (22‐34) | 77 | < 0.001 | 16 | 10 (6‐17) | 88 | < 0.001 |
| Intravenous | 17 | 35 (30‐41) | 63 | < 0.001 | 17 | 13 (10‐17) | 57 | 0.003 |
| Subcutaneous | 8 | 35 (30‐40) | 42 | 0.05 | 8 | 8 (7‐10) | 4 | 0.44 |
| Disease severity on entry | ||||||||
| Mild‐moderate | 21 | 32 (25‐39) | 80 | < 0.001 | 18 | 12 (8‐17) | 77 | < 0.001 |
| Moderate‐severe | 29 | 34 (30‐38) | 59 | < 0.001 | 29 | 12 (9‐15) | 75 | < 0.001 |
| Disease duration on entry | ||||||||
| < 5 years | 5 | 47 (37‐57) | 53 | 0.06 | 9 | 21 (17‐25) | 0.0 | 0.4 |
| > 5 years | 29 | 33 (28‐38) | 81 | < 0.001 | 28 | 11 (8‐15) | 82 | < 0.001 |
| Inclusion criteria | ||||||||
| Minimum total score > 6 | 21 | 34 (30‐39) | 67 | < 0.001 | 21 | 12 (9‐17) | 83 | < 0.001 |
| Minimum total score < 6 | 24 | 34 (29‐40) | 69 | < 0.001 | 21 | 13 (9‐17) | 70 | < 0.001 |
| Endoscopy subscore for inclusion | ||||||||
| > 2 | 27 | 34 (30‐37) | 59 | < 0.001 | 27 | 12 (9‐15) | 71 | < 0.001 |
| < 2 | 4 | 46 (31‐61) | 79 | 0.002 | 4 | 25 (11‐48) | 90 | < 0.001 |
| Not stated | 17 | 29 (21‐39) | 79 | < 0.001 | 14 | 8 (5‐13) | 49 | 0.015 |
| Bleeding score for inclusion | ||||||||
| Yes | 9 | 37 (29‐45) | 77 | < 0.001 | 9 | 16 (10‐23) | 79 | < 0.001 |
| No/not stated | 41 | 32 (28‐36) | 70 | < 0.001 | 38 | 11 (8‐14) | 73 | < 0.001 |
| Duration of follow‐up visits | ||||||||
| < 8 weeks | 37 | 33 (29‐34) | 81 | < 0.001 | 32 | 11 (9‐14) | 71 | < 0.001 |
| > 8 weeks | 9 | 32 (27‐37) | 42 | < 0.001 | 11 | 14 (8‐23) | 85 | < 0.001 |
| Number of follow up visits | ||||||||
| < 3 | 16 | 32 (23‐44) | 81 | < 0.001 | 13 | 11 (7‐19) | 63 | 0.001 |
| > 3 | 24 | 34 (30‐38) | 69 | < 0.001 | 24 | 12 (9‐16) | 84 | < 0.001 |
| Publication date | ||||||||
| Before (and including) 2007 | 23 | 33 (26‐40) | 78 | < 0.001 | 19 | 13 (9‐19) | 75 | < 0.001 |
| After 2008 | 27 | 33 (29‐36) | 66 | < 0.001 | 28 | 11 (8‐14) | 4 | < 0.001 |
| Time point to measure remission | ||||||||
| < 6 weeks | 17 | 31 (23‐41) | 86 | < 0.001 | 19 | 11 (8‐17) | 70 | < 0.001 |
| > 6 weeks | 26 | 34 (31‐38) | 61 | < 0.001 | 26 | 12 (9‐15) | 71 | < 0.001 |
| Improvement in endoscopy subscore required for definition | ||||||||
| Yes | 21 | 31 (27‐36) | 77 | < 0.001 | 22 | 10 (7‐13) | 76 | < 0.001 |
| No | 29 | 35 (29‐40) | 69 | < 0.001 | 25 | 14 (10‐19) | 71 | < 0.001 |
| Improvement in bleeding subscore required for definition | ||||||||
| Yes | 13 | 31 (26‐37) | 66 | < 0.001 | 12 | 12 (9‐17) | 65 | 0.001 |
| No | 37 | 34 (30‐39) | 75 | < 0.001 | 35 | 12 (9‐15) | 77 | < 0.001 |
| Response | Remission | |||
| Study characteristic | Odds ratio (95% CI) | p value | Odds ratio (95% CI) | p value |
| Trial setting | ||||
| Multi‐centre, single‐country | 1.0 | 0.16 | 1.0 | 0.59 |
| Multi‐centre, multi‐national | 1.39 (0.96‐2.03) | 1.11 (0.64‐1.94) | ||
| Single‐centre | 0.95 (0.45‐1.99) | 0.56 (0.14‐2.22) | ||
| Design | ||||
| Stand‐alone induction vs. induction and maintenance | 0.86 (0.61‐1.22) | 0.40 | 1.21 (0.70‐2.07) | 0.50 |
| First author country | ||||
| North America | 1.0 | 0.24 | 1.0 | 0.80 |
| Europe | 1.28 (0.90‐1.81) | 1.15 (0.66‐2.01) | ||
| Other | 0.86 (0.52‐1.42) | 1.24 (0.59‐2.61) | ||
| Drug class | ||||
| Corticosteroid | 1.0 | 0.30 | 1.0 | |
| Amicosalicylate | 1.59 (0.75‐3.36) | 3.95 (1.37‐11.40) | 0.02 | |
| Immunosuppressant | 0.86 (0.30‐2.44) | 4.95 (1.47‐16.73) | ||
| Biological | 1.74 (0.86‐3.50) | 2.36 (0.83‐6.40) | ||
| Other | 1.69 (0.71‐3.98) | 1.48 (0.37‐5.88) | ||
| Route of administration | ||||
| Topical | 1.0 | 0.12 | 1.0 | |
| Oral | 0.58 (0.35‐0.98) | 0.62 (0.25‐1.53) | 0.34 | |
| Intravenous | 0.82 (0.49‐1.39) | 0.70 (0.29‐1.70) | ||
| Subcutaneous | 0.82 (0.45‐1.47) | 0.41 (0.15‐1.13) | ||
| Disease severity on entry | ||||
| Mild‐moderate vs. moderate‐severe | 1.10 (0.80‐1.51) | 0.57 | 0.94 (0.56‐1.56) | 0.80 |
| Disease duration on entry | ||||
| < 5 years vs > 5 years | 0.54 (0.32‐0.92) | 0.02 | 0.57 (0.30‐1.11) | 0.10 |
| Inclusion criteria | ||||
| Minimum total score > 6 vs. minimum total score < 6 | 1.00 (0.73‐1.35) | 0.98 | 1.00 (0.59‐1.68) | 0.99 |
| Endoscopy subscore for inclusion | ||||
| > 2 | 1.0 | 0.02 | 1.0 | 0.01 |
| > 1 | 1.70 (1.02‐2.82) | 2.60 (1.25‐5.42) | ||
| Not stated | 0.78 (0.56‐1.10) | 0.68 (0.39‐1.20) | ||
| Bleeding score for inclusion | ||||
| Yes vs. no/not stated | 1.70 (1.02‐2.82) | 0.02 | 0.67 (0.38‐1.20) | 0.18 |
| Duration of follow‐up visits | ||||
| < 8 weeks vs. > 8 weeks | 0.88 (0.57‐1.37) | 0.59 | 1.41 (0.77‐2.58) | 0.26 |
| Number of follow‐up visits | ||||
| < 3 weeks vs. > 3 weeks | 1.05 (0.70‐1.57) | 0.83 | 1.08 (0.55‐2.12) | 0.82 |
| Publication date | ||||
| Before (and including) 2007 vs. after 2007 | 0.96 (0.70‐1.33) | 0.81 | 0.77 (0.47‐1.29) | 0.32 |
| Improvement in endoscopy subscore required for definition | ||||
| Yes vs. no | 1.16 (0.85‐1.59) | 0.35 | 1.54 (0.95‐2.48) | 0.08 |
| Improvement in bleeding subscore required for definition | ||||
| Yes vs. no | 1.18 (0.83‐1.67) | 0.36 | 1.0 (0.58‐1.74) | 0.99 |
| Timepoint to measure response response/remission | ||||
| < 6 weeks vs. > 6 weeks | 1.08 (0.76‐1.53) | 0.68 | 0.97 (0.60‐1.59) | 0.92 |
| Number of follow‐up visits | ||||
| < 3 visits vs. > 3 visits | 1.05 (0.70‐1.57) | 0.83 | 1.08 (0.55‐2.12) | 0.82 |
| Duration of follow‐up | ||||
| < 8 weeks vs. > 8 weeks | 0.88 (0.57‐1.37) | 0.59 | 1.41 (0.77‐2.58) | 0.26 |
| Screening visits | ||||
| Yes vs. no | 1.12 (0.75‐0.66) | 0.6 | 0.95 (0.53‐1.72) | 0.9 |
| Number of trial centres | ||||
| per 1‐centre increment | 1.00 (1.00‐1.03) | 0.728 | 1.00 (0.99‐1.00) | 0.304 |
| Publication year | ||||
| Per 1 = year increment | 1.01 (0.99‐1.03) | 0.24 | 0.99 (0.95‐1.03) | 0.65 |
| Extensive disease/pancolitis | ||||
| > 30% vs. < 30% | 1.01 (0.69‐1.47) | 0.969 | 1.23 (0.64‐2.36) | 0.532 |
| Concurrent steroids | ||||
| Yes vs. no | 0.88 (0.59‐1.32) | 0.539 | 1.13(0.63‐2.05) | 0.68 |
| Concurrent immunosuppressive | ||||
| Yes vs. no | 0.76 (0.53‐1.16) | 0.727 | 0.18 (0.66‐2.10) | 0.575 |
| Ratio of active drug | ||||
| Placebo > 1 vs. < 1 | 1.01 (0.68‐1.50) | 0.972 | 0.91 (0.49‐1.67) | 0.757 |
| Primary time point to measure endpoint | ||||
| per 1‐week increment | 1.00 (0.93‐1.07) | 0.97 | 1.06 (1.02‐1.10) | 0.01 |
Determinants of placebo response rate in induction trials
Participant and disease‐related characteristics
A disease duration of greater than five years prior to study entry was associated with a significantly lower placebo response rate compared with a disease duration of less than or equal to five years (33% versus 47% respectively; OR 0.54, 95% CI 0.32 to 0.92, P = 0.020; Table 4; Table 5). Studies using an endoscopy sub score of greater than or equal to one for study entry were associated with a higher placebo response rate compared to studies using a more stringent entry criterion of an endoscopy sub score of greater than or equal to two (46% versus 34%; OR 1.70, 95% CI 1.02 to 2.82, P = 0.02). Studies requiring a minimum rectal bleeding sub score for study entry compared with those not requiring a minimal rectal bleeding sub score were associated with a higher placebo rate (37% versus 32%; OR 1.7, 95% CI 1.02 to 2.82, P = 0.02).
There were no statistically significant differences in placebo response rates observed between study‐defined clinical disease severity (mild‐moderate versus moderate‐severe) duration of follow up (less than or equal to eight weeks versus greater than eight weeks), date of publication (before and including 2007 versus after 2007), composite UCDAI score for trial eligibility (greater than or equal to six versus less than six) or the time point for the outcome measure of response (greater than six weeks versus less than six weeks; Table 4; Table 5).
Trial design and setting
There were no statistically significant differences in placebo response rates between multicenter multinational induction trials compared to multicenter single country induction trials (35% versus 29%, respectively; OR 1.39, 95% CI 0.96 to 2.03, P = 0.16), integrated (i.e. trials with induction and maintenance phases) compared to stand‐alone induction trials (32% versus 34%, respectively; OR 0.86, 95% CI 0.61 to 1.22, P = 0.40), induction trials published before or after 2007 (33% for both time periods; OR 0.96, 95% CI 0.70 to 1.33, P = 0.81), when the first author on the publication was from Europe compared to North America (37% versus 32%; OR 1.28, 95% CI 0.90 to 1.81, P = 0.24), or according to number of follow‐up visits (OR 1.05, 95% CI 0.70 to 1.57 per visit increment), or duration of follow‐up (OR 0.88, 95% CI 0.57 to 1.37 per 1 week increment).
Class of drug
Pooled placebo response rates according to class of drug ranged from 19% to 35% (Table 4). The lowest placebo response rate (19%; 95% CI 7% to 43%; P = 0.04) was observed for trials of immunosuppressants whereas the highest placebo response rate (35%, 95% CI 31% to 38%; P < 0.001) was observed for trials of biological drugs. Trials of orally administered agents had the lowest placebo response rate (28%; OR 0.58, 95% CI 0.35 to 0.98) compared to trials of topically administered agents which had the highest placebo response rate (39%; 95% CI 27% to 53%; P = 0.12 for the comparison).
Time trends in placebo rates
Cumulative meta‐analysis indicated a steady rise in the placebo response rate from 1987 to 2007 (from 13% to 33%) with rates remaining constant from 2008 to 2015 (32% to 34%; Figure 7). The difference between the 1987 to 2007 and 2008 to 2015 point estimates for response (p = 0.81) was not statistically significant (Table 5).

Cumulative placebo response rates 1987‐2015.
Determinants of placebo remission rate in induction trials
Participant‐ and disease‐related characteristics
Studies using an endoscopy sub score of greater than or equal to one for study entry were associated with a higher pooled placebo remission rate compared to studies using a more stringent criteria of an endoscopy sub score of greater than or equal to two (27% versus 4%; OR 2.60, 95% CI 1.25 to 5.42, P = 0.01; Table 4; Table 5).
No statistically significant differences were observed for the pooled placebo remission rates according to the requirement for disease duration (greater than 5 years prior to study entry versus less than or equal to five years), a minimum rectal bleeding sub score for study entry (required versus not required), study‐defined disease severity (mild‐moderate versus moderate‐severe), composite UCDAI score for trial eligibility (greater than or equal to six versus less than six), duration of follow up (less than or equal to eight weeks versus greater than eight weeks), date of publication (before than and including 2007 versus after 2007), or the time point for the outcome measure of response (greater than six weeks versus less than six weeks; Table 4; Table 5).
Trial design and setting
The time point of primary outcome assessment was found to be significantly associated with placebo remission rates (OR 1.06, 95% CI 1.02 to 1.10, P = 0.01; per one week increment).
There were no significant differences in placebo remission rates observed between multicenter multinational induction trials compared to multicenter single country induction trials (12% versus 11%, respectively; OR 1.11, 95% CI 0.64 to 1.94, P = 0.59), integrated (i.e. induction and maintenance trials) compared to stand‐alone induction trials (12% versus 35%, respectively; OR 1.21, 95% CI 0.70 to 2.07, P = 0.50), induction trials published before or after 2007 (13% versus 11%, respectively; OR 0.77, 95% CI 0.47 to 1.29, P = 0.32), when the first author on the publication was from Europe compared to North America (12% versus 11%; OR 1.15, 95% CI 0.66 to 2.01, P = 0.80), or according to number of follow‐up visits (OR 1.08, 95% CI 0.55 to 2.12 per visit increment), or duration of follow‐up (OR 1.41, 95% CI 0.77 to 2.58 per 1 week increment).
Class of drug
Pooled remission rates according to class of drug class ranged from 5% to 18% (Table 4). The lowest placebo remission rate was observed for trials of corticosteroids (5%; 95% CI 2% to 11%; P = 0.48) whereas the highest placebo remission rate (18%; 95% CI 12% to 24%; I2 = 0.005) was observed for trials of aminosalicylates (18%; 95% CI 12% to 24%; P = 0.005). Aminosalicylate trials were associated with an increase in the placebo remission rate (OR 3.95, 95% CI 1.37 to 11.49, P = 0.02; baseline comparator corticosteroids) as were immunosuppressant trials (OR 4.95, 95% CI 1.47 to 16.73, P = 0.02; baseline comparator corticosteroids).
Time trends in the placebo rates
Cumulative meta‐analyses suggest that placebo response rates in UC trials increased from 1987 to 2007 (13% to 33%), but remained constant from 2008 to 2015 (32% to 34%; Figure 7). Similarly, placebo remission rates increased from 1987 to 2007 (5% to 14%) but have remained relatively constant between 12% to 14% from 2008 to 2015 (Figure 8). The difference between the 1987 to 2007 and 2008 to 2015 point estimates for remission (P = 0.32) was not statistically significant.
Cumulative placebo remission rates 1987‐2015.
Publication bias
The regression test for funnel plot asymmetry demonstrated that there was no significant risk of publication bias for induction trials reporting on response (P = 0.6; Figure 9) or remission (P = 0.25; Figure 10)). Publication bias was not explored for maintenance of remission due to a limited number of studies.
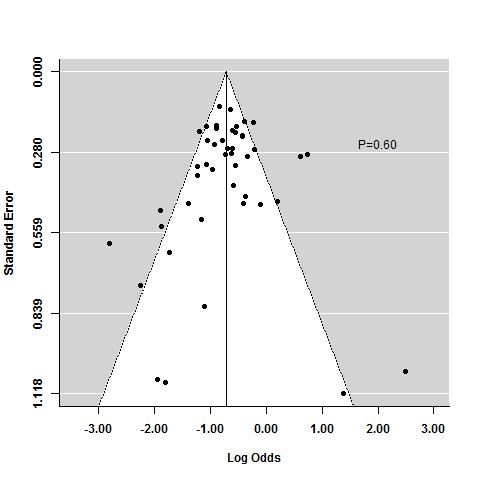
Funnel plot test for asymmetry: response
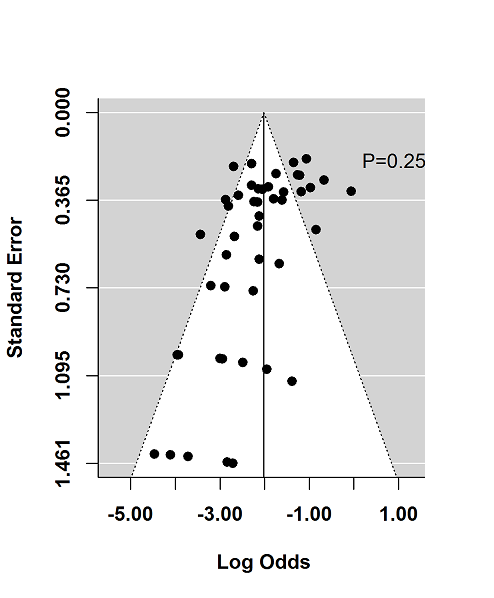
Funnel plot test for asymmetry: remission
Discussion
Summary of main results
Multiple factors influence the response to placebo, including the type of intervention, route of administration, frequency of dosing, patient expectations, patient‐provider relationship, behavioural condition and clinical setting (Dieppe 2013). Understanding modifiers of placebo response in UC trials has important implications for trial design and interpretation.
In the current systematic review and meta‐analysis, we identified 92 reports of 61 placebo‐controlled UC studies, comprised of 58 induction phases and 12 maintenance phases. Two of the induction studies were solely reported in abstracts that did not provide sufficient data and were therefore excluded from the quantitative analysis (Aoyama 2015; Rubin 2015), leaving 56 induction phases (n = 5111) and 12 maintenance phases (n = 1338) available for pooling.
One of our key findings was that trials which enrolled patients with more active disease confirmed objectively by endoscopy were associated with significantly lower placebo remission and response rates than trials enrolling patients with less active disease (27% versus 4%; OR 2.60, 95% CI 1.25 to 5.42, P = 0.01 for UCDAI endoscopy sub score greater than or equal to one versus greater than or equal to two for remission; and 27% versus 4%; OR 1.70, 95% CI 1.02 to 2.82, P = 0.02 for UCDAI endoscopy sub score greater than or equal to one versus greater than or equal to two for response). These results underscore the importance of ensuring that patients enrolled into clinical trials have objective confirmation of disease severity. This phenomenon was first demonstrated on post‐hoc analysis of an RCT of mesalamine where restricting analysis of the primary outcome to patients who were adjudicated to have sufficiently active disease at trial entry by an independent central assessor (Mayo endoscopy subscore greater than or equal to two) led to a significant reduction in placebo remission rates (20.6% versus 13.8%; Feagan 2013a). In that trial, no such outcome was seen when using symptom based criteria such as stool frequency or rectal bleeding, indicating endoscopy as a more important factor to define disease severity at trial entry. This discrepancy between patient reported symptoms and endoscopy is well recognised and this phenomenon is supported by the current meta‐analysis in which more severe endoscopic disease activity at baseline was associated with lower placebo rates, whereas the converse was seen with rectal bleeding subscore, likely a reflection of the greater reliability of endoscopic measurement compared to symptoms.
Placebo rates varied according to whether trials were designed as induction of remission studies or as maintenance of remission studies. This is an important differentiation for planning trials, since UC trials are still most commonly designed as stand‐alone induction studies, typically of shorter duration up to 8 weeks, or stand‐alone maintenance studies of longer duration, typically up to 52 weeks. Trial duration is an important influencing factor, since we observed a 6% increase in the odds of placebo remission rate per week of follow‐up. These findings are supported by the theory that increasing patient assessment and patient‐provider interactions has a positive impact upon disease course, and that with time, there is a greater chance of spontaneous improvement in disease state as well as regression towards the mean. Thus, standardization of trial assessments is an important factor to consider to reduce the placebo response rate.
A disease duration of greater than five years prior to enrolment was significantly associated with a lower placebo response rate compared to a disease duration of less than or equal to five years (29% versus 47%, respectively; OR 0.54, 95% CI 0.32 to 0.92, P = 0.02). This observation is most likely due to a lower likelihood of achieving spontaneous remission with more established disease (29% versus 47%, respectively; OR 0.54, 95% CI 0.32 to 0.92, P = 0.02). Class of drug was also an important factor with the highest rates of placebo response observed for biological drugs, perhaps related to a behavioral or 'response' expectancy to the most potent class of therapeutic agents.
Significant heterogeneity was observed for both induction and maintenance trials when pooled for response and remission, despite stratification across several covariates. This was somewhat surprising, since the study eligibility criteria were restricted to only include trials which used the UCDAI for enrolment or outcome assessment. These data highlight that there are many other factors which contribute to trial heterogeneity which include patient demographics, patterns of disease, timing and methods of outcome assessment.
Overall completeness and applicability of evidence
There were insufficient trials available to evaluate the effect of study‐level characteristics on placebo rates for maintenance studies. Furthermore, we were not able to evaluate the impact of central reading of endoscopy on placebo rates due to insufficient data. Only one of the trials utilized this approach (Feagan 2013a). It should also be noted that statistically significant heterogeneity was detected when data were pooled in some instances (see Table 4 for specific I2 values). Finally, while detailed analyses were performed using pooled data, the optimum method to investigate the influence of specific patient characteristics on placebo rates is by analysing patient‐level data.
Quality of the evidence
The Cochrane risk of bias tool was used to assess the quality of the individual studies included in this review. The majority of studies received ratings of 'low risk of bias' or 'unclear risk of bias' on trial design features related to selection, performance, detection, attrition and reporting bias. Given that the current review was a meta‐analysis of proportions rather than an intervention‐based review, the GRADE approach was not applied to assess the overall quality of evidence supporting the primary and secondary outcomes.
Potential biases in the review process
There were a limited number of maintenance trials that met the inclusion criteria, therefore we did not evaluate the effect of study‐level characteristics on the placebo rates reported in studies. Furthermore, central reading of endoscopy was only performed in one included study, which prevented us from exploring the impact of this design feature on placebo rates. Third, there was some evidence of statistically significant heterogeneity when the data were combined. Finally, despite the detailed analyses performed in the current study, the optimal method for examining the impact of demographic characteristics on placebo rates is through the use of patient‐level data.
Agreements and disagreements with other studies or reviews
A similar meta‐analysis on placebo response and remission rates conducted by Su 2007 identified 12 UC trials performed prior to 2005. However, the current analysis included more than 40 trials published after 2005, for a total of 61 trials, all of which used the UCDAI for baseline and outcome assessment. Furthermore, the current systematic review separately analysed the induction and maintenance phases, thus providing new data on these specific areas of trial design.
Our review had some similar results to those reported by Su 2007 insofar as duration of disease and the inclusion of baseline rectal bleeding scores were significantly associated with placebo response and remission rates, respectively. Su 2007 also found that studies conducted in Europe were associated with placebo remission rates, however this relationship was not observed in our review.
Consistent with an earlier version of the current systematic review (Jairath 2016), we observed that disease duration at entry was significantly associated with placebo response rates and endoscopic disease activity was significantly associated with placebo remission rates. The current version of this review also determined that endoscopic disease activity was significantly associated with placebo response, the time point at which the primary outcome was measured was significantly associated with placebo remission rates, and as mentioned above, baseline rectal bleeding scores were significantly associated with placebo remission rates.

Study flow diagram.

Risk of bias summary: review authors' judgements about each risk of bias item for each included study.

Response rates in induction phases.

Remission rates in induction phases.

Response rates in maintenance phases.

Remission rates in maintenance phases.
Cumulative placebo response rates 1987‐2015.

Cumulative placebo remission rates 1987‐2015.

Funnel plot test for asymmetry: response

Funnel plot test for asymmetry: remission
| Traditional design features | Novel design features | Other quality measures | |
| Increase in placebo response | Follow up > 12 months | Use of PROs | |
| Decrease in placebo response | Using treatment naive patients | Induction phases to identify drug non‐responders Adaptive group allocation Stepped wedge trial | Using biomarkers instead of PROs Enrolling patients with more severe disease Controlling for centre effects |
| Table constructed from information presented in Enck 2013. PRO: patient reported outcome | |||
| Increase in placebo response and remission rate | Longer study duration |
| Decrease in placebo response and remission rate | Defining response as UCDAI ≥ 3 |
| Table constructed from information presented in Su 2007 UCDAI: Ulcerative Colitis Disease Activity Index | |
| Trial | Phase | Setting (number of centres) | Comparator | Placebo patients | Mean age | Follow‐up (weeks) | Mean entry UCDAI score | Response definition | Remission definition | |
| 1 | induction (1) | Multicenter, single country (NS) | Budesonide foam | NS | NS | 6 | NS | NS | RBS = 0, endoscopic sub score < 1 and stool frequency sub score = 0 or decrease > 1 | |
| 2 | induction (2) | Multicenter, multinational (4) | Aminosalicylate | 13 | 48 | 6 | 7.8 | Mean/median score improvement | NS | |
| 3 | induction (3) | Multicenter, multinational (26) | Methotrexate | 51 | NS | 24 | NS | NS | Mayo Clinic subscore < 2 with no item >1 | |
| 4 | induction (4) | Multicenter, multinational (30) | Tralokinumab | 55 | 41 | 24 | 8.3 | Decrease in Mayo ≥3 points and ≥30%; plus decrease in RBS of ≥1 point or absolute RBS 0 /1 | Mayo score ≤2 points; no individual sub score >1 point | |
| 5 | induction (5) | Multicenter, multinational (30) | Alicaforsen | 22 | 50 | 6 | 6.5 | Decrease in RBS of 0‐1or more from baseline | NS | |
| 6 | induction (6) | Multicenter (NS) | Alicaforsen | 8 | 4 | 7.5 | Percent reduction in DAI | NS | ||
| 7 | induction (7) | Multicenter, single country (NS) | Vedolizumab | 8 | NS | 4 | 8 | Improvement in Baron ≥ 2 points | Mayo 0; Modified Baron 0 | |
| 8 | induction (8) | Multicenter, single country (20) | Vedolizumab | 63 | 38.9 | 6 | 6.7 | Improvement in UCCS ≥ 3 points | UCCS ≤ 1 and a modified Baron ≤ 1 | |
| 9 | induction (9) | Multicenter, multinational (26) | Mesalamine | 141 | 40.4 | 10 | NS | UCDAI decrease by ≥3 points | UCDAI, SFS and RBS scores of 0, and no fecal urgency | |
| 10 | induction (10) | Multicenter, multinational (211) | Vedolizumab | 149 | 41.2 | 6 | 8.6 | Decrease in Mayo ≥3 points and ≥30%; plus decrease in RBS of ≥1 point or absolute RBS 0 /1 | Mayo score ≤ 2 points; no individual sub score > 1 point | |
| maintenance (1) | Multicenter, multinational (211) | Vedolizumab | 126 | 40.3 | 52 | 8.4 | Decrease in Mayo ≥3 points and ≥30%; plus decrease in RBS of ≥1 point or absolute RBS 0 /1 | Mayo score ≤ 2 points; no individual sub score > 1 point | ||
| 11 | maintenance (2) | Multicenter (9) | Mesalamine | 34 | 37.3 | 96 | NS | NS | UCDAI score = 0 was the definition of clinical and endoscopic remission Relapse defined as symptoms of rectal bleeding or increase in stool frequency for > 1 wk and endoscopic evidence of inflammation | |
| 12 | induction (11) | Single centre | Infliximab | 41 | 34.5 | 8 | NS | Decrease in total MCS > 3 points or > 30% from baseline, with a decrease in RBS > 1 point or an absolute RBS of 0 or 1 | Total Mayo score = 2 points with no individual sub score > 1 point | |
| maintenance (3) | Single centre | Infliximab | 41 | 34.5 | 30 | NS | Decrease in total MCS > 3 points or > 30% from baseline, with a decrease in RBS > 1 point or an absolute RBS of 0 or 1 | Total Mayo score of < 2 points with no individual sub score > 1 point | ||
| 13 | induction (12) | Multicenter. multinational (49) | MMX mesalamine | 86 | 43.2 | 8 | NS | UCDAI decrease by ≥3 points | UCDAI ≤1+ RBS=0 + SFS=0 ; and ≥1 point reduction in sigmoidoscopy score | |
| 14 | induction (13) | Single country (1) | Rituximab | 8 | 50 | 24 | 7.6 | Decrease in Mayo ≥ 3 points | Decrease in Mayo to ≤ 2 | |
| 15 | induction (14) | Multicenter, single country (15) | Rosiglitazone | 53 | 12 | NS | Decrease in Mayo ≥2 points | Mayo score ≤ 2 | ||
| 16 | induction (15) | Multicenter, multinational (52) | MMX mesalamine | 93 | 42.6 | 8 | NS | UCDAI decrease by ≥3 points | UCDAI ≤1+ RBS=0 + SFS=0 ; and ≥1 point reduction in sigmoidoscopy score | |
| 17 | maintenance (4) | Multicenter, multinational (48) | Mesalamine | 96 | 46 | 24 | NS | NS | Relapse free at 6 months | |
| 18 | induction (16) | Multicenter, multinational (43) | Mesalazine enema | 56 | NS | 8 | NS | UCDAI decrease by ≥2 points | UCDAI ≤1 | |
| 19 | induction (17) | Multicenter, multinational (54) | BMS‐936557 | 54 | 41.8 | 8 | 7.9 | Decrease in Mayo ≥3 points and ≥30%; plus decrease in RBS of ≥1 point or absolute RBS 0 /1 | Mayo score ≤2 points; no individual sub score >1 point | |
| 20 | induction (18) | Multicenter, multinational (6) | rIFN‐β‐1a | 7 | 6 | NS | Reduction of ≥3 points in the UCSS symptoms score and PGA | All clinical UCSS sub scores equal to 0, with a proctosigmoidoscopy score of 0 or 1 | ||
| 21 | induction (19) | Multicenter, single country (17) | Tacrolimus | 21 | 30 | 2 | 9.4 | Reduction in DAI of more than 4 points with improvement of all categories | Complete resolution of all symptoms (all assessment scores were zero) | |
| 22 | induction (20) | Multicenter, single country (NS) | Tacrolimus | 30 | NS | 2 | 9.1 | Reduction in DAI of more than 4 points with improvement of all categories | Total DAI score 2 with all individual sub scores of 0 or 1 | |
| 23 | induction (21) | Multicenter, single country (12) | Methotrexate | 37 | 38.9 | 36 | 6.8 | NS | MCS (including the endoscopic sub score) of < 3 with no steroid use, and without a score of < 2 without sigmoidoscopy results | |
| maintenance (5) | Multicenter, single country (12) | Methotrexate | 37 | 38.9 | 36 | 6.8 | NS | Relapse was an increase in the MCS of > 3 (not including sigmoidoscopy) and/or reintroduction of steroids at a dose of > 300 mg/month | ||
| 25 | induction (22) | Multicenter, multinational (4) | Infliximab | 20 | NS | 6 | 8.5 | Decrease in Baron of ≥ 1 | UCCS ≤ 2 AND/OR Baron score = 0 | |
| 25 | induction (23) | Multicenter, multinational (94) | Adalimumab | 130 | NS | 8 | 8.7 | Decrease in Mayo > 3 points and decrease in the RBS >1/absolute RBS of 0 or 1 | Mayo score < 2 with no individual sub score > 1 | |
| 26 | induction (24) | Multicenter, multinational (38) | Anrukinzumab | 21 | 36.6 | 32 | 6.6 | Decrease from baseline of ≥3 points in total Mayo score, with at least a 30% change, accompanied by ≥1 point decrease or absolute score of 0 or 1 in RBS | Defined as proportion of subjects with a total Mayo score ≤ 2, with no individual sub score > 1 | |
| 27 | induction (25) | NS | Budesonide MMX® | NS | NS | NS | rectal bleeding and stool frequency sub scores = 0 | |||
| 28 | induction (26) | Multicenter, multinational (62) | Infliximab | 121 | 41.4 | 8 | 8.4 | Decrease in Mayo ≥3 points and ≥30%; plus decrease in RBS of ≥1 point or absolute RBS 0 /1 | Mayo score ≤2 points; no individual sub score >1 point | |
| maintenance (6) | ||||||||||
| 29 | induction (27) | Multicenter, multinational (55) | Infliximab | 123 | 39.3 | 8 | 8.5 | Decrease in Mayo ≥3 points and ≥30%; plus decrease in RBS of ≥1 point or absolute RBS 0 /1 | Mayo score ≤2 points; no individual sub score >1 point | |
| maintenance (7) | ||||||||||
| 30 | induction (28) | Multicenter, multinational (15) | Etrolizumab | 5 | 30.2 | 4 | 9 | Decrease in Mayo ≥3 points and ≥30%; plus decrease in RBS of ≥1 point or absolute RBS 0 /1 | Mayo score ≤2 points; no individual sub score >1 point | |
| 31 | induction (29) | Multicenter, multinational (15) | Etrolizumab | 5 | 39 | 5 | 10 | Decrease in Mayo ≥3 points and ≥30%; plus decrease in RBS of ≥1 point or absolute RBS 0 /1 | Mayo score ≤2 points; no individual sub score >1 point | |
| 32 | induction (30) | |||||||||
| 33 | induction (31) | Single centre | Cyclosporin | 20 | 4 | NS | Reduction of ≥3 points in DAI | UCDAI=0 | ||
| 34 | induction (32) | Multicenter, single country (15) | Repifermin | 28 | NS | 6 | Decrease in Mayo ≥3 points compared with baseline at week 4 | A score of zero on the sigmoidoscopy all sub scores = 0 (SFS, PGA, RBS) | ||
| 35 | induction (33) | Multicenter, multinational (103) | Adalimumab | 260 | 41.3 | 8 | 8.9 | Decrease in Mayo ≥ 3 points and ≥30%; plus decrease in RBS of ≥1 point or absolute RBS 0 /1 | Mayo score ≤2 points; no individual sub score >1 point | |
| maintenance (8) | ||||||||||
| 36 | induction (34) | Multicenter, multinational (108) | Budesonide MMX | 128 | 8 | NS | ≥3‐point decrease in UCDAI, and ≥1‐point reduction in the endoscopy sub score | UCDAI ≤1+ RBS=0 + SFS=0; no mucosal on colonoscopy ; and ≥1 point reduction in sigmoidoscopy score | ||
| 37 | induction (35) | Multicenter, multinational (51) | Tofacitinib | 48 | 42.5 | 8 | 8.2 | Decrease in Mayo ≥3 points and ≥30%; plus decrease in RBS of ≥1 point or absolute RBS 0 /1 | MCS = 2 with no individual sub score> 1 | |
| 38 | induction (36) | Multicenter, multinational (142) | Abatacept | 140 | 40.9 | 12 | 8.8 | Decrease in Mayo ≥3 points and ≥30%; plus decrease in RBS of ≥1 point or absolute RBS 0 /1 | MCS = 2 with no individual sub score> 1 | |
| maintenance (9) | Multicenter, multinational (142) | Abatacept | 66 | NS | 52 | NS | NS | NS | ||
| 39 | induction (37) | Multicenter, multinational (NS) | Budesonide Foam | NS | NS | 7.9 | NS | Endoscopy score ≤ 1, RBS = 0 and improvement or no change from baseline in stool frequency subscales of MMDAI** | ||
| 40 | induction (38) | Multicenter, multinational (NS) | Budesonide Foam | NS | NS | NS | 8 | NS | Endoscopy score ≤ 1, RBS = 0 and improvement or no change from baseline in stool frequency subscales of MMDAI | |
| 41 | maintenance (10) | Multicenter, multinational (217) | Golimumab | 331 | 39 | 8 | 8.3 | Decrease in Mayo ≥3 points and ≥30%; plus decrease in RBS of ≥1 point or absolute RBS 0 /1 | Mayo score ≤2 points; no individual subscore >1 point | |
| 42 | induction (39) | Multicenter, multinational (251) | Golimumab | 156 | 40.2 | 54 | 8.3 | Decrease in Mayo ≥3 points and ≥30%; plus decrease in RBS of ≥1 point or absolute RBS 0 /1 | Mayo score ≤2 points; no individual subscore >1 point | |
| 43 | induction (40) | Multicenter, multinational (75) | Eldelumab | 83 | 42.7 | 11 | 8.6 | Mayo score < 2 points | Reduction | |
| 44 | induction (41) | Multicenter, multinational (46) | Basiliximab | 51 | 38 | 8 | NS | Decrease in Mayo ≥3 points and ≥30%; plus decrease in RBS of ≥1 point or absolute RBS 0 /1 | Mayo score ≤2 points; no individual subscore >1 point | |
| 45 | induction (42) | Multicenter, single country (55) | Balsalazide | 83 | 45.4 | 8 | 8 | ≥3 point improvement in modified Mayo, ≥1 point improvement in RBS | 0 for RBS and combined score of ≤2 for SFS and PGA using the Modified Mayo subscales | |
| 46 | induction (43) | Multicenter, single country (35) | Tetomilast | 62 | 45.5 | 8 | 7.5 | Reduction of ≥3 points in DAI | UCDAI ≤1 | |
| 47 | induction (44) | Single center | Mesalamine | 38 | 42.7 | 6 | NS | 'substantial' improvement in scores | Complete resolution of symptoms (total score 0) | |
| 48 | induction (45) | Multicenter, single country (9) | Mesalamine | 52 | 39.2 | 6 | NS | Reduction in the PGA score and in at least one other component score | Complete resolution of all symptoms with all assessment scores 0 | |
| 49 | induction (46) | Multicenter, single country (2) | Butyrate | 19 | 38.6 | 6 | 7.8 | Reduction of ≥2 points in UCDAI | UCDAI ≤1 | |
| 50 | induction (47) | Multicenter, multinational (8) | Aminosalicylate | 77 | 36 | 6 | NS | PGA, % drop in DAI from baseline (total and subscores) | NS§ | |
| 51 | induction (48) | Multicenter, single country (2) | Aminosalicylate | 30 | 36 | 6 | NS | PGA, mean DAI | NS | |
| 52 | induction (49) | Multicenter, multinational (7) | Aminosalicylate | 44 | 37.8 | 6 | 8.2 | PGA, mean DAI | NS | |
| 53 | maintenance (11) | Multicenter, single country (65) | Adalimumab | 96 | 41.3 | 52 | 8.5 | Decrease of > 3 points and > 30 % from | Full Mayo | |
| 54 | induction (51) | Multicenter, single country (NS) | Infliximab | 104 | NS | 8 | NS | NS | NS | |
| maintenance (12) | Multicenter, single country (NS) | Infliximab | 104 | NS | 30 | NS | NS | NS | ||
| 55 | induction (52) | Multicenter, multinational (69) | Budesonide MMX | 128 | 39.9 | 8 | 6.2 | ≥3‐point decrease in UCDAI, and ≥1‐point reduction in the endoscopy subscore | UCDAI ≤1+ RBS=0 + SFS=0; no mucosal on colonoscopy; and ≥1 point reduction in sigmoidoscopy score | |
| 56 | induction (53) | Multicenter, multinational (40) | Daclizumab | 56 | 40.7 | 20 | 8 | Decrease in Mayo ≥ 3 points | Mayo 0 for endoscopy and RBS; Mayo 0/1 for SFS† and PGA‡ | |
| 57 | induction (54) | Multicenter, multinational (17) | PF‐00547,659 | 20 | 47.9 | 4 | 7.5 | Decrease in Mayo ≥3 points and ≥30%; plus decrease in RBS of ≥1 point or absolute RBS 0 /1 | Mayo score ≤2 points; no individual subscore >1 point | |
| 58 | induction (55) | Multicenter. Multinational (40) | Etrolizumab | 43 | 37.5 | 10 | 9.1 | Decrease in Mayo ≥3 points and ≥30%; plus decrease in RBS of ≥1 point or absolute RBS 0 /1 | Mayo score ≤2 points; no individual subscore >1 point | |
| 59 | induction (56) | Multicenter, single country (45) | Aminosalicylate | 64 | 41.3 | 4 | 5.5 | NS | Rectal mucosal score of 0 or 1 | |
| 60 | induction (57) | Multicenter, single country (2) | NS | 13 | 42.7 | 6 | 7.4 | NS | DAI score of 0 | |
| 61 | induction (58) | Multicenter, single country (42) | AJM300 | 51 | 42.6 | 8 | 7.7 | Decrease in MCS of at least 3 points and | MCS of 2 or lower and no subscore higher than 1 | |
| NS: not stated RBS: rectal bleeding score DAI: Disease Activity Index UCCS: Ulcerative Colitis Clinical Score UCDAI: Ulcerative Colitis Disease Activity Index SFS: stool frequency score PGA: physician's global assessment | ||||||||||
| Response | Remission | |||||||
| Trials | Pooled rate % (95% CI) | I2 % | 12 P value | Trials | Pooled rate % (95% CI) | I2 % | I2 P value | |
| All trials | 50 | 33 (30‐36) | 73 | < 0.001 | 47 | 12 (9‐15) | 75 | < 0.001 |
| Trial setting | ||||||||
| Multi‐centre, single‐country | 14 | 29 (23‐35) | 64 | 0.003 | 16 | 11 (7‐17) | 75 | < 0.001 |
| Multi‐centre, multi‐national | 31 | 35 (31‐40) | 78 | < 0.001 | 27 | 12 (10‐16) | 79 | < 0.001 |
| Single‐centre | 4 | 26 (14‐44) | 62 | 0.06 | 3 | 6(2‐16) | 0 | 0.74 |
| Design | ||||||||
| Stand‐alone induction | 38 | 34 (29‐39) | 76 | < 0.001 | 35 | 11 (9‐14) | 68 | < 0.001 |
| Induction and maintenance | 12 | 32 (29‐35) | 28 | 0.04 | 12 | 13 (8‐20) | 87 | < 0.001 |
| First author country | ||||||||
| North America | 26 | 32 (27‐36) | 73 | < 0.001 | 23 | 11 (9‐15) | 72 | < 0.001 |
| Europe | 18 | 37 (30‐44) | 73 | < 0.001 | 17 | 12 (8‐18) | 74 | < 0.001 |
| Other | 6 | 29 (22‐38) | 55 | < 0.05 | 7 | 12 (5‐25) | 86 | < 0.001 |
| Drug class | ||||||||
| Corticosteroid | 2 | 23 (19‐29) | 0 | 1.0 | 2 | 5 (2‐11) | 48 | < 0.17 |
| Amicosalicylate | 11 | 32 (20‐47) | 92 | < 0.001 | 9 | 18 (12‐24) | 67 | < 0.005 |
| Immunosuppressant | 3 | 19 (7‐43) | 68 | 0.04 | 5 | 13 (3‐38) | 86 | < 0.001 |
| Biological | 29 | 35 (31‐38) | 52 | < 0.001 | 28 | 11 (9‐14) | 61 | < 0.001 |
| Other | 5 | 34 (25‐44) | 29 | 0.26 | 3 | 7 (3‐18) | 47 | 0.14 |
| Route of administration | ||||||||
| Topical | 7 | 39 (27‐53) | 73 | < 0.001 | 5 | 18 (9‐31) | 59 | 0.04 |
| Oral | 17 | 28 (22‐34) | 77 | < 0.001 | 16 | 10 (6‐17) | 88 | < 0.001 |
| Intravenous | 17 | 35 (30‐41) | 63 | < 0.001 | 17 | 13 (10‐17) | 57 | 0.003 |
| Subcutaneous | 8 | 35 (30‐40) | 42 | 0.05 | 8 | 8 (7‐10) | 4 | 0.44 |
| Disease severity on entry | ||||||||
| Mild‐moderate | 21 | 32 (25‐39) | 80 | < 0.001 | 18 | 12 (8‐17) | 77 | < 0.001 |
| Moderate‐severe | 29 | 34 (30‐38) | 59 | < 0.001 | 29 | 12 (9‐15) | 75 | < 0.001 |
| Disease duration on entry | ||||||||
| < 5 years | 5 | 47 (37‐57) | 53 | 0.06 | 9 | 21 (17‐25) | 0.0 | 0.4 |
| > 5 years | 29 | 33 (28‐38) | 81 | < 0.001 | 28 | 11 (8‐15) | 82 | < 0.001 |
| Inclusion criteria | ||||||||
| Minimum total score > 6 | 21 | 34 (30‐39) | 67 | < 0.001 | 21 | 12 (9‐17) | 83 | < 0.001 |
| Minimum total score < 6 | 24 | 34 (29‐40) | 69 | < 0.001 | 21 | 13 (9‐17) | 70 | < 0.001 |
| Endoscopy subscore for inclusion | ||||||||
| > 2 | 27 | 34 (30‐37) | 59 | < 0.001 | 27 | 12 (9‐15) | 71 | < 0.001 |
| < 2 | 4 | 46 (31‐61) | 79 | 0.002 | 4 | 25 (11‐48) | 90 | < 0.001 |
| Not stated | 17 | 29 (21‐39) | 79 | < 0.001 | 14 | 8 (5‐13) | 49 | 0.015 |
| Bleeding score for inclusion | ||||||||
| Yes | 9 | 37 (29‐45) | 77 | < 0.001 | 9 | 16 (10‐23) | 79 | < 0.001 |
| No/not stated | 41 | 32 (28‐36) | 70 | < 0.001 | 38 | 11 (8‐14) | 73 | < 0.001 |
| Duration of follow‐up visits | ||||||||
| < 8 weeks | 37 | 33 (29‐34) | 81 | < 0.001 | 32 | 11 (9‐14) | 71 | < 0.001 |
| > 8 weeks | 9 | 32 (27‐37) | 42 | < 0.001 | 11 | 14 (8‐23) | 85 | < 0.001 |
| Number of follow up visits | ||||||||
| < 3 | 16 | 32 (23‐44) | 81 | < 0.001 | 13 | 11 (7‐19) | 63 | 0.001 |
| > 3 | 24 | 34 (30‐38) | 69 | < 0.001 | 24 | 12 (9‐16) | 84 | < 0.001 |
| Publication date | ||||||||
| Before (and including) 2007 | 23 | 33 (26‐40) | 78 | < 0.001 | 19 | 13 (9‐19) | 75 | < 0.001 |
| After 2008 | 27 | 33 (29‐36) | 66 | < 0.001 | 28 | 11 (8‐14) | 4 | < 0.001 |
| Time point to measure remission | ||||||||
| < 6 weeks | 17 | 31 (23‐41) | 86 | < 0.001 | 19 | 11 (8‐17) | 70 | < 0.001 |
| > 6 weeks | 26 | 34 (31‐38) | 61 | < 0.001 | 26 | 12 (9‐15) | 71 | < 0.001 |
| Improvement in endoscopy subscore required for definition | ||||||||
| Yes | 21 | 31 (27‐36) | 77 | < 0.001 | 22 | 10 (7‐13) | 76 | < 0.001 |
| No | 29 | 35 (29‐40) | 69 | < 0.001 | 25 | 14 (10‐19) | 71 | < 0.001 |
| Improvement in bleeding subscore required for definition | ||||||||
| Yes | 13 | 31 (26‐37) | 66 | < 0.001 | 12 | 12 (9‐17) | 65 | 0.001 |
| No | 37 | 34 (30‐39) | 75 | < 0.001 | 35 | 12 (9‐15) | 77 | < 0.001 |
| Response | Remission | |||
| Study characteristic | Odds ratio (95% CI) | p value | Odds ratio (95% CI) | p value |
| Trial setting | ||||
| Multi‐centre, single‐country | 1.0 | 0.16 | 1.0 | 0.59 |
| Multi‐centre, multi‐national | 1.39 (0.96‐2.03) | 1.11 (0.64‐1.94) | ||
| Single‐centre | 0.95 (0.45‐1.99) | 0.56 (0.14‐2.22) | ||
| Design | ||||
| Stand‐alone induction vs. induction and maintenance | 0.86 (0.61‐1.22) | 0.40 | 1.21 (0.70‐2.07) | 0.50 |
| First author country | ||||
| North America | 1.0 | 0.24 | 1.0 | 0.80 |
| Europe | 1.28 (0.90‐1.81) | 1.15 (0.66‐2.01) | ||
| Other | 0.86 (0.52‐1.42) | 1.24 (0.59‐2.61) | ||
| Drug class | ||||
| Corticosteroid | 1.0 | 0.30 | 1.0 | |
| Amicosalicylate | 1.59 (0.75‐3.36) | 3.95 (1.37‐11.40) | 0.02 | |
| Immunosuppressant | 0.86 (0.30‐2.44) | 4.95 (1.47‐16.73) | ||
| Biological | 1.74 (0.86‐3.50) | 2.36 (0.83‐6.40) | ||
| Other | 1.69 (0.71‐3.98) | 1.48 (0.37‐5.88) | ||
| Route of administration | ||||
| Topical | 1.0 | 0.12 | 1.0 | |
| Oral | 0.58 (0.35‐0.98) | 0.62 (0.25‐1.53) | 0.34 | |
| Intravenous | 0.82 (0.49‐1.39) | 0.70 (0.29‐1.70) | ||
| Subcutaneous | 0.82 (0.45‐1.47) | 0.41 (0.15‐1.13) | ||
| Disease severity on entry | ||||
| Mild‐moderate vs. moderate‐severe | 1.10 (0.80‐1.51) | 0.57 | 0.94 (0.56‐1.56) | 0.80 |
| Disease duration on entry | ||||
| < 5 years vs > 5 years | 0.54 (0.32‐0.92) | 0.02 | 0.57 (0.30‐1.11) | 0.10 |
| Inclusion criteria | ||||
| Minimum total score > 6 vs. minimum total score < 6 | 1.00 (0.73‐1.35) | 0.98 | 1.00 (0.59‐1.68) | 0.99 |
| Endoscopy subscore for inclusion | ||||
| > 2 | 1.0 | 0.02 | 1.0 | 0.01 |
| > 1 | 1.70 (1.02‐2.82) | 2.60 (1.25‐5.42) | ||
| Not stated | 0.78 (0.56‐1.10) | 0.68 (0.39‐1.20) | ||
| Bleeding score for inclusion | ||||
| Yes vs. no/not stated | 1.70 (1.02‐2.82) | 0.02 | 0.67 (0.38‐1.20) | 0.18 |
| Duration of follow‐up visits | ||||
| < 8 weeks vs. > 8 weeks | 0.88 (0.57‐1.37) | 0.59 | 1.41 (0.77‐2.58) | 0.26 |
| Number of follow‐up visits | ||||
| < 3 weeks vs. > 3 weeks | 1.05 (0.70‐1.57) | 0.83 | 1.08 (0.55‐2.12) | 0.82 |
| Publication date | ||||
| Before (and including) 2007 vs. after 2007 | 0.96 (0.70‐1.33) | 0.81 | 0.77 (0.47‐1.29) | 0.32 |
| Improvement in endoscopy subscore required for definition | ||||
| Yes vs. no | 1.16 (0.85‐1.59) | 0.35 | 1.54 (0.95‐2.48) | 0.08 |
| Improvement in bleeding subscore required for definition | ||||
| Yes vs. no | 1.18 (0.83‐1.67) | 0.36 | 1.0 (0.58‐1.74) | 0.99 |
| Timepoint to measure response response/remission | ||||
| < 6 weeks vs. > 6 weeks | 1.08 (0.76‐1.53) | 0.68 | 0.97 (0.60‐1.59) | 0.92 |
| Number of follow‐up visits | ||||
| < 3 visits vs. > 3 visits | 1.05 (0.70‐1.57) | 0.83 | 1.08 (0.55‐2.12) | 0.82 |
| Duration of follow‐up | ||||
| < 8 weeks vs. > 8 weeks | 0.88 (0.57‐1.37) | 0.59 | 1.41 (0.77‐2.58) | 0.26 |
| Screening visits | ||||
| Yes vs. no | 1.12 (0.75‐0.66) | 0.6 | 0.95 (0.53‐1.72) | 0.9 |
| Number of trial centres | ||||
| per 1‐centre increment | 1.00 (1.00‐1.03) | 0.728 | 1.00 (0.99‐1.00) | 0.304 |
| Publication year | ||||
| Per 1 = year increment | 1.01 (0.99‐1.03) | 0.24 | 0.99 (0.95‐1.03) | 0.65 |
| Extensive disease/pancolitis | ||||
| > 30% vs. < 30% | 1.01 (0.69‐1.47) | 0.969 | 1.23 (0.64‐2.36) | 0.532 |
| Concurrent steroids | ||||
| Yes vs. no | 0.88 (0.59‐1.32) | 0.539 | 1.13(0.63‐2.05) | 0.68 |
| Concurrent immunosuppressive | ||||
| Yes vs. no | 0.76 (0.53‐1.16) | 0.727 | 0.18 (0.66‐2.10) | 0.575 |
| Ratio of active drug | ||||
| Placebo > 1 vs. < 1 | 1.01 (0.68‐1.50) | 0.972 | 0.91 (0.49‐1.67) | 0.757 |
| Primary time point to measure endpoint | ||||
| per 1‐week increment | 1.00 (0.93‐1.07) | 0.97 | 1.06 (1.02‐1.10) | 0.01 |