Tratamientos farmacológicos sistémicos para la psoriasis crónica en placas: un metanálisis en red
Información
- DOI:
- https://doi.org/10.1002/14651858.CD011535.pub2Copiar DOI

- Base de datos:
-
- Cochrane Database of Systematic Reviews
- Versión publicada:
-
- 22 diciembre 2017see what's new
- Tipo:
-
- Intervention
- Etapa:
-
- Review
- Grupo Editorial Cochrane:
-
Grupo Cochrane de Piel
- Copyright:
-
- Copyright © 2017 The Cochrane Collaboration. Published by John Wiley & Sons, Ltd.
Cifras del artículo
Altmetric:
Citado por:
Autores
Contributions of authors
ES and LLC were the contacts with the editorial base.
ES co‐ordinated contributions from the co‐authors and wrote the final draft of the review.
LLC, GD, IGD, and ES screened papers against eligibility criteria.
ES obtained data on ongoing and unpublished studies.
LLC, GD, IGD, CH, CM, CD, and ES appraised the quality of papers.
LLC, GD, IGD, CH, CM, CD, and ES extracted data for the review and sought additional information about papers.
ES entered data into RevMan.
AC analysed and interpreted data.
AC, LLC, and ES worked on the methods sections.
ES and LLC drafted the clinical sections of the background and responded to the clinical comments of the referees.
AC responded to the methodology and statistical comments of the referees.
CH was the consumer co‐author and checked the review for readability and clarity, as well as ensuring outcomes are relevant to consumers.
ES is the guarantor of the update.
Sources of support
Internal sources
-
No sources of support supplied
External sources
-
The National Institute for Health Research (NIHR), UK.
The NIHR, UK, is the largest single funder of the Cochrane Skin Group.
-
The French Society of Dermatology (SFD), France; French Ministry of Health, France.
Grant support was from the Programme Hospitalier de Recherche Clinique (DGOS n°14‐0322). The funding agencies have no role in the design or conduct of the study; collection, management, analysis, or interpretation of the data; or preparation and review of the manuscript.
Declarations of interest
Emilie Sbidian: grant support came from the French Society of Dermatology and the French Ministry of Health, France, the Programme Hospitalier de Recherche Clinique (DGOS no.14‐0322). The funding agencies have no role in the design or conduct of the study; collection, management, analysis, or interpretation of the data; or preparation and review of the manuscript.
Anna Chaimani: nothing to declare.
Ignacio Garcia‐Doval: nothing to declare.
Giao Do: nothing to declare.
Camille Hua: nothing to declare.
Canelle Mazaud: nothing to declare.
Catherine Droitcourt: nothing to declare.
Carolyn Hughes: nothing to declare.
John R Ingram: Dr Ingram is Deputy Editor of the British Journal of Dermatology.
Luigi Naldi: I received compensation for consultancy or participating in advisory board meetings from the following pharmaceutical companies: AbbVie, Almirall, Janssen‐Cilag, Novartis, Sanofi, L'Oreal. My institution also received an unrestricted grant from AbbVie. The money did not fund the review.
Olivier Chosidow: nothing to declare.
Laurence Le Cleach: two grants were obtained to support this review work, one from the French Ministry of Health, France (Programme Hospitalier de Recherche Clinique (DGOS no.14‐0322), and one from the French Society of Dermatology (SFD).
Key Editor Gloria Sanclemente: "I have not been involved in any study included in this review, but in the last three years, I have received sponsoring for attending scientific meetings or congresses by Janssen‐Cilag, Novartis, and AbbVie. I also declare that I am currently co‐ordinating a Diploma in Evidence‐Based Dermatology in which attendees have been sponsored by Pfizer, AbbVie and Novartis laboratories."
Clinical referee Steven Feldman: "I have received research, speaking and/or consulting support from a variety of companies including Galderma, GSK/Stiefel, Almirall, Leo Pharma, Baxter, Boeringer Ingelheim, Mylan, Celgene, Pfizer, Valeant, AbbVie, Cosmederm, Anacor, Astellas, Janssen, Lilly, Merck, Merz, Novartis, Qurient, National Biological Corporation, Caremark, Advance Medical, Suncare Research, Informa, UpToDate and National Psoriasis Foundation. I am founder and majority owner of www.DrScore.com. I am a founder and part owner of Causa Research, a company dedicated to enhancing patients’ adherence to treatment."
Acknowledgements
The Cochrane Skin editorial base wishes to thank Gloria Sanclemente, who was the Cochrane Dermatology Editor for this review; Ben Carter, who was the Statistical Editor; the clinical referees, Tamar Nijstein and Steven Feldman; and Denise Mitchell who copy‐edited sections of this review.
We would like to thank Dr Ibrahim Yaylali from Cochrane Oral Health for his translation of Gurel 2015 from Turkish into English.
We would like to thank Professors Rintaro Mori and Erika Ota from St Luke's International University, Graduate School of Nursing Science, Tokyo, Japan, for their translation of Rinsho Iyaku 1991 from Japanese into English.
This project was supported by the National Institute for Health Research, via Cochrane Infrastructure funding to the Cochrane Skin Group, and was also supported by the Complex Reviews Support Unit, also funded by the National Institute for Health Research (project number 14/178/29).
Department of Health Disclaimer
The views and opinions expressed therein are those of the authors and do not necessarily reflect those of the Systematic Reviews Programme, the Complex Reviews Support Unit, NIHR, NHS, or the Department of Health.
Version history
| Published | Title | Stage | Authors | Version |
| 2023 Jul 12 | Systemic pharmacological treatments for chronic plaque psoriasis: a network meta‐analysis | Review | Emilie Sbidian, Anna Chaimani, Robin Guelimi, Ignacio Garcia-Doval, Camille Hua, Carolyn Hughes, Luigi Naldi, Maria Kinberger, Sivem Afach, Laurence Le Cleach | |
| 2022 May 23 | Systemic pharmacological treatments for chronic plaque psoriasis: a network meta‐analysis | Review | Emilie Sbidian, Anna Chaimani, Ignacio Garcia-Doval, Liz Doney, Corinna Dressler, Camille Hua, Carolyn Hughes, Luigi Naldi, Sivem Afach, Laurence Le Cleach | |
| 2021 Apr 19 | Systemic pharmacological treatments for chronic plaque psoriasis: a network meta‐analysis | Review | Emilie Sbidian, Anna Chaimani, Ignacio Garcia-Doval, Liz Doney, Corinna Dressler, Camille Hua, Carolyn Hughes, Luigi Naldi, Sivem Afach, Laurence Le Cleach | |
| 2020 Jan 09 | Systemic pharmacological treatments for chronic plaque psoriasis: a network meta‐analysis | Review | Emilie Sbidian, Anna Chaimani, Ignacio Garcia-Doval, Liz Doney, Corinna Dressler, Camille Hua, Carolyn Hughes, Luigi Naldi, Sivem Afach, Laurence Le Cleach | |
| 2017 Dec 22 | Systemic pharmacological treatments for chronic plaque psoriasis: a network meta‐analysis | Review | Emilie Sbidian, Anna Chaimani, Ignacio Garcia‐Doval, Giao Do, Camille Hua, Canelle Mazaud, Catherine Droitcourt, Carolyn Hughes, John R Ingram, Luigi Naldi, Olivier Chosidow, Laurence Le Cleach | |
| 2015 Feb 16 | Systemic pharmacological treatments for chronic plaque psoriasis | Protocol | Emilie Sbidian, Laurence Le Cleach, Ludovic Trinquart, Giao Do, Carolyn Hughes, Luigi Naldi, Ignacio Garcia‐Doval, John R Ingram, Olivier Chosidow | |
Differences between protocol and review
1. Between the first protocol submission (January 2014) and the first search (February 2015), we identified and added in the protocol new systemic therapeutics for psoriasis.
-
Background > Description of the intervention
-
-
Oral systemic treatment
-
Biological therapies
-
-
Background > How the intervention might work?
-
-
Oral systemic treatment
-
Biological therapies
-
-
Objectives
We expanded our objectives to clarify the types of systemic treatments for psoriasis. We changed: "To assess the effects of systemic pharmacological treatments for chronic plaque psoriasis" to "To compare the efficacy and safety of conventional systemic agents (acitretin, ciclosporin, fumaric acid esters, methotrexate), small molecules (apremilast, tofacitinib, ponesimod), anti‐TNF alpha (etanercept, infliximab, adalimumab, certolizumab), anti‐IL12/23 (ustekinumab), anti‐IL17 (secukinumab, ixekizumab, brodalumab), anti‐IL23 (guselkumab, tildrakizumab), and other biologics (alefacept, itolizumab) for patients with moderate to severe psoriasis and to provide a ranking of these treatments according to their efficacy and safety."
-
Methods > Types of intervention
We changed: "Systemic and biological treatments include the following: fumaric acid esters, retinoids (acitretin), ciclosporin, methotrexate, infliximab, etanercept, adalimumab, ustekinumab, briakinumab, alefacept, brodalumab, ixekizumab" to the following:
"Systemic and biological treatments included the following:
-
Systemic conventional treatments:
-
-
Fumaric acid esters
-
Acitretin
-
Ciclosporin
-
Methotrexate
-
-
Small molecules
-
-
Apremilast
-
Tofacitinib
-
Ponesimod
-
-
Anti‐TNF alpha
-
-
Infliximab
-
Etanercept
-
Adalimumab
-
Certolizumab
-
-
Anti‐IL12/23
-
-
Ustekinumab
-
-
Anti‐IL17
-
-
Secukinumab
-
Brodalumab
-
Ixekizumab
-
-
Anti‐IL23
-
-
Tildrakizumab
-
Guselkumab
-
-
Other biologic treatment
-
-
Itolizumab
-
Alefacept
-
A new anti‐IL23 molecule (BI 655066, risankizumab) appeared after we began this review and was not included in this systematic review. However, the ongoing studies of risankizumab have been reported in this review."
2. Background > Why it is important to do this review?
We updated the published literature regarding other systemic reviews and meta‐analyses.
3. Methods > Criteria for considering studies for this review
Selection of trials
We added: "Phase I trials were not eligible because participants, outcomes, dosages, and schema of administration of interventions are too different from phase II, III, and IV studies."
Outcomes
Primary outcome 1
In the Protocol, we wrote, "The proportion of participants who achieved clear or almost clear skin. (By clear or almost clear, we mean a Physician Global Assessment (PGA) value of 0 or 1 or a 90/100 PASI.)"
In the review, we changed this sentence to "The proportion of participants who achieved clear or almost clear skin, that is, at least PASI 90".
As PASI and PGA are two different scales, we preferred to assess them separately and added as a secondary outcome "Proportion of participants who achieve a Physician Global Assessment (PGA) value of 0 or 1".
Primary outcome 1
We also modified the sentence about serious adverse effects (SAEs) (in the protocol we said we would use the FDA's definition): "The proportion of participants with serious adverse effects (SAE). We used the definition of severe adverse effects from the International Conference of Harmonisation of Technical Requirements for Registration of Pharmaceuticals for Human Use, which includes death, life‐threatening events, initial or prolonged hospitalisation, and adverse events requiring intervention to prevent permanent impairment or damage." The definition remains the same.
Secondary outcome 3
For'Quality of life measured by a specific scale', we listed Dermatology Life Quality Index (DLQI), Skindex, Psoriasis Disability Index (PDI), or Psoriasis Symptom Inventory (PSI). It is not an exhaustive list. Moreover, we had PSI as a validated scale because it was used by some study authors.
Timings
We modified the period of the induction therapy assessment to less than 24 weeks after randomisation instead of 12 to 24 weeks because Nast et al defined the induction period as being with a duration less than 24 weeks (Nast 2015b).
To avoid duplicating text, we removed the text discussing timing for remission, as published in the protocol, and edited the timings for induction and maintenance therapy to include the relevant short‐ or long‐term remission classification. We also removed the timings given in the protocol for the quality of life outcome for the same reason (we felt the text was duplicative).
We clarified that our inclusion criteria was to only include studies that reported our timings of interest by editing as follows: "We did not include studies that had timings outside of these time ranges in our analyses" to "We did not include studies that had timings outside of these time ranges in our review."
4. Methods > Search methods for identification of studies
We removed the following two sentences from the review:
"We contacted key investigators and experts in the field to identify further published or unpublished data."
"We contacted pharmaceuticals companies producing fumaric acid esters, and retinoids (fumaric acid esters, retinoids (acitretin), ciclosporin, methotrexate, alefacept, infliximab, etanercept, adalimumab, certolizumab, ustekinumab, secukinumab, brodalumab, ixekizumab, tildrakizumab, guselkumab, Itolizumab, apremilast, tofacitinib, ponesimod."
We replaced them with the following:
"We searched in the trial results databases of each company to identify ongoing and unpublished trials."
5. Methods > Data extraction and management
We added some details regarding the data extraction (outcome data, other data) for greater clarity and added the sentence, "We extracted the data from the reports of the U.S. Food and Drug Administration (FDA) when available, if not from the US National Institutes of Health Ongoing Trials Register ClinicalTrials.gov (www.clinicaltrials.gov), and finally from the published reports."
6. Methods > Assessment of risk of bias in included studies
We added information regarding the network meta‐analysis 'Risk of bias' assessment (under "overall risk of bias").
Network meta‐analysis
"To summarise the quality of evidence and to interpret the network results, we used these six RoB criteria (random sequence generation, allocation concealment, blinding of participants, blinding of outcome assessor, incomplete outcome data, and selective outcome reporting) in order to classify each trial.
We would classify the trial as having low risk of bias if we rated none of the domains above as high risk of bias and two or less as unclear risk.
We would classify the trial as having moderate risk of bias if we rated one domain as high risk of bias, one or less domains as unclear risk, or no domains as high risk of bias but three or less were rated as unclear risk.
All other cases were assumed to pertain to high risk of bias."
7. Methods > Measure of treatment effect
We added an explanation related to relative treatment ranking.
8. Methods > Dealing with missing data
We clarified who the authors or sponsors we contacted were: "We contacted trial authors or sponsors by email to request missing outcome data (numbers of events and numbers of participants for important dichotomous clinical outcomes) when these were not available in study reports that were less than 10 years old."
9. Methods > Assessment of reporting bias and Assessment of heterogeneity
We added an explanation regarding the network meta‐analysis:
"We undertook meta‐analyses only if we judged participants, interventions, comparisons, and outcomes to be sufficiently similar (section 9.5.2 of the Cochrane Handbook for Systematic Reviews of Interventions) (Higgins 2011). Potential sources of heterogeneity included participants' baseline characteristics (weight, the duration of previous treatment, treatment doses, co‐interventions, and duration of treatment). When enough data were available, we investigated the distributions of these characteristics across studies and treatment comparisons. The latter allows assessing transitivity, i.e. whether there were important differences between the trials evaluating different comparisons other than the treatments being compared (Salanti 2014). To further reassure the plausibility of the transitivity assumption, we only included in our analyses trials not involving co‐interventions and with a timing of outcome assessment from 12 to 16 weeks.
In the classical meta‐analyses, we assessed statistical heterogeneity by visual inspection of the forest plots and using the Q‐test and the I² statistic. We interpreted the I² statistic according to the following thresholds (section 9.5.2 of the Cochrane Handbook for Systematic Reviews of Interventions; Higgins 2011): 0% to 40% might not be important; 30% to 60% may represent moderate heterogeneity; 50% to 90% may represent substantial heterogeneity; 75% to 100% represents considerable heterogeneity.
In the network meta‐analysis, the assessment of statistical heterogeneity in the entire network was based on the estimated heterogeneity standard deviation parameter (τ) estimated from the network meta‐analysis models (Jackson 2014). We inferred on the presence or absence of important heterogeneity by comparing the magnitude of τ with the empirical distributions provided in Turner et al and Rhodes et al (Rhodes 2015; Turner 2012). We also estimated the prediction intervals to assess how much the estimated heterogeneity affects the relative effects with respect to the additional uncertainly anticipated in future studies (Riley 2011). Where feasible, we would have investigated the possible sources of heterogeneity in subgroup analyses and meta‐regression.
Although we restricted the risk of important heterogeneity in our data by considering eligible only studies with a follow‐up period between 12 and 16 weeks and without co‐interventions, we investigated differences in heterogeneity across the different analyses. Specifically, we observed whether splitting the nodes of the network and analysing each drug separately reduced the heterogeneity estimate. We also ran a series of sensitivity analyses (see Sensitivity analysis), and we monitored whether heterogeneity became smaller or larger compared to the primary analysis."
Assessment of reporting biases
To assess reporting biases, we used an adaptation of the funnel plot by subtracting from each study‐specific effect size the mean of meta‐analysis of the study‐specific comparison, which we plotted against the study standard error (Chaimani 2013). We employed this 'comparison‐adjusted funnel plot' for all comparisons of an active treatment against placebo. When we detected funnel plot asymmetry for the two primary outcomes, we investigated the presence of small‐study effects in the network meta‐regression (Chaimani 2012).
10. Methods > Data synthesis
We added the software used for the review: "We conducted pair‐wise meta‐analyses using Review Manager 5 (RevMan 5) (Revman 2014), and we performed all other analyses in Stata 14 using the 'network' (www.stata‐journal.com/article.html?article=st0410) and 'network graphs' packages (www.stata‐journal.com/article.html?article=st0411)."
11. Methods > Sensitivity analysis
We added "To assess the robustness of our results, we performed the following sensitivity analyses for the two primary outcomes: (1) running the analysis at dose‐level considering that each different drug dose is a different intervention; (2) excluding trials at high risk of bias; (3) excluding trials with a total sample size smaller than 50 randomised participants; and (4) analysing only the observed participants assuming that missing participants are missing at random."
12. Methods > 'Summary of findings' table
We added a section detailing the methods used to create the 'Summary of findings' tables; we also explained how we used GRADE to assess the certainty (quality/confidence) of the evidence.
13. Contributions of authors
We changed or added authors' contributions:
LLC, GD, IGD, and ES screened papers against eligibility criteria.
LLC, GD, IGD, CH, CM, CD, and ES appraised the quality of papers.
LLC, GD, IGD, CH, CM, CD, and ES extracted data for the review and sought additional information about papers.
AC responded to the methodological and statistical comments of the referees instead of LT (Ludovic Trinquard was no longer available and was replaced by Anna Chaimani).
AC, LLC, and ES worked on the methods sections instead of LT, ES, and LLC (Ludovic Trinquard was no longer available and was replaced by Anna Chaimani).
Keywords
MeSH
Medical Subject Headings (MeSH) Keywords
Medical Subject Headings Check Words
Adult; Female; Humans; Male;
PICO

Study flow diagram

'Risk of bias' summary: review authors' judgements about each 'Risk of bias' item for each included study

'Risk of bias' graph: review authors' judgements about each 'Risk of bias' item presented as percentages across all included studies

Network plot for all the outcomes at class‐level
The size of the nodes is proportional to the total number of participants allocated to each intervention and the thickness of the lines proportional to the number of studies evaluating each direct comparison.
AE: adverse events; PASI: Psoriasis Area and Severity Index; PGA: Physician Global Assessment; QoL: quality of life; SAE: serious adverse events

Network plot for all the outcomes at drug‐level
The size of the nodes is proportional to the total number of participants allocated to each intervention and the thickness of the lines proportional to the number of studies evaluating each direct comparison.
ACI: acitretin; ADA: adalimumab; APRE: apremilast; BRODA: brodalumab; CERTO: certolizumab; CICLO: ciclosporin; ETA: etanercept; FUM: fumaric acid; IFX: infliximab; ITO: itolizumab; IXE: ixekizumab; GUSEL: guselkumab; MTX: methotrexate; PBO: placebo; PONE: ponesimod; SECU: secukinumab; TILDRA: tildrakizumab; TOFA: tofacitinib; USK: ustekinumab
AE: adverse events; PASI: Psoriasis Area and Severity Index; PGA: Physician Global Assessment; QoL: quality of life; SAE: serious adverse events
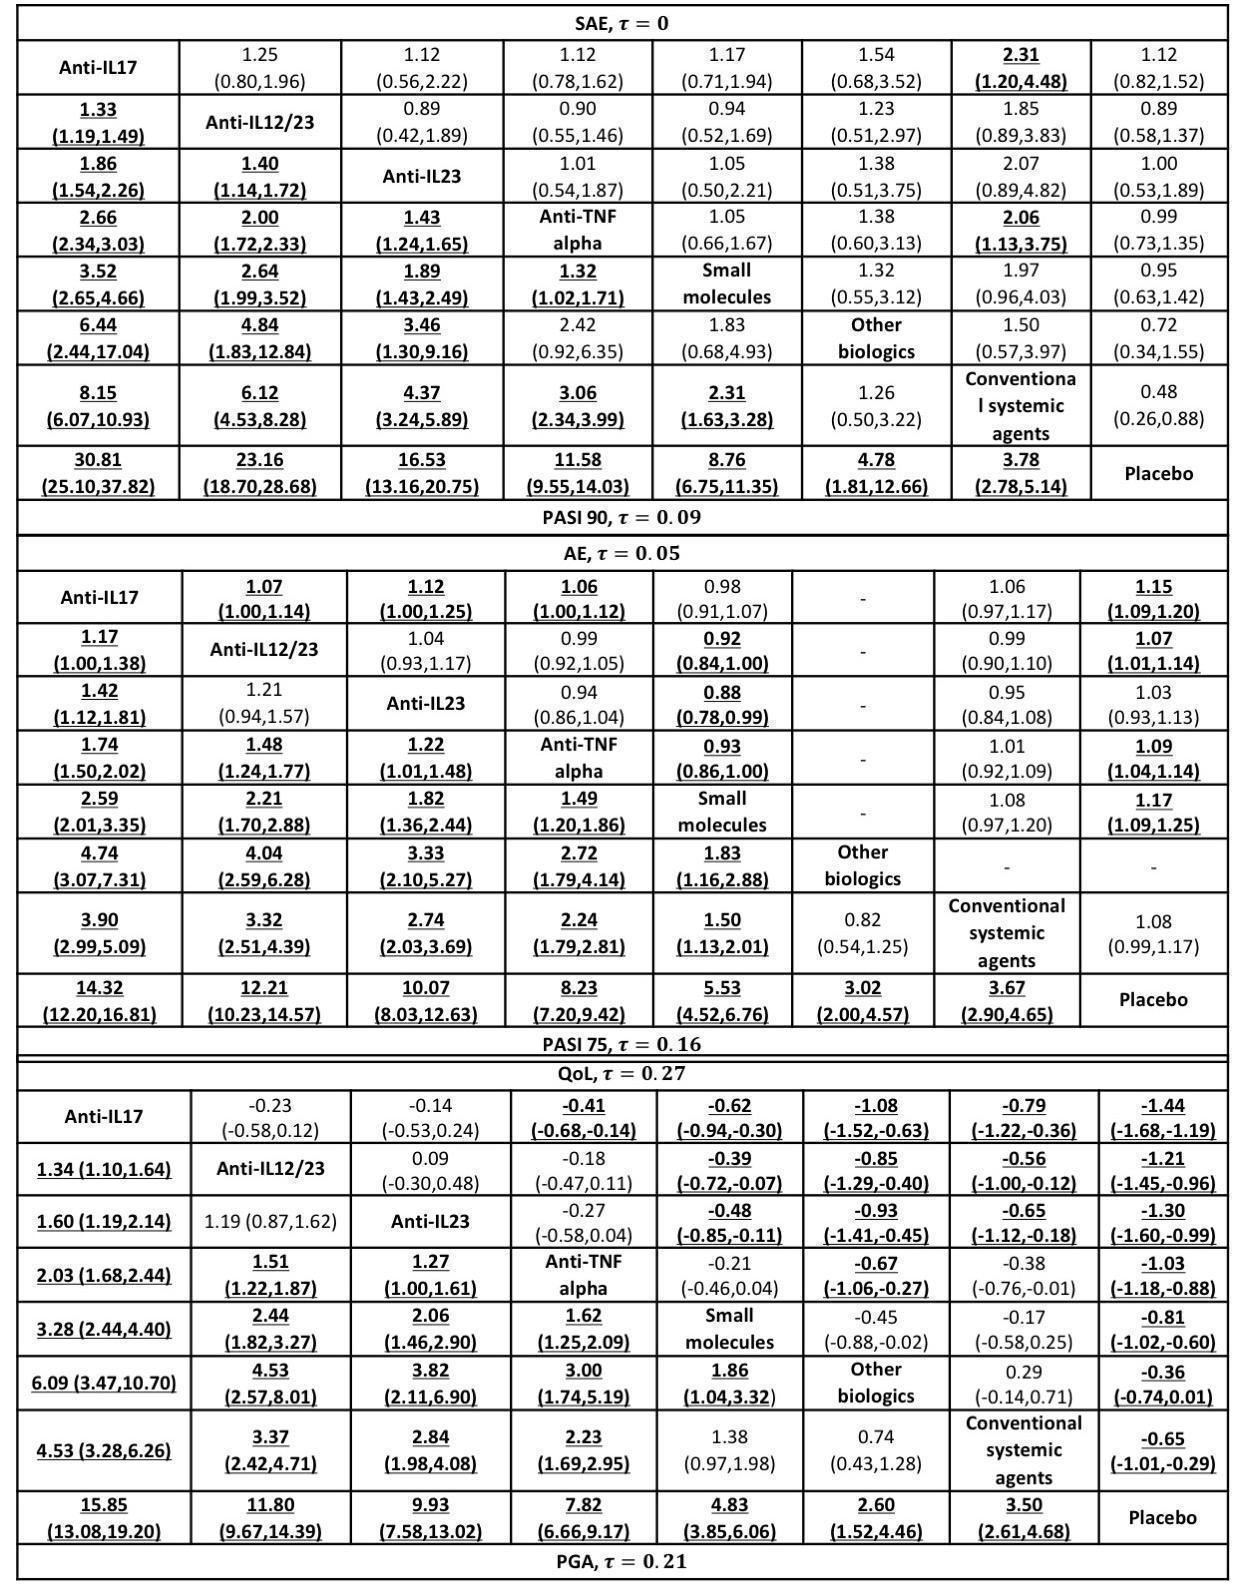
Relative effects of the class‐level intervention as estimated from the network meta‐analysis model
Drugs are reported in order of primary benefit ranking. Each cell contains the risk ratio (RR) (for dichotomous outcomes: PASI 90, serious adverse events, PASI 75, PGA 0/1, adverse events) or the standardised mean difference (SMD) (for the quality‐of‐life outcome), plus the 95% confidence interval, of the class level in the respective column versus the class level in the respective row. RRs larger than 1 for the lower triangle and smaller than 1 (or SMDs smaller than zero) for the upper triangle favour the treatment on the left. Significant results are bolded and underscored.
AE: adverse events; PASI: Psoriasis Area and Severity Index; PGA: Physician's Global Assessment; QoL: quality of life; SAE: serious adverse events

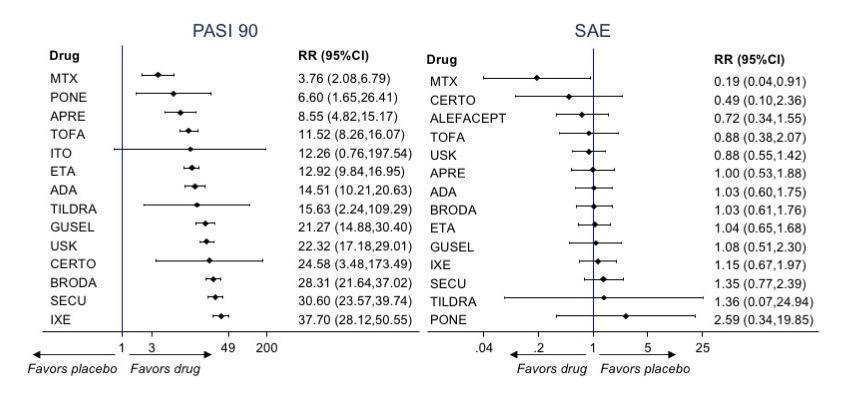
Relative effects of the intervention as estimated from the network meta‐analysis model for Psoriasis Area and Severity Index (PASI) 90 and serious adverse events (SAEs)
Drugs are reported in order of primary benefit ranking. Each cell contains the risk ratio (RR) and 95% confidence interval for the two primary outcomes (PASI 90 and SAEs) of the intervention in the respective column versus the class level in the respective row. RRs larger than 1 for the lower triangle and smaller than 1 for the upper triangle favour the treatment on the left. Significant results are highlighted in grey.
ACI: acitretin; ADA: adalimumab; APRE: apremilast; BRODA: brodalumab; CERTO: certolizumab; CICLO: ciclosporin; ETA: etanercept; FUM: fumaric acid; IFX: infliximab; ITO: itolizumab; IXE: ixekizumab; GUSEL: guselkumab; MTX: methotrexate; PBO: placebo; PONE: ponesimod; SECU: secukinumab; τ (Tau): estimated heterogeneity standard deviation parameter; TILDRA: tildrakizumab; TOFA: tofacitinib; USK: ustekinumab

Relative effects of the intervention as estimated from the network meta‐analysis model for Psoriasis Area and Severity Index (PASI 75) and adverse events (AEs)
Drugs are reported in order of primary benefit ranking. Each cell contains the Risk Ratio (RR) and 95% confidence interval for the two secondary outcomes (PASI 75 and adverse events) of the intervention in the respective column versus the comparator in the respective row. RRs larger than 1 for the lower triangle and smaller than 1 for the upper triangle favour the treatment on the left. Significant results are are highlighted in grey.
ACI: acitretin; ADA: adalimumab; APRE: apremilast; BRODA: brodalumab; CERTO: certolizumab; CICLO: ciclosporin; ETA: etanercept; FUM: fumaric acid; IFX: infliximab; ITO: itolizumab; IXE: ixekizumab; GUSEL: guselkumab; MTX: methotrexate; PBO: placebo; PONE: ponesimod; SECU: secukinumab; τ (Tau): estimated heterogeneity standard deviation parameter; TILDRA: tildrakizumab; TOFA: tofacitinib; USK: ustekinumab

Relative effects of the intervention as estimated from the network meta‐analysis model for Physician's Global Assessment (PGA 0/1) and quality of life (QoL)
Drugs are reported in order of primary benefit ranking. Each cell contains the risk ratio (RR) and 95% confidence interval (PGA 0/1) or standardized mean difference (quality of life) of the intervention in the respective column versus the comparator in the respective row. RRs larger than 1 for the lower triangle and smaller than 1 (or SMDs smaller than zero) for the upper triangle favour the treatment on the left. Significant results are are highlighted in grey.
ACI: acitretin; ADA: adalimumab; APRE: apremilast; BRODA: brodalumab; CERTO: certolizumab; CICLO: ciclosporin; ETA: etanercept; FUM: fumaric acid; IFX: infliximab; ITO: itolizumab; IXE: ixekizumab; GUSEL: guselkumab; MTX: methotrexate; PBO: placebo; PONE: ponesimod; SECU: secukinumab; τ (Tau): estimated heterogeneity standard deviation parameter; TILDRA: tildrakizumab; TOFA: tofacitinib; USK: ustekinumab

Interval plot. Network meta‐analysis estimates of class‐level versus placebo for all the outcomes
AE: adverse events; CI: confidence interval; PGA: Physician Global Assessment; PrI: predictive interval; QoL: Specific quality of life scale; RR: risk ratio; SAE: serious adverse events; SMD: standardised mean difference

Interval plot. Network meta‐analysis estimates of the interventions versus placebo for all the outcomes
AE: adverse events; CI: confidence interval; PGA: Physician Global Assessment; PrI: predictive interval; QoL: Specific quality of life scale; RR: risk ratio; SAE: serious adverse events; SMD: standardised mean difference
ACI: acitretin; ADA: adalimumab; APRE: apremilast; BRODA: brodalumab; CERTO: certolizumab; CICLO: ciclosporin; ETA: etanercept; FUM: fumaric acid; IFX: infliximab; ITO: itolizumab; IXE: ixekizumab; GUSEL: guselkumab; MTX: methotrexate; PBO: placebo; PONE: ponesimod; SECU: secukinumab; TILDRA: tildrakizumab; TOFA: tofacitinib; USK: ustekinumab
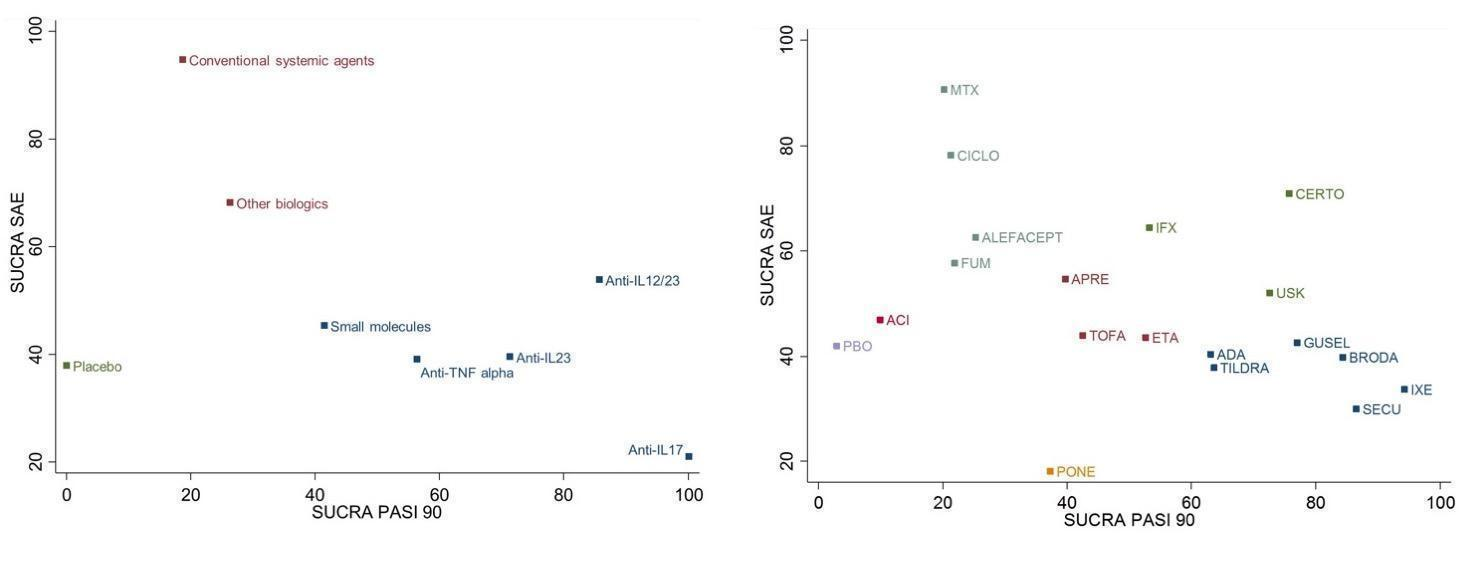
Ranking plot. Ranking plot representing simultaneously the efficacy (x axis, PASI 90) and the acceptability (y axis, serious adverse events) of all the interventions (class and drug levels) for patients with moderate‐to‐severe psoriasis. Optimal treatment should be characterised by both high efficacy and acceptability and should be in the right upper corner of this graph.
The different colours represent different groups of interventions considering their performance on both outcomes simultaneously. Interventions belonging to the same group are assumed having a similar performance when the two primary outcomes are considered jointly
ACI: acitretin; ADA: adalimumab; APRE: apremilast; BRODA: brodalumab; CERTO: certolizumab; CICLO: ciclosporin; ETA: etanercept; FUM: fumaric acid; IFX: infliximab; ITO: itolizumab; IXE: ixekizumab; GUSEL: guselkumab; MTX: methotrexate; PBO: placebo; PONE: ponesimod; SECU: secukinumab; TILDRA: tildrakizumab; TOFA: tofacitinib; USK: ustekinumab
PASI: Psoriasis Area and Severity Index; SAE: serious adverse events; SUCRA: surface under the cumulative ranking curve

Ranking for all the outcomes at class level
AE: adverse events; PASI: Psoriasis Area and Severity Index; PGA: Physician Global Assessment; QoL: quality of life; SAE: serious adverse events

Ranking for all the outcomes at drug level
ACI: acitretin; ADA: adalimumab; APRE: apremilast; BRODA: brodalumab; CERTO: certolizumab; CICLO: ciclosporin; ETA: etanercept; FUM: fumaric acid; IFX: infliximab; ITO: itolizumab; IXE: ixekizumab; GUSEL: guselkumab; MTX: methotrexate; PBO: placebo; PONE: ponesimod; SECU: secukinumab; TILDRA: tildrakizumab; TOFA: tofacitinib; USK: ustekinumab
AE: adverse events; PASI: Psoriasis Area and Severity Index; PGA: Physician Global Assessment; QoL: quality of life; SAE: serious adverse events

PASI 90: direct summary effects for comparisons including at least two studies at class level
AIL12/23: anti‐IL12/23; AIL17: anti‐IL17; AIL23: anti‐IL23, ATA: anti‐TNF alpha; CSA: conventional systemic agents; OB: other biologics; PBO: placebo; SM: small molecules
CI: confidence interval; PASI: Psoriasis Area and Severity Index; RR: risk ratio

Serious adverse effects: direct summary effects for comparisons including at least two studies at class level
AIL12/23: anti‐IL12/23; AIL17: anti‐IL17; AIL23: anti‐IL23, ATA: anti‐TNF alpha; CSA: conventional systemic agents; OB: other biologics; PBO: placebo; SM: small molecules
CI: confidence interval; RR: risk ratio; SAE: serious adverse events

Specific quality of life scale: direct summary effects for comparisons including at least two studies at class level
AIL12/23: anti‐IL12/23; AIL17: anti‐IL17; AIL23: anti‐IL23, ATA: anti‐TNF alpha; CSA: conventional systemic agents; OB: other biologics; PBO: placebo; SM: small molecules
CI: confidence interval; QoL: specific quality of life scale; SMD: standardised mean difference

Physician Global Assessment 0/1: direct summary effects for comparisons including at least two studies at class‐level
AIL12/23: anti‐IL12/23; AIL17: anti‐IL17; AIL23: anti‐IL23, ATA: anti‐TNF alpha; CSA: conventional systemic agents; OB: other biologics; PBO: placebo; SM: small molecules
AE: adverse events; CI: confidence interval; PGA: Physician Global Assessment; RR: risk ratio

PASI 75: direct summary effects for comparisons including at least two studies at class level
AIL12/23: anti‐IL12/23; AIL17: anti‐IL17; AIL23: anti‐IL23, ATA: anti‐TNF alpha; CSA: conventional systemic agents; OB: other biologics; PBO: placebo; SM: small molecules
CI: confidence interval; PASI: Psoriasis Area and Severity Index; RR: risk ratio
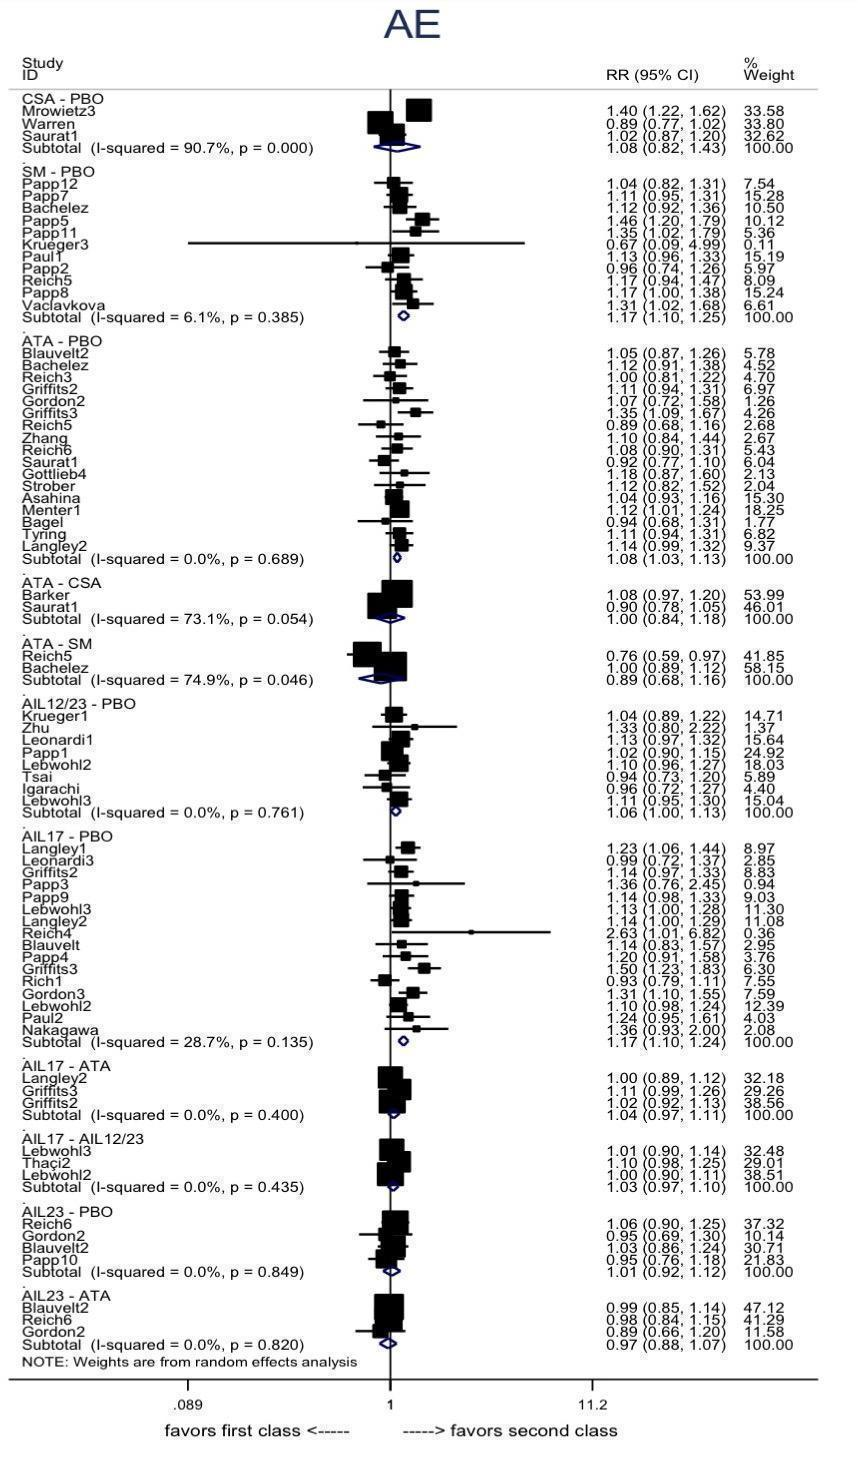
Adverse effects : direct summary effects for comparisons including at least two studies at class‐level
AIL12/23: anti‐IL12/23; AIL17: anti‐IL17; AIL23: anti‐IL23, ATA: anti‐TNF alpha; CSA: conventional systemic agents; OB: other biologics; PBO: placebo; SM: small molecules
AE: adverse events; CI: confidence interval; RR: risk ratio
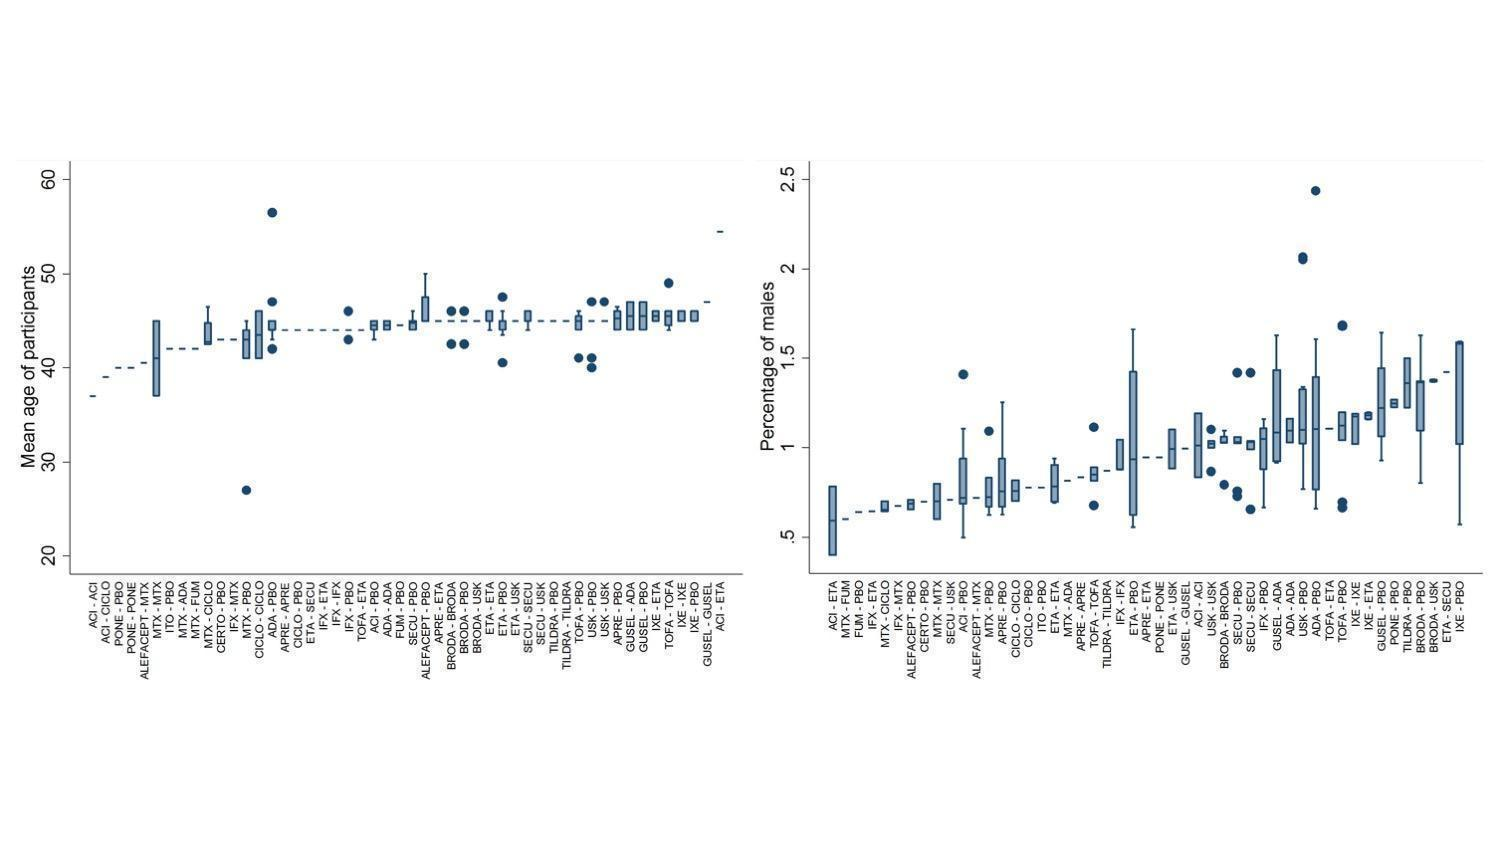
Distributions of age and sex ratio of participants across comparisons
ACI: acitretin; ADA: adalimumab; APRE: apremilast; BRODA: brodalumab; CERTO: certolizumab; CICLO: ciclosporin; ETA: etanercept; FUM: fumaric acid; IFX: infliximab; ITO: itolizumab; IXE: ixekizumab; GUSEL: guselkumab; MTX: methotrexate; PBO: placebo; PONE: ponesimod; SECU: secukinumab; TILDRA: tildrakizumab; TOFA: tofacitinib; USK: ustekinumab
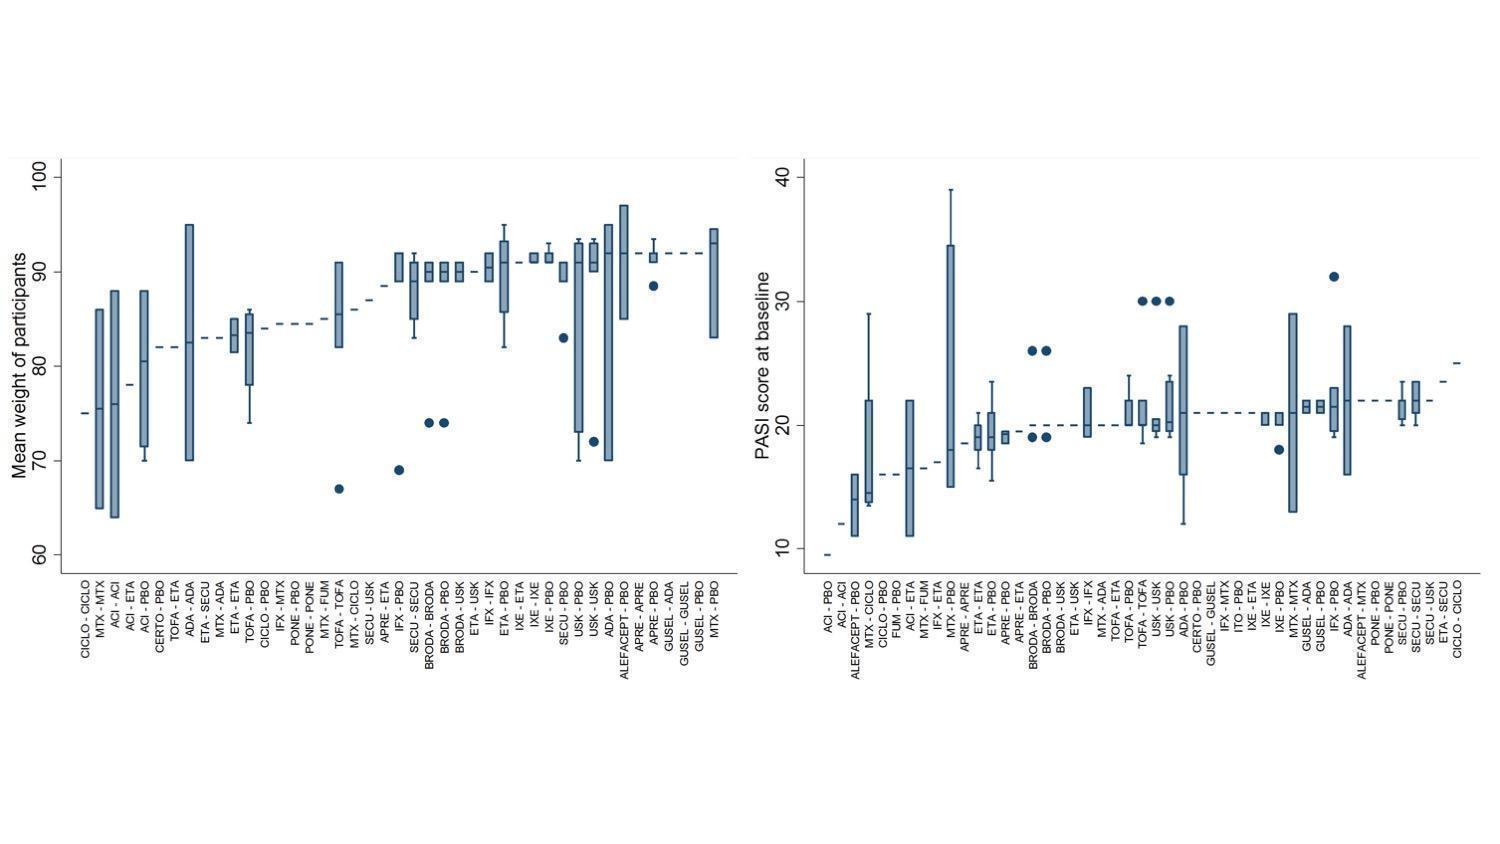
Distributions of weight of participants and PASI score at baseline across comparisons
ACI: acitretin; ADA: adalimumab; APRE: apremilast; BRODA: brodalumab; CERTO: certolizumab; CICLO: ciclosporin; ETA: etanercept; FUM: fumaric acid; IFX: infliximab; ITO: itolizumab; IXE: ixekizumab; GUSEL: guselkumab; MTX: methotrexate; PBO: placebo; PONE: ponesimod; SECU: secukinumab; TILDRA: tildrakizumab; TOFA: tofacitinib; USK: ustekinumab
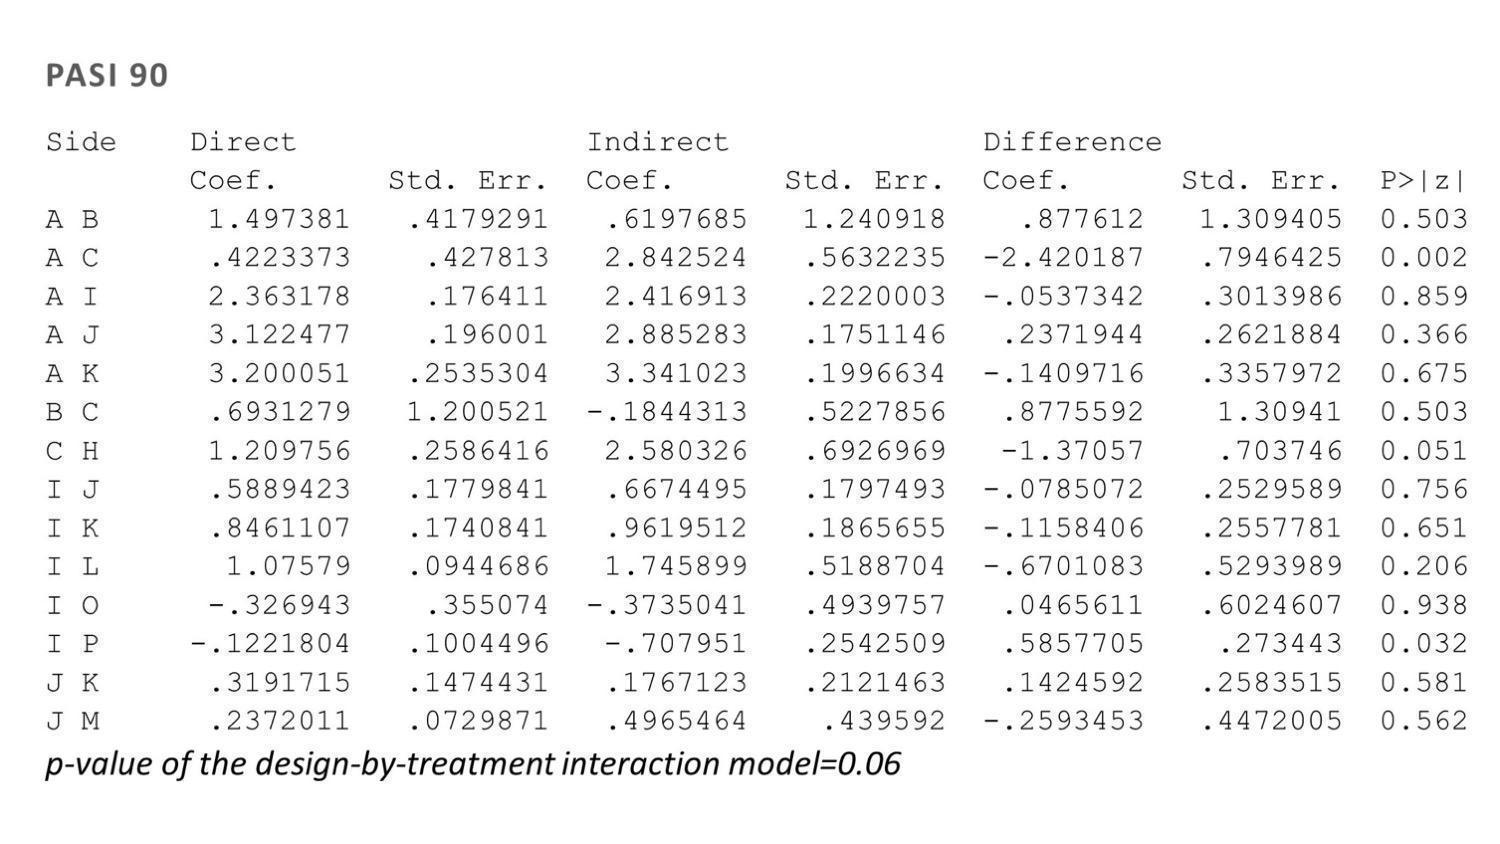
Side‐splitting approach and design‐by‐treatment interaction model for inconsistency for Psoriasis Area and Severity Index (PASI) 90
Treatment codes: A = PBO, B = FUM, C = MTX, D = ACI, E = ALEFACEPT, F = CICLO, G = IFX, H = ADA, I = ETA, J = USK, K = SECU, L = IXE, M = BRODA, N = CERTO, O = APRE, P = TOFA, Q = GUSEL, R = TILDRA, S = PONE, T = ITO
ACI: acitretin; ADA: adalimumab; APRE: apremilast; BRODA: brodalumab; CERTO: certolizumab; CICLO: ciclosporin; ETA: etanercept; FUM: fumaric acid; IFX: infliximab; ITO: itolizumab; IXE: ixekizumab; GUSEL: guselkumab; MTX: methotrexate; PBO: placebo; PONE: ponesimod; SECU: secukinumab; TILDRA: tildrakizumab; TOFA: tofacitinib; USK: ustekinumab

Side‐splitting approach and design‐by‐treatment interaction model for inconsistency for serious adverse events (SAEs)
Treatment codes: A = PBO, B = FUM, C = MTX, D = ACI, E = ALEFACEPT, F = CICLO, G = IFX, H = ADA, I = ETA, J = USK, K = SECU, L = IXE, M = BRODA, N = CERTO, O = APRE, P = TOFA, Q = GUSEL, R = TILDRA, S = PONE, T = ITO
ACI: acitretin; ADA: adalimumab; APRE: apremilast; BRODA: brodalumab; CERTO: certolizumab; CICLO: ciclosporin; ETA: etanercept; FUM: fumaric acid; IFX: infliximab; ITO: itolizumab; IXE: ixekizumab; GUSEL: guselkumab; MTX: methotrexate; PBO: placebo; PONE: ponesimod; SECU: secukinumab; TILDRA: tildrakizumab; TOFA: tofacitinib; USK: ustekinumab
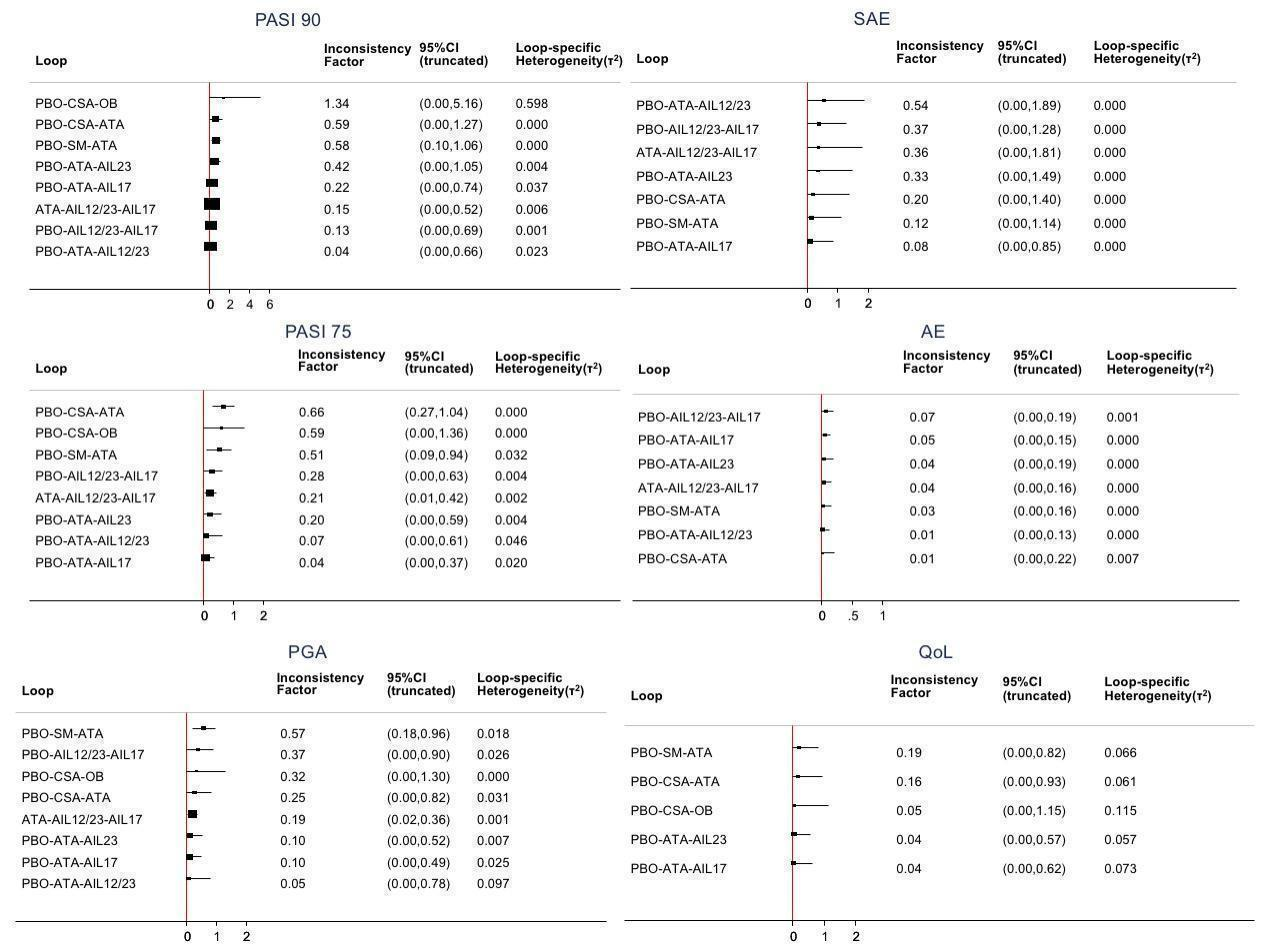
Inconsistency plots for all the outcomes at class‐level
Inconsistency factor (IF) is calculated as the risk ratio (RR)/standardised mean difference (SMD) for direct evidence over the RR/SMD for indirect evidence in the loop with its 95% confidence interval (CI). IF value close to 0 indicates the absence of evidence for disagreement between direct and indirect evidence.
AIL12/23: anti‐IL12/23; AIL17: anti‐IL17; AIL23: anti‐IL23, ATA: anti‐TNF alpha; CSA: conventional systemic agents; OB: other biologics; PBO: placebo; SM: small molecules
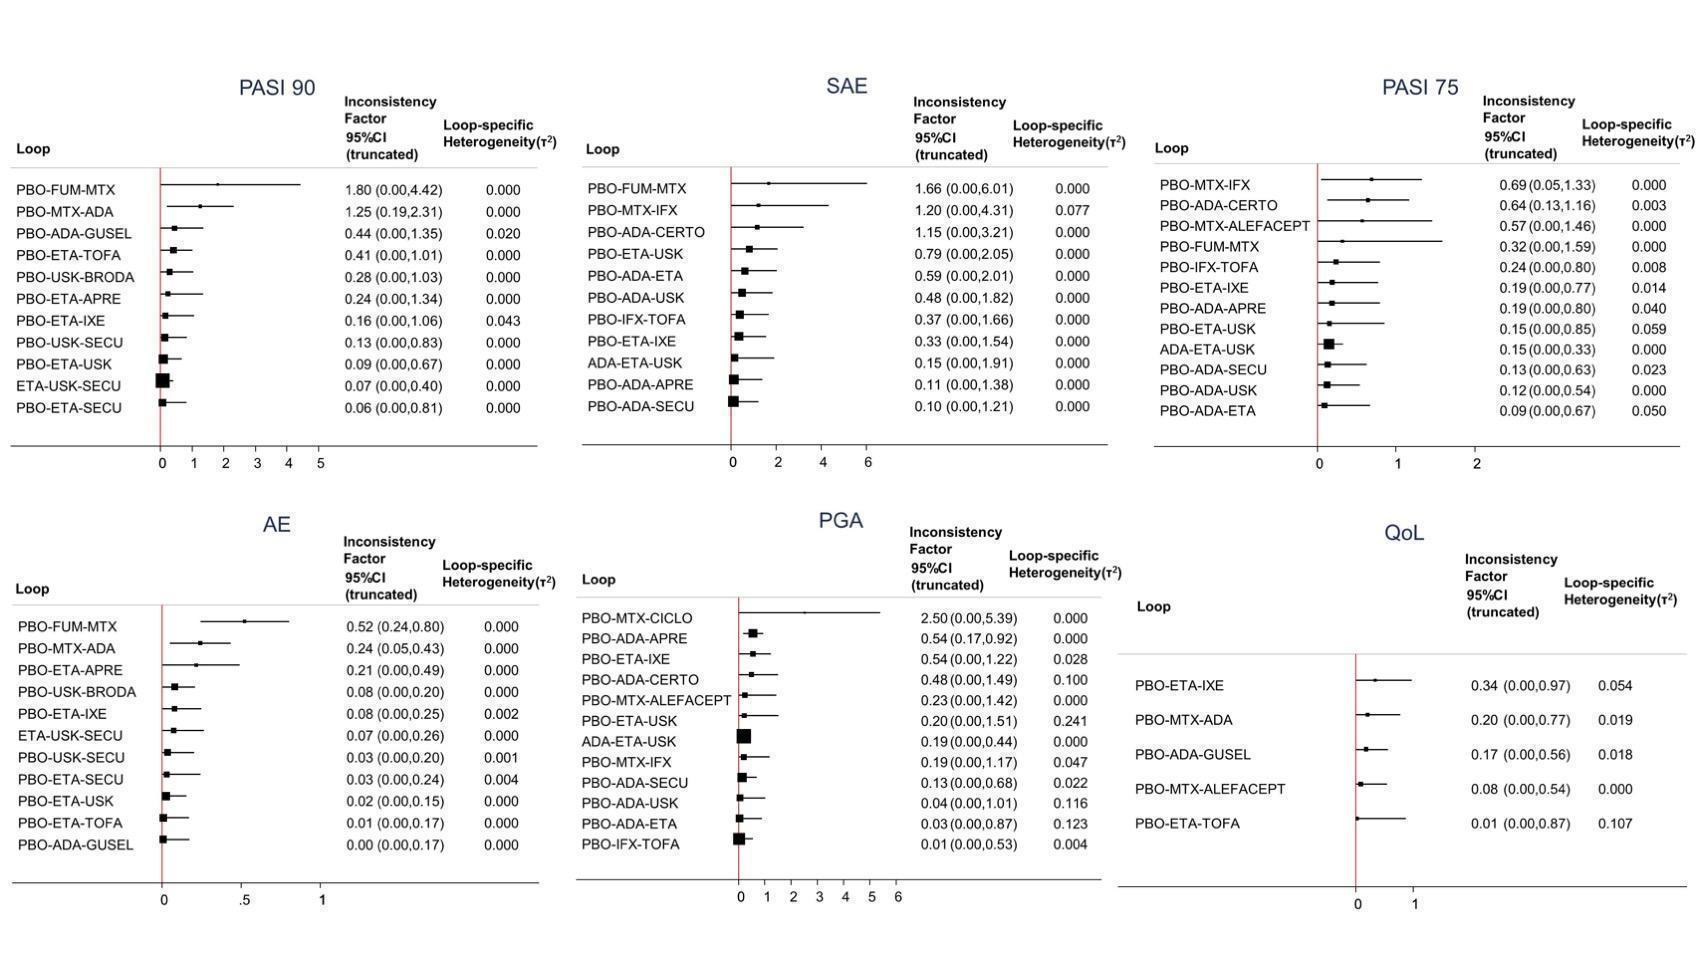
Inconsistency plots for all the outcomes at drug level
Inconsistency factor (IF) is calculated as the risk ratio (RR)/standardised mean difference (SMD) for direct evidence over the RR/SMD for indirect evidence in the loop with its 95% confidence interval (CI). IF value close to 0 indicates the absence of evidence for disagreement between direct and indirect evidence.
ACI: acitretin; ADA: adalimumab; APRE: apremilast; BRODA: brodalumab; CERTO: certolizumab; CICLO: ciclosporin; ETA: etanercept; FUM: fumaric acid; IFX: infliximab; ITO: itolizumab; IXE: ixekizumab; GUSEL: guselkumab; MTX: methotrexate; PBO: placebo; PONE: ponesimod; SECU: secukinumab; TILDRA: tildrakizumab; TOFA: tofacitinib; USK: ustekinumab

Sensitivity analyses ‐ Interval plot. Network meta‐analysis results for primary outcomes (PASI 90 and serious adverse events) for trials with at least 50 participants.
ACI: acitretin; ADA: adalimumab; APRE: apremilast; BRODA: brodalumab; CERTO: certolizumab; CICLO: ciclosporin; ETA: etanercept; FUM: fumaric acid; IFX: infliximab; ITO: itolizumab; IXE: ixekizumab; GUSEL: guselkumab; MTX: methotrexate; PBO: placebo; PONE: ponesimod; SECU: secukinumab; TILDRA: tildrakizumab; TOFA: tofacitinib; USK: ustekinumab
CI: confidence interval; PASI: Psoriasis Area and Severity Index; RR: risk ratio; SAE: serious adverse events

Sensitivity analyses ‐ Interval plot. Network meta‐analysis results for primary outcomes (PASI 90 and serious adverse events) for the completers.
ACI: acitretin; ADA: adalimumab; APRE: apremilast; BRODA: brodalumab; CERTO: certolizumab; CICLO: ciclosporin; ETA: etanercept; FUM: fumaric acid; IFX: infliximab; ITO: itolizumab; IXE: ixekizumab; GUSEL: guselkumab; MTX: methotrexate; PBO: placebo; PONE: ponesimod; SECU: secukinumab; TILDRA: tildrakizumab; TOFA: tofacitinib; USK: ustekinumab
CI: confidence interval; PASI: Psoriasis Area and Severity Index; RR: risk ratio; SAE: serious adverse events

Sensitivity analyses ‐ Interval plot. Network meta‐analysis results for primary outcomes (PASI 90 and serious adverse events) for all the interventions depending on the doses
MTX ≥ 15/MTX other: methotrexate ≥ 15 mg per week/methotrexate < 15 mg per week; ALEFACEPT: alefacept all dosages; CICLO High: ciclosporin ≥ 3 mg/kg/day; ACI ≥ 35: acitretin ≥ 35 mg per day; FUM: fumaric acid esters all dosages; APRE 30: apremilast 30 mg twice daily; PONE 40: ponesimod 40 mg per day; TOFA 20: tofacitinib 20 mg per day; ETA 25/ETA 50: etanercept 25 mg twice a week/etanercept 50 mg twice a week; IFX: infliximab 5 mg/kg week O, 2, 4 every 6 weeks; ADA: adalimumab 80 mg Week 0, 40 mg Week 1 then 40 mg every other week; CERTO 200/400: certolizumab all dosages; USK 45: ustekinumab 45 mg; SECU 300/SECU other: secukinumab 300 mg every injection/secukinumab other dosages; IXE 200/IXE other: ixekizumab 200 mg per injection/ixekizumab other dosages; TILDRA 100/200: tildrakizumab all dosages; GUSEL 100: guselkumab 100 mg per injection; BRODA 210: brodalumab 210 mg per injection
CI: confidence interval; PASI: Psoriasis Area and Severity Index; RR: risk ratio; SAE: serious adverse events
Sensitivity analyses ‐ Interval plot. Network meta‐analysis results for primary outcomes (PASI 90 and serious adverse events) for all the interventions excluding studies at high risk of bias.
ACI: acitretin; ADA: adalimumab; APRE: apremilast; BRODA: brodalumab; CERTO: certolizumab; CICLO: ciclosporin; ETA: etanercept; FUM: fumaric acid; IFX: infliximab; ITO: itolizumab; IXE: ixekizumab; GUSEL: guselkumab; MTX: methotrexate; PBO: placebo; PONE: ponesimod; SECU: secukinumab; TILDRA: tildrakizumab; TOFA: tofacitinib; USK: ustekinumab
CI: confidence interval; PASI: Psoriasis Area and Severity Index; RR: risk ratio; SAE: serious adverse events

Funnel plot for network meta‐analysis of all the outcomes
AE: adverse event; lnRR: Mean effect size; PASI: Psoriasis Area and Severity Index; QoL: Specific quality of life scale; RR: Risk ratio; SAE: serious adverse events; SMD: standardised mean difference

Study bias distribution for each primary outcome (PASI 90 and serious adverse events)
The following graphs show how much information (i.e. the percentage contribution of each direct comparison in the network estimates) comes from low (green), unclear/moderate (yellow) and high (red) risk of bias studies. Here we have all drugs versus placebo as it is difficult to have all comparisons due to space limitations. To evaluate the direct comparisons we used the mean level of bias of the included studies in each comparison.
We used the web application CINeMA (CINeMA 2017).
The codes of the treatments are A = Placebo, B = Fumaric acid esters, C = Methotrexate, D = Acitretin, E = Alefacept, F = Ciclosporin, G = Infliximab, H = Adalimumab, I = Etanercept, J = Ustekinumab, K = Secukinumab, L = Ixekizumab, M = Brodalumab, N = Certolizumab, O = Apremilast, P = Tofacitinib, Q = Guselkumab, R = Tildrakizumab, S = Ponesimod, T = Itolizumab

Comparison 1 Primary outcome ‐ PASI 90, Outcome 1 Conventional systemic agents versus placebo.

Comparison 1 Primary outcome ‐ PASI 90, Outcome 2 Conventional systemic 1 versus conventional systemic 2.
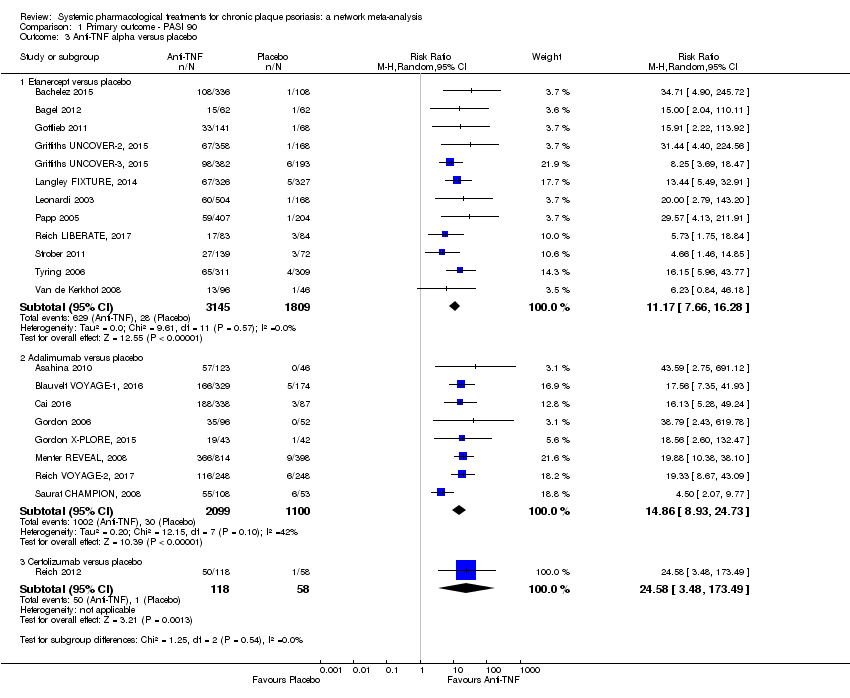
Comparison 1 Primary outcome ‐ PASI 90, Outcome 3 Anti‐TNF alpha versus placebo.

Comparison 1 Primary outcome ‐ PASI 90, Outcome 4 Ustekinumab versus placebo.
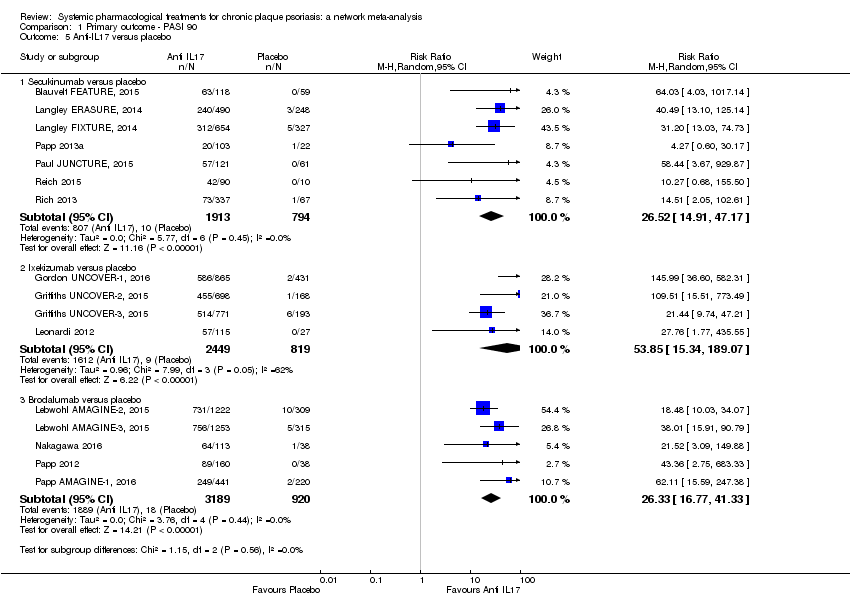
Comparison 1 Primary outcome ‐ PASI 90, Outcome 5 Anti‐IL17 versus placebo.

Comparison 1 Primary outcome ‐ PASI 90, Outcome 6 Anti‐IL23 versus placebo.
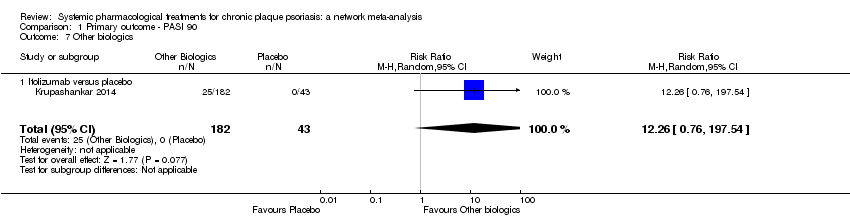
Comparison 1 Primary outcome ‐ PASI 90, Outcome 7 Other biologics.

Comparison 1 Primary outcome ‐ PASI 90, Outcome 8 Biologic versus conventional systemic treatments.

Comparison 1 Primary outcome ‐ PASI 90, Outcome 9 Biologic 1 versus biologic 2.

Comparison 1 Primary outcome ‐ PASI 90, Outcome 10 Small molecules versus placebo.
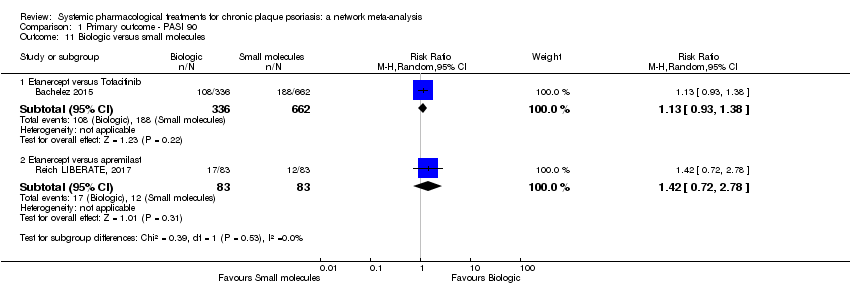
Comparison 1 Primary outcome ‐ PASI 90, Outcome 11 Biologic versus small molecules.

Comparison 2 Primary outcome ‐ serious adverse events, Outcome 1 Conventional systemic agents versus placebo.
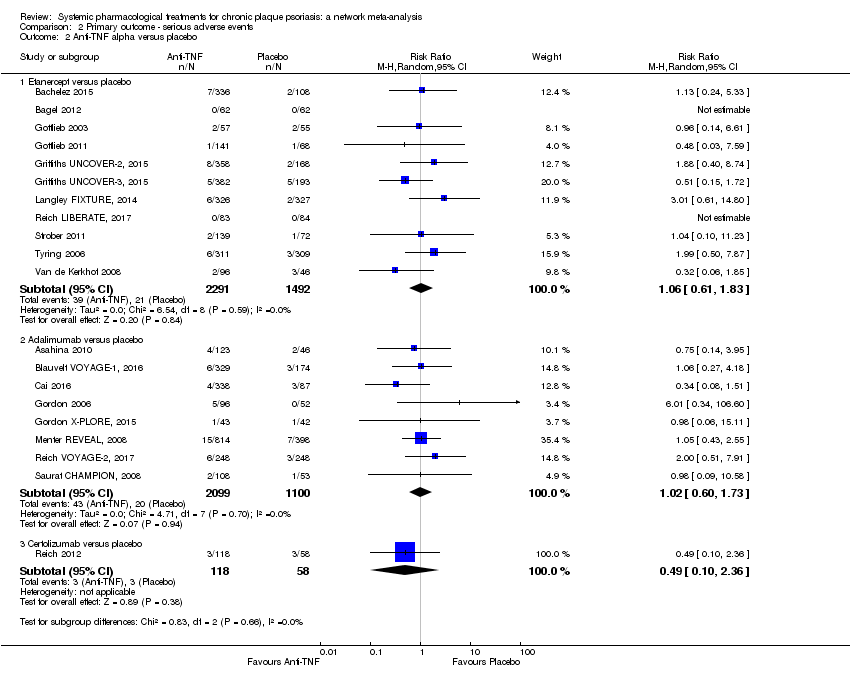
Comparison 2 Primary outcome ‐ serious adverse events, Outcome 2 Anti‐TNF alpha versus placebo.

Comparison 2 Primary outcome ‐ serious adverse events, Outcome 3 Ustekinumab versus placebo.
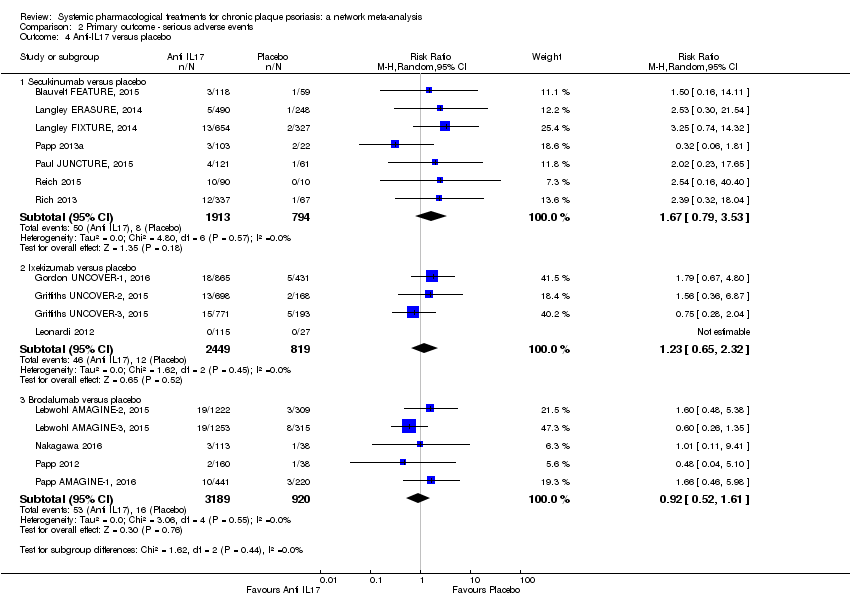
Comparison 2 Primary outcome ‐ serious adverse events, Outcome 4 Anti‐IL17 versus placebo.

Comparison 2 Primary outcome ‐ serious adverse events, Outcome 5 Anti‐IL23 versus placebo.

Comparison 2 Primary outcome ‐ serious adverse events, Outcome 6 Other biologics.

Comparison 2 Primary outcome ‐ serious adverse events, Outcome 7 Biologic versus conventional systemic treatments.

Comparison 2 Primary outcome ‐ serious adverse events, Outcome 8 Biologic 1 versus biologic 2.
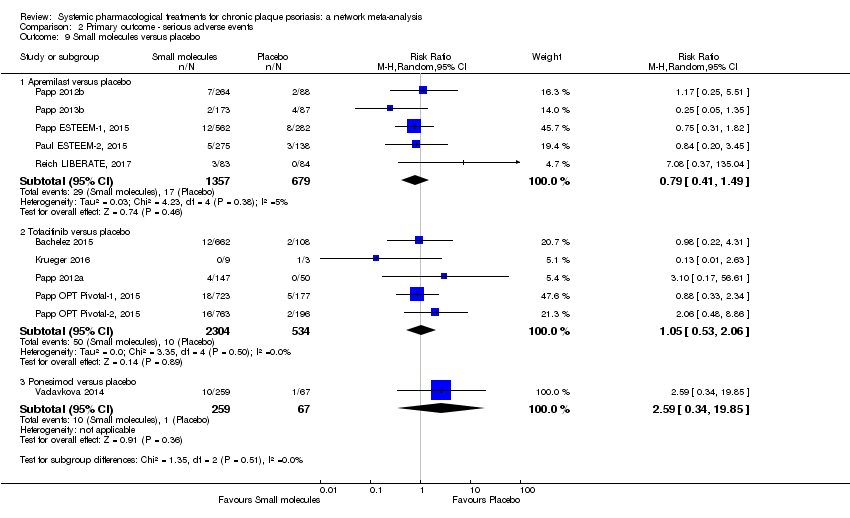
Comparison 2 Primary outcome ‐ serious adverse events, Outcome 9 Small molecules versus placebo.
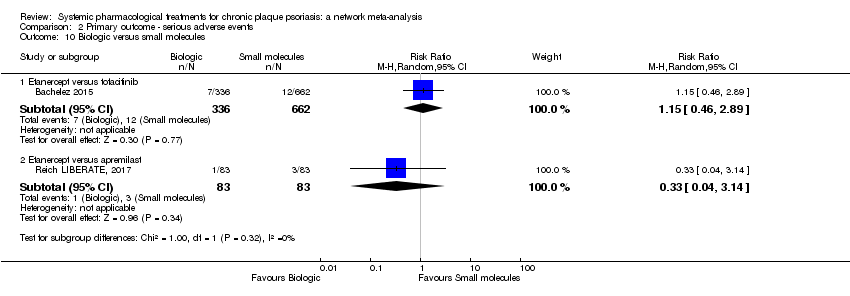
Comparison 2 Primary outcome ‐ serious adverse events, Outcome 10 Biologic versus small molecules.
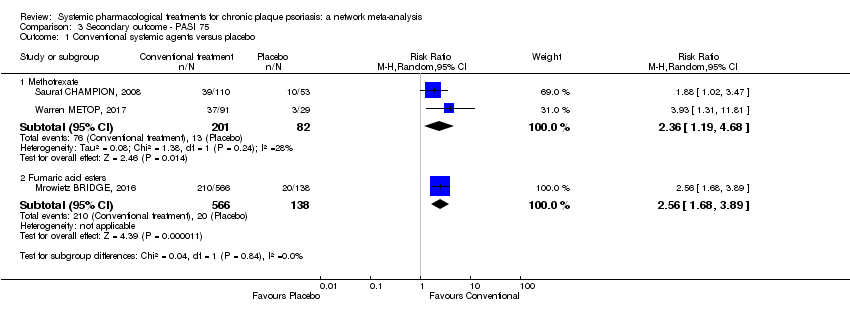
Comparison 3 Secondary outcome ‐ PASI 75, Outcome 1 Conventional systemic agents versus placebo.
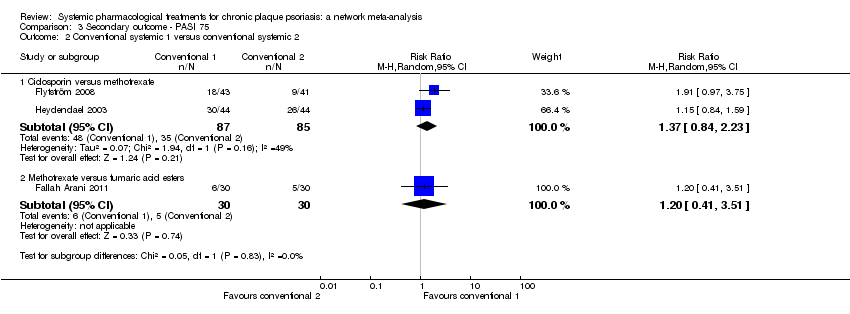
Comparison 3 Secondary outcome ‐ PASI 75, Outcome 2 Conventional systemic 1 versus conventional systemic 2.

Comparison 3 Secondary outcome ‐ PASI 75, Outcome 3 Anti‐TNF alpha versus placebo.

Comparison 3 Secondary outcome ‐ PASI 75, Outcome 4 Ustekinumab versus placebo.

Comparison 3 Secondary outcome ‐ PASI 75, Outcome 5 Anti‐IL17 versus placebo.
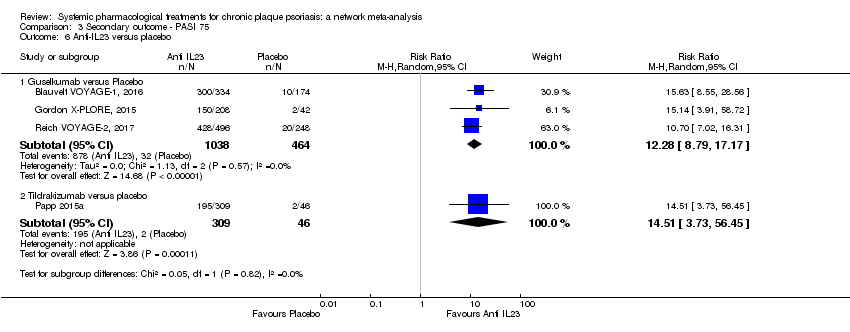
Comparison 3 Secondary outcome ‐ PASI 75, Outcome 6 Anti‐IL23 versus placebo.
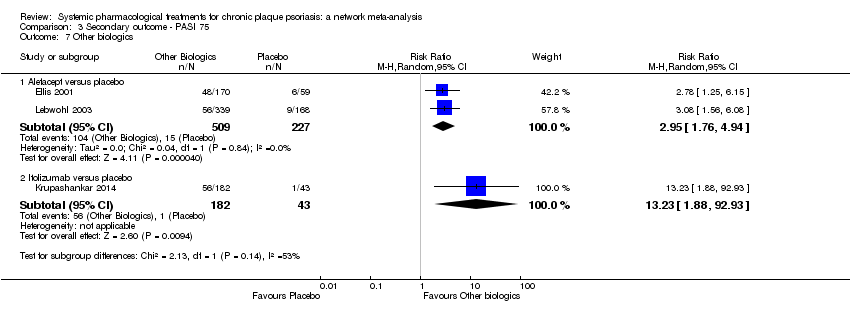
Comparison 3 Secondary outcome ‐ PASI 75, Outcome 7 Other biologics.

Comparison 3 Secondary outcome ‐ PASI 75, Outcome 8 Biologic versus conventional systemic treatments.

Comparison 3 Secondary outcome ‐ PASI 75, Outcome 9 Biologic 1 versus biologic 2.

Comparison 3 Secondary outcome ‐ PASI 75, Outcome 10 Small molecules versus placebo.

Comparison 3 Secondary outcome ‐ PASI 75, Outcome 11 Biologic versus small molecules.
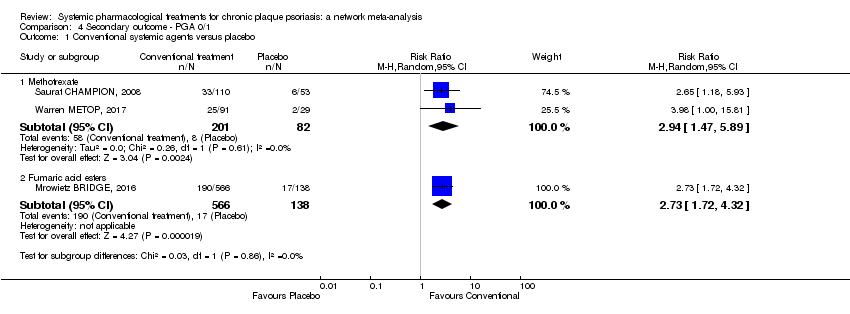
Comparison 4 Secondary outcome ‐ PGA 0/1, Outcome 1 Conventional systemic agents versus placebo.

Comparison 4 Secondary outcome ‐ PGA 0/1, Outcome 2 Conventional systemic 1 versus conventional systemic 2.
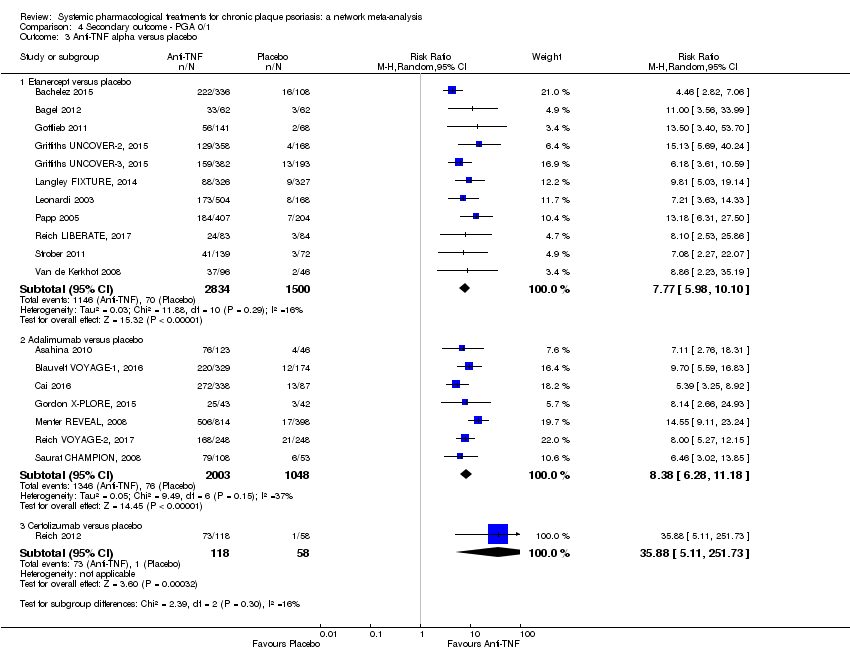
Comparison 4 Secondary outcome ‐ PGA 0/1, Outcome 3 Anti‐TNF alpha versus placebo.
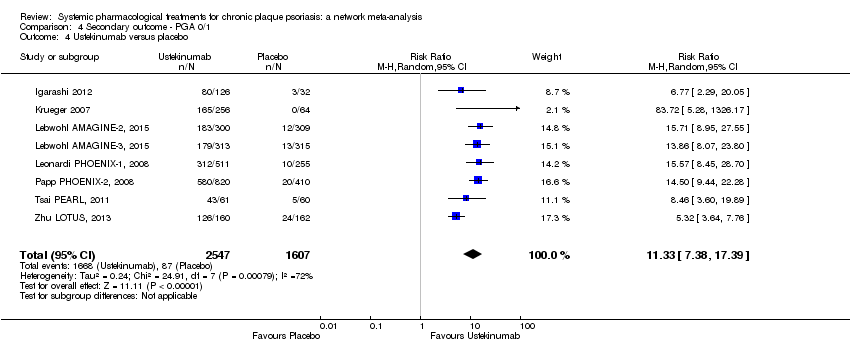
Comparison 4 Secondary outcome ‐ PGA 0/1, Outcome 4 Ustekinumab versus placebo.
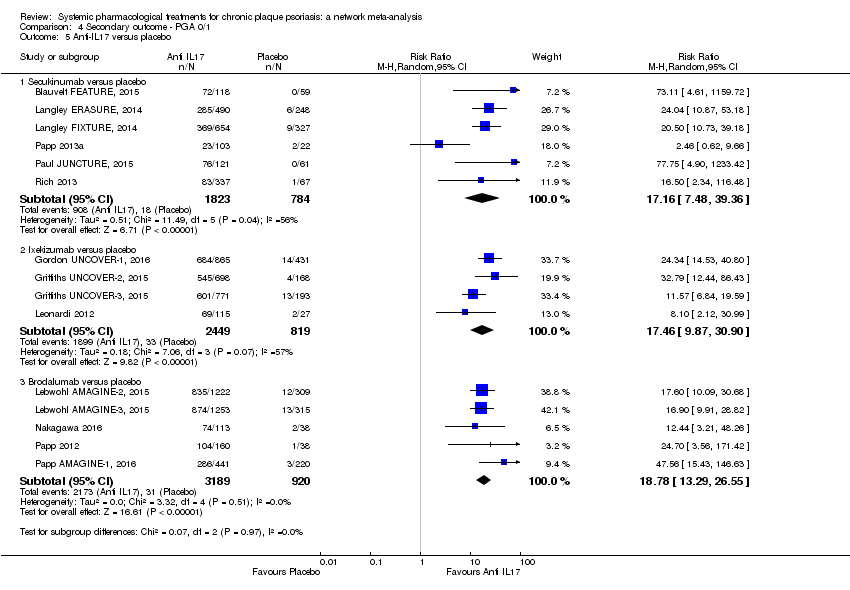
Comparison 4 Secondary outcome ‐ PGA 0/1, Outcome 5 Anti‐IL17 versus placebo.

Comparison 4 Secondary outcome ‐ PGA 0/1, Outcome 6 Anti‐IL23 versus placebo.

Comparison 4 Secondary outcome ‐ PGA 0/1, Outcome 7 Other biologics.

Comparison 4 Secondary outcome ‐ PGA 0/1, Outcome 8 Biologic versus conventional systemic treatments.
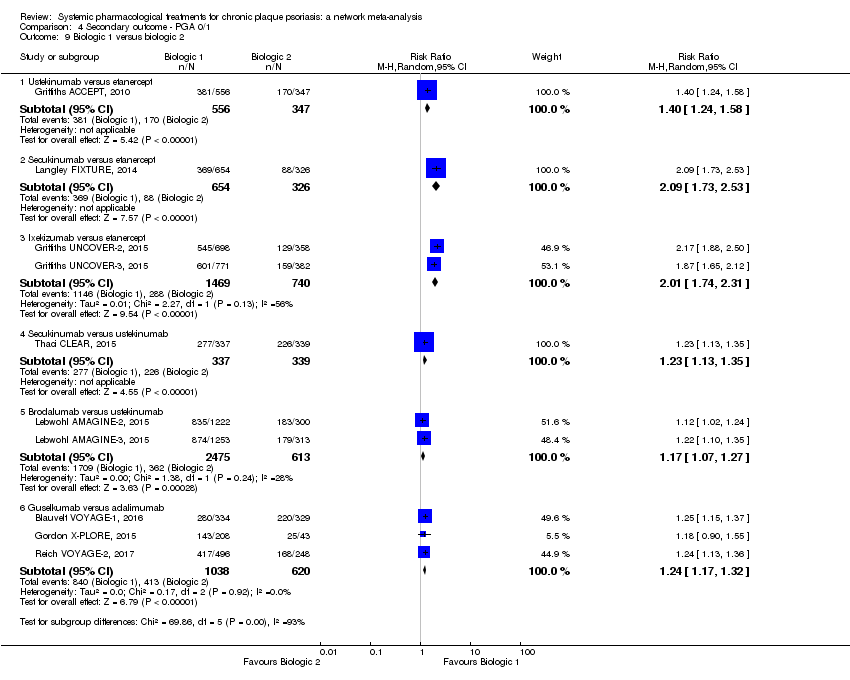
Comparison 4 Secondary outcome ‐ PGA 0/1, Outcome 9 Biologic 1 versus biologic 2.

Comparison 4 Secondary outcome ‐ PGA 0/1, Outcome 10 Small molecules versus placebo.
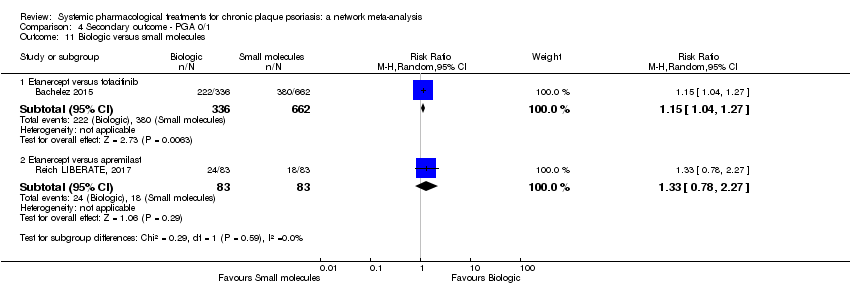
Comparison 4 Secondary outcome ‐ PGA 0/1, Outcome 11 Biologic versus small molecules.
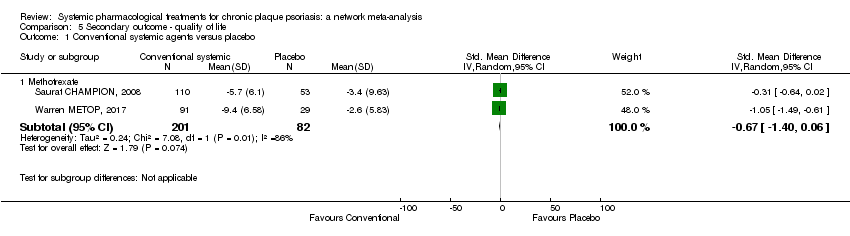
Comparison 5 Secondary outcome ‐ quality of life, Outcome 1 Conventional systemic agents versus placebo.
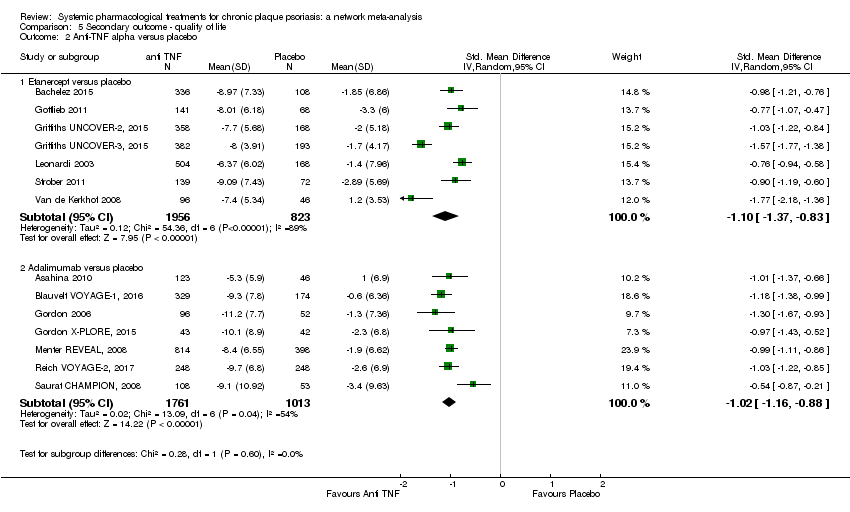
Comparison 5 Secondary outcome ‐ quality of life, Outcome 2 Anti‐TNF alpha versus placebo.
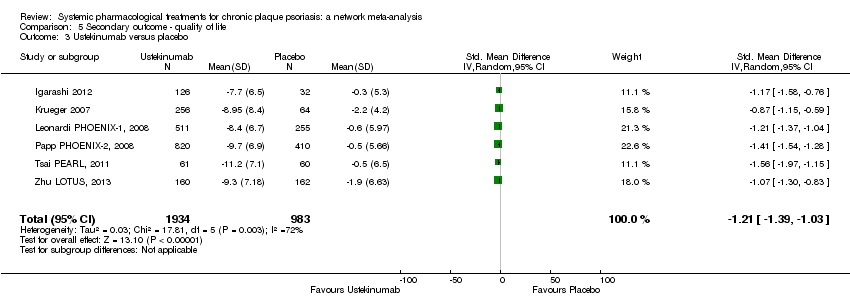
Comparison 5 Secondary outcome ‐ quality of life, Outcome 3 Ustekinumab versus placebo.

Comparison 5 Secondary outcome ‐ quality of life, Outcome 4 Anti‐IL17 versus placebo.

Comparison 5 Secondary outcome ‐ quality of life, Outcome 5 Anti‐IL23 versus placebo.

Comparison 5 Secondary outcome ‐ quality of life, Outcome 6 Other biologics.

Comparison 5 Secondary outcome ‐ quality of life, Outcome 7 Biologic versus conventional systemic treatments.
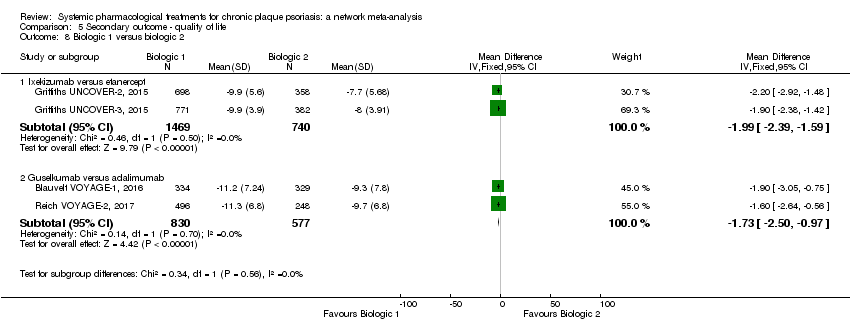
Comparison 5 Secondary outcome ‐ quality of life, Outcome 8 Biologic 1 versus biologic 2.
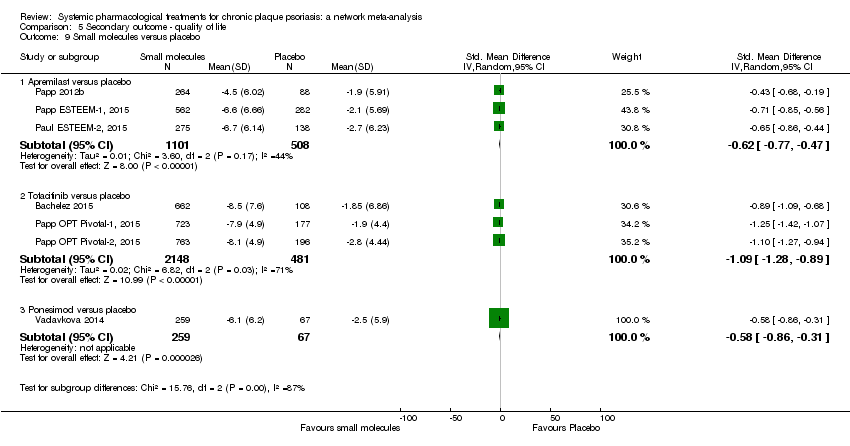
Comparison 5 Secondary outcome ‐ quality of life, Outcome 9 Small molecules versus placebo.

Comparison 5 Secondary outcome ‐ quality of life, Outcome 10 Biologic versus small molecules.
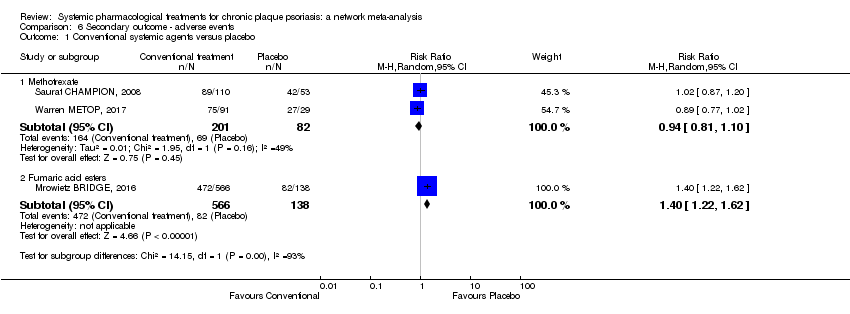
Comparison 6 Secondary outcome ‐ adverse events, Outcome 1 Conventional systemic agents versus placebo.
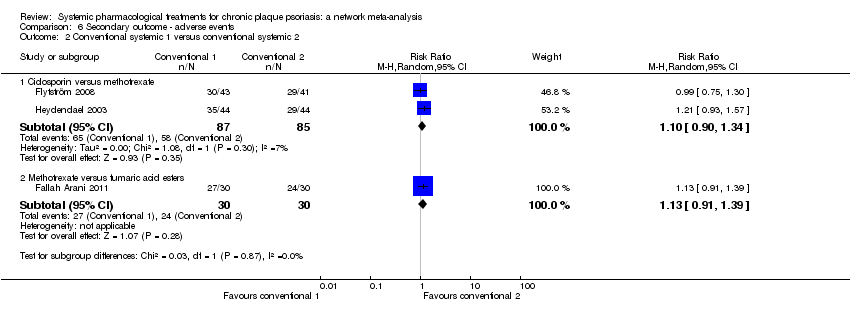
Comparison 6 Secondary outcome ‐ adverse events, Outcome 2 Conventional systemic 1 versus conventional systemic 2.
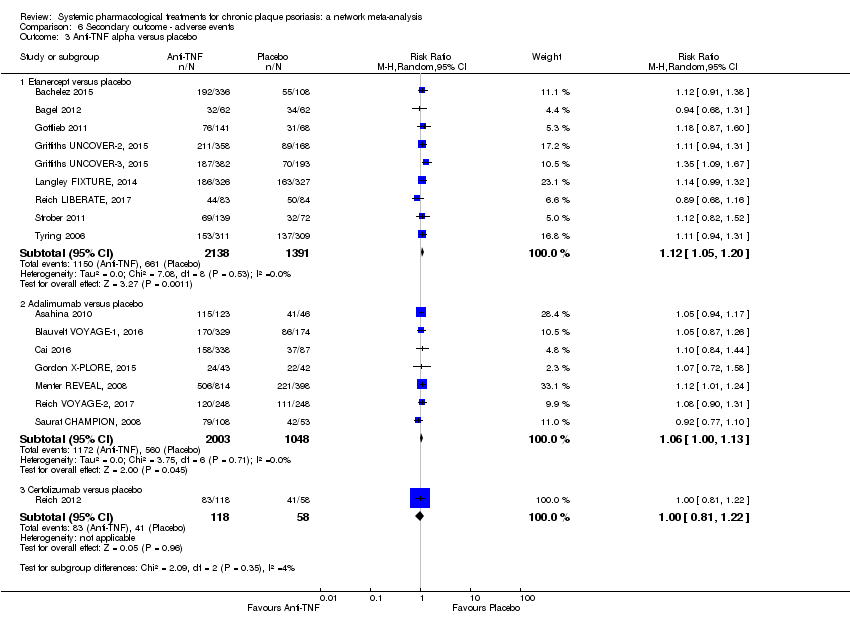
Comparison 6 Secondary outcome ‐ adverse events, Outcome 3 Anti‐TNF alpha versus placebo.
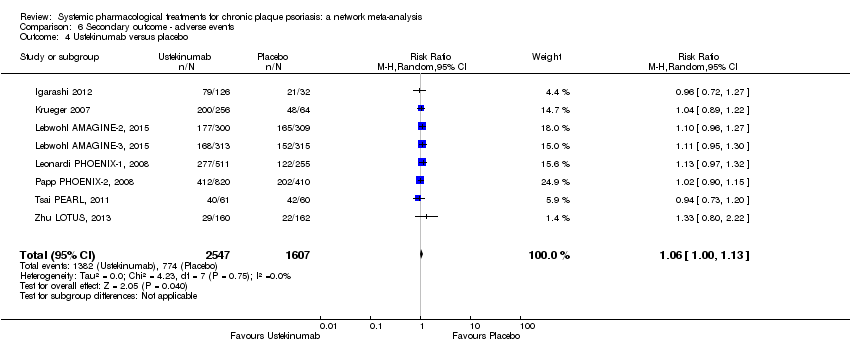
Comparison 6 Secondary outcome ‐ adverse events, Outcome 4 Ustekinumab versus placebo.
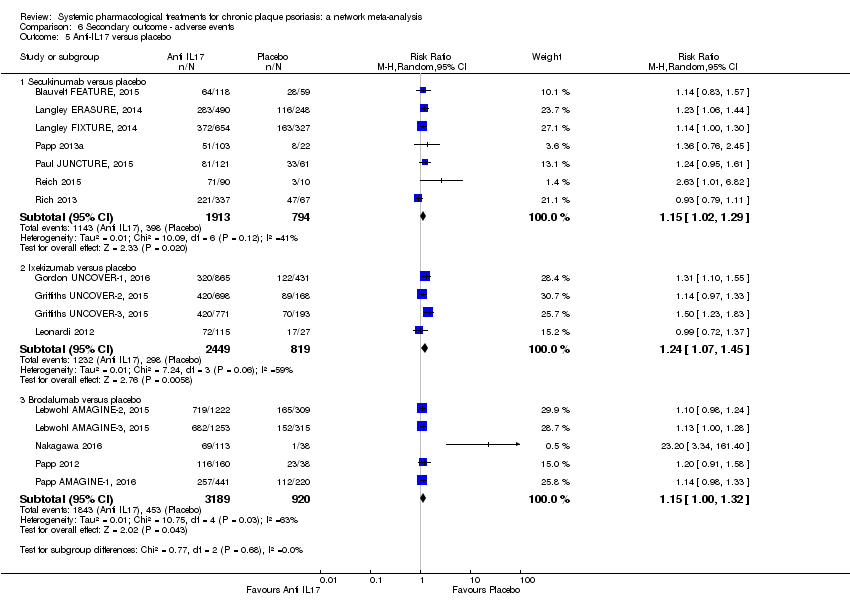
Comparison 6 Secondary outcome ‐ adverse events, Outcome 5 Anti‐IL17 versus placebo.

Comparison 6 Secondary outcome ‐ adverse events, Outcome 6 Anti‐IL23 versus placebo.

Comparison 6 Secondary outcome ‐ adverse events, Outcome 7 Biologic versus conventional systemic treatments.
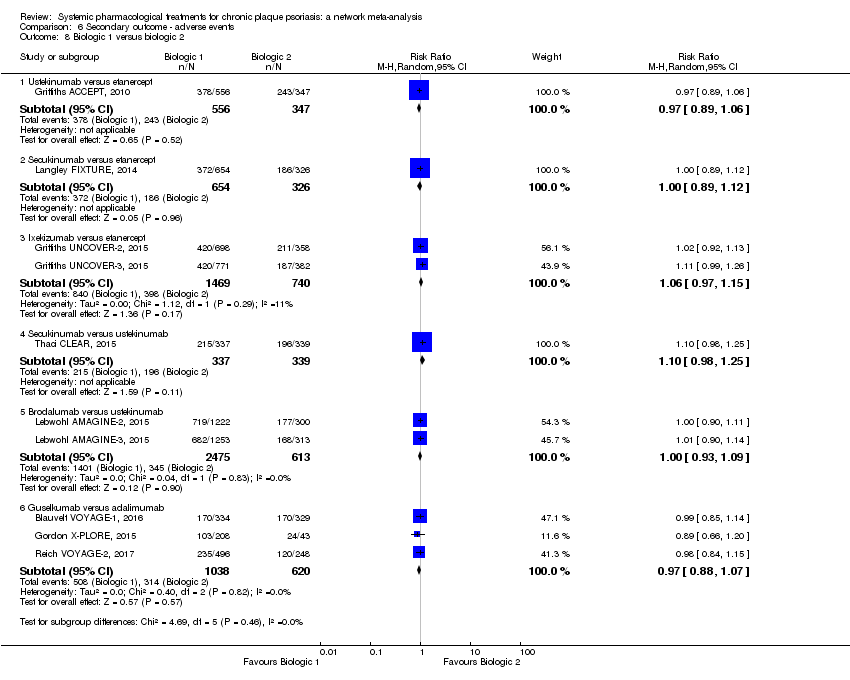
Comparison 6 Secondary outcome ‐ adverse events, Outcome 8 Biologic 1 versus biologic 2.
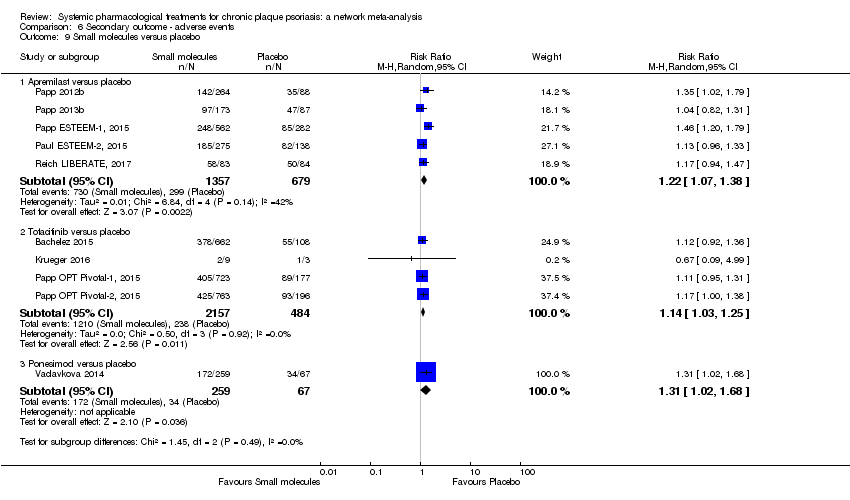
Comparison 6 Secondary outcome ‐ adverse events, Outcome 9 Small molecules versus placebo.
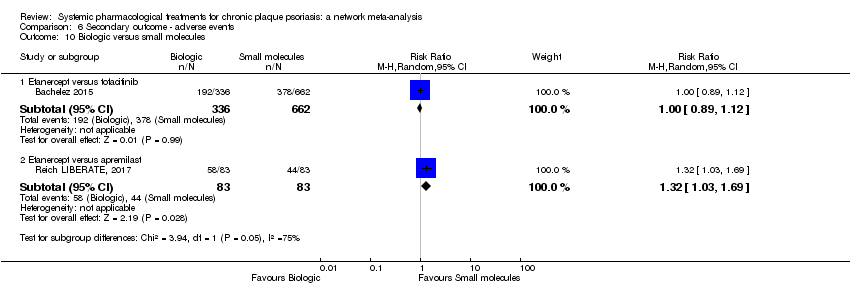
Comparison 6 Secondary outcome ‐ adverse events, Outcome 10 Biologic versus small molecules.
| Any systemic treatment compared to placebo for chronic plaque psoriasis (network meta‐analysis) | |||||||
| Patient or population: people with chronic plaque psoriasis Setting: all the participants were recruited from a hospital setting Timescale: 12 to 16 weeks after randomisation | |||||||
| Intervention | Anticipated absolute effects* (95% CI) | Relative effect | SUCRA | № of participants | Certainty of the evidence | Comments | |
| Risk with placeboa | Risk with any systemic treatment | ||||||
| PASI 90 | |||||||
| Ixekizumab | Moderate | RR 32.45 | 94.3 | 3268 | ⊕⊕⊕⊕ | ‐ | |
| 15 per 1000 | 487 per 1000 | ||||||
| Secukinumab | Moderate | RR 26.55 | 86.5 | 2707 | ⊕⊕⊕⊕ | ‐ | |
| 15 per 1000 | 398 per 1000 | ||||||
| Brodalumab | Moderate | RR 25.45 | 84.3 | 4109 | ⊕⊕⊕⊝ | Reasons for downgrading by one level: three studies contributing to this estimate at high risk of bias in selective reporting domain | |
| 15 per 1000 | 382 per 1000 | ||||||
| Guselkumab | Moderate | RR 21.03 | 77 | 1502 | ⊕⊕⊕⊝ | Reasons for downgrading by one level: one study contributing to this estimate at high risk of bias in selective reporting domain | |
| 15 per 1000 | 315 per 1000 | ||||||
| Certolizumab | Moderate | RR 24.58 | 75.7 | 176 | ⊕⊕⊕⊝ | Downgraded one level due to imprecision: wide CIs | |
| 15 per 1000 | 369 per 1000 | ||||||
| Ustekinumab | Moderate | RR 19.91 | 72.6 | 3832 | ⊕⊕⊕⊕ | ‐ | |
| 15 per 1000 | 299 per 1000 | ||||||
| Tildrakizumab | Moderate | RR 15.63 | 63.6 | 355 | ⊕⊕⊝⊝ | Downgraded one level due to risk of bias and one level due to imprecision. The single study contributing to this estimate at unclear risk of bias in both blinding domains; wide CIs | |
| 15 per 1000 | 234 per 1000 | ||||||
| Adalimumab | Moderate | RR 14.87 | 63.1 | 3199 | ⊕⊕⊕⊝ | Downgraded one level due to inconsistency ‐ inconsistent loops of evidence | |
| 15 per 1000 | 223 per 1000 | ||||||
| Itolizumab | Moderate | RR 12.26 | 56 | 225 | ⊕⊕⊝⊝ | Downgraded one level due to imprecision (wide CIs) and one level due to risk of bias (moderate risk using credibility of evidence) | |
| 15 per 1000 | 184 per 1000 | ||||||
| Infliximab | Moderate | RR 11.18 | 53.2 | (0 RCTs) | ⊕⊝⊝⊝ | Downgraded one level due to risk of bias (credibility of risk), one level due to imprecision (wide CIs) and one level due to inconsistency (inconsistent loop of evidence) | |
| 15 per 1000 | 168 per 1000 | ||||||
| Etanercept | Moderate | RR 10.79 | 52.6 | 4954 | ⊕⊕⊕⊝ | Downgraded one level due to inconsistency (global inconsistency ‐ side‐splitting approach) | |
| 15 per 1000 | 162 per 1000 | ||||||
| Tofacitinib | Moderate | RR 8.50 | 42.5 | 2826 | ⊕⊕⊝⊝ | Downgraded one level due to risk of bias: two studies at high risk of bias in incomplete outcome data domain; and downgraded one level due to inconsistency (global approach) | |
| 15 per 1000 | 128 per 1 000 | ||||||
| Apremilast | Moderate | RR 7.66 | 39.7 | 1775 | ⊕⊕⊕⊝ | Downgraded one level due to risk of bias: one study had a slight risk of bias in selective reporting domain | |
| 15 per 1000 | 115 per 1000 | ||||||
| Ponesimod | Moderate | RR 6.60 | 37.3 | 326 | ⊕⊕⊕⊝ | Downgraded one level due to imprecision: wide CIs | |
| 15 per 1000 | 99 per 1000 | ||||||
| Alefacept | Moderate | RR 4.39 | 25.3 | (0 RCTs) | ⊕⊝⊝⊝ | Downgraded two levels due to risk of bias and a further one level due to imprecision ‐ study indirectly contributing to the estimates at high risk of bias in selective reporting domain; wide CIs | |
| 15 per 1000 | 66 per 1000 | ||||||
| Fumaric acid esters (FAEs) | Moderate | RR 4.09 | 21.9 | 704 | ⊕⊝⊝⊝ | Downgraded two levels due to risk of bias, and one level due to imprecision ‐ the studies indirectly contributing to this estimate at high risk of bias in blinding domain; wide CIs | |
| 15 per 1000 | 61 per 1000 | ||||||
| Ciclosporin | Moderate | RR 3.99 | 21.3 | (0 RCTs) | ⊕⊝⊝⊝ | Downgraded two levels due to risk of bias, and a further one level due to imprecision ‐ the single study indirectly contributing to this estimate at high risk of bias in blinding; wide CIs | |
| 15 per 1000 | 60 per 1000 | ||||||
| Methotrexate | Moderate | RR 3.61 | 20.2 | 282 | ⊕⊕⊕⊝ | Downgraded one level due to inconsistency (inconsistent loop of evidence) | |
| 15 per 1000 | 59 per 1000 | ||||||
| Acitretin | Moderate | RR 0.98 | 9.9 | (0 RCTs) | ⊕⊝⊝⊝ | Downgraded two levels due to risk of bias and a further one level due to imprecision. The single study contributing to this estimate at high risk of bias in incomplete outcome data and blinding domains; wide CIs | |
| 15 per 1000 | 15 per 1000 | ||||||
| Serious adverse events | |||||||
| Methotrexate | Moderate | RR 0.23 | 90.7 | 282 | ⊕⊕⊕⊝ | Downgraded one level due to imprecision (wide CIs) | |
| 17 per 1000 | 4 per 1000 | ||||||
| Ciclosporin | Moderate | RR 0.23 | 78.2 | (0 RCTs) | ⊕⊝⊝⊝ | Downgraded two levels due to risk of bias (credibility of evidence), and one level due to imprecision (wide CIs) | |
| 17 per 1000 | 4 per 1000 | ||||||
| Certolizumab | Moderate | RR 0.49 | 70.9 | 176 | ⊕⊕⊕⊝ | Downgraded one level due to imprecision (wide CIs) | |
| 17 per 1000 | 8 per 1000 | ||||||
| Infliximab | Moderate | RR 0.56 | 64.4 | (0 RCTs) | ⊕⊝⊝⊝ | Downgraded two levels due to risk of bias, and one level due to imprecision: credibility of evidence; wide CIs | |
| 17 per 1000 | 10 per 1000 | ||||||
| Alefacept | Moderate | RR 0.72 | 62.6 | 736 | ⊕⊕⊝⊝ | Downgraded one level due to risk of bias (credibility of evidence), and one level due to imprecision (wide CIs) | |
| 17 per 1000 | 12 per 1000 | ||||||
| Fumaric acid esters (FAEs) | Moderate | RR 0.77 | 57.7 | 704 | ⊕⊝⊝⊝ | Downgraded by one level due to risk of bias and one level due to imprecision: credibility of evidence; wide CIs | |
| 17 per 1000 | 13 per 1000 | ||||||
| Apremilast | Moderate | RR 0.84 | 54.7 | 2036 | ⊕⊕⊝⊝ | Downgraded one level due to risk of bias and one level due to imprecision: credibility of evidence and wide CIs | |
| 17 per 1000 | 14 per 1000 | ||||||
| Ustekinumab | Moderate | RR 0.89 | 52 | 4154 | ⊕⊕⊝⊝ | Downgraded one level due to risk of bias and one level due to imprecision ‐ credibility of evidence; wide CIs | |
| 17 per 1000 | 15 per 1000 | ||||||
| Acitretin | Moderate | RR 0.99 | 46.9 | (0 RCTs) | ⊕⊝⊝⊝ | Downgraded by two levels due to risk of bias and one level due to imprecision: credibility of evidence; wide CIs | |
| 17 per 1000 | 17 per 1000 | ||||||
| Tofacitinib | Moderate | RR 0.98 | 44 | 2838 | ⊕⊕⊕⊝ | Downgraded one level due to imprecision (wide CIs) | |
| 17 per 1000 | 17 per 1000 | ||||||
| Etanercept | Moderate | RR 0.99 | 43.6 | 3783 | ⊕⊕⊕⊝ | Downgraded one level due to imprecision (CIs including one) | |
| 17 per 1000 | 17 per 1000 | ||||||
| Guselkumab | Moderate | RR 1.00 | 42.6 | 1502 | ⊕⊕⊝⊝ | Downgraded one level due to risk of bias (credibility of evidence), and one level due to imprecision (CIs including one) | |
| 15 per 1000 | 15 per 1000 | ||||||
| Adalimumab | Moderate | RR 1.02 | 40.4 | 3199 | ⊕⊕⊕⊝ | Downgraded one level due to imprecision (CIs including one) | |
| 18 per 1000 | 19 per 1000 | ||||||
| Brodalumab | Moderate | RR 1.04 | 39.8 | 4109 | ⊕⊕⊝⊝ | Downgraded one level due to risk of bias (credibility of evidence) and one level due to imprecision (CIs including 1) | |
| 17 per 1000 | 18 per 1000 | ||||||
| Tildrakizumab | Moderate | RR 1.36 | 37.8 | 355 | ⊕⊕⊝⊝ | Downgraded one level due to risk of bias (credibility of evidence) and one level due to imprecision (CIs including 1) | |
| 0 per 1000 | 0 per 1000 | ||||||
| Ixekizumab | Moderate | RR 1.12 | 33.7 | 3268 | ⊕⊕⊕⊝ | Downgraded one level due to imprecision (CIs including one) | |
| 15 per 1000 | 16 per 1000 | ||||||
| Secukinumab | Moderate | RR 1.19 | 29.9 | 2707 | ⊕⊕⊕⊝ | Downgraded one level due to imprecision (CIs including one) | |
| 10 per 1000 | 12 per 1000 | ||||||
| Ponesimod | Moderate | RR 2.59 | 18.1 | 326 | ⊕⊕⊕⊝ | Downgraded one level due to imprecision (CIs including one) | |
| 15 per 1000 | 39 per 1000 | ||||||
| *The risk in the intervention group (and its 95% confidence interval) is based on the assumed risk in the comparison group and the relative effect of the intervention (and its 95% CI). | |||||||
| GRADE Working Group grades of evidence | |||||||
| a 'Risk with placebo' is the median placebo‐group risk value in the included studies for the assumed risk with placebo. c The Psoriasis Area and Severity Index combines the assessment of the severity of lesions and the area affected into a single score in the range of 0 (no disease) to 72 (maximal disease); PASI 90: 90% improvement in the PASI. d SUCRA was expressed as a percentage between 0 (when a treatment is certain to be the worst) to 100% (when a treatment is certain to be the best). | |||||||
| Term | Definition |
| Antagonist | A substance that interferes with or inhibits the physiological action of another. |
| Antigen | A molecule capable of inducing an immune respons |
| Anti‐TNF alpha | A pharmaceutical drug that suppresses the physiologic response to tumor necorsis factor (TNF) |
| Biological agent | Therapeutic agents consisting of immune molecules such as soluble receptors, recombinant cytokines, and monoclonal antibodies that target effector molecules or cells of the immune system |
| CD6 | Cluster of differentiation (CD) 6 is a protein encoded by the CD6 gene |
| Cheilitis | An inflammation of the lips |
| Chimeric protein | A chimeric protein can be made by combining two different genes |
| Complex cyclophilin‐ciclosporin | Cyclophilins are a family of proteins that bind to ciclosporin, an immunosuppressant agent |
| Creatinine | A compound that is produced by metabolism of creatine and excreted in the urine |
| Cyclic adenosine monophosphate | It is a second messenger important in many biological processes |
| Cytokines | Small proteins produced by a broad range of cells that are important in cell signaling; they are immunomodulating agents |
| Dendritic cells | Antigen‐presenting cells of the immune system |
| Dermis | It is a layer of the skin |
| Epitope | It is a part of an antigen |
| Erythematous | Redness of the skin |
| Folic acid | B vitamin |
| Humanised antibody | Antibodies from non‐human species whose protein sequences have been modified to increase their similarity to antibody variants produced naturally in humans |
| IL‐17A | A pro‐inflammatory cytokine |
| IL‐23R | A cytokine receptor |
| Immune‐mediated | A group of diseases that are characterised by common inflammatory pathways leading to inflammation, and which may result from a dysregulation of the normal immune response |
| Immunogenicity | This is the ability of a particular substance, such as an antigen or epitope, to provoke an immune response in the body of a human or animal |
| Immunoglobulin 1 Fc | An antibody |
| Interferon (IFN)‐c | A protein released by cells, usually in response to a pathogen |
| Interleukin | A kind of cytokine |
| Janus kinase (JAK) inhibitors | A pharmaceutical drug that inhibits the activity of one or more of the Janus kinase family of enzymes |
| Keratinocytes | Epidermal cells that constitute 95% of the epidermis |
| Lymphocyte | A subtype of a white blood cell |
| Lymphoid organ | Part of the body that defends the body against invading pathogens that cause infections or the spread of tumours |
| Metalloproteinases | A protease enzyme |
| Monoclonal antibodies | Antibodies that are made by identical immune cells that are all clones of a unique parent cell |
| Murine sequence | Mouse genomic sequencing |
| Neutrophils | Type of white blood cell involved in the innate immune system |
| p40 | Subunit beta of interleukin 12 and 23 |
| Periumbilical | Around the navel |
| Pharmacological treatments | Drugs |
| Phase I | First‐in‐man studies |
| Phase II | Studies to assess how well the drug works, as well as to continue phase I safety assessments in a larger group of volunteers and participants |
| Phase III | Randomised controlled multicenter trials on large patient groups and are aimed at being the definitive assessment of how effective the drug is |
| Phase IV | Post‐marketing trials involve the safety surveillance |
| Phosphodiesterase 4 inhibitors | A pharmaceutical drug used to block the degradative action of phosphodiesterase 4 |
| Progressive multifocal leukoencephalopathy | A rare viral neurological disease characterised by progressive damage of the white matter of the brain at multiple locations |
| Receptor | A protein molecule that receives chemical signals from outside a cell |
| Small molecules | Chemically manufactured molecules (or SMOLs for short) |
| Sphingosine 1‐phosphate receptor agonists | A class of protein‐coupled receptors that are targets of the lipid signalling molecule Sphingosine‐1‐phosphate |
| T cells/CD4 T cells | A type of white blood cell that is of key importance to the immune system |
| Th1 and Tc1 cells | A type of T cell |
| Th17 and Tc17 cells | A type of T cell |
| TNF‐alpha | A protein that is part of the inflammatory response |
| Tumour necrosis factor antagonists | Class of biological agents |
| Umbilic | Navel |
| Xerosis | Dry skin |
| Contact | Requested Information | Contacted | Reply (last check 1/03/2017) | |
| Missing data | ||||
| Prof. Akcali | Outcomes: PASI 90, PASI 75, PGA 0/1, QoL scale, AEs & SAEs | 8 and 21 November 2016 | No response | |
| Prof. Al‐Hamamy | Outcomes: PASI 75, PGA 0/1, QoL scale, AEs & SAEs | 8 and 21 November 2016 | No response | |
| Prof. Asahina | Outcome: PASI 90 | 8 November 2016 | Asahina 2010 detailed report | |
| Prof. Asahina Pfizer | Outcomes: AEs & SAEs | 3 and 12 January 2017 | Additional data to the publication not provided | |
| Prof. Asawanonda | Outcomes: PASI 75, PGA 0/1, AEs & SAEs | 21 November 2016 15 December 2016 | Asawanonda 2006 sent detailed report for PASI 75 and AEs. PGA was not collected during this study. | |
| Prof. Bisonnette Innovaderm Recherches Inc. | Outcomes: PASI 90, PGA 0/1, AEs | 8 and 21 November 2016 | Additional data to the publication not provided | |
| Dr Blauvelt Novartis | Outcome: QoL scale | 8 and 21 November 2016 | Additional data to the publication not provided | |
| Prof. Fabri | Outcomes: PASI 90, PASI 75, PGA 0/1, QoL scale, AEs & SAEs | 8 and 21 November 2016 | Caproni 2009 sent detailed report for PASI 90 and SAEs. Other outcomes (PGA, QoL and AEs) not collected during this study. | |
| Prof. Dogra | Outcomes: PGA 0/1, QoL scale, AEs & SAEs | 8 and 21 November 2016 | No response | |
| Prof. Dogra | Outcomes: PGA 0/1, QoL scale, AEs & SAEs | 8 November 2016 | PGA & QoL scale not collected during this study. AEs & SAEs not provided per arm | |
| Dr Fallah Arani | Outcomes: PASI 90, PGA 0/1 and QoL scale | 8 and 21 November 2016 | Outcomes not collected during this study | |
| Prof. Flytstrom | Outcomes: PGA 0/1 | 12 and 19 January 2017 | Additional data to the publication not provided | |
| Prof. Gisondi | Outcomes: PASI 90, PGA 0/1, QoL scale, AEs & SAEs | 8 November 2016 | Gisondi 2008 sent detailed report for the requested outcomes except for QoL (not assessed during the study) | |
| Prof. Gordon | Outcomes: PGA0/1, AEs | 3 and 12 January 2017 | No response | |
| Prof. Gottlieb Abbvie | Outcomes: PASI 90 & QoL scale | 8 November 2016 | Gottlieb 2012 sent detailed report for the requested outcomes | |
| Prof. Gottlieb Amgen | Outcomes: PASI 90, PGA 0/1, QoL scale, AEs & SAEs | 8 November 2016 | Gottlieb 2011 sent detailed report for the requested outcomes | |
| Prof. Griffiths Janssen | Outcome: QoL scale | 16 December 2016 | QoL was not collected during this study | |
| Prof. Jacobe | Outcomes: PASI 90, PGA 0/1, QoL scale, AEs & SAEs | 8 and 20 November 2016 | No response | |
| Pfizer | Outcomes: PASI 90, QoL scale | 3 and 12 January 2017 | No response | |
| Prof. Ganapathi R&D, Biocon Research Limited | Outcomes: QoL scale, AEs & SAEs | 8 and 21 November 2016 | Krupashandar sent detailed report for the requested outcomes, however AEs and SAEs were only available for the entire trial and not at the time of the major outcome assessment | |
| Prof. Lebwohl Valeant Pharmaceuticals NA LLC | Outcomes: PASI 90 & QoL scale | 8 and 21 November 2016 | Lebwohl AMAGINE‐2, 2015 sent detailed report for PASI 90, individual scores and median difference from baseline of QoL were not available | |
| Prof. Lebwohl Valeant Pharmaceuticals NA LLC | Outcomes: PASI 90 & QoL scale | 8 and 21 November 2016 | Lebwohl AMAGINE‐3, 2015 sent detailed report for PASI 90, individual scores and median difference from baseline of QoL were not available | |
| Prof. Leonardi | Outcomes: QoL scale & AEs | 8 and 21 November 2016 | No response | |
| Prof. Kaur | Outcomes: PASI 90, PGA 0/1, QoL scale, AEs & SAEs | 8 and 21 November 2016 | No response | |
| Prof. Menter | Outcome: PGA 0/1 | 8 and 21 November 2016 | No response | |
| Prof. Menter | Outcome: PGA 0/1 | 8 and 21 November 2016 | No response | |
| Prof. Mrowietz | Outcome: QoL scale | 3 and 12 January 2017 | Additional data to the publication not provided | |
| Prof. Paul Novartis | Outcome: PASI 90 | 3 January 2017 | Additional data to the publication not provided | |
| Prof. Papp | Outcome: QoL scale | 22 November 2016 13 December 2016 | Additional data to the publication not provided | |
| Prof. Papp | Outcome: QoL scale | 22 November 2016 13 December 2016 | Additional data to the publication not provided | |
| Prof. Papp | Outcome: QoL scale, AEs & SAEs | 22 November 2016 13 December 2016 | Additional data to the publication not provided | |
| Prof. Papp | Outcome: QoL scale | 22 November 2016 13 December 2016 | Additional data to the publication not provided | |
| Prof. Papp | Outcome: PASI 90, PGA0/1, QoL scale | 3 January 2017 | Additional data to the publication not provided | |
| Prof. Paul Novartis | Outcome: QoL scale | 15 December 2016, 2 January 2017 | Additional data to the publication not provided | |
| Prof. Reich Novartis | Outcomes: PGA 0/1 & QoL scale | 8 November 2016, 16 December 2016 | Additional data to the publication not provided | |
| Prof. Reich PelotonAdvantage | Outcome: QoL scale | 4 January 2017 | Additional data to the publication not provided | |
| Prof. Rich | Outcome: QoL scale | 22 November 2016, 13 December 2016 | No response | |
| Prof. Sterry | Outcomes: PASI 90 & QoL scale | 8 and 21 November 2016 | No response | |
| Prof. Strober Abbvie | Outcome: QoL scale | 8 November 2016 | Strober sent detailed report for the requested outcomes | |
| Prof. Thaçi Novartis | Outcome: QoL scale | 8 and 21 November 2016 | Additional data to the publication not provided | |
| Prof. Torii | Outcomes: PASI 90 & PGA0/1 | 21 November 2016 | Torii sent detailed report for the requested outcomes | |
| Prof. Tyring | Outcomes: PGA 0/1 & QoL scale | 8 and 21 November 2016 | No response | |
| Dr van Bezooijen | Outcomes: PASI 90, adverse effects | 4 and 12 January 2017 | Additional data to the publication not provided | |
| Prof. van der Kherkhof Pfizer | Outcome: AEs | 8 and 21 November 2016 | Additional data to the publication not provided | |
| No contact | Outcomes: AEs and SAEs | No | Authors' email not found | |
| No contact | Outcome: PASI 90 | No | Authors' email not found | |
| Awaiting classification studies | ||||
| Prof. Elewski Abbvie | Study's protocol and outcomes: PASI 90, PASI 75, PGA 0/1, QoL scale, AEs & SAEs | 3 and 12 January 2017 | Will be included when published | |
| Prof. Khattri | Study's protocol and outcomes: PASI 90, PASI 75, PGA 0/1, QoL scale, AEs & SAEs | 3 and 12 January 2017 | No response | |
| Prof. Lee | Study's protocol and outcomes: PASI 90, PASI 75, PGA 0/1, QoL scale, AEs & SAEs | 3 and 12 January 2017 | No response | |
| Prof. Reich | Study's protocol and outcomes: PASI 90, PASI 75, PGA 0/1, QoL scale, AEs & SAEs | 3 January 2017 | Will be included when published | |
| Prof. Chow | outcomes: PASI 90, PASI 75, PGA 0/1, QoL scale, AEs & SAEs | 8 November 2016, 16 December 2016 | No response | |
| Prof. Gurel | Study's protocol and outcomes: PASI 90, PASI 75, PGA 0/1, QoL scale, AEs & SAEs | 17 and 24 January 2017 | Gurel 2015 sent detailed report for the requested outcomes. Finally Gurel study was classified in the included studies section. | |
| No contact | Outcomes: PASI 90, PASI 75, PGA 0/1, QoL scale, AEs & SAEs | No | Authors' email not found | |
| Dr Nogarales, MD Celgene Corporation | Asking for study protocol and efficacy/safety results | 12 and 19 January 2017 | Email response: "Thank you very much for your email and your interest in our study in Japanese subjects. May I please enquire as to the planned timing for publication for your meta‐analysis as we have just recently submitted our primary manuscript?" Will be included when published | |
| Prof. Krishna | Asking for study protocol and efficacy/safety results | 5 and 12 January 2017 | No response | |
| Prof. Jacobi | Asking for study protocol and efficacy/safety results | 12 and 19 January 2017 | No response | |
| Prof. Shah | Asking for study protocol and efficacy/safety results | 12 and 19 January 2017 | ||
| Abstracts | ||||
| Prof. Yilmaz | Outcomes: PASI 90, PASI 75, PGA 0/1, QoL scale, AEs & SAEs | 16 December 2016 | Yilmaz 2002 sent detailed report for the requested outcomes. Finally Yilmaz 2002 study was classified in the included studies section. | |
| Prof. Mrowietz | Study's protocol and outcomes: PASI 90, PASI 75, PGA 0/1, QoL scale, AEs & SAEs | 16 December 2016, 3 January 2017 | Additional data to the publication not provided. Finally Mrowietz study was classified in the awaiting classification section. | |
| Prof. Reich | Study's protocol and outcomes: PASI 90, PASI 75, PGA 0/1, QoL scale, AEs & SAEs | 16 December 2016 | Additional data to the publication not provided. Finally Reich 2004 study was classified in the awaiting classification section. | |
| Ongoing studies | ||||
| Dr Yamauchi Dr Patnaik, Director, Clinical Science Institute | Asking for study protocol and efficacy/safety results | 5 January 2017 | Email response: Dear Dr Sbidian, Will be included when published | |
| Prof. Spuls | Asking for study protocol and efficacy/safety results | 5 January 2017 | Email response "The study is currently ongoing and has not yet been analysed. Therefore, we are not able to provide data on efficacy or safety. Will be included when published | |
| AE: adverse events; PASI: Psoriasis Area and Severity Index; PGA: Physician Global Assessment; QoL: quality of life; SAE: serious adverse events | ||||
| Network meta‐analysis | Direct evidence | Indirect evidence | |||||||
| Comparisons* | RR | LCI | UCI | RR | LCI | UCI | RR | LCI | UCI |
| FAEs vs placebo | 4.09 | 1.88 | 8.88 | 4.47 | 1.97 | 10.14 | 1.86 | 0.16 | 21.16 |
| Methotrexate vs placebo | 3.91 | 2.16 | 7.08 | 1.53 | 0.66 | 3.53 | 17.16 | 5.69 | 51.75 |
| Adalimumab vs placebo | 14.87 | 10.45 | 21.14 | 14.42 | 10.08 | 20.64 | 108.8 | 2.24 | 5287.86 |
| Etanercept vs placebo | 10.79 | 8.47 | 13.73 | 10.62 | 7.52 | 15.01 | 11.21 | 7.26 | 17.32 |
| Ustekinumab vs placebo | 19.91 | 15.11 | 26.23 | 22.7 | 15.46 | 33.34 | 17.91 | 12.71 | 25.24 |
| Secukinumab vs placebo | 26.55 | 20.32 | 34.69 | 24.53 | 14.93 | 40.32 | 28.25 | 19.1 | 41.78 |
| Ixekizumab vs placebo | 32.45 | 23.61 | 44.60 | 39.46 | 20.64 | 75.44 | 24.51 | 10.05 | 59.77 |
| Brodalumab vs placebo | 25.45 | 18.74 | 34.57 | 26.58 | 16.65 | 42.41 | 23.74 | 10.09 | 55.86 |
| Apremilast vs placebo | 7.66 | 4.30 | 13.66 | 6.72 | 3.07 | 14.69 | 10.83 | 2.43 | 48.31 |
| Tofacitinib vs placebo | 8.50 | 6.23 | 11.60 | 6.3 | 4.14 | 9.56 | 17.91 | 8.3 | 38.62 |
| Guselkumab vs placebo | 21.03 | 14.56 | 30.38 | 26.1 | 14.71 | 46.3 | 12.7 | 4.28 | 37.69 |
| Methotrexate vs FAEs | 0.96 | 0.38 | 2.44 | 2 | 0.19 | 21.03 | 0.83 | 0.3 | 2.32 |
| Alefacept vs methotrexate | 1.12 | 0.42 | 3.02 | 1.12 | 0.42 | 3.02 | |||
| Ciclosporin vs methotrexate | 1.02 | 0.60 | 1.73 | 1.02 | 0.6 | 1.73 | |||
| Infliximab vs methotrexate | 2.86 | 2.06 | 3.97 | 2.86 | 2.06 | 3.97 | |||
| Adalimumab vs methotrexate | 3.80 | 2.26 | 6.39 | 3.35 | 2.02 | 5.57 | 13.2 | 3.4 | 51.32 |
| Etanercept vs acitretin | 11.00 | 0.63 | 191.47 | 11 | 0.63 | 191.47 | |||
| Guselkumab vs adalimumab | 1.41 | 1.21 | 1.65 | 1.4 | 1.18 | 1.66 | 2.88 | 0.68 | 12.21 |
| Ustekinumab vs etanercept | 1.85 | 1.50 | 2.27 | 1.8 | 1.27 | 2.55 | 1.95 | 1.37 | 2.77 |
| Secukinumab vs etanercept | 2.46 | 2.01 | 3.02 | 2.33 | 1.66 | 3.28 | 2.62 | 1.82 | 3.77 |
| Ixekizumab vs etanercept | 3.01 | 2.46 | 3.68 | 2.93 | 2.44 | 3.53 | 5.73 | 2.07 | 15.85 |
| Apremilast vs etanercept | 0.71 | 0.40 | 1.25 | 0.72 | 0.36 | 1.45 | 0.69 | 0.26 | 1.81 |
| Tofacitinib vs etanercept | 0.79 | 0.59 | 1.06 | 0.88 | 0.73 | 1.08 | 0.49 | 0.3 | 0.81 |
| Secukinumab vs ustekinumab | 1.33 | 1.11 | 1.61 | 1.38 | 1.03 | 1.84 | 1.19 | 0.79 | 1.81 |
| Brodalumab vs ustekinumab | 1.28 | 1.10 | 1.48 | 1.27 | 1.1 | 1.46 | 1.64 | 0.69 | 3.89 |
| FAES: fumaric acid esters; LCI: low confidence interval; RR: risk ratio; UCI: upper confidence interval; vs: versus, *The comparisons listed in this table were included in at least one direct‐evidence analysis. | |||||||||
| Class‐level | SUCRA | Rank | SUCRA | Rank | SUCRA | Rank | SUCRA | Rank | SUCRA | Rank | SUCRA | Rank |
| Anti‐IL12/23 | 85.7 | 2 | 53.9 | 3 | 85.0 | 2 | 57.0 | 3 | 83.8 | 2 | 75.7 | 3 |
| Anti‐IL17 | 100.0 | 1 | 21.0 | 8 | 99.6 | 1 | 14.1 | 6 | 99.9 | 1 | 95.4 | 1 |
| Anti‐IL23 | 71.3 | 3 | 39.6 | 5 | 72.2 | 3 | 78.7 | 2 | 73.1 | 3 | 83.4 | 2 |
| Anti‐TNF alpha | 56.4 | 4 | 39.2 | 6 | 57.4 | 4 | 47.5 | 5 | 57.5 | 4 | 58.4 | 4 |
| Other biologics | 26.3 | 6 | 68.2 | 2 | 17.0 | 7 | _ | _ | 16.6 | 7 | 15.5 | 7 |
| Small molecules | 41.5 | 5 | 45.4 | 4 | 42.7 | 5 | 7.9 | 7 | 42.0 | 5 | 40.4 | 5 |
| Conventional systemic treatments | 18.7 | 7 | 94.8 | 1 | 26.0 | 6 | 50.8 | 4 | 27.1 | 6 | 30.8 | 6 |
| Placebo | 0 | 8 | 38.0 | 7 | 0 | 8 | 94.0 | 1 | 0 | 8 | 0.4 | 8 |
| AE: adverse events; FAEs: fumaric acid esters; PGA: Physician Global Assessment; QoL: Specific quality of life scale; SAE: serious adverse events | ||||||||||||
| Drug | SUCRA | Rank | SUCRA | Rank | SUCRA | Rank | SUCRA | Rank | SUCRA | Rank | SUCRA | Rank |
| Acitretin | 9.9 | 19 | 46.9 | 9 | 26.0 | 15 | ‐ | ‐ | ‐ | ‐ | ‐ | ‐ |
| Adalimumab | 63.1 | 8 | 40.4 | 14 | 60.2 | 9 | 70.1 | 5 | 56.9 | 8 | 57.6 | 7 |
| Alefacept | 25.3 | 15 | 62.6 | 5 | 12.6 | 18 | ‐ | ‐ | 13.1 | 18 | 15.9 | 13 |
| Apremilast | 39.7 | 13 | 54.7 | 7 | 33.2 | 14 | 14.3 | 16 | 27.9 | 14 | 28.6 | 10 |
| Brodalumab | 84.3 | 3 | 39.8 | 15 | 82.1 | 3 | 46.4 | 9 | 84.0 | 5 | 52.3 | 8 |
| Certolizumab | 75.7 | 5 | 70.9 | 3 | 71.6 | 6 | 78.0 | 4 | 90.1 | 1 | ‐ | ‐ |
| Ciclosporin | 21.3 | 17 | 78.2 | 2 | 33.2 | 13 | 36.8 | 12 | 24.0 | 16 | ‐ | ‐ |
| Etanercept | 52.6 | 11 | 43.6 | 11 | 57.7 | 10 | 45.9 | 10 | 51.7 | 10 | 67.6 | 5 |
| FAEs | 21.9 | 16 | 57.7 | 6 | 11.1 | 19 | 17.8 | 15 | 15.4 | 17 | ‐ | ‐ |
| Guselkumab | 77.0 | 4 | 42.6 | 12 | 71.6 | 7 | 78.2 | 3 | 67.5 | 7 | 84.3 | 2 |
| Infliximab | 53.2 | 10 | 64.4 | 4 | 48.0 | 11 | 40.1 | 11 | 52.4 | 9 | ‐ | ‐ |
| Itolizumab | 56.0 | 9 | ‐ | ‐ | 71.6 | 8 | ‐ | ‐ | 29.4 | 13 | 16.0 | 12 |
| Ixekizumab | 94.3 | 1 | 33.7 | 17 | 91.8 | 1 | 18.1 | 14 | 85.9 | 3 | 99.2 | 1 |
| Methotrexate | 20.2 | 18 | 90.7 | 1 | 21.3 | 16 | 68.4 | 6 | 24.9 | 15 | 31.5 | 9 |
| Placebo | 2.9 | 20 | 42.0 | 13 | 0.0 | 20 | 88.0 | 1 | 0.3 | 19 | 1.2 | 14 |
| Ponesimod | 37.3 | 14 | 18.1 | 19 | 21.3 | 17 | 14.0 | 17 | 48.7 | 11 | 28.1 | 11 |
| Secukinumab | 86.5 | 2 | 29.9 | 18 | 86.7 | 2 | 36.3 | 13 | 84.4 | 4 | ‐ | ‐ |
| Tildrakizumab | 63.6 | 7 | 37.8 | 16 | 78.3 | 4 | 86.1 | 2 | 86.3 | 2 | 74.9 | 4 |
| Tofacitinib | 42.5 | 12 | 44.0 | 10 | 46.2 | 12 | 47.3 | 8 | 36.6 | 12 | 65.1 | 6 |
| Ustekinumab | 72.6 | 6 | 52.0 | 8 | 75.2 | 5 | 64.3 | 7 | 70.4 | 6 | 77.4 | 3 |
| AE: adverse events; FAEs: fumaric acid esters; PASI: Psoriasis Area and Severity Index; PGA: Physician Global Assessment; QoL: specific quality of life scale; SAE: serious adverse events; SUCRA: Surface Under the Cumulative Ranking | ||||||||||||
| Number of randomised participants | Number of serious adverse events | Number of serious infections | Number of malignancies | Number of MACE | ||||||
| Drug | Placebo | Drug | Placebo | Drug | Placebo | Drug | Placebo | Drug | Placebo | |
| Conventional systemic agents | 767 | 220 | 19 | 10 | 0 | 0 | 0 | 0 | 0 | 0 |
| Anti‐TNF | 4508 | 2640 | 85 | 44 | 21 | 9 | 20 | 7 | 6 | 2 |
| Anti‐IL12/23 | 2547 | 1607 | 38 | 23 | 7 | 5 | 4 | 1 | 4 | 3 |
| Anti‐IL17 | 7551 | 2533 | 149 | 36 | 47 | 7 | 21 | 2 | 19 | 3 |
| Anti‐IL23 | 1347 | 510 | 23 | 7 | 4 | 1 | 0 | 0 | 1 | 0 |
| Other biologics | 509 | 227 | 15 | 10 | ‐ | ‐ | 2 | 1 | ‐ | ‐ |
| Small molecules | 3920 | 1280 | 89 | 28 | 15 | 5 | 14 | 0 | 5 | 1 |
| MACE: Major adverse cardiac events | ||||||||||
| Network meta‐analysis | Direct evidence | Indirect evidence | |||||||
| Comparisons* | RR | LCI | UCI | RR | LCI | UCI | RR | LCI | UCI |
| FAEs vs placebo | 0.77 | 0.30 | 1.99 | 0.83 | 0.31 | 2.21 | 0.19 | 0 | 12.57 |
| Methotrexate vs placebo | 0.23 | 0.05 | 0.99 | 0.16 | 0.03 | 0.86 | 0.68 | 0.04 | 11.67 |
| Adalimumab vs placebo | 1.02 | 0.61 | 1.73 | 1.05 | 0.62 | 1.78 | 0.07 | 0 | 26.92 |
| Etanercept vs placebo | 0.99 | 0.65 | 1.51 | 1.09 | 0.65 | 1.84 | 0.76 | 0.31 | 1.89 |
| Ustekinumab vs placebo | 0.89 | 0.57 | 1.39 | 0.74 | 0.44 | 1.26 | 1.36 | 0.61 | 2.99 |
| Secukinumab vs placebo | 1.19 | 0.69 | 2.03 | 1.61 | 0.78 | 3.33 | 0.75 | 0.3 | 1.87 |
| Ixekizumab vs placebo | 1.12 | 0.66 | 1.90 | 1.16 | 0.62 | 2.16 | 0.97 | 0.18 | 5.12 |
| Brodalumab vs placebo | 1.04 | 0.62 | 1.73 | 0.92 | 0.53 | 1.62 | 2.77 | 0.38 | 20.28 |
| Apremilast vs placebo | 0.84 | 0.47 | 1.52 | 0.78 | 0.42 | 1.44 | 4.33 | 0.09 | 201.27 |
| Tofacitinib vs placebo | 0.98 | 0.55 | 1.76 | 1.05 | 0.53 | 2.06 | 0.67 | 0.08 | 5.35 |
| Guselkumab vs placebo | 1.00 | 0.49 | 2.04 | 1.21 | 0.51 | 2.85 | 0.52 | 0.08 | 3.41 |
| Methotrexate vs FAEs | 0.30 | 0.06 | 1.59 | 1 | 0.02 | 48.83 | 0.23 | 0.04 | 1.45 |
| Ciclosporin vs methotrexate | 0.98 | 0.06 | 15.38 | 0.98 | 0.06 | 15.38 | ‐ | ‐ | ‐ |
| Infliximab vs methotrexate | 2.41 | 1.04 | 5.59 | 2.41 | 1.04 | 5.59 | ‐ | ‐ | ‐ |
| Adalimumab vs methotrexate | 4.43 | 0.99 | 19.81 | 2.24 | 0.21 | 23.56 | 6.68 | 1.04 | 42.76 |
| Etanercept vs acitretin | 1.00 | 0.02 | 48.82 | 1 | 0.02 | 48.83 | ‐ | ‐ | ‐ |
| Guselkumab vs adalimumab | 0.98 | 0.51 | 1.88 | 0.89 | 0.44 | 1.79 | 2.07 | 0.26 | 16.45 |
| Ustekinumab vs etanercept | 0.90 | 0.52 | 1.57 | 1.25 | 0.38 | 4.11 | 0.83 | 0.44 | 1.54 |
| Secukinumab vs etanercept | 1.20 | 0.66 | 2.19 | 1.17 | 0.45 | 3.04 | 1.22 | 0.56 | 2.65 |
| Ixekizumab vs etanercept | 1.14 | 0.66 | 1.94 | 1.02 | 0.53 | 1.95 | 1.47 | 0.53 | 4.09 |
| Apremilast vs etanercept | 0.85 | 0.42 | 1.72 | 2.69 | 0.41 | 17.5 | 0.7 | 0.33 | 1.5 |
| Tofacitinib vs etanercept | 0.99 | 0.53 | 1.87 | 0.87 | 0.35 | 2.19 | 1.12 | 0.47 | 2.7 |
| Secukinumab vs ustekinumab | 1.33 | 0.74 | 2.38 | 1.01 | 0.42 | 2.39 | 1.68 | 0.77 | 3.68 |
| Brodalumab vs ustekinumab | 1.16 | 0.64 | 2.11 | 1.32 | 0.59 | 2.98 | 0.95 | 0.33 | 2.71 |
| FAES: fumaric acid esters; LCI: low confidence interval; RR: risk ratio; UCI: upper confidence interval *The comparisons listed in this table were included in at least one direct‐evidence analysis. | |||||||||
| Outcome or subgroup title | No. of studies | No. of participants | Statistical method | Effect size |
| 1 Conventional systemic agents versus placebo Show forest plot | 3 | Risk Ratio (M‐H, Random, 95% CI) | Subtotals only | |
| 1.1 Methotrexate | 2 | 282 | Risk Ratio (M‐H, Random, 95% CI) | 2.60 [0.26, 25.90] |
| 1.2 Fumaric acid esters | 1 | 704 | Risk Ratio (M‐H, Random, 95% CI) | 4.47 [2.01, 9.95] |
| 2 Conventional systemic 1 versus conventional systemic 2 Show forest plot | 3 | Risk Ratio (M‐H, Random, 95% CI) | Subtotals only | |
| 2.1 Ciclosporin versus methotrexate | 2 | 172 | Risk Ratio (M‐H, Random, 95% CI) | 1.18 [0.47, 2.98] |
| 2.2 Methotrexate versus fumaric acid esters | 1 | 60 | Risk Ratio (M‐H, Random, 95% CI) | 2.0 [0.19, 20.90] |
| 3 Anti‐TNF alpha versus placebo Show forest plot | 21 | Risk Ratio (M‐H, Random, 95% CI) | Subtotals only | |
| 3.1 Etanercept versus placebo | 12 | 4954 | Risk Ratio (M‐H, Random, 95% CI) | 11.17 [7.66, 16.28] |
| 3.2 Adalimumab versus placebo | 8 | 3199 | Risk Ratio (M‐H, Random, 95% CI) | 14.86 [8.93, 24.73] |
| 3.3 Certolizumab versus placebo | 1 | 176 | Risk Ratio (M‐H, Random, 95% CI) | 24.58 [3.48, 173.49] |
| 4 Ustekinumab versus placebo Show forest plot | 7 | 3832 | Risk Ratio (M‐H, Random, 95% CI) | 22.59 [14.74, 34.64] |
| 5 Anti‐IL17 versus placebo Show forest plot | 16 | Risk Ratio (M‐H, Random, 95% CI) | Subtotals only | |
| 5.1 Secukinumab versus placebo | 7 | 2707 | Risk Ratio (M‐H, Random, 95% CI) | 26.52 [14.91, 47.17] |
| 5.2 Ixekizumab versus placebo | 4 | 3268 | Risk Ratio (M‐H, Random, 95% CI) | 53.85 [15.34, 189.07] |
| 5.3 Brodalumab versus placebo | 5 | 4109 | Risk Ratio (M‐H, Random, 95% CI) | 26.33 [16.77, 41.33] |
| 6 Anti‐IL23 versus placebo Show forest plot | 4 | Risk Ratio (M‐H, Random, 95% CI) | Subtotals only | |
| 6.1 Guselkumab versus placebo | 3 | 1502 | Risk Ratio (M‐H, Random, 95% CI) | 24.87 [14.20, 43.55] |
| 6.2 Tildrakizumab versus placebo | 1 | 355 | Risk Ratio (M‐H, Random, 95% CI) | 15.63 [2.24, 109.29] |
| 7 Other biologics Show forest plot | 1 | 225 | Risk Ratio (M‐H, Random, 95% CI) | 12.26 [0.76, 197.54] |
| 7.1 Itolizumab versus placebo | 1 | 225 | Risk Ratio (M‐H, Random, 95% CI) | 12.26 [0.76, 197.54] |
| 8 Biologic versus conventional systemic treatments Show forest plot | 4 | Risk Ratio (M‐H, Random, 95% CI) | Subtotals only | |
| 8.1 Etanercept versus acitretin | 1 | 60 | Risk Ratio (M‐H, Random, 95% CI) | 11.00 [0.64, 190.53] |
| 8.2 Infliximab versus methotrexate | 1 | 868 | Risk Ratio (M‐H, Random, 95% CI) | 2.86 [2.15, 3.80] |
| 8.3 Adalimumab versus methotrexate | 1 | 218 | Risk Ratio (M‐H, Random, 95% CI) | 3.73 [2.25, 6.19] |
| 8.4 Alefacept versus methotrexate | 1 | 212 | Risk Ratio (M‐H, Random, 95% CI) | 1.12 [0.42, 2.98] |
| 9 Biologic 1 versus biologic 2 Show forest plot | 10 | Risk Ratio (M‐H, Random, 95% CI) | Subtotals only | |
| 9.1 Ustekinumab versus Etanercept | 1 | 903 | Risk Ratio (M‐H, Random, 95% CI) | 1.80 [1.45, 2.24] |
| 9.2 Secukinumab versus etanercept | 1 | 980 | Risk Ratio (M‐H, Random, 95% CI) | 2.32 [1.85, 2.92] |
| 9.3 Ixekizumab versus etanercept | 2 | 2209 | Risk Ratio (M‐H, Random, 95% CI) | 2.98 [2.24, 3.98] |
| 9.4 Secukinumab versus ustekinumab | 1 | 676 | Risk Ratio (M‐H, Random, 95% CI) | 1.38 [1.23, 1.53] |
| 9.5 Brodalumab versus ustekinumab | 2 | 3088 | Risk Ratio (M‐H, Random, 95% CI) | 1.27 [1.16, 1.39] |
| 9.6 Guselkumab versus adalimumab | 3 | 1658 | Risk Ratio (M‐H, Random, 95% CI) | 1.41 [1.25, 1.60] |
| 10 Small molecules versus placebo Show forest plot | 9 | Risk Ratio (M‐H, Random, 95% CI) | Subtotals only | |
| 10.1 Apremilast versus placebo | 4 | 1775 | Risk Ratio (M‐H, Random, 95% CI) | 6.78 [3.03, 15.17] |
| 10.2 Tofacitinib versus placebo | 4 | 2826 | Risk Ratio (M‐H, Random, 95% CI) | 6.80 [3.86, 11.99] |
| 10.3 Ponesimod versus placebo | 1 | 326 | Risk Ratio (M‐H, Random, 95% CI) | 6.60 [1.65, 26.41] |
| 11 Biologic versus small molecules Show forest plot | 2 | Risk Ratio (M‐H, Random, 95% CI) | Subtotals only | |
| 11.1 Etanercept versus Tofacitinib | 1 | 998 | Risk Ratio (M‐H, Random, 95% CI) | 1.13 [0.93, 1.38] |
| 11.2 Etanercept versus apremilast | 1 | 166 | Risk Ratio (M‐H, Random, 95% CI) | 1.42 [0.72, 2.78] |
| Outcome or subgroup title | No. of studies | No. of participants | Statistical method | Effect size |
| 1 Conventional systemic agents versus placebo Show forest plot | 3 | Risk Ratio (M‐H, Random, 95% CI) | Subtotals only | |
| 1.1 Methotrexate | 2 | 283 | Risk Ratio (M‐H, Random, 95% CI) | 0.16 [0.03, 0.88] |
| 1.2 Fumaric acid esters | 1 | 704 | Risk Ratio (M‐H, Random, 95% CI) | 0.83 [0.31, 2.21] |
| 2 Anti‐TNF alpha versus placebo Show forest plot | 20 | Risk Ratio (M‐H, Random, 95% CI) | Subtotals only | |
| 2.1 Etanercept versus placebo | 11 | 3783 | Risk Ratio (M‐H, Random, 95% CI) | 1.06 [0.61, 1.83] |
| 2.2 Adalimumab versus placebo | 8 | 3199 | Risk Ratio (M‐H, Random, 95% CI) | 1.02 [0.60, 1.73] |
| 2.3 Certolizumab versus placebo | 1 | 176 | Risk Ratio (M‐H, Random, 95% CI) | 0.49 [0.10, 2.36] |
| 3 Ustekinumab versus placebo Show forest plot | 8 | 4154 | Risk Ratio (M‐H, Random, 95% CI) | 0.89 [0.50, 1.58] |
| 4 Anti‐IL17 versus placebo Show forest plot | 16 | Risk Ratio (M‐H, Random, 95% CI) | Subtotals only | |
| 4.1 Secukinumab versus placebo | 7 | 2707 | Risk Ratio (M‐H, Random, 95% CI) | 1.67 [0.79, 3.53] |
| 4.2 Ixekizumab versus placebo | 4 | 3268 | Risk Ratio (M‐H, Random, 95% CI) | 1.23 [0.65, 2.32] |
| 4.3 Brodalumab versus placebo | 5 | 4109 | Risk Ratio (M‐H, Random, 95% CI) | 0.92 [0.52, 1.61] |
| 5 Anti‐IL23 versus placebo Show forest plot | 4 | Risk Ratio (M‐H, Random, 95% CI) | Subtotals only | |
| 5.1 Guselkumab versus placebo | 3 | 1502 | Risk Ratio (M‐H, Random, 95% CI) | 1.21 [0.51, 2.85] |
| 5.2 Tildrakizumab versus placebo | 1 | 355 | Risk Ratio (M‐H, Random, 95% CI) | 1.36 [0.07, 24.94] |
| 6 Other biologics Show forest plot | 2 | Risk Ratio (M‐H, Random, 95% CI) | Subtotals only | |
| 6.1 Alefacept versus placebo | 2 | 736 | Risk Ratio (M‐H, Random, 95% CI) | 0.74 [0.34, 1.62] |
| 7 Biologic versus conventional systemic treatments Show forest plot | 3 | Risk Ratio (M‐H, Random, 95% CI) | Subtotals only | |
| 7.1 Etanercept versus acitretin | 1 | 60 | Risk Ratio (M‐H, Random, 95% CI) | 0.0 [0.0, 0.0] |
| 7.2 Infliximab versus methotrexate | 1 | 868 | Risk Ratio (M‐H, Random, 95% CI) | 2.41 [1.04, 5.59] |
| 7.3 Adalimumab versus methotrexate | 1 | 218 | Risk Ratio (M‐H, Random, 95% CI) | 2.04 [0.19, 22.14] |
| 8 Biologic 1 versus biologic 2 Show forest plot | 10 | Risk Ratio (M‐H, Random, 95% CI) | Subtotals only | |
| 8.1 Ustekinumab versus etanercept | 1 | 903 | Risk Ratio (M‐H, Random, 95% CI) | 1.25 [0.38, 4.11] |
| 8.2 Secukinumab versus etanercept | 1 | 980 | Risk Ratio (M‐H, Random, 95% CI) | 1.08 [0.41, 2.82] |
| 8.3 Ixekizumab versus etanercept | 2 | 2209 | Risk Ratio (M‐H, Random, 95% CI) | 1.07 [0.55, 2.06] |
| 8.4 Secukinumab versus ustekinumab | 1 | 676 | Risk Ratio (M‐H, Random, 95% CI) | 1.01 [0.42, 2.39] |
| 8.5 Brodalumab versus ustekinumab | 2 | 3088 | Risk Ratio (M‐H, Random, 95% CI) | 1.51 [0.64, 3.56] |
| 8.6 Guselkumab versus adalimumab | 3 | 1658 | Risk Ratio (M‐H, Random, 95% CI) | 0.90 [0.44, 1.82] |
| 9 Small molecules versus placebo Show forest plot | 11 | Risk Ratio (M‐H, Random, 95% CI) | Subtotals only | |
| 9.1 Apremilast versus placebo | 5 | 2036 | Risk Ratio (M‐H, Random, 95% CI) | 0.79 [0.41, 1.49] |
| 9.2 Tofacitinib versus placebo | 5 | 2838 | Risk Ratio (M‐H, Random, 95% CI) | 1.05 [0.53, 2.06] |
| 9.3 Ponesimod versus placebo | 1 | 326 | Risk Ratio (M‐H, Random, 95% CI) | 2.59 [0.34, 19.85] |
| 10 Biologic versus small molecules Show forest plot | 2 | Risk Ratio (M‐H, Random, 95% CI) | Subtotals only | |
| 10.1 Etanercept versus tofacitinib | 1 | 998 | Risk Ratio (M‐H, Random, 95% CI) | 1.15 [0.46, 2.89] |
| 10.2 Etanercept versus apremilast | 1 | 166 | Risk Ratio (M‐H, Random, 95% CI) | 0.33 [0.04, 3.14] |
| Outcome or subgroup title | No. of studies | No. of participants | Statistical method | Effect size |
| 1 Conventional systemic agents versus placebo Show forest plot | 3 | Risk Ratio (M‐H, Random, 95% CI) | Subtotals only | |
| 1.1 Methotrexate | 2 | 283 | Risk Ratio (M‐H, Random, 95% CI) | 2.36 [1.19, 4.68] |
| 1.2 Fumaric acid esters | 1 | 704 | Risk Ratio (M‐H, Random, 95% CI) | 2.56 [1.68, 3.89] |
| 2 Conventional systemic 1 versus conventional systemic 2 Show forest plot | 3 | Risk Ratio (M‐H, Random, 95% CI) | Subtotals only | |
| 2.1 Ciclosporin versus methotrexate | 2 | 172 | Risk Ratio (M‐H, Random, 95% CI) | 1.37 [0.84, 2.23] |
| 2.2 Methotrexate versus fumaric acid esters | 1 | 60 | Risk Ratio (M‐H, Random, 95% CI) | 1.2 [0.41, 3.51] |
| 3 Anti‐TNF alpha versus placebo Show forest plot | 22 | Risk Ratio (M‐H, Random, 95% CI) | Subtotals only | |
| 3.1 Etanercept versus placebo | 13 | 5066 | Risk Ratio (M‐H, Random, 95% CI) | 8.55 [6.94, 10.52] |
| 3.2 Adalimumab versus placebo | 8 | 3199 | Risk Ratio (M‐H, Random, 95% CI) | 9.08 [6.52, 12.65] |
| 3.3 Certolizumab versus placebo | 1 | 176 | Risk Ratio (M‐H, Random, 95% CI) | 11.31 [4.37, 29.24] |
| 4 Ustekinumab versus placebo Show forest plot | 8 | 4154 | Risk Ratio (M‐H, Random, 95% CI) | 12.41 [8.69, 17.71] |
| 5 Anti‐IL17 versus placebo Show forest plot | 16 | Risk Ratio (M‐H, Random, 95% CI) | Subtotals only | |
| 5.1 Secukinumab versus placebo | 7 | 2707 | Risk Ratio (M‐H, Random, 95% CI) | 15.70 [11.27, 21.87] |
| 5.2 Ixekizumab versus placebo | 4 | 3268 | Risk Ratio (M‐H, Random, 95% CI) | 17.44 [10.45, 29.10] |
| 5.3 Brodalumab versus placebo | 5 | 4109 | Risk Ratio (M‐H, Random, 95% CI) | 12.80 [8.46, 19.36] |
| 6 Anti‐IL23 versus placebo Show forest plot | 4 | Risk Ratio (M‐H, Random, 95% CI) | Subtotals only | |
| 6.1 Guselkumab versus Placebo | 3 | 1502 | Risk Ratio (M‐H, Random, 95% CI) | 12.28 [8.79, 17.17] |
| 6.2 Tildrakizumab versus placebo | 1 | 355 | Risk Ratio (M‐H, Random, 95% CI) | 14.51 [3.73, 56.45] |
| 7 Other biologics Show forest plot | 3 | Risk Ratio (M‐H, Random, 95% CI) | Subtotals only | |
| 7.1 Alefacept versus placebo | 2 | 736 | Risk Ratio (M‐H, Random, 95% CI) | 2.95 [1.76, 4.94] |
| 7.2 Itolizumab versus placebo | 1 | 225 | Risk Ratio (M‐H, Random, 95% CI) | 13.23 [1.88, 92.93] |
| 8 Biologic versus conventional systemic treatments Show forest plot | 4 | Risk Ratio (M‐H, Random, 95% CI) | Subtotals only | |
| 8.1 Etanercept versus acitretin | 1 | 60 | Risk Ratio (M‐H, Random, 95% CI) | 2.13 [1.09, 4.16] |
| 8.2 Alefacept versus methotrexate | 1 | 212 | Risk Ratio (M‐H, Random, 95% CI) | 0.74 [0.46, 1.21] |
| 8.3 Infliximab versus methotrexate | 1 | 868 | Risk Ratio (M‐H, Random, 95% CI) | 1.86 [1.58, 2.19] |
| 8.4 Adalimumab versus methotrexate | 1 | 218 | Risk Ratio (M‐H, Random, 95% CI) | 2.25 [1.72, 2.94] |
| 9 Biologic 1 versus biologic 2 Show forest plot | 10 | Risk Ratio (M‐H, Random, 95% CI) | Subtotals only | |
| 9.1 Ustekinumab versus etanercept | 1 | 903 | Risk Ratio (M‐H, Random, 95% CI) | 1.26 [1.13, 1.40] |
| 9.2 Secukinumab versus etanercept | 1 | 980 | Risk Ratio (M‐H, Random, 95% CI) | 1.64 [1.44, 1.88] |
| 9.3 Ixekizumab versus etanercept | 2 | 2209 | Risk Ratio (M‐H, Random, 95% CI) | 1.79 [1.43, 2.24] |
| 9.4 Secukinumab versus ustekinumab | 1 | 676 | Risk Ratio (M‐H, Random, 95% CI) | 1.13 [1.06, 1.20] |
| 9.5 Brodalumab versus ustekinumab | 2 | 3088 | Risk Ratio (M‐H, Random, 95% CI) | 1.10 [1.04, 1.17] |
| 9.6 Guselkumab versus adalimumab | 3 | 1658 | Risk Ratio (M‐H, Random, 95% CI) | 1.21 [1.13, 1.30] |
| 10 Small molecules versus placebo Show forest plot | 11 | Risk Ratio (M‐H, Random, 95% CI) | Subtotals only | |
| 10.1 Apremilast versus placebo | 5 | 2036 | Risk Ratio (M‐H, Random, 95% CI) | 3.88 [2.42, 6.22] |
| 10.2 Tofacitinib versus placebo | 5 | 2838 | Risk Ratio (M‐H, Random, 95% CI) | 6.41 [3.84, 10.71] |
| 10.3 Ponesimod versus placebo | 1 | 326 | Risk Ratio (M‐H, Random, 95% CI) | 3.51 [1.88, 6.53] |
| 11 Biologic versus small molecules Show forest plot | 2 | Risk Ratio (M‐H, Random, 95% CI) | Subtotals only | |
| 11.1 Etanercept versus Tofacitinib | 1 | 998 | Risk Ratio (M‐H, Random, 95% CI) | 1.14 [1.02, 1.28] |
| 11.2 Etanercept versus apremilast | 1 | 166 | Risk Ratio (M‐H, Random, 95% CI) | 1.21 [0.86, 1.71] |
| Outcome or subgroup title | No. of studies | No. of participants | Statistical method | Effect size |
| 1 Conventional systemic agents versus placebo Show forest plot | 3 | Risk Ratio (M‐H, Random, 95% CI) | Subtotals only | |
| 1.1 Methotrexate | 2 | 283 | Risk Ratio (M‐H, Random, 95% CI) | 2.94 [1.47, 5.89] |
| 1.2 Fumaric acid esters | 1 | 704 | Risk Ratio (M‐H, Random, 95% CI) | 2.73 [1.72, 4.32] |
| 2 Conventional systemic 1 versus conventional systemic 2 Show forest plot | 1 | Risk Ratio (M‐H, Random, 95% CI) | Subtotals only | |
| 2.1 Ciclosporin versus methotrexate | 1 | 88 | Risk Ratio (M‐H, Random, 95% CI) | 0.82 [0.47, 1.46] |
| 3 Anti‐TNF alpha versus placebo Show forest plot | 19 | Risk Ratio (M‐H, Random, 95% CI) | Subtotals only | |
| 3.1 Etanercept versus placebo | 11 | 4334 | Risk Ratio (M‐H, Random, 95% CI) | 7.77 [5.98, 10.10] |
| 3.2 Adalimumab versus placebo | 7 | 3051 | Risk Ratio (M‐H, Random, 95% CI) | 8.38 [6.28, 11.18] |
| 3.3 Certolizumab versus placebo | 1 | 176 | Risk Ratio (M‐H, Random, 95% CI) | 35.88 [5.11, 251.73] |
| 4 Ustekinumab versus placebo Show forest plot | 8 | 4154 | Risk Ratio (M‐H, Random, 95% CI) | 11.33 [7.38, 17.39] |
| 5 Anti‐IL17 versus placebo Show forest plot | 15 | Risk Ratio (M‐H, Random, 95% CI) | Subtotals only | |
| 5.1 Secukinumab versus placebo | 6 | 2607 | Risk Ratio (M‐H, Random, 95% CI) | 17.16 [7.48, 39.36] |
| 5.2 Ixekizumab versus placebo | 4 | 3268 | Risk Ratio (M‐H, Random, 95% CI) | 17.46 [9.87, 30.90] |
| 5.3 Brodalumab versus placebo | 5 | 4109 | Risk Ratio (M‐H, Random, 95% CI) | 18.78 [13.29, 26.55] |
| 6 Anti‐IL23 versus placebo Show forest plot | 4 | Risk Ratio (M‐H, Random, 95% CI) | Subtotals only | |
| 6.1 Guselkumab versus placebo | 3 | 1502 | Risk Ratio (M‐H, Random, 95% CI) | 10.59 [7.73, 14.51] |
| 6.2 Tildrakizumab versus placebo | 1 | 355 | Risk Ratio (M‐H, Random, 95% CI) | 27.54 [3.95, 191.78] |
| 7 Other biologics Show forest plot | 2 | Risk Ratio (M‐H, Random, 95% CI) | Subtotals only | |
| 7.1 Alefacept versus placebo | 1 | 507 | Risk Ratio (M‐H, Random, 95% CI) | 2.54 [1.22, 5.29] |
| 7.2 Itolizumab versus placebo | 1 | 225 | Risk Ratio (M‐H, Random, 95% CI) | 3.78 [0.94, 15.17] |
| 8 Biologic versus conventional systemic treatments Show forest plot | 3 | Risk Ratio (M‐H, Random, 95% CI) | Subtotals only | |
| 8.1 Alefacept versus methotrexate | 1 | 212 | Risk Ratio (M‐H, Random, 95% CI) | 0.69 [0.37, 1.29] |
| 8.2 Infliximab versus methotrexate | 1 | 868 | Risk Ratio (M‐H, Random, 95% CI) | 1.99 [1.67, 2.37] |
| 8.3 Adalimumab versus methotrexate | 1 | 218 | Risk Ratio (M‐H, Random, 95% CI) | 2.44 [1.79, 3.32] |
| 9 Biologic 1 versus biologic 2 Show forest plot | 10 | Risk Ratio (M‐H, Random, 95% CI) | Subtotals only | |
| 9.1 Ustekinumab versus etanercept | 1 | 903 | Risk Ratio (M‐H, Random, 95% CI) | 1.40 [1.24, 1.58] |
| 9.2 Secukinumab versus etanercept | 1 | 980 | Risk Ratio (M‐H, Random, 95% CI) | 2.09 [1.73, 2.53] |
| 9.3 Ixekizumab versus etanercept | 2 | 2209 | Risk Ratio (M‐H, Random, 95% CI) | 2.01 [1.74, 2.31] |
| 9.4 Secukinumab versus ustekinumab | 1 | 676 | Risk Ratio (M‐H, Random, 95% CI) | 1.23 [1.13, 1.35] |
| 9.5 Brodalumab versus ustekinumab | 2 | 3088 | Risk Ratio (M‐H, Random, 95% CI) | 1.17 [1.07, 1.27] |
| 9.6 Guselkumab versus adalimumab | 3 | 1658 | Risk Ratio (M‐H, Random, 95% CI) | 1.24 [1.17, 1.32] |
| 10 Small molecules versus placebo Show forest plot | 10 | Risk Ratio (M‐H, Random, 95% CI) | Subtotals only | |
| 10.1 Apremilast versus placebo | 4 | 1776 | Risk Ratio (M‐H, Random, 95% CI) | 3.88 [2.04, 7.38] |
| 10.2 Tofacitinib versus placebo | 5 | 2838 | Risk Ratio (M‐H, Random, 95% CI) | 4.48 [3.51, 5.71] |
| 10.3 Ponesimod versus placebo | 1 | 326 | Risk Ratio (M‐H, Random, 95% CI) | 6.73 [2.19, 20.64] |
| 11 Biologic versus small molecules Show forest plot | 2 | Risk Ratio (M‐H, Random, 95% CI) | Subtotals only | |
| 11.1 Etanercept versus tofacitinib | 1 | 998 | Risk Ratio (M‐H, Random, 95% CI) | 1.15 [1.04, 1.27] |
| 11.2 Etanercept versus apremilast | 1 | 166 | Risk Ratio (M‐H, Random, 95% CI) | 1.33 [0.78, 2.27] |
| Outcome or subgroup title | No. of studies | No. of participants | Statistical method | Effect size |
| 1 Conventional systemic agents versus placebo Show forest plot | 2 | Std. Mean Difference (IV, Random, 95% CI) | Subtotals only | |
| 1.1 Methotrexate | 2 | 283 | Std. Mean Difference (IV, Random, 95% CI) | ‐0.67 [‐1.40, 0.06] |
| 2 Anti‐TNF alpha versus placebo Show forest plot | 14 | Std. Mean Difference (IV, Random, 95% CI) | Subtotals only | |
| 2.1 Etanercept versus placebo | 7 | 2779 | Std. Mean Difference (IV, Random, 95% CI) | ‐1.10 [‐1.37, ‐0.83] |
| 2.2 Adalimumab versus placebo | 7 | 2774 | Std. Mean Difference (IV, Random, 95% CI) | ‐1.02 [‐1.16, ‐0.88] |
| 3 Ustekinumab versus placebo Show forest plot | 6 | 2917 | Std. Mean Difference (IV, Random, 95% CI) | ‐1.21 [‐1.39, ‐1.03] |
| 4 Anti‐IL17 versus placebo Show forest plot | 5 | Std. Mean Difference (IV, Random, 95% CI) | Subtotals only | |
| 4.1 Ixekizumab versus placebo | 3 | 3126 | Std. Mean Difference (IV, Random, 95% CI) | ‐1.76 [‐2.09, ‐1.43] |
| 4.2 Brodalumab versus placebo | 2 | 349 | Std. Mean Difference (IV, Random, 95% CI) | ‐0.96 [‐1.44, ‐0.47] |
| 5 Anti‐IL23 versus placebo Show forest plot | 3 | Std. Mean Difference (IV, Random, 95% CI) | Subtotals only | |
| 5.1 Guselkumab versus placebo | 2 | 1252 | Std. Mean Difference (IV, Random, 95% CI) | ‐1.39 [‐1.63, ‐1.14] |
| 5.2 Tildrakizumab versus placebo | 1 | 355 | Std. Mean Difference (IV, Random, 95% CI) | ‐1.23 [‐1.55, ‐0.91] |
| 6 Other biologics Show forest plot | 2 | Std. Mean Difference (IV, Random, 95% CI) | Subtotals only | |
| 6.1 Alefacept versus placebo | 1 | 229 | Std. Mean Difference (IV, Random, 95% CI) | ‐0.32 [‐0.62, ‐0.02] |
| 6.2 Itolizumab versus placebo | 1 | 225 | Std. Mean Difference (IV, Random, 95% CI) | ‐0.34 [‐0.68, ‐0.01] |
| 7 Biologic versus conventional systemic treatments Show forest plot | 2 | Mean Difference (IV, Fixed, 95% CI) | Subtotals only | |
| 7.1 Alefacept versus methotrexate | 1 | 212 | Mean Difference (IV, Fixed, 95% CI) | 1.31 [‐0.28, 2.90] |
| 7.2 Adalimumab versus methotrexate | 1 | 218 | Mean Difference (IV, Fixed, 95% CI) | ‐3.40 [‐5.75, ‐1.05] |
| 8 Biologic 1 versus biologic 2 Show forest plot | 4 | Mean Difference (IV, Fixed, 95% CI) | Subtotals only | |
| 8.1 Ixekizumab versus etanercept | 2 | 2209 | Mean Difference (IV, Fixed, 95% CI) | ‐1.99 [‐2.39, ‐1.59] |
| 8.2 Guselkumab versus adalimumab | 2 | 1407 | Mean Difference (IV, Fixed, 95% CI) | ‐1.73 [‐2.50, ‐0.97] |
| 9 Small molecules versus placebo Show forest plot | 7 | Std. Mean Difference (IV, Random, 95% CI) | Subtotals only | |
| 9.1 Apremilast versus placebo | 3 | 1609 | Std. Mean Difference (IV, Random, 95% CI) | ‐0.62 [‐0.77, ‐0.47] |
| 9.2 Tofacitinib versus placebo | 3 | 2629 | Std. Mean Difference (IV, Random, 95% CI) | ‐1.09 [‐1.28, ‐0.89] |
| 9.3 Ponesimod versus placebo | 1 | 326 | Std. Mean Difference (IV, Random, 95% CI) | ‐0.58 [‐0.86, ‐0.31] |
| 10 Biologic versus small molecules Show forest plot | 1 | Std. Mean Difference (IV, Random, 95% CI) | Subtotals only | |
| 10.1 Etanercept versus Tofacitinib | 1 | 998 | Std. Mean Difference (IV, Random, 95% CI) | ‐0.06 [‐0.19, 0.07] |
| Outcome or subgroup title | No. of studies | No. of participants | Statistical method | Effect size |
| 1 Conventional systemic agents versus placebo Show forest plot | 3 | Risk Ratio (M‐H, Random, 95% CI) | Subtotals only | |
| 1.1 Methotrexate | 2 | 283 | Risk Ratio (M‐H, Random, 95% CI) | 0.94 [0.81, 1.10] |
| 1.2 Fumaric acid esters | 1 | 704 | Risk Ratio (M‐H, Random, 95% CI) | 1.40 [1.22, 1.62] |
| 2 Conventional systemic 1 versus conventional systemic 2 Show forest plot | 3 | Risk Ratio (M‐H, Random, 95% CI) | Subtotals only | |
| 2.1 Ciclosporin versus methotrexate | 2 | 172 | Risk Ratio (M‐H, Random, 95% CI) | 1.10 [0.90, 1.34] |
| 2.2 Methotrexate versus fumaric acid esters | 1 | 60 | Risk Ratio (M‐H, Random, 95% CI) | 1.13 [0.91, 1.39] |
| 3 Anti‐TNF alpha versus placebo Show forest plot | 17 | Risk Ratio (M‐H, Random, 95% CI) | Subtotals only | |
| 3.1 Etanercept versus placebo | 9 | 3529 | Risk Ratio (M‐H, Random, 95% CI) | 1.12 [1.05, 1.20] |
| 3.2 Adalimumab versus placebo | 7 | 3051 | Risk Ratio (M‐H, Random, 95% CI) | 1.06 [1.00, 1.13] |
| 3.3 Certolizumab versus placebo | 1 | 176 | Risk Ratio (M‐H, Random, 95% CI) | 1.00 [0.81, 1.22] |
| 4 Ustekinumab versus placebo Show forest plot | 8 | 4154 | Risk Ratio (M‐H, Random, 95% CI) | 1.06 [1.00, 1.13] |
| 5 Anti‐IL17 versus placebo Show forest plot | 16 | Risk Ratio (M‐H, Random, 95% CI) | Subtotals only | |
| 5.1 Secukinumab versus placebo | 7 | 2707 | Risk Ratio (M‐H, Random, 95% CI) | 1.15 [1.02, 1.29] |
| 5.2 Ixekizumab versus placebo | 4 | 3268 | Risk Ratio (M‐H, Random, 95% CI) | 1.24 [1.07, 1.45] |
| 5.3 Brodalumab versus placebo | 5 | 4109 | Risk Ratio (M‐H, Random, 95% CI) | 1.15 [1.00, 1.32] |
| 6 Anti‐IL23 versus placebo Show forest plot | 4 | Risk Ratio (M‐H, Random, 95% CI) | Subtotals only | |
| 6.1 Guselkumab versus placebo | 3 | 1502 | Risk Ratio (M‐H, Random, 95% CI) | 1.03 [0.92, 1.16] |
| 6.2 Tildrakizumab versus placebo | 1 | 355 | Risk Ratio (M‐H, Random, 95% CI) | 0.95 [0.76, 1.18] |
| 7 Biologic versus conventional systemic treatments Show forest plot | 2 | Risk Ratio (M‐H, Random, 95% CI) | Subtotals only | |
| 7.1 Infliximab versus methotrexate | 1 | 868 | Risk Ratio (M‐H, Random, 95% CI) | 1.08 [0.97, 1.20] |
| 7.2 Adalimumab versus methotrexate | 1 | 218 | Risk Ratio (M‐H, Random, 95% CI) | 0.90 [0.78, 1.05] |
| 8 Biologic 1 versus biologic 2 Show forest plot | 10 | Risk Ratio (M‐H, Random, 95% CI) | Subtotals only | |
| 8.1 Ustekinumab versus etanercept | 1 | 903 | Risk Ratio (M‐H, Random, 95% CI) | 0.97 [0.89, 1.06] |
| 8.2 Secukinumab versus etanercept | 1 | 980 | Risk Ratio (M‐H, Random, 95% CI) | 1.00 [0.89, 1.12] |
| 8.3 Ixekizumab versus etanercept | 2 | 2209 | Risk Ratio (M‐H, Random, 95% CI) | 1.06 [0.97, 1.15] |
| 8.4 Secukinumab versus ustekinumab | 1 | 676 | Risk Ratio (M‐H, Random, 95% CI) | 1.10 [0.98, 1.25] |
| 8.5 Brodalumab versus ustekinumab | 2 | 3088 | Risk Ratio (M‐H, Random, 95% CI) | 1.00 [0.93, 1.09] |
| 8.6 Guselkumab versus adalimumab | 3 | 1658 | Risk Ratio (M‐H, Random, 95% CI) | 0.97 [0.88, 1.07] |
| 9 Small molecules versus placebo Show forest plot | 10 | Risk Ratio (M‐H, Random, 95% CI) | Subtotals only | |
| 9.1 Apremilast versus placebo | 5 | 2036 | Risk Ratio (M‐H, Random, 95% CI) | 1.22 [1.07, 1.38] |
| 9.2 Tofacitinib versus placebo | 4 | 2641 | Risk Ratio (M‐H, Random, 95% CI) | 1.14 [1.03, 1.25] |
| 9.3 Ponesimod versus placebo | 1 | 326 | Risk Ratio (M‐H, Random, 95% CI) | 1.31 [1.02, 1.68] |
| 10 Biologic versus small molecules Show forest plot | 2 | Risk Ratio (M‐H, Random, 95% CI) | Subtotals only | |
| 10.1 Etanercept versus tofacitinib | 1 | 998 | Risk Ratio (M‐H, Random, 95% CI) | 1.00 [0.89, 1.12] |
| 10.2 Etanercept versus apremilast | 1 | 166 | Risk Ratio (M‐H, Random, 95% CI) | 1.32 [1.03, 1.69] |