Paracetamol (acetaminofeno) o fármacos antiinflamatorios no esteroideos, solos o combinados, para el alivio del dolor de la otitis media aguda en niños
Información
- DOI:
- https://doi.org/10.1002/14651858.CD011534.pub2Copiar DOI

- Base de datos:
-
- Cochrane Database of Systematic Reviews
- Versión publicada:
-
- 15 diciembre 2016see what's new
- Tipo:
-
- Intervention
- Etapa:
-
- Review
- Grupo Editorial Cochrane:
-
Grupo Cochrane de Infecciones respiratorias agudas
- Copyright:
-
- Copyright © 2016 The Cochrane Collaboration. Published by John Wiley & Sons, Ltd.
Cifras del artículo
Altmetric:
Citado por:
Autores
Contributions of authors
Protocol drafted by: AS, RPV, ACvdP, AGMS, RAMJD
Screening search results: AS, RPV
Extracting data: AS, RPV
Assessing risk of bias: AS, RPV
Entering data into RevMan: AS, RPV
Carrying out analysis: AS, RPV
Interpreting the analysis: all authors
Writing the review: all authors
General advice on the review: all authors
Sources of support
Internal sources
-
No sources of support supplied
External sources
-
The Netherlands Organisation for Health Research and Development (ZonMw), Netherlands.
The authors of this review received a grant from the The Netherlands Organisation for Health Research and Development (ZonMw) to conduct a pragmatic, cluster‐randomised clinical trial on pain management for children with AOM in primary care. This trial is currently ongoing.
-
NIHR Research Professorship Award, UK.
Professor Anne Schilder has received an NIHR Research Professorship Award in 2012
Declarations of interest
Roger AMJ Damoiseaux (RAMJ) is an Editor of the Cochrane Acute Respiratory Infections Group. Roger is an investigator of the PIM‐POM study, an ongoing cluster randomised clinical trial to optimise pain management in children with acute otitis media which is funded by a research grant from The Netherlands Organisation for Health Research and Development/SBOH no. 80‐83910‐98‐13006 (PIM‐POM study 2014).
Alastair D Hay (ADH) is funded by NIHR Research Professorship (NIHR‐RP‐02‐12‐012) and principal investigator of the ongoing UK primary care based RCT comparing the clinical‐ and cost‐effectiveness of anaesthetic (benzocaine‐phenazone) eardrops versus placebo drops and no drops in children aged 12 months to 10 years with AOM (CEDAR)
Paul Little (PL) is an Editor of the Cochrane Acute Respiratory Infections Group and investigator of the ongoing UK primary care based RCT comparing the clinical‐ and cost‐effectiveness of anaesthetic (benzocaine‐phenazone) eardrops versus placebo drops and no drops in children aged 12 months to 10 years with AOM (CEDAR).
Anne GM Schilder (AGMS) is Joint Co‐ordinating Editor of Cochrane ENT. Her team, evidENT, at the Ear Institute, University College London, is supported by an NIHR Research Professorship award. Anne is an investigator of the PIM‐POM study, an ongoing cluster randomised clinical trial to optimise pain management in children with acute otitis media which is funded by a research grant from The Netherlands Organisation for Health Research and Development/SBOH no. 80‐83910‐98‐13006 (PIM‐POM study 2014).
Alies Sjoukes (AS) is an investigator of the PIM‐POM study, an ongoing cluster randomised clinical trial to optimise pain management in children with acute otitis media which is funded by a research grant from The Netherlands Organisation for Health Research and Development/SBOH no. 80‐83910‐98‐13006 (PIM‐POM study 2014).
Roderick P Venekamp (RPV) is an Editor of the Cochrane Acute Respiratory Infections and ENT Groups. Roderick is an investigator of the PIM‐POM study, an ongoing cluster randomised clinical trial to optimise pain management in children with acute otitis media which is funded by a research grant from The Netherlands Organisation for Health Research and Development/SBOH no. 80‐83910‐98‐13006 (PIM‐POM study 2014).
Alma C van de Pol (ACvdP) is an investigator of the PIM‐POM study, an ongoing cluster randomised clinical trial to optimise pain management in children with acute otitis media which is funded by a research grant from The Netherlands Organisation for Health Research and Development/SBOH no. 80‐83910‐98‐13006 (PIM‐POM study 2014).
Acknowledgements
We gratefully acknowledge the assistance received from the staff at the Cochrane Acute Respiratory Infections editorial base and thank Sarah Thorning for designing the initial search strategy and Justin Clark for his support with the updated search strategy and searches. We also thank the following people for commenting on the draft review: Sallie Bernard, Tam Watson, Sebastian Straube, Sheena Derry, Conor Teljeur, and Tom Fahey.
Version history
| Published | Title | Stage | Authors | Version |
| 2023 Aug 18 | Paracetamol (acetaminophen) or non‐steroidal anti‐inflammatory drugs, alone or combined, for pain relief in acute otitis media in children | Review | Joline L.H. Sévaux, Roger AMJ Damoiseaux, Alma C de Pol, Vittoria Lutje, Alastair D Hay, Paul Little, Anne GM Schilder, Roderick P Venekamp | |
| 2016 Dec 15 | Paracetamol (acetaminophen) or non‐steroidal anti‐inflammatory drugs, alone or combined, for pain relief in acute otitis media in children | Review | Alies Sjoukes, Roderick P Venekamp, Alma C van de Pol, Alastair D Hay, Paul Little, Anne GM Schilder, Roger AMJ Damoiseaux | |
| 2015 Feb 13 | Paracetamol (acetaminophen) or non‐steroidal anti‐inflammatory drugs, alone or combined for pain relief in acute otitis media in children | Protocol | Alies Sjoukes, Roderick P Venekamp, Alma C van de Pol, Anne GM Schilder, Roger AMJ Damoiseaux | |
Differences between protocol and review
We excluded studies that focused on hospitalised children because we aimed to summarise evidence on analgesics for children with AOM applicable to every day clinical practice. Hospitalisation secondary to AOM is now rare in high‐income countries and any evidence on this study population is not easily transferable to every day clinical practice. This was not specifically mentioned in our published protocol (Sjoukes 2015).
Keywords
MeSH
Medical Subject Headings (MeSH) Keywords
- Acetaminophen [*therapeutic use];
- Acute Disease;
- Analgesics, Non‐Narcotic [*therapeutic use];
- Anti‐Bacterial Agents [therapeutic use];
- Anti‐Inflammatory Agents, Non‐Steroidal [therapeutic use];
- Drug Therapy, Combination;
- Fever [drug therapy];
- Ibuprofen [therapeutic use];
- Otitis Media [*complications];
- Pain [*drug therapy, etiology];
- Randomized Controlled Trials as Topic;
Medical Subject Headings Check Words
Child; Child, Preschool; Humans;
PICO
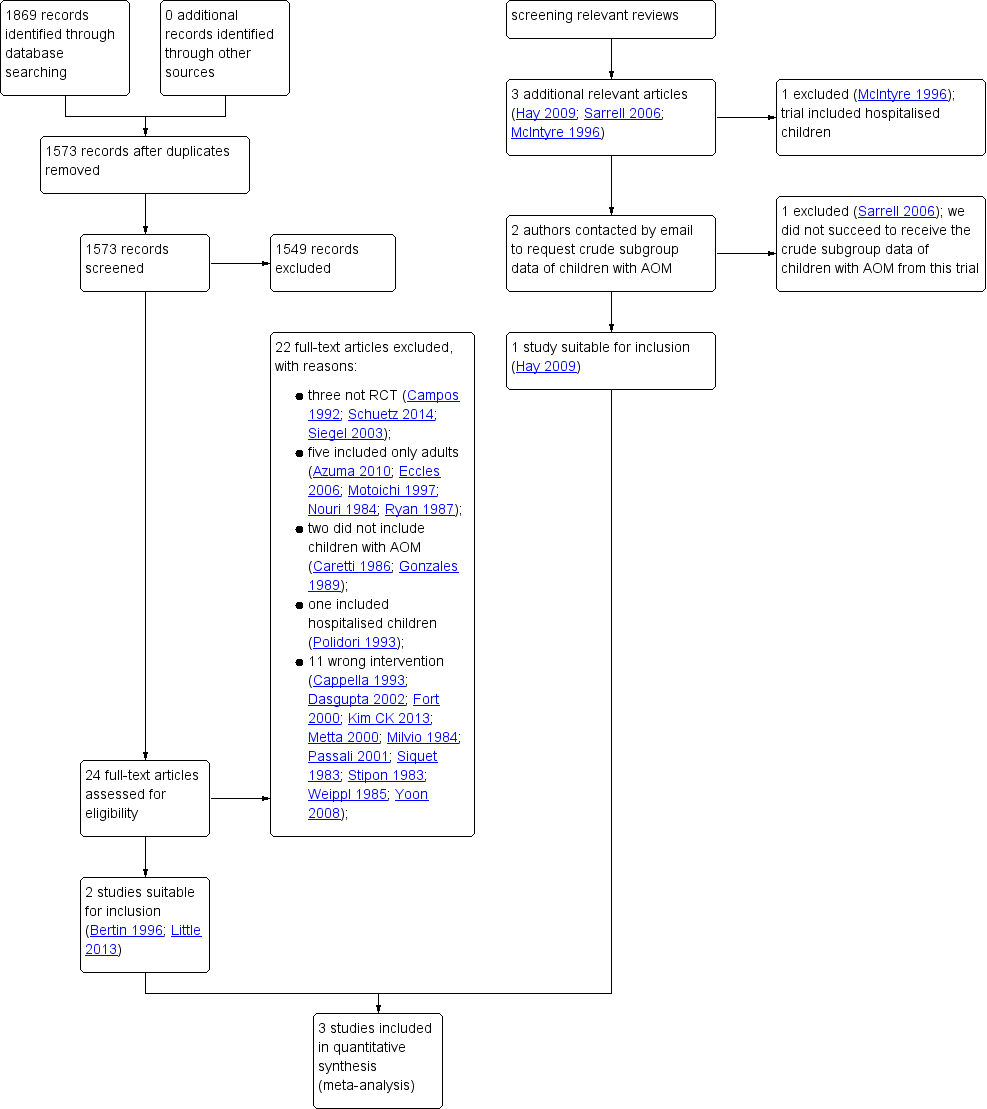
Study flow diagram

Risk of bias summary: review authors' judgements about each risk of bias item for each included study

Risk of bias graph: review authors' judgements about each risk of bias item presented as percentages across all included studies

Forest plot of comparison: 1 Paracetamol versus placebo, outcome: 1.1 Pain at 48 hours

Forest plot of comparison: 2 NSAIDs versus placebo, outcome: 2.1 Pain at 48 hours

Forest plot of comparison: 3 NSAIDs versus paracetamol, outcome: 3.2 Pain at 48 to 72 hours

Comparison 1 Paracetamol versus placebo, Outcome 1 Pain at 48 hours.

Comparison 1 Paracetamol versus placebo, Outcome 2 Adverse events.

Comparison 1 Paracetamol versus placebo, Outcome 3 Fever at 48 hours.

Comparison 2 NSAIDs versus placebo, Outcome 1 Pain at 48 hours.

Comparison 2 NSAIDs versus placebo, Outcome 2 Adverse events.

Comparison 2 NSAIDs versus placebo, Outcome 3 Fever at 48 hours.

Comparison 3 NSAIDs versus paracetamol, Outcome 1 Pain at 24 hours.

Comparison 3 NSAIDs versus paracetamol, Outcome 2 Pain at 48 to 72 hours.

Comparison 3 NSAIDs versus paracetamol, Outcome 3 Pain at 4 to 7 days.

Comparison 3 NSAIDs versus paracetamol, Outcome 4 Adverse events.

Comparison 3 NSAIDs versus paracetamol, Outcome 5 Mild pain at 24 hours.

Comparison 3 NSAIDs versus paracetamol, Outcome 6 Mild pain at 48 to 72 hours.

Comparison 3 NSAIDs versus paracetamol, Outcome 7 Mild pain at 4 to 7 days.

Comparison 3 NSAIDs versus paracetamol, Outcome 8 Mean pain score at 24 hours.

Comparison 3 NSAIDs versus paracetamol, Outcome 9 Mean pain score at 48 to 72 hours.

Comparison 3 NSAIDs versus paracetamol, Outcome 10 Mean pain score at 4 to 7 days.

Comparison 3 NSAIDs versus paracetamol, Outcome 11 Fever at 24 hours.

Comparison 3 NSAIDs versus paracetamol, Outcome 12 Fever at 48 to 72 hours.

Comparison 3 NSAIDs versus paracetamol, Outcome 13 Fever at 4 to 7 days.

Comparison 3 NSAIDs versus paracetamol, Outcome 14 Re‐consultations.

Comparison 3 NSAIDs versus paracetamol, Outcome 15 Delayed antibiotic prescriptions.

Comparison 4 NSAIDs + paracetamol versus paracetamol, Outcome 1 Pain at 24 hours.

Comparison 4 NSAIDs + paracetamol versus paracetamol, Outcome 2 Pain at 48 to 72 hours.

Comparison 4 NSAIDs + paracetamol versus paracetamol, Outcome 3 Pain at 4 to 7 days.

Comparison 4 NSAIDs + paracetamol versus paracetamol, Outcome 4 Adverse events.

Comparison 4 NSAIDs + paracetamol versus paracetamol, Outcome 5 Mild pain at 24 hours.

Comparison 4 NSAIDs + paracetamol versus paracetamol, Outcome 6 Mild pain at 48 to 72 hours.

Comparison 4 NSAIDs + paracetamol versus paracetamol, Outcome 7 Mild pain at 4 to 7 days.

Comparison 4 NSAIDs + paracetamol versus paracetamol, Outcome 8 Mean pain at 24 hours.

Comparison 4 NSAIDs + paracetamol versus paracetamol, Outcome 9 Mean pain at 48 to 72 hours.

Comparison 4 NSAIDs + paracetamol versus paracetamol, Outcome 10 Mean pain at 4 to 7 days.

Comparison 4 NSAIDs + paracetamol versus paracetamol, Outcome 11 Fever at 24 hours.

Comparison 4 NSAIDs + paracetamol versus paracetamol, Outcome 12 Fever at 48 to 72 hours.

Comparison 4 NSAIDs + paracetamol versus paracetamol, Outcome 13 Fever at 4 to 7 days.

Comparison 4 NSAIDs + paracetamol versus paracetamol, Outcome 14 Re‐consultations.

Comparison 4 NSAIDs + paracetamol versus paracetamol, Outcome 15 Delayed antibiotic prescriptions.

Comparison 4 NSAIDs + paracetamol versus paracetamol, Outcome 16 Serious complications.
| Paracetamol versus placebo for acute otitis media in children | ||||||
| Patients: children with acute otitis media | ||||||
| Outcomes | Anticipated absolute effects* (95% CI) | Relative effect | № of participants | Quality of the evidence | Comments | |
| Risk with placebo | Risk with paracetamol | |||||
| Pain at various time points | ||||||
| 24 hours | no data available | n/a | n/a | n/a | ||
| 48 to 72 hours (48 hours) | Study population | RR 0.38 | 148 | ⊕⊕⊝⊝ | NNTB based on the study population risk was 1/(253 to 96)*1000 = 7 | |
| 253 per 1000 | 96 per 1000 | |||||
| 4 to 7 days | no data available | |||||
| Adverse events | Study population | RR 1.03 | 148 | ⊕⊝⊝⊝ | ||
| 40 per 1000 | 41 per 1000 | |||||
| Mean time to resolution of pain | no data available | n/a | n/a | n/a | ||
| Mean pain score at various time points | no data available | n/a | n/a | n/a | ||
| Fever at various time points | ||||||
| 24 hours | no data available | n/a | n/a | n/a | ||
| 48 to 72 hours (48 hours) | Study population | RR 1.03 | 148 | ⊕⊝⊝⊝ | ||
| 13 per 1000 | 14 per 1000 | |||||
| 4 to 7 days | no data available | n/a | n/a | n/a | ||
| Re‐consultations | no data available | n/a | n/a | n/a | ||
| Delayed antibiotic prescriptions | no data available | n/a | n/a | n/a | ||
| *The risk in the intervention group (and its 95% CI) is based on the assumed risk in the comparison group and the relative effect of the intervention (and its 95% CI). CI: Confidence interval; NNTB: number needed to treat to benefit; RR: Risk ratio; RCT: randomised controlled trial; | ||||||
| GRADE Working Group grades of evidence | ||||||
| ¹ We downgraded the evidence from high to low quality due to study limitations and questions about the applicability of evidence. ² We downgraded the evidence from high to very low quality due to study limitations and imprecise effect estimate (small sample size and infrequent occurrence of the outcome). ³ We downgraded the evidence from high to very low quality due to study limitations, imprecise effect estimate (infrequent occurrence of the outcome) and questions about the applicability of evidence. | ||||||
| NSAIDs versus placebo for acute otitis media in children | ||||||
| Patients: children with acute otitis media | ||||||
| Outcomes | Anticipated absolute effects* (95% CI) | Relative effect | № of participants | Quality of the evidence | Comments | |
| Risk with placebo | Risk with ibuprofen | |||||
| Pain at various time points | ||||||
| 24 hours | no data available | n/a | n/a | n/a | ||
| 48 to 72 hours (48 hours) | Study population | RR 0.28 | 146 | ⊕⊕⊝⊝ | NNTB based on the study population risk was 1/(253 to 71)*1000 = 6 | |
| 253 per 1000 | 71 per 1000 | |||||
| 4 to 7 days | no data available | n/a | n/a | n/a | ||
| Adverse events | Study population | RR 1.76 | 146 | ⊕⊝⊝⊝ | ||
| 40 per 1000 | 70 per 1000 | |||||
| Mean time to resolution of pain | no data available | n/a | n/a | n/a | ||
| Mean pain score at various time points | no data available | n/a | n/a | n/a | ||
| Fever at various time points | ||||||
| 24 hours | no data available | n/a | n/a | n/a | ||
| 48 to 72 hours (48 hours) | Study population | RR 1.06 | 146 | ⊕⊝⊝⊝ | ||
| 13 per 1000 | 14 per 1000 | |||||
| 4 to 7 days | no data available | n/a | n/a | n/a | ||
| Re‐consultations | no data available | n/a | n/a | n/a | ||
| Delayed antibiotic prescriptions | no data available | n/a | n/a | n/a | ||
| *The risk in the intervention group (and its 95% CI) is based on the assumed risk in the comparison group and the relative effect of the intervention (and its 95% CI). CI: Confidence interval; NNTB: number needed to treat to benefit; RR: Risk ratio; RCT: randomised controlled trial; | ||||||
| GRADE Working Group grades of evidence | ||||||
| ¹ We downgraded the evidence from high to low quality due to study limitations and questions about the applicability of evidence. ² We downgraded the evidence from high to very low quality due to study limitations and imprecise effect estimate (small sample size and infrequent occurrence of the outcome). ³ We downgraded the evidence from high to very low quality due to study limitations, imprecise effect estimate (infrequent occurrence of the outcome) and questions about the applicability of evidence. | ||||||
| NSAIDs versus paracetamol for acute otitis media in children | ||||||
| Patients: children with acute otitis media | ||||||
| Outcomes | Anticipated absolute effects* (95% CI) | Relative effect | № of participants | Quality of the evidence | Comments | |
| Risk with paracetamol | Risk with ibuprofen | |||||
| Pain at various time points | ||||||
| 24 hours | Study population | RR 0.83 | 39 | ⊕⊝⊝⊝ | ||
| 778 per 1000 | 646 per 1000 | |||||
| 48 to 72 hours | Study population | RR 0.91 | 183 | ⊕⊕⊝⊝ | ||
| 178 per 1000 | 162 per 1000 | |||||
| 4 to 7 days | Study population | RR 0.74 | 38 | ⊕⊝⊝⊝ | ||
| 188 per 1000 | 139 per 1000 | |||||
| Adverse events | Study population | RR 1.71 | 197 | ⊕⊝⊝⊝ | ||
| 30 per 1000 | 51 per 1000 | |||||
| Mean time to resolution of pain | no data available | n/a | n/a | n/a | ||
| Mean pain score at various time points** | ||||||
| 24 hours | The mean pain score with ibuprofen ranged from 2.5 to 3.9 | The mean pain score with paracetamol was on average 0.10 lower (0.67 lower to 0.47 higher) | n/a | 39 (2 RCTs) | ⊕⊝⊝⊝ | |
| 48 to 72 hours | The mean pain score with ibuprofen ranged from 1.6 to 2.4 | The mean pain score with paracetamol was on average 0.19 lower (0.65 lower to 0.27 higher) | n/a | 39 (2 RCTs) | ⊕⊝⊝⊝ | |
| 4 to 7 days | The mean pain score with ibuprofen ranged from 1 to 2.2 | The mean pain score with paracetamol was on average 0.30 higher (1.78 lower to 2.38 higher) | n/a | 31 (2 RCTs) | ⊕⊝⊝⊝ | |
| Fever at various time points | ||||||
| 24 hours | Study population | RR 0.69 | 39 | ⊕⊝⊝⊝ | ||
| 294 per 1000 | 203 per 1000 | |||||
| 48 to 72 hours | Study population | RR 1.18 | 182 | ⊕⊕⊝⊝ | ||
| 33 per 1000 | 39 per 1000 | |||||
| 4 to 7 days | Study population | RR 2.75 | 39 | ⊕⊝⊝⊝ | ||
| 0 per 1000 | 0 per 1000 | |||||
| Re‐consultations | Study population | RR 1.13 | 53 | ⊕⊝⊝⊝ | ||
| 815 per 1000 | 921 per 1000 | |||||
| Delayed antibiotic prescriptions | Study population | RR 1.32 | 53 | ⊕⊝⊝⊝ | ||
| 407 per 1000 | 538 per 1000 | |||||
| *The risk in the intervention group (and its 95% CI) is based on the assumed risk in the comparison group and the relative effect of the intervention (and its 95% CI). ** Hay 2009 assessed fever‐associated discomfort using a validated comfort scale (no comfort; not quite normal; some pain/distress; crying/very distressed), whereas Little 2013 assessed ear pain using a validated symptom score (ranging from 0 to 6 with 0 = no problem and 6 = as bad as it could be). CI: Confidence interval; NNTB: number needed to treat to benefit; RR: Risk ratio; RCT: randomised controlled trial; | ||||||
| GRADE Working Group grades of evidence | ||||||
| ¹ We downgraded the evidence high to very low quality due to study limitations and imprecise effect estimate (very small sample size). ² We downgraded the evidence from high to low quality due to study limitations and questions about the applicability of evidence. ³ We downgraded the evidence from high to very low quality due to study limitations and imprecise effect estimate (small sample size and infrequent occurrence of the outcome). | ||||||
| Outcome or subgroup title | No. of studies | No. of participants | Statistical method | Effect size |
| 1 Pain at 48 hours Show forest plot | 1 | 148 | Risk Ratio (M‐H, Fixed, 95% CI) | 0.38 [0.17, 0.85] |
| 2 Adverse events Show forest plot | 1 | 148 | Risk Ratio (M‐H, Fixed, 95% CI) | 1.03 [0.21, 4.93] |
| 3 Fever at 48 hours Show forest plot | 1 | 148 | Risk Ratio (M‐H, Fixed, 95% CI) | 1.03 [0.07, 16.12] |
| Outcome or subgroup title | No. of studies | No. of participants | Statistical method | Effect size |
| 1 Pain at 48 hours Show forest plot | 1 | 146 | Risk Ratio (M‐H, Fixed, 95% CI) | 0.28 [0.11, 0.70] |
| 2 Adverse events Show forest plot | 1 | 146 | Risk Ratio (M‐H, Fixed, 95% CI) | 1.76 [0.44, 7.10] |
| 3 Fever at 48 hours Show forest plot | 1 | 146 | Risk Ratio (M‐H, Fixed, 95% CI) | 1.06 [0.07, 16.57] |
| Outcome or subgroup title | No. of studies | No. of participants | Statistical method | Effect size |
| 1 Pain at 24 hours Show forest plot | 2 | 39 | Risk Ratio (M‐H, Fixed, 95% CI) | 0.83 [0.59, 1.18] |
| 2 Pain at 48 to 72 hours Show forest plot | 3 | 183 | Risk Ratio (M‐H, Fixed, 95% CI) | 0.91 [0.54, 1.54] |
| 3 Pain at 4 to 7 days Show forest plot | 2 | 38 | Risk Ratio (M‐H, Fixed, 95% CI) | 0.74 [0.17, 3.23] |
| 4 Adverse events Show forest plot | 2 | 197 | Risk Ratio (M‐H, Random, 95% CI) | 1.71 [0.43, 6.90] |
| 5 Mild pain at 24 hours Show forest plot | 2 | 39 | Risk Ratio (M‐H, Fixed, 95% CI) | 1.08 [0.31, 3.73] |
| 6 Mild pain at 48 to 72 hours Show forest plot | 2 | 39 | Risk Ratio (M‐H, Fixed, 95% CI) | 1.35 [0.62, 2.91] |
| 7 Mild pain at 4 to 7 days Show forest plot | 2 | 39 | Risk Ratio (M‐H, Fixed, 95% CI) | 0.91 [0.37, 2.23] |
| 8 Mean pain score at 24 hours Show forest plot | 2 | 39 | Mean Difference (IV, Fixed, 95% CI) | 0.10 [‐0.47, 0.67] |
| 9 Mean pain score at 48 to 72 hours Show forest plot | 2 | 39 | Mean Difference (IV, Fixed, 95% CI) | 0.19 [‐0.27, 0.65] |
| 10 Mean pain score at 4 to 7 days Show forest plot | 2 | 31 | Mean Difference (IV, Fixed, 95% CI) | ‐0.30 [‐2.38, 1.78] |
| 11 Fever at 24 hours Show forest plot | 2 | 39 | Risk Ratio (M‐H, Fixed, 95% CI) | 0.69 [0.24, 2.00] |
| 12 Fever at 48 to 72 hours Show forest plot | 3 | 182 | Risk Ratio (M‐H, Fixed, 95% CI) | 1.18 [0.31, 4.44] |
| 13 Fever at 4 to 7 days Show forest plot | 2 | 39 | Risk Ratio (M‐H, Fixed, 95% CI) | 2.75 [0.12, 60.70] |
| 14 Re‐consultations Show forest plot | 1 | 53 | Risk Ratio (M‐H, Fixed, 95% CI) | 1.13 [0.92, 1.40] |
| 15 Delayed antibiotic prescriptions Show forest plot | 1 | 53 | Risk Ratio (M‐H, Fixed, 95% CI) | 1.32 [0.74, 2.35] |
| Outcome or subgroup title | No. of studies | No. of participants | Statistical method | Effect size |
| 1 Pain at 24 hours Show forest plot | 2 | 41 | Risk Ratio (M‐H, Fixed, 95% CI) | 1.07 [0.78, 1.47] |
| 2 Pain at 48 to 72 hours Show forest plot | 2 | 41 | Risk Ratio (M‐H, Fixed, 95% CI) | 0.71 [0.42, 1.20] |
| 3 Pain at 4 to 7 days Show forest plot | 2 | 41 | Risk Ratio (M‐H, Fixed, 95% CI) | 1.65 [0.58, 4.72] |
| 4 Adverse events Show forest plot | 1 | 56 | Risk Ratio (M‐H, Fixed, 95% CI) | 0.0 [0.0, 0.0] |
| 5 Mild pain at 24 hours Show forest plot | 2 | 41 | Risk Ratio (M‐H, Fixed, 95% CI) | 0.21 [0.02, 1.74] |
| 6 Mild pain at 48 to 72 hours Show forest plot | 2 | 41 | Risk Ratio (M‐H, Fixed, 95% CI) | 0.63 [0.24, 1.62] |
| 7 Mild pain at 4 to 7 days Show forest plot | 2 | 41 | Risk Ratio (M‐H, Fixed, 95% CI) | 0.5 [0.17, 1.43] |
| 8 Mean pain at 24 hours Show forest plot | 2 | 40 | Mean Difference (IV, Random, 95% CI) | 0.32 [‐0.59, 1.23] |
| 9 Mean pain at 48 to 72 hours Show forest plot | 2 | 40 | Mean Difference (IV, Fixed, 95% CI) | 0.60 [‐0.77, 1.97] |
| 10 Mean pain at 4 to 7 days Show forest plot | 2 | 33 | Mean Difference (IV, Fixed, 95% CI) | 0.7 [‐1.01, 2.41] |
| 11 Fever at 24 hours Show forest plot | 2 | 41 | Risk Ratio (M‐H, Fixed, 95% CI) | 1.48 [0.73, 2.99] |
| 12 Fever at 48 to 72 hours Show forest plot | 2 | 41 | Risk Ratio (M‐H, Fixed, 95% CI) | 2.13 [0.60, 7.60] |
| 13 Fever at 4 to 7 days Show forest plot | 2 | 41 | Risk Ratio (M‐H, Fixed, 95% CI) | 0.0 [0.0, 0.0] |
| 14 Re‐consultations Show forest plot | 1 | 56 | Risk Ratio (M‐H, Fixed, 95% CI) | 0.80 [0.58, 1.11] |
| 15 Delayed antibiotic prescriptions Show forest plot | 1 | 56 | Risk Ratio (M‐H, Fixed, 95% CI) | 1.27 [0.71, 2.26] |
| 16 Serious complications Show forest plot | 2 | 71 | Risk Ratio (M‐H, Fixed, 95% CI) | 0.0 [0.0, 0.0] |