Парацетамол (ацетаминофен) или нестероидные противовоспалительные средства, в отдельности или в комбинации, для облегчения боли при остром среднем отите у детей
Abstract
Background
Acute otitis media (AOM) is one of the most common childhood infectious diseases and a significant reason for antibiotic prescriptions in children worldwide. Pain from middle ear infection and pressure behind the eardrum is the key symptom of AOM. Ear pain is central to children's and parents' experience of the illness. Because antibiotics provide only marginal benefits, analgesic treatment including paracetamol (acetaminophen) and non‐steroidal anti‐inflammatory drugs (NSAIDs) is regarded as the cornerstone of AOM management in children.
Objectives
Our primary objective was to assess the effectiveness of paracetamol (acetaminophen) or NSAIDs, alone or combined, compared with placebo or no treatment in relieving pain in children with AOM. Our secondary objective was to assess the effectiveness of NSAIDs compared with paracetamol in children with AOM.
Search methods
We searched the Cochrane Central Register of Controlled Trials (CENTRAL), Issue 7, July 2016; MEDLINE (Ovid, from 1946 to August 2016), Embase (from 1947 to August 2016), CINAHL (from 1981 to August 2016), LILACS (from 1982 to August 2016) and Web of Science (from 1955 to August 2016) for published trials. We screened reference lists of included studies and relevant systematic reviews for additional trials. We searched WHO ICTRP, ClinicalTrials.gov, and the Netherlands Trial Registry (NTR) for completed and ongoing trials (search date 19 August 2016).
Selection criteria
We included randomised controlled trials (RCTs) comparing the effectiveness of paracetamol or NSAIDs, alone or combined, for pain relief in children with AOM. We also included trials of paracetamol or NSAIDs, alone or combined, for children with fever or upper respiratory tract infections (URTIs) if we were able to extract subgroup data on pain relief in children with AOM either directly or after obtaining additional data from study authors.
Data collection and analysis
Two review authors independently assessed methodological quality of the included trials and extracted data. We used the GRADE approach to rate the overall quality of evidence for each outcome of interest.
Main results
We included three RCTs (327 children) which were assessed at low to moderate risk of bias.
One RCT included 219 children with AOM, and used a three‐arm, parallel group, double‐blind design to compare paracetamol versus ibuprofen versus placebo. All children also received antibiotics and those with fever > 39 °C could have received paracetamol (30 mg to 60 mg) additionally to the studied treatments.
Another RCT involved 156 febrile children (26 of whom had AOM). The study design was a three‐arm, parallel group, double‐blind design and compared paracetamol versus ibuprofen versus ibuprofen plus paracetamol.
The third RCT included 889 children with respiratory tract infections (82 of whom had AOM). This study applied a 3 x 2 x 2 factorial, open‐label design and compared paracetamol versus ibuprofen versus ibuprofen plus paracetamol. Study participants were randomised to one of the three treatment groups as well as two dosing groups (regular versus as required) and two steam inhalation groups (steam versus no steam).
Authors of two RCTs provided crude subgroup data on children with AOM. We used data from the remaining trial to inform comparison of paracetamol versus placebo (148 children) and ibuprofen versus placebo (146 children) assessments. Data from all included RCTs informed comparison of ibuprofen versus paracetamol (183 children); data from the two RCTs informed comparison of ibuprofen plus paracetamol versus paracetamol alone (71 children).
We found evidence, albeit of low quality, that both paracetamol and ibuprofen as monotherapies were more effective than placebo in relieving pain at 48 hours (paracetamol versus placebo: proportion of children with pain 10% versus 25%, RR 0.38, 95% CI 0.17 to 0.85; number needed to treat to benefit (NNTB) 7; ibuprofen versus placebo: proportion of children with pain 7% versus 25%, RR 0.28, 95% CI 0.11 to 0.70; NNTB 6). Very low quality evidence suggested that adverse events did not significantly differ between children treated with either paracetamol, ibuprofen or placebo.
We found insufficient evidence of a difference between ibuprofen and paracetamol in relieving ear pain at 24 hours (2 RCTs, 39 children; RR 0.83, 95% CI 0.59 to 1.18; very low quality evidence), 48 to 72 hours (3 RCTs, 183 children; RR 0.91, 95% CI 0.54 to 1.54; low quality evidence) and four to seven days (2 RCTs, 38 children; RR 0.74, 95% CI 0.17 to 3.23; very low quality evidence).
Data on the effectiveness of ibuprofen plus paracetamol versus paracetamol alone came from two RCTs that provided crude subgroup data for 71 children with AOM. The small sample provided imprecise effect estimates and we were consequently unable to draw any firm conclusions (very low quality evidence).
Authors' conclusions
Despite explicit guideline recommendations on its use, current evidence on the effectiveness of paracetamol or NSAIDs, alone or combined, in relieving pain in children with AOM is limited. Low quality evidence indicates that both paracetamol and ibuprofen as monotherapies are more effective than placebo in relieving short‐term ear pain in children with AOM. There is insufficient evidence of a difference between ibuprofen and paracetamol in relieving short‐term ear pain in children with AOM, whereas data on the effectiveness of ibuprofen plus paracetamol versus paracetamol alone were insufficient to draw any firm conclusions. Further research is needed to provide insights into the role of ibuprofen as adjunct to paracetamol, and other analgesics such as anaesthetic eardrops, for children with AOM.
PICO
Резюме на простом языке
Обезболивающие средства у детей с острой инфекцией среднего уха
Вопрос обзора
Мы хотели выяснить, эффективны ли обезболивающие средства для снятия боли у детей с острой инфекцией среднего уха (острый средний отит (ОСО)) и какие лекарства, в отдельности или в комбинации, обеспечивают наиболее эффективное обезболивание.
Актуальность
Острая инфекция среднего уха (или ОСО) является одной из наиболее распространенных инфекций в детском возрасте. Боль в ухе, возникающая из‐за инфекции среднего уха и нарастания давления позади барабанной перепонки, является основным симптомом острого среднего отита(ОСО) и занимает центральное место в перенесенном опыте этого заболевания у детей и родителей. Поскольку антибиотики предоставляют лишь незначительную пользу, обезболивающие средства, такие как парацетамол (ацетаминофен) и нестероидные противовоспалительные средства (НПВС), считаются основными лекарствами при лечении ОСО у детей.
Дата поиска
Наши доказательства актуальны на 19 августа 2016 года.
Характеристика исследований
Мы включили данные из трех испытаний (с риском смещения от низкого до умеренного) по 327 детям с ОСО. В одном испытании (219 детей) сравнивали парацетамол с ибупрофеном и с фиктивным лекарством у детей с острым средним отитом. В этом испытании все дети также получали антибиотики и при лихорадке с температурой > 39 °C могли получать парацетамол в качестве дополнения к исследуемому лечению. В двух других исследованиях сравнивали эффекты парацетамола с ибупрофеном, с комбинацией "ибупрофен плюс парацетамол" у детей с лихорадкой и у пациентов с инфекциями дыхательных путей, соответственно. Авторы этих двух испытаний представили данные по подруппам, в частности по детям с острым средним отитом (26 детей и 82 ребенка, соответственно).
Источники финансирования исследований
В одном испытании парацетамол, ибупрофен и фиктивное лекарство (плацебо) были предоставлены фармацевтической компанией (Ethypharm). В отношении роли этой компании в разработке, проведении, анализе или представлении результатов этого испытания более детальная информация не была представлена. Другие два испытания финансировались правительственными (некоммерческими) грантами. В одном испытании лекарства были приобретены и предоставлены двумя компаниями (Pfizer и DHP Investigational Medicinal Products), которые не оказывали влияние на разработку, проведение, анализ или представление результатов (отчетов) исследования.
Основные результаты
Было очень мало доступной информации, чтобы оценить, насколько полезны обезболивающие средства для облегчения боли, связанной с ОСО, у детей. Мы обнаружили, что и парацетамол, и ибупрофен, при использовании их по отдельности, были более эффективными, чем фиктивное лекарство (плацебо), в облегчении боли в ушах через 48 часов (у 25% детей, получавших фиктивное лекарство, была остаточная боль через 48 часов, по сравнению с 10% в группе парацетамола и 7% в группе ибупрофена). Не было значимых различий в неблагоприятных событиях, о которых сообщали в испытаниях, между детьми, которых лечили либо парацетамолом, либо ибупрофеном, либо фиктивным лекарством (плацебо), но эти результаты следует интерпретировать с осторожностью, учитывая малое число участников и небольшую частоту неблагоприятных эффектов. Мы нашли недостаточно доказательств различий между парацетамолом и ибупрофеном в облегчении краткосрочной боли в ушах (через 24 часа, 48 ‐ 72 часа и от 4 до 7 дней) у детей с острым средним отитом. Мы не смогли сделать какие‐либо окончательные выводы об эффектах комбинации "ибупрофен плюс парацетамол", по сравнению с парацетамолом в отдельности, в облегчении боли в ухе у детей с острым средним отитом, главным образом, из‐за очень ограниченного числа участников (очень малый размер выборки).
Качество доказательств
Качество доказательств в отношении облегчения боли в ухе через 48 часов для сравнений "парацетамол против фиктивного лекарства (плацебо)" и "ибупрофен против фиктивного лекарства (плацебо)" было оценено как низкое (ограничения в исследованиях и вопросы относительно применимости доказательств повлияли на нашу уверенность в результатах); качество доказательств в отношении неблагоприятных событий было оценено как очень низкое (ограничения в исследованиях, небольшой размер выборки и низкая частота неблагоприятных событий повлияли на нашу уверенность в результатах).
Качество доказательств в отношении облегчения боли в ухе через 48‐72 часа для сравнения "ибупрофен против парацетамола" было оценено как низкое (ограничения в исследованиях и вопросы относительно применимости доказательств повлияли на нашу уверенность в результатах); качество доказательств в отношении облегчения боли в ухе через 24 часа и в период от четырех до семи дней было оценено как очень низкое (ограничения в исследованиях и очень небольшой размер выборки повлияли на нашу уверенность в результатах).
Качество доказательств в отношении всех исходов в клинических испытаниях, в которых ибупрофен в сочетании с парацетамолом сравнивали с парацетамолом в отдельности, было очень низким (ограничения в исследованиях и очень небольшой размер выборки повлияли на нашу уверенность в результатах).
Authors' conclusions
Summary of findings
| Paracetamol versus placebo for acute otitis media in children | ||||||
| Patients: children with acute otitis media | ||||||
| Outcomes | Anticipated absolute effects* (95% CI) | Relative effect | № of participants | Quality of the evidence | Comments | |
| Risk with placebo | Risk with paracetamol | |||||
| Pain at various time points | ||||||
| 24 hours | no data available | n/a | n/a | n/a | ||
| 48 to 72 hours (48 hours) | Study population | RR 0.38 | 148 | ⊕⊕⊝⊝ | NNTB based on the study population risk was 1/(253 to 96)*1000 = 7 | |
| 253 per 1000 | 96 per 1000 | |||||
| 4 to 7 days | no data available | |||||
| Adverse events | Study population | RR 1.03 | 148 | ⊕⊝⊝⊝ | ||
| 40 per 1000 | 41 per 1000 | |||||
| Mean time to resolution of pain | no data available | n/a | n/a | n/a | ||
| Mean pain score at various time points | no data available | n/a | n/a | n/a | ||
| Fever at various time points | ||||||
| 24 hours | no data available | n/a | n/a | n/a | ||
| 48 to 72 hours (48 hours) | Study population | RR 1.03 | 148 | ⊕⊝⊝⊝ | ||
| 13 per 1000 | 14 per 1000 | |||||
| 4 to 7 days | no data available | n/a | n/a | n/a | ||
| Re‐consultations | no data available | n/a | n/a | n/a | ||
| Delayed antibiotic prescriptions | no data available | n/a | n/a | n/a | ||
| *The risk in the intervention group (and its 95% CI) is based on the assumed risk in the comparison group and the relative effect of the intervention (and its 95% CI). CI: Confidence interval; NNTB: number needed to treat to benefit; RR: Risk ratio; RCT: randomised controlled trial; | ||||||
| GRADE Working Group grades of evidence | ||||||
| ¹ We downgraded the evidence from high to low quality due to study limitations and questions about the applicability of evidence. ² We downgraded the evidence from high to very low quality due to study limitations and imprecise effect estimate (small sample size and infrequent occurrence of the outcome). ³ We downgraded the evidence from high to very low quality due to study limitations, imprecise effect estimate (infrequent occurrence of the outcome) and questions about the applicability of evidence. | ||||||
| NSAIDs versus placebo for acute otitis media in children | ||||||
| Patients: children with acute otitis media | ||||||
| Outcomes | Anticipated absolute effects* (95% CI) | Relative effect | № of participants | Quality of the evidence | Comments | |
| Risk with placebo | Risk with ibuprofen | |||||
| Pain at various time points | ||||||
| 24 hours | no data available | n/a | n/a | n/a | ||
| 48 to 72 hours (48 hours) | Study population | RR 0.28 | 146 | ⊕⊕⊝⊝ | NNTB based on the study population risk was 1/(253 to 71)*1000 = 6 | |
| 253 per 1000 | 71 per 1000 | |||||
| 4 to 7 days | no data available | n/a | n/a | n/a | ||
| Adverse events | Study population | RR 1.76 | 146 | ⊕⊝⊝⊝ | ||
| 40 per 1000 | 70 per 1000 | |||||
| Mean time to resolution of pain | no data available | n/a | n/a | n/a | ||
| Mean pain score at various time points | no data available | n/a | n/a | n/a | ||
| Fever at various time points | ||||||
| 24 hours | no data available | n/a | n/a | n/a | ||
| 48 to 72 hours (48 hours) | Study population | RR 1.06 | 146 | ⊕⊝⊝⊝ | ||
| 13 per 1000 | 14 per 1000 | |||||
| 4 to 7 days | no data available | n/a | n/a | n/a | ||
| Re‐consultations | no data available | n/a | n/a | n/a | ||
| Delayed antibiotic prescriptions | no data available | n/a | n/a | n/a | ||
| *The risk in the intervention group (and its 95% CI) is based on the assumed risk in the comparison group and the relative effect of the intervention (and its 95% CI). CI: Confidence interval; NNTB: number needed to treat to benefit; RR: Risk ratio; RCT: randomised controlled trial; | ||||||
| GRADE Working Group grades of evidence | ||||||
| ¹ We downgraded the evidence from high to low quality due to study limitations and questions about the applicability of evidence. ² We downgraded the evidence from high to very low quality due to study limitations and imprecise effect estimate (small sample size and infrequent occurrence of the outcome). ³ We downgraded the evidence from high to very low quality due to study limitations, imprecise effect estimate (infrequent occurrence of the outcome) and questions about the applicability of evidence. | ||||||
| NSAIDs versus paracetamol for acute otitis media in children | ||||||
| Patients: children with acute otitis media | ||||||
| Outcomes | Anticipated absolute effects* (95% CI) | Relative effect | № of participants | Quality of the evidence | Comments | |
| Risk with paracetamol | Risk with ibuprofen | |||||
| Pain at various time points | ||||||
| 24 hours | Study population | RR 0.83 | 39 | ⊕⊝⊝⊝ | ||
| 778 per 1000 | 646 per 1000 | |||||
| 48 to 72 hours | Study population | RR 0.91 | 183 | ⊕⊕⊝⊝ | ||
| 178 per 1000 | 162 per 1000 | |||||
| 4 to 7 days | Study population | RR 0.74 | 38 | ⊕⊝⊝⊝ | ||
| 188 per 1000 | 139 per 1000 | |||||
| Adverse events | Study population | RR 1.71 | 197 | ⊕⊝⊝⊝ | ||
| 30 per 1000 | 51 per 1000 | |||||
| Mean time to resolution of pain | no data available | n/a | n/a | n/a | ||
| Mean pain score at various time points** | ||||||
| 24 hours | The mean pain score with ibuprofen ranged from 2.5 to 3.9 | The mean pain score with paracetamol was on average 0.10 lower (0.67 lower to 0.47 higher) | n/a | 39 (2 RCTs) | ⊕⊝⊝⊝ | |
| 48 to 72 hours | The mean pain score with ibuprofen ranged from 1.6 to 2.4 | The mean pain score with paracetamol was on average 0.19 lower (0.65 lower to 0.27 higher) | n/a | 39 (2 RCTs) | ⊕⊝⊝⊝ | |
| 4 to 7 days | The mean pain score with ibuprofen ranged from 1 to 2.2 | The mean pain score with paracetamol was on average 0.30 higher (1.78 lower to 2.38 higher) | n/a | 31 (2 RCTs) | ⊕⊝⊝⊝ | |
| Fever at various time points | ||||||
| 24 hours | Study population | RR 0.69 | 39 | ⊕⊝⊝⊝ | ||
| 294 per 1000 | 203 per 1000 | |||||
| 48 to 72 hours | Study population | RR 1.18 | 182 | ⊕⊕⊝⊝ | ||
| 33 per 1000 | 39 per 1000 | |||||
| 4 to 7 days | Study population | RR 2.75 | 39 | ⊕⊝⊝⊝ | ||
| 0 per 1000 | 0 per 1000 | |||||
| Re‐consultations | Study population | RR 1.13 | 53 | ⊕⊝⊝⊝ | ||
| 815 per 1000 | 921 per 1000 | |||||
| Delayed antibiotic prescriptions | Study population | RR 1.32 | 53 | ⊕⊝⊝⊝ | ||
| 407 per 1000 | 538 per 1000 | |||||
| *The risk in the intervention group (and its 95% CI) is based on the assumed risk in the comparison group and the relative effect of the intervention (and its 95% CI). ** Hay 2009 assessed fever‐associated discomfort using a validated comfort scale (no comfort; not quite normal; some pain/distress; crying/very distressed), whereas Little 2013 assessed ear pain using a validated symptom score (ranging from 0 to 6 with 0 = no problem and 6 = as bad as it could be). CI: Confidence interval; NNTB: number needed to treat to benefit; RR: Risk ratio; RCT: randomised controlled trial; | ||||||
| GRADE Working Group grades of evidence | ||||||
| ¹ We downgraded the evidence high to very low quality due to study limitations and imprecise effect estimate (very small sample size). ² We downgraded the evidence from high to low quality due to study limitations and questions about the applicability of evidence. ³ We downgraded the evidence from high to very low quality due to study limitations and imprecise effect estimate (small sample size and infrequent occurrence of the outcome). | ||||||
Background
Description of the condition
AOM is one of the most common childhood infectious diseases, with an estimated incidence of approximately 300 physician‐diagnosed AOM episodes per 1000 person‐years in children aged up to two years (Liese 2014). By three years of age, over 80% of all children have experienced at least one AOM episode (Teele 1989). Moreover, AOM is an important cause of antibiotic prescriptions in children (Ashworth 2005; Grijalva 2009). Although severe complications of AOM, such as acute mastoiditis, meningitis and intracranial abscess, are rare in high‐income countries, AOM significantly impairs quality of life for children and their parents and carers. AOM is associated with substantial healthcare resource use and lost work days for parents and carers (Greenberg 2003).
AOM is defined by the presence of middle ear effusion together with acute onset of signs and symptoms of middle ear inflammation (Bluestone 2007; Lieberthal 2013). Cardinal signs of AOM are bulging of the eardrum or new onset of ear discharge not due to acute otitis externa; typical AOM symptoms include ear pain and general symptoms of illness such as fever, irritability and problems feeding and sleeping (Lieberthal 2013). Ear pain due to infection of the middle ear and pressure behind the eardrum is a major symptom of AOM (Lieberthal 2013). Pain is central to children's and parents' experience of the illness (Barber 2014; Schechter 2003). Antibiotics provide only marginal benefits (Rovers 2006; Venekamp 2015), and analgesic treatment, including paracetamol (acetaminophen) and NSAIDs, is regarded as the cornerstone of AOM management in children (Lieberthal 2013).
Description of the intervention
The exact mechanism of paracetamol action is not fully understood, but has been assumed to act as a selective inhibitor of COX‐1 and COX‐2 in the central nervous system (Bruno 2014). Unlike NSAIDs, paracetamol does not prevent prostaglandin synthesis by competitive binding to the COX enzyme, but modulates the COX pathway through its ability to reduce COX activity (Bruno 2014). Although paracetamol might have some peripheral effects, its main action appears to be located centrally by inhibiting prostaglandin synthesis in the brain (Marzuillo 2014). Due to its minor peripheral effects, paracetamol lacks significant anti‐inflammatory activity (van den Anker 2013). When administered as an oral suspension, the peak plasma concentration of paracetamol is reached in around 30 minutes; for oral tablets and suppositories this is approximately 30 to 45 minutes and two to four hours respectively (Marzuillo 2014). The recommended dose of paracetamol for children is 10 to 15 mg/kg per dose, every four to six hours orally (van den Anker 2013).
In contrast to paracetamol, NSAIDs have both central and peripheral effects and can be divided in traditional and selective COX‐2 inhibitors (Bruno 2014). COX‐2 inhibition leads to reduced release of pyrogenic molecules in the inflamed cells (mainly prostaglandin E2) causing the anti‐inflammatory and analgesic effects of NSAIDs (Bruno 2014; Rainsford 2009), while COX‐1 inhibition is mainly responsible for gastrointestinal adverse effects (Bruno 2014). Gastrointestinal adverse effects such as peptic ulcers or bleeding are caused by a dual effect of NSAIDs on the gastrointestinal tract; the prostaglandin biosynthesis and maintenance of gastric mucosal integrity (Bruno 2014). Ibuprofen, a non‐selective COX inhibitor, is the most commonly used NSAID in children, with a recommended dose of 5 to 10 mg/kg per dose every six to eight hours orally, to a maximum dose of 500 mg per day (van den Anker 2013). The relatively low incidence of serious gastrointestinal adverse effects associated with ibuprofen, as compared with other NSAIDs, is thought to be the result of its relatively short half‐life (Rainsford 2009). However, ibuprofen, like other NSAIDs, is associated with rare but serious adverse drug reactions of the skin (Stevens‐Johnson syndrome), renal (papillary necrosis) and cardiovascular systems (Rainsford 2009). Furthermore, ibuprofen has been associated with an increased risk of inducing bronchospasm in children with asthma (Rainsford 2009). However, a recent study found no association between paracetamol or ibuprofen and early childhood asthma when adjusted for potential confounding (Sordillo 2015). Compared with paracetamol, ibuprofen has a longer duration of action, and as such, has the advantage of less frequent dosing (every 6 to 8 hours versus every 4 hours for paracetamol) (van den Anker 2013).
How the intervention might work
Because pain is a major symptom of AOM in children, current guidance explicitly recommends analgesic treatment, irrespective of antibiotics use (Lieberthal 2013). In daily practice, paracetamol and NSAIDs (ibuprofen) are widely used for relieving pain and fever in children. Paracetamol is generally considered to be well tolerated and safe with only few adverse effects, such as rash and other allergic reactions, when used at therapeutic dosages (Marzuillo 2014; Southey 2009). However, paracetamol has the potential for hepatotoxicity following overdose (Marzuillo 2014). In general, the safety profile of ibuprofen is considered to be comparable with paracetamol when both drugs are used at the recommended doses and in the absence of specific contraindications (children with gastrointestinal bleeding or ulcers, congenital heart disease, severe kidney and liver disease, concurrent use of anticoagulant and steroid drugs, and in children aged less than six months) (Southey 2009; van den Anker 2013).
Why it is important to do this review
Whilst the effectiveness of analgesic eardrops in children with AOM has been reviewed (Foxlee 2006), this has not been done for paracetamol or NSAIDs, alone or combined. Previous Cochrane reviews on paracetamol or NSAIDs (or both) focused either on children with fever due to infectious diseases (Meremikwu 2005; Wong 2013), or included both children and adults with the common cold (Kim 2013). As such, these reviews did not include RCTs on paracetamol or NSAIDs (or both) for relieving symptoms in childhood AOM. Since AOM is a specific clinical entity with a high incidence and substantial societal impact, a comprehensive literature search and systematic review was warranted to assess 1) the effectiveness of paracetamol or NSAIDs, alone or combined, compared with placebo or no treatment in relieving pain in children with AOM and 2) whether the effects of NSAIDs and paracetamol in terms of relieving pain differ in children with AOM.
Objectives
Our primary objective was to assess the effectiveness of paracetamol (acetaminophen) or NSAIDs, alone or combined, compared with placebo or no treatment in relieving pain in children with AOM. Our secondary objective was to assess the effectiveness of NSAIDs as compared with paracetamol in children with AOM.
Methods
Criteria for considering studies for this review
Types of studies
RCTs assessing the effectiveness of paracetamol or NSAIDs, alone or combined, in relieving pain in children with AOM.
We also included trials of paracetamol or NSAIDs, alone or combined, for children with fever or URTIs if we could extract subgroup data on pain relief (including discomfort, distress and/or irritability) in children with AOM either directly or upon request by the original trial authors.
We intended to include trials reporting concurrent therapy (e.g. co‐treatment with oral or topical antibiotics) if we could make direct comparison between the intervention and control group (e.g. paracetamol with concurrent antibiotic therapy versus placebo with concurrent antibiotic therapy) and if participants in each arm were not treated differently. We defined 'not treated differently' as a maximum of 10% difference in the proportion of children who received the concurrent therapy in the intervention and control groups.
Types of participants
We included children aged from six months to 16 years with AOM irrespective of the diagnostic criteria used. We excluded studies on children with grommets (ventilation tubes or tympanostomy tubes) in place and those in which children were hospitalised. (See Differences between protocol and review).
Types of interventions
We included trials of paracetamol and NSAIDs administered orally or rectally. We excluded trials of paracetamol or NSAIDS administered parenterally (intravenous administration).
Types of outcome measures
We analysed primary and secondary outcomes, but they were not used as a basis for including or excluding studies.
Primary outcomes
-
Proportion of children with pain (yes/no) as rated by parents or carers or children themselves at various time points (24 hours, 48 to 72 hours, 4 to 7 days);
-
Adverse events likely to be related to the use of paracetamol or NSAIDs (or both), such as kidney failure or dysfunction, liver failure or dysfunction, gastrointestinal complaints or bleeding, and hypersensitivity reactions such as erythema, urticaria (hives, skin itching) or anaphylactic shock.
Secondary outcomes
-
Proportion of children with at most mild pain (defined as pain less than or equal to 3/10 on a 0 to 10 numerical pain rating scale or less than or equal to 30 mm on a 0 to 100 mm visual analogue scale) as rated by parents, carers or patients at various time points (24 hours, 48 to 72 hours, 4 to 7 days);
-
Mean time to resolution of pain;
-
Mean pain score at various time points (24 hours; 48 to 72 hours; 4 to 7 days) using validated pain scores;
-
Disease‐specific quality of life as measured by a validated instrument (e.g. AOM Severity of Symptoms Scale (SOS) survey, OM‐6 questionnaire);
-
Mean time to resolution of fever;
-
Proportion of children with fever at various time points (24 hours; 48 to 72 hours; 4 to 7 days);
-
Proportion of children with re‐consultations at various time points;
-
Proportion of children with (delayed) antibiotic prescriptions at various time points;
-
Total days lost from nursery or school for children because of AOM;
-
Total days lost from work or education for parents and carers because of their child's AOM; and
-
Serious complications related to AOM such as acute mastoiditis and meningitis.
Search methods for identification of studies
The Cochrane Acute Respiratory Infections (ARI) Information Specialist conducted systematic searches for RCTs and controlled clinical trials. There were no language, publication year or publication status restrictions. We searched up to 19 August 2016.
Electronic searches
We searched the Cochrane Central Register of Controlled Trials (CENTRAL), Issue 7, July 2016, which contains the Acute Respiratory Infections Group’s Specialised Register (Appendix 1), MEDLINE (1946 to August 2016) (Appendix 2), Embase (1947 to August 2016) (Appendix 3), CINAHL (1981 to August 2016) (Appendix 4), LILACS (1982 to August 2016) (Appendix 5) and Web of Science (1955 to August 2016) (Appendix 6). We used the Cochrane Highly Sensitive Search Strategy for identifying randomised trials in MEDLINE: sensitivity‐ and precision‐maximising version (2008 revision); Ovid format and adapted the search strategy for Embase, CINAHL, LILACS and Web of Science searches.
Searching other resources
We searched the World Health Organization (WHO) International Clinical Trials Registry Platform (ICTRP), ClinicalTrials.gov, and the Netherlands Trial Registry (NTR) for completed and ongoing trials. We scanned the reference lists of identified publications for additional trials and contacted trial authors if necessary. We also searched MEDLINE, TRIP database and the Cochrane Library to retrieve any published systematic reviews relevant to this review and scanned their citations for additional trials. Furthermore, we searched the extended abstracts published in the Proceedings from the International Symposia on Recent Advances in Otitis Media (grey literature) for any additional trials.
Data collection and analysis
Selection of studies
Two review authors (AS, RPV) independently screened titles and abstracts and scanned citations of potentially relevant reviews retrieved from database searches. The same review authors independently reviewed the full text of potentially relevant studies for inclusion. We resolved any disagreements by discussion. See Figure 1.

Study flow diagram
Data extraction and management
Two review authors (AS, RPV) independently extracted data from the included studies using standardised data extraction forms. We extracted the following information from each trial:
-
Study characteristics: setting, design, method of data‐analysis.
-
Participants: study population, number of participants in each group, patient characteristics including age, gender, ethnicity.
-
Interventions: type of intervention used including timing and dosage and route of administration.
-
Outcomes: primary and secondary outcomes recorded, time points.
We resolved any disagreements by discussion.
Assessment of risk of bias in included studies
Two review authors (AS, RPV) independently assessed the methodological quality of the included trials. We resolved any disagreements by discussion. We assessed risk of bias using the 'Risk of bias' tool as described in Chapter 8 of theCochrane Handbook for Systematic Reviews of Interventions (Higgins 2011). We judged the following domains as high, low or unclear risk of bias:
-
sequence generation (selection bias).
-
Allocation concealment (selection bias).
-
Blinding of participants and personnel (performance bias).
-
Blinding of outcome assessment (detection bias).
-
Incomplete outcome data (attrition bias).
-
Selective outcome reporting (reporting bias).
-
Other sources of bias.
The results of the 'Risk of bias' assessment are presented in Figure 2 and Figure 3.
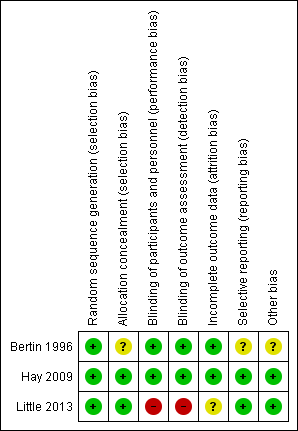
Risk of bias summary: review authors' judgements about each risk of bias item for each included study
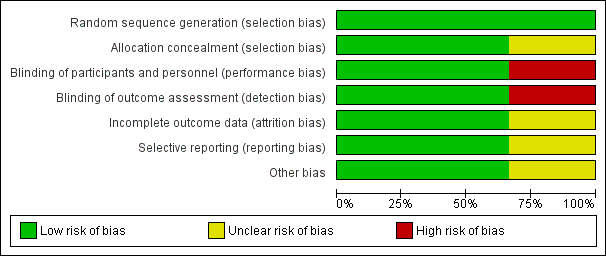
Risk of bias graph: review authors' judgements about each risk of bias item presented as percentages across all included studies
Measures of treatment effect
We expressed dichotomous outcomes as risk ratios (RRs) with accompanying 95% confidence intervals (CIs) and calculated the number needed to treat to benefit (NNTB). We expressed continuous outcome variables either as mean differences (MDs) if reported on the same scale or standardised mean differences (SMD) if different continuous scales were used, with accompanying 95% CIs.
Unit of analysis issues
We did not identify any studies with non‐standard designs, such as cross‐over trials or cluster‐randomised trials.
Dealing with missing data
In cases of missing data, we contacted corresponding authors of the included trials to provide additional information. In primary analyses, we analysed available data according to the intention‐to‐treat (ITT) principle, that is, we analysed all participants in the group to which they were originally allocated. For dichotomous outcomes, we proposed to assess the impact of incomplete data reporting by performing scenario analyses (best and worst‐case scenarios). For mean ear pain score at various time points, we proposed to assess the impact of missing outcome data by using the baseline observation carried forward approach (Moore 2012).
Assessment of heterogeneity
We considered both clinical and statistical heterogeneity. We assessed the level of clinical diversity among trials by reviewing included studies for potential differences in study populations, interventions, and outcomes measured. We assessed statistical heterogeneity for each outcome by visual inspection of forest plots and using the Chi² test, with a significance level set at P < 0.10, and the I² statistic (Higgins 2003); I² values of 50% or more suggest substantial heterogeneity (Higgins 2011).
Where there was substantial statistical heterogeneity, we proposed to carry out pre‐specified subgroup analyses and sensitivity analyses based on the risk of bias (see Subgroup analysis and investigation of heterogeneity; Sensitivity analysis). If none of these analyses completely resolved statistical heterogeneity, we employed a random‐effects (Der Simonian and Laird) model to provide a more conservative effect estimate.
Assessment of reporting biases
We searched the Internet and ClinicalTrials.gov (http://clinicaltrials.gov/) for relevant study protocols to determine if all outcomes listed in study protocols had been published and if all outcomes reported were pre‐defined. We intended to assess reporting biases by using funnel plots if there were sufficient included trials.
Data synthesis
We primarily performed available case analyses, so using data for every participant for whom the outcome was obtained, according to the ITT principle.
For both primary and secondary dichotomous outcomes measured at various time points, we primarily performed a meta‐analysis using a wide window of one to seven days. In secondary analyses, we used the specific time point reported in most studies. We performed statistical analyses using Review Manager software (RevMan 2014)
For the comparison of NSAIDs plus background therapy (paracetamol) versus background therapy only, we performed a meta‐analysis of studies comparing NSAIDs plus background therapy versus background therapy only.
For dichotomous data, we calculated RR with 95% CIs using the Mantel‐Haenszel method with a fixed‐effect model if appropriate or the random‐effects (Der Simonian and Laird) model where unexplained heterogeneity was found (see Assessment of heterogeneity). We also calculated the NNTB or number needed to harm (NNTH) based on the average risks of the control groups in the included studies (study population) (Higgins 2011).
GRADE and 'Summary of findings' tables
We used the GRADE (Atkins 2004) approach to rate the overall quality of evidence for any of the outcomes of interest reported in the included trials, and drew conclusions about the quality of evidence. There are four possible ratings: high, moderate, low and very low. The GRADE approach rates evidence from RCTs which do not have serious limitations as high quality. However, several factors can lead to the downgrading of the evidence. The degree of downgrading is determined by the seriousness of the these factors: study limitations, consistency of effect, imprecision, indirectness and publication bias to assess the quality of a body of evidence as it relates to the studies which contribute data to the meta‐analyses for the prespecified outcomes. We used methods and recommendations described in Section 8.5 and Chapter 12 of the Cochrane Handbook for Systematic Reviews of Interventions (Higgins 2011) used GRADEproGDT software (GRADEproGDT 2015). We justified all decisions to downgrade the quality of studies using footnotes, and we made comments to aid the reader's understanding of the review where necessary.
We provided summary of findings tables for the main comparisons of interest paracetamol versus placebo, NSAIDs versus placebo and NSAIDs versus paracetamol including what we felt the seven most important outcomes:
-
Proportion of children with pain (yes/no) at various time points (24 hours, 48 to 72 hours, 4 to 7 days);
-
Adverse events;
-
Mean time to resolution of pain;
-
Mean pain score at various time points (24 hours; 48 to 72 hours; 4 to 7 days) using validated pain scores;
-
Proportion of children with fever at various time points (24 hours; 48 to 72 hours; 4 to 7 days);
-
Proportion of children with re‐consultations at various time points; and
-
Proportion of children with (delayed) antibiotic prescriptions at various time points;
Subgroup analysis and investigation of heterogeneity
We planned to perform subgroup analysis for the following categories if sufficient data were available:
-
Age (up to 2 years versus 2 years and above).
-
Route of administration of analgesics (oral versus rectal).
-
Concurrent therapy (concurrent antibiotic therapy versus no concurrent antibiotic therapy); and
-
Definition of AOM (AOM diagnosis based solely on symptoms versus AOM diagnosis based on symptoms and bulging of the eardrum or new onset of ear discharge not due to acute otitis externa).
Sensitivity analysis
To assess the robustness of review findings, we intended to perform a sensitivity analysis in which trials with high risk of bias were excluded. High risk of bias was defined as high risk of concealment of allocation bias or attrition bias.
For dichotomous outcomes, we intended to assess the impact of incomplete data reporting by performing scenario analyses (best and worst‐case scenarios) and for mean ear pain score at various time points using the baseline observation carried forward approach in case of incomplete outcome reporting (see Dealing with missing data).
Results
Description of studies
See: Characteristics of included studies; Characteristics of excluded studies; Characteristics of studies awaiting classification; Characteristics of ongoing studies.
Results of the search
We retrieved a total of 1869 records from our electronic database searches. Following removal of duplicates we assessed 1573 unique articles. After screening titles and abstracts, we identified 24 potentially eligible articles. After reviewing full text reports, we excluded 22 articles: three were non‐randomised studies (Campos 1992; Schuetz 2014; Siegel 2003), five included only adults (Azuma 2010; Eccles 2006; Motoichi 1997; Nouri 1984; Ryan 1987), two did not include children with AOM (Caretti 1986; Gonzales 1989), one included hospitalised children (Polidori 1993) and 11 did not include relevant interventions and comparators (Cappella 1993; Dasgupta 2002; Fort 2000; Kim CK 2013; Metta 2000; Milvio 1984; Passali 2001; Siquet 1983; Stipon 1983; Weippl 1985; Yoon 2008). (See also: Excluded studies). We therefore included two studies from our electronic database searches in this review (Bertin 1996; Little 2013) (Figure 1). Little 2013 did not report subgroup data for children with AOM in the trial publication; data were provided by the first author of this trial (Paul Little).
After reviewing the reference lists of relevant systematic reviews, we identified three additional potentially relevant articles (Hay 2009; McIntyre 1996; Sarrell 2006). We excluded one study because it included hospitalised children (McIntyre 1996). Since neither Hay 2009 nor Sarrell 2006 reported subgroup data for children with AOM, we contacted the lead trial authors. We did not succeed in obtaining additional data in relation to Sarrell 2006, but relevant data were provided by the first author (Alastair Hay) for Hay 2009. Adding this one to the two studies retrieved from our electronic database searches led to a total of three included studies (Bertin 1996; Hay 2009; Little 2013) (Figure 1).
We did neither identify additional relevant trials nor any completed studies after reviewing trials registries WHO ICTRP, ClinicalTrials.gov, and the NTR for completed and ongoing trials (search date 19 August 2016), but we did find one ongoing trial (PIM‐POM study 2014; see Characteristics of ongoing studies).
Included studies
We included three studies that presented data for a total of 327 children with AOM (Bertin 1996; Hay 2009; Little 2013). Methods, participants, interventions and outcomes of the included studies are described in Characteristics of included studies.
Design
Two trials applied three arm, parallel group, double‐blind design (Bertin 1996; Hay 2009); one was a 3 x 2 x 2 factorial, open‐label, design (Little 2013).
Participants and settings
In Bertin 1996, all 219 children aged from one year to seven years were diagnosed with AOM. Hay 2009 included 156 febrile children aged from six months to six years of whom 26 were diagnosed with AOM; Little 2013 included 889 children aged three years and over with respiratory tract infections of whom 82 had AOM. We therefore included data from 327 children.
AOM diagnosis was based on the aspect of the eardrum in Bertin 1996, whereas AOM was diagnosed either by the general practitioner (GP) or research nurse without further specification of diagnostic criteria in Hay 2009 and Little 2013.
Little 2013 was performed in a primary care setting; Hay 2009 in the community, primary and secondary care settings; the setting was unclear in Bertin 1996 (all children were seen as outpatients in 4 centres without further specification).
Interventions and comparators
Bertin 1996 compared paracetamol (10 mg/kg 3 times daily) versus NSAIDs (ibuprofen 10 mg/kg 3 times daily) versus placebo. Hay 2009, a three arm, parallel group trial compared paracetamol (15 mg/kg orally, maximum of 4 doses in 24 hours) versus NSAIDs (ibuprofen 10 mg/kg, maximum of 3 doses in 24 hours) versus NSAID plus paracetamol. Little 2013 applied a 3 x 2 x 2 factorial design and compared paracetamol versus NSAIDs (ibuprofen) versus NSAIDs (ibuprofen) plus paracetamol. Children in Little 2013 were randomised to both one of the three treatment groups but also to one of two dosing regimens (regularly or as required) and one of two steam inhalation therapy groups (steam versus no steam). Doses of paracetamol and ibuprofen used in this trial were the maximum recommended by the British National Formulary (which varies by age) (https://www.bnf.org/products/bnf‐online/).
Bertin 1996 prescribed concurrent antibiotic therapy (cefaclor 15 mg to 30 mg/kg twice daily for 7 days). Furthermore, children with fever > 39° C could be given paracetamol (30 mg to 60 mg) in addition to the studied treatments in Bertin 1996.
Outcomes
Relevant data derived from at least one trial could be extracted for all outcomes, except for the secondary outcomes days lost from nursery or school for children because of AOM and days lost from work or education for parents and carers because of their child's AOM.
In Bertin 1996 ear pain was reported as a dichotomous outcome (yes versus no). Hay 2009 assessed fever‐associated discomfort using a validated comfort scale (no comfort; not quite normal; some pain/distress; crying/very distressed), whereas Little 2013 assessed ear pain using a validated symptom score (ranging from 0 to 6 with 0 = no problem and 6 = as bad as it could be).
Funding sources
In Bertin 1996, study medications were supplied by a pharmaceutical company (Ethypharm); no further details were provided about the role of this company in the design, conduct, analysis, or reporting of the trial. The other two trials (Hay 2009; Little 2013) were funded by governmental (non‐commercial) grants. In Hay 2009, study medications were purchased from and provided by two companies (Pfizer and DHP Investigational Medicinal Products); these companies had no role in the design, conduct, analysis, or reporting of the trial.
Excluded studies
We excluded 24 studies:
-
three were non‐randomised studies (Campos 1992; Schuetz 2014; Siegel 2003);
-
five included only adults (Azuma 2010; Eccles 2006; Motoichi 1997; Nouri 1984; Ryan 1987);
-
two did not include children with AOM (Caretti 1986; Gonzales 1989);
-
two included hospitalised children (McIntyre 1996; Polidori 1993);
-
11 did not include relevant interventions and comparators (Cappella 1993; Dasgupta 2002; Fort 2000; Kim CK 2013; Metta 2000; Milvio 1984; Passali 2001; Siquet 1983; Stipon 1983; Weippl 1985; Yoon 2008);
-
one did not report crude subgroup data of children with AOM and we were unsuccessful in obtaining additional data from the authors (Sarrell 2006).
Risk of bias in included studies
The methodological quality of the included studies was generally high. Details of the risk of bias assessment of the included trials are summarised in Figure 2 and Figure 3.
Allocation
Random sequence generation was judged adequate in all three trials. Concealment of allocation was adequately described in Hay 2009 and Little 2013, but was unclear in Bertin 1996.
Blinding
The risk of bias for blinding of participants, personnel and outcome assessors (performance and detection bias) was low in Bertin 1996 and Hay 2009 and high in Little 2013.
Incomplete outcome data
Risk of attrition bias was low in Bertin 1996 and Hay 2009 and unclear in Little 2013.
Selective reporting
Risk of reporting bias was low in Hay 2009 and Little 2013. We could not retrieve the trial protocol for Bertin 1996 and were unable determine the risk of selective outcome reporting bias.
Other potential sources of bias
Risk of other potential sources of bias was low in Hay 2009 and Little 2013 and unclear in Bertin 1996.
Effects of interventions
See: Summary of findings for the main comparison Paracetamol versus placebo for acute otitis media in children; Summary of findings 2 NSAIDs versus placebo for acute otitis media in children; Summary of findings 3 NSAIDs versus paracetamol for acute otitis media in children
Paracetamol versus placebo
Primary outcomes
1. Proportion of children with pain at 48 hours
We included data from one trial for this outcome (148 randomised children, 148 (100%) included in analysis) (Bertin 1996). At 48 hours, fewer children in the paracetamol group had pain than those allocated to placebo (10% versus 25%, RR 0.38, 95% CI 0.17 to 0.85; NNTB 7) (Analysis 1.1; Figure 4).
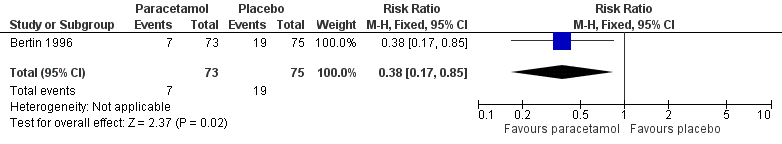
Forest plot of comparison: 1 Paracetamol versus placebo, outcome: 1.1 Pain at 48 hours
Quality of evidence
The evidence for this outcome was low quality; we downgraded it from high to low quality due to study limitations and questions about the applicability of evidence. All children received concurrent antibiotic therapy, and those with fever > 39 °C could be given paracetamol (30 mg to 60 mg) in addition to the studied treatments. This may have substantially influenced trial findings.
2. Adverse events likely to be related to the use of paracetamol
We included data from one trial for this outcome (148 randomised children, 148 (100%) included in analysis) (Bertin 1996). Adverse events were reported infrequently and did not significantly differ between children treated with paracetamol and those allocated to placebo (4% versus 4%, RR 1.03, 95% CI 0.21 to 4.93) (Analysis 1.2).
Quality of evidence
The evidence for this outcome was very low quality; we downgraded it from high to low quality due to study limitations and imprecise effect estimate (small sample size and infrequent occurrence of the outcome).
Secondary outcomes
6. Proportion of children with fever at 48 hours
We included data from one trial for this outcome (148 randomised children, 148 (100%) included in analysis) (Bertin 1996). At 48 hours, the proportion of children with fever did not significantly differ between the paracetamol and placebo groups (1% versus 1%, RR 1.03, 95% CI 0.07 to 16.12) (Analysis 1.3).
Quality of evidence
The evidence for this outcome was very low quality; we downgraded it from high to very low quality due to study limitations, imprecise effect estimate (infrequent occurrence of the outcome) and questions about the applicability of evidence. All children received concurrent antibiotic therapy and those with fever > 39 °C could be given paracetamol (30 mg to 60 mg) in addition to the studied treatments. This may have substantially influenced trial findings.
Other pre‐specified secondary outcomes
None of the other pre‐specified secondary outcomes were reported for the comparison paracetamol versus placebo.
NSAIDs (ibuprofen) versus placebo
Primary outcomes
1. Proportion of children with pain at 48 hours
We included data from one trial for this outcome (146 randomised children, 146 (100%) included in analysis) (Bertin 1996). At 48 hours, fewer children in the ibuprofen group had pain than those allocated to placebo (7% versus 25%, RR 0.28, 95% CI 0.11 to 0.70; NNTB 6) (Analysis 2.1; Figure 5).
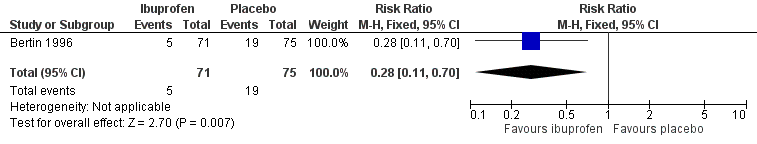
Forest plot of comparison: 2 NSAIDs versus placebo, outcome: 2.1 Pain at 48 hours
Quality of evidence
The evidence for this outcome was low quality; we downgraded it from high to low quality due to study limitations and questions about the applicability of evidence. All children received concurrent antibiotic therapy and those with fever > 39 °C could be given paracetamol (30 mg to 60 mg) in addition to the studied treatments. This may have substantially influenced trial findings.
2. Adverse events likely to be related to the use of NSAIDs (ibuprofen)
We included data from one trial for this outcome (146 randomised children, 146 (100%) included in analysis) (Bertin 1996). Adverse events were reported infrequently and did not significantly differ between children treated with ibuprofen and those allocated to placebo (7% versus 4%, RR 1.76, 95% CI 0.44 to 7.10) (Analysis 2.2).
Quality of evidence
The evidence for this outcome was very low quality; we downgraded it from high to very low quality due to study limitations and imprecise effect estimate (small sample size and infrequent occurrence of the outcome).
Secondary outcomes
6. Proportion of children with fever at 48 hours
We included data from one trial for this outcome (146 randomised children, 146 (100%) included in analysis) (Bertin 1996). At 48 hours, the proportion of children with fever did not significantly differ between the ibuprofen and placebo groups (1% versus 1%, RR 1.06, 95% CI 0.07 to 16.57) (Analysis 2.3).
Quality of evidence
The evidence for this outcome was very low quality; we downgraded it from high to very low quality due to study limitations, imprecise effect estimate (infrequent occurrence of the outcome) and questions about the applicability of evidence. All children received concurrent antibiotic therapy and those with fever > 39 °C could be given paracetamol (30 mg to 60 mg) in addition to the studied treatments. This may have substantially influenced trial findings.
Other pre‐specified secondary outcomes
None of the other pre‐specified secondary outcomes were reported for the comparison NSAIDs (ibuprofen) versus placebo.
NSAIDs (ibuprofen) versus paracetamol
Primary outcomes
1. Proportion of children with pain at various time points
24 hours
We pooled data from two trials for this outcome (71 randomised children, 39 (55%) included in analysis) (Hay 2009; Little 2013). At 24 hours, the proportion of children with pain did not significantly differ between those treated with ibuprofen and paracetamol (57% versus 78%, RR 0.83, 95% CI 0.59 to 1.18, I² statistic = 0%, fixed‐effect model) (Analysis 3.1). Subgroup and sensitivity analyses were deemed not to be useful because of the low number of trials and included children.
Quality of evidence
The evidence for this outcome was very low quality; we downgraded it from high to very low quality due to study limitations and imprecise effect estimate (very small sample size).
48 to 72 hours
We pooled data from three trials for this outcome (215 randomised children, 183 (85%) included in analysis) (Bertin 1996; Hay 2009; Little 2013). The proportion of children with pain at 48 to 72 hours did not significantly differ between those treated with ibuprofen and paracetamol (17% versus 18%, RR 0.91, 95% CI 0.54 to 1.54; I² statistic = 0%, fixed‐effect model) (Analysis 3.2; Figure 6). Subgroup and sensitivity analyses were deemed not useful because of the low number of trials.
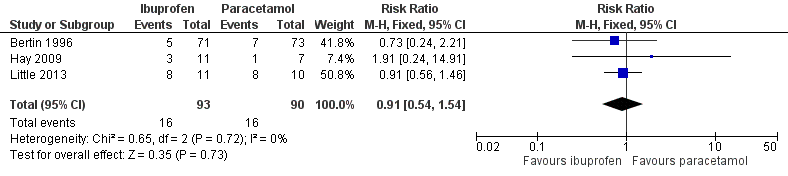
Forest plot of comparison: 3 NSAIDs versus paracetamol, outcome: 3.2 Pain at 48 to 72 hours
Quality of evidence
The evidence for this outcome was low quality; we downgraded it from high to low quality due to study limitations and questions about the applicability of evidence. All children in Bertin 1996 received concurrent antibiotic therapy and those with fever > 39 °C could be given paracetamol (30 mg to 60 mg) in addition to the studied treatments. This may have substantially influenced trial findings.
Four to seven days
We pooled data from two trials for this outcome (71 randomised children, 38 (54%) children included in analysis) (Hay 2009; Little 2013). The proportion of children with pain at four to seven days did not significantly differ between those treated with ibuprofen and paracetamol (14% versus 19%, RR 0.74, 95% CI 0.17 to 3.23; I² statistic = 36%, fixed‐effect model) (Analysis 3.3). Subgroup and sensitivity analyses were deemed not to be useful because of the low number of trials and included children.
Quality of evidence
The evidence for this outcome was very low quality; we downgraded it from high to very low quality due to study limitations and imprecise effect estimate (very small sample size).
2. Adverse events likely to be related to the use of paracetamol or NSAIDs (ibuprofen)
We pooled data from two trials for this outcome (197 randomised children; 197 (100%) included in analysis) (Bertin 1996; Little 2013). Adverse events were reported infrequently and did not significantly differ between children treated with ibuprofen and those treated with paracetamol (5% versus 3%, RR 1.71, 0.43 to 6.90; I² statistic = n/a, random‐effects model) (Analysis 3.4). Subgroup and sensitivity analyses were deemed not to be useful because of the low number of trials.
Quality of evidence
The evidence for this outcome was very low quality; we downgraded it from high to very low quality due to study limitations and imprecise effect estimate (small sample size and infrequent occurrence of the outcome).
Secondary outcomes
1. Proportion of children with at most mild pain at various time points
24 hours
We pooled data from two trials for this outcome (71 randomised children, 39 (55%) included in analysis) (Hay 2009; Little 2013). No significant differences were observed between ibuprofen and paracetamol groups in the proportion of children with mild pain at 24 hours (18% versus 18%, RR 1.08, 95% CI 0.31 to 3.73; I² statistic = 0%, fixed‐effect model) (Analysis 3.5). Subgroup and sensitivity analyses were deemed not to be useful because of the low number of trials and included children.
Quality of evidence
The evidence for this outcome was very low quality; we downgraded it from high to very low quality due to study limitations and imprecise effect estimate (very small sample size).
48 to 72 hours
We pooled data from two trials for this outcome (71 randomised children, 39 (55%) included in analysis) (Hay 2009; Little 2013). No significant differences were observed between ibuprofen and paracetamol groups in the proportion of children with mild pain at 48 to 72 hours (36% versus 29%, RR 1.35, 95% CI 0.62 to 2.91; I² statistic = 0%, fixed‐effect model) (Analysis 3.6). Subgroup and sensitivity analyses were deemed not to be useful because of the low number of trials and included children.
Quality of evidence
The evidence for this outcome was very low quality; we downgraded it from high to very low quality due to study limitations and imprecise effect estimate (very small sample size).
Four to seven days
We pooled data from two trials for this outcome (71 randomised children, 39 (55%) included in analysis) (Hay 2009; Little 2013). No significant differences were observed between ibuprofen and paracetamol groups in the proportion of children with mild pain at four to seven days (23% versus 29%). Data did not enable pooling of trial results; the summary statistic relates only to Little 2013 (RR 0.91, 95% CI 0.37 to 2.23) (Analysis 3.7). Subgroup and sensitivity analyses were deemed not to be useful because of the low number of trials and included children.
Quality of evidence
The evidence for this outcome was very low quality; we downgraded it from high to very low quality due to study limitations and imprecise effect estimate (very small sample size).
2. Mean time to resolution of pain
None of the included trials reported on this pre‐specified secondary outcome.
3. Mean pain score at various time points
24 hours
We pooled data from two trials for this outcome (71 randomised children, 39 (55%) included in analysis) (Hay 2009; Little 2013). No differences were observed in mean pain scores at 24 hours between children treated with ibuprofen and paracetamol (MD 0.10, 95% CI ‐0.47 to 0.67; I² statistic = 0%, fixed‐effect model) (Analysis 3.8). Subgroup and sensitivity analyses were deemed not to be useful because of the low number of trials and included children.
Quality of evidence
The evidence for this outcome was very low quality; we downgraded it from high to very low quality due to study limitations and imprecise effect estimate (very small sample size).
48 to 72 hours
We pooled data from two trials for this outcome (71 randomised children, 39 (55%) included in analysis) (Hay 2009; Little 2013). No differences were observed in mean pain scores at 48 to 72 hours between children treated with ibuprofen and paracetamol (MD 0.19, 95% CI ‐0.27 to 0.65; I² statistic = 0%, fixed‐effect model) (Analysis 3.9). Subgroup and sensitivity analyses were deemed not to be useful because of the low number of trials and included children.
Quality of evidence
The evidence for this outcome was very low quality; we downgraded it from high to very low quality due to study limitations and imprecise effect estimate (very small sample size).
4 to 7 days
We pooled data from two trials for this outcome (71 randomised children, 31 (44%) included in analysis) (Hay 2009; Little 2013). No differences were observed in mean pain scores at four to seven days between children treated with ibuprofen and paracetamol. Data did not enable pooling of trial results; the summary statistic relates only to Little 2013 (MD ‐0.30, 95% CI ‐2.38 to 1.78) (Analysis 3.10). Subgroup and sensitivity analyses were deemed not to be useful because of the low number of trials and included children.
Quality of evidence
The evidence for this outcome was very low quality; we downgraded it from high to very low quality due to study limitations and imprecise effect estimate (very small sample size).
4. Disease‐specific quality of life as measured by a validated instrument
None of the included trials reported on this pre‐specified secondary outcome.
5. Mean time to resolution of fever
None of the included trials reported on this pre‐specified secondary outcome.
6. Proportion of children with fever at various time points
24 hours
We pooled data from two trials for this outcome (71 randomised children, 39 (55%) included in analysis) (Hay 2009; Little 2013). No difference was observed in the proportion of children with fever at 24 hours between those treated with ibuprofen and paracetamol (18% versus 29%, RR 0.69, 95% CI 0.24 to 2.00; I² statistic = 0%, fixed‐effect model) (Analysis 3.11). Subgroup and sensitivity analyses were deemed not to be useful because of the low number of trials and included children.
Quality of evidence
The evidence for this outcome was very low quality; we downgraded it from high to very low quality due to study limitations and imprecise effect estimate (very small sample size).
48 to 72 hours
We pooled data from three trials for this outcome (215 randomised children, 182 (85%) included in analysis) (Bertin 1996; Hay 2009; Little 2013). No difference was observed in the proportion of children with fever at 48 to 72 hours between those treated with ibuprofen and paracetamol (4% versus 3%, RR 1.18, 95% CI 0.31 to 4.44; I² statistic = 0%, fixed‐effect model) (Analysis 3.12). Subgroup and sensitivity analyses were deemed not to be useful because of the low number of trials.
Quality of evidence
The evidence for this outcome was low quality; we downgraded it from high to low quality due to study limitations and questions about the applicability of evidence. All children in Bertin 1996 received concurrent antibiotic therapy and those with fever > 39 °C could be given paracetamol (30 mg to 60 mg) in addition to the studied treatments. This may have substantially influenced trial findings.
4 to 7 days
We pooled data from two trials for this outcome (71 randomised children, 39 (55%) included in analysis) (Hay 2009; Little 2013). No difference was observed in the proportion of children with fever at four to seven days between those treated with ibuprofen and paracetamol (5% versus 0%). Data did not enable pooling of trial results; the summary statistic relates only to Little 2013 (RR 2.75, 95% CI 0.12 to 60.70) (Analysis 3.13). Subgroup and sensitivity analyses were deemed not to be useful because of the low number of trials and included children.
Quality of evidence
The evidence for this outcome was very low quality; we downgraded it from high to very low quality due to study limitations and imprecise effect estimate (very small sample size).
7. Proportion of children with re‐consultations
We included data from one trial for this outcome (53 randomised children, 53 (100%) included in analysis) (Little 2013). No difference was observed in the proportion of children with re‐consultations at day 28 between those treated with ibuprofen and paracetamol (92% versus 81%, RR 1.13, 95% CI 0.92 to 1.40) (Analysis 3.14).
Quality of evidence
The evidence for this outcome was very low quality; we downgraded it from high to very low quality due to study limitations and imprecise effect estimate (very small sample size).
8. Proportion of children with (delayed) antibiotic prescriptions
We included data from one trial for this outcome (53 randomised children, 53 (100%) included in analysis) (Little 2013). No difference was observed in the proportion of children with delayed antibiotics between those treated with ibuprofen and paracetamol (54% versus 41%, RR 1.32, 95% CI 0.74 to 2.35) (Analysis 3.15).
Quality of evidence
The evidence for this outcome was very low quality; we downgraded it from high to very low quality due to study limitations and imprecise effect estimate (very small sample size).
9. Total days lost from nursery or school for children because of AOM
None of the included trials reported on this pre‐specified secondary outcome.
10. Total days lost from work or education for parents and carers because of their child's AOM
None of the included trials reported on this pre‐specified secondary outcome.
11. Serious complications
We pooled data from two trials for this outcome (71 randomised children, 71 (100%) included in analysis) (Hay 2009; Little 2013). No serious complications related to AOM were reported in either of the trials. Subgroup and sensitivity analyses were deemed not to be useful because of the low number of trials and included children.
Quality of evidence
The evidence for this outcome was very low quality; we downgraded it from high to very low quality due to study limitations and imprecise effect estimate (small sample size and infrequent occurrence of the outcome).
NSAIDs (ibuprofen) and paracetamol versus paracetamol
Primary outcomes
1. Proportion of children with pain at various time points
24 hours
We pooled data from two trials for this outcome (71 randomised children, 41 (58%) included in analysis) (Hay 2009; Little 2013). At 24 hours, the proportion of children with pain did not significantly differ between those treated with ibuprofen and paracetamol versus paracetamol alone (79% versus 71%, RR 1.07, 95% CI 0.78 to 1.47, I² statistic = 0%, fixed‐effect model) (Analysis 4.1). Subgroup and sensitivity analyses were deemed not to be useful because of the low number of trials and included children.
Quality of evidence
The evidence for this outcome was very low quality; we downgraded it from high to very low quality due to study limitations and imprecise effect estimate (very small sample size).
48 to 72 hours
We pooled data from two trials for this outcome (71 randomised children, 41 (58%) included in analysis) (Hay 2009; Little 2013). At 48 to 72 hours, the proportion of children with pain did not significantly differ between those treated with ibuprofen and paracetamol versus paracetamol alone (42% versus 53%, RR 0.71, 95% CI 0.42 to 1.20, I² statistic = 0%, fixed‐effect model) (Analysis 4.2). Subgroup and sensitivity analyses were deemed not to be useful because of the low number of trials and included children.
Quality of evidence
The evidence for this outcome was very low quality; we downgraded it from high to very low quality due to study limitations and imprecise effect estimate (very small sample size).
4 to 7 days
We pooled data from two trials for this outcome (71 randomised children, 41 (58%) included in analysis) were combined (Hay 2009; Little 2013). At four to seven days, the proportion of children with pain did not significantly differ between those treated with ibuprofen and paracetamol versus paracetamol alone (33% versus 18%, RR 1.65, 95% CI 0.58 to 4.72, I² statistic = 0%, fixed‐effect model) (Analysis 4.3). Subgroup and sensitivity analyses were deemed not useful because of the low number of trials and included children.
Quality of evidence
The evidence for this outcome was very low quality; we downgraded it from high to very low quality due to study limitations and imprecise effect estimate (very small sample size).
2. Adverse events likely to be related to the use NSAIDs (ibuprofen) and paracetamol or paracetamol alone
We included data from one trial (56 randomised children, 56 (100%) included in analysis) (Little 2013). No adverse events were reported in this trial (Analysis 4.4).
Quality of evidence
The evidence for this outcome was very low quality; we downgraded it from high to low quality due to study limitations and imprecise effect estimate (very small sample size and infrequent occurrence of the outcome).
Secondary outcomes
1. Proportion of children with at most mild pain at various time points
24 hours
We pooled data from two trials for this outcome (71 randomised children, 41 (58%) included in analysis) (Hay 2009; Little 2013). At 24 hours, the proportion of children with at most mild pain did not significantly differ between those treated with ibuprofen and paracetamol versus paracetamol alone (4% versus 18%). Data did not enable pooling of the trial results; the summary statistic relates only to Little 2013 (RR 0.21, 95% CI 0.02 to 1.74) (Analysis 4.5). Subgroup and sensitivity analyses were deemed not to be useful because of the low number of trials and included children.
Quality of evidence
The evidence for this outcome was very low quality; we downgraded it from high to very low quality due to study limitations and imprecise effect estimate (very small sample size).
48 to 72 hours
We pooled data from two trials for this outcome (71 randomised children, 41 (58%) included in analysis) (Hay 2009; Little 2013). At 48 to 72 hours, the proportion of children with at most mild pain did not significantly differ between those treated with ibuprofen and paracetamol versus paracetamol alone (21% versus 29%). Data did not enable pooling of trial results; the summary statistic relates only to Little 2013 (RR 0.63, 95% CI 0.24 to 1.62) (Analysis 4.6). Subgroup and sensitivity analyses were deemed not to be useful because of the low number of trials and included children.
Quality of evidence
The evidence for this outcome was very low quality; we downgraded it from high to very low quality due to study limitations and imprecise effect estimate (very small sample size).
4 to 7 days
We pooled data from two trials for this outcome (71 randomised children, 41 (58%) included in analysis) (Hay 2009; Little 2013). At four to seven days, the proportion of children with at most mild pain did not significantly differ between those treated with ibuprofen and paracetamol versus paracetamol alone (17% versus 29%). Data did not enable pooling of trial results; the summary statistic relates only to Little 2013 (RR 0.50, 95% CI 0.17 to 1.43) (Analysis 4.7). Subgroup and sensitivity analyses were deemed not to be useful because of the low number of trials and included children.
Quality of evidence
The evidence for this outcome was very low quality; we downgraded it from high to very low quality due to study limitations and imprecise effect estimate (very small sample size).
2. Mean time to resolution of pain
None of the included trials reported on this pre‐specified secondary outcome.
3. Mean pain score at various time points
24 hours
We pooled data from two trials for this outcome (71 randomised children, 40 (56%) included in analysis) (Hay 2009; Little 2013). No differences were observed in mean pain scores at 24 hours between children treated with treated with ibuprofen and paracetamol versus paracetamol alone (MD 0.32, 95% CI ‐0.59 to 1.23; I² statistic = 61%, random‐effects model) (Analysis 4.8). Subgroup and sensitivity analyses were deemed not to be useful because of the low number of trials and included children.
Quality of evidence
The evidence for this outcome was very low quality; we downgraded it from high to very low quality due to study limitations and imprecise effect estimate (very small sample size).
48 to 72 hours
We pooled data from two trials for this outcome (71 randomised children, 40 (56%) included in analysis) (Hay 2009; Little 2013). No differences were observed in mean pain scores at 48 to 72 hours between children treated with ibuprofen and paracetamol versus paracetamol alone. Data did not enable pooling of trial results; the summary statistic relates only to Little 2013 (MD 0.60, 95% CI ‐0.77 to 1.97) (Analysis 4.9). Subgroup and sensitivity analyses were deemed not to be useful because of the low number of trials and included children.
Quality of evidence
The evidence for this outcome was very low quality; we downgraded it from high to very low quality due to study limitations and imprecise effect estimate (very small sample size).
4 to 7 days
We pooled data from two trials for this outcome (71 randomised children, 33 (46%) included in analysis) (Hay 2009; Little 2013). No differences were observed in mean pain scores at four to seven days children treated with ibuprofen and paracetamol versus paracetamol alone. Data did not enable pooling of trial results; the summary statistic relates only to Little 2013 (MD 0.70, 95% CI ‐1.01 to 2.41) (Analysis 4.10). Subgroup and sensitivity analyses were deemed not to be useful because of the low number of trials and included children.
Quality of evidence
The evidence for this outcome was very low quality; we downgraded it from high to very low quality due to study limitations and imprecise effect estimate (very small sample size).
4. Disease‐specific quality of life as measured by a validated instrument
None of the included trials reported on this pre‐specified secondary outcome.
5. Mean time to resolution of fever
None of the included trials reported on this pre‐specified secondary outcome.
6. Proportion of children with fever at various time points
24 hours
We pooled data from two trials for this outcome (71 randomised children, 41 (58%) included in analysis) (Hay 2009; Little 2013). No difference was observed in the proportion of children with fever at 24 hours between those treated with ibuprofen and paracetamol versus paracetamol alone (50% versus 29%, RR 1.48, 95% CI 0.73 to 2.99; I² statistic = 0%, fixed‐effect model) (Analysis 4.11). Subgroup and sensitivity analyses were deemed not to be useful because of the low number of trials and included children.
Quality of evidence
The evidence for this outcome was of very low quality; we downgraded it from high to very low quality due to study limitations and imprecise effect estimate (very small sample size).
48 to 72 hours
We pooled data from two trials for this outcome (71 randomised children, 41 (58%) included in analysis) (Hay 2009; Little 2013). No difference was observed in the proportion of children with fever at 48 to 72 hours between those treated with ibuprofen and paracetamol versus paracetamol alone (29% versus 12%, RR 2.13, 95% CI 0.60 to 7.60; I² statistic = 4%, fixed‐effect model) (Analysis 4.12). Subgroup and sensitivity analyses were deemed not to be useful because of the low number of trials.
Quality of evidence
The evidence for this outcome was very low quality; we downgraded it from high to very low quality due to study limitations and imprecise effect estimate (very small sample size).
4 to 7 days
We pooled data from two trials for this outcome (71 randomised children, 41 (58%) included in analysis) (Hay 2009; Little 2013). None of the participants in either group had fever at four to seven days (Analysis 4.13). Subgroup and sensitivity analyses were deemed not to be useful because of the low number of trials and included children.
Quality of evidence
The evidence for this outcome was very low quality; we downgraded it from high to very low quality due to study limitations and imprecise effect estimate (very small sample size).
7. Proportion of children with re‐consultations
We included data from one trial (56 randomised children, 56 (100%) included in analysis) (Little 2013). No difference was observed in the proportion of children with re‐consultations at day 28 between those treated with ibuprofen and paracetamol versus paracetamol alone (66% versus 81%, RR 0.80, 95% CI 0.58 to 1.11) (Analysis 4.14).
Quality of evidence
The evidence for this outcome was very low quality; we downgraded it from high to very low quality due to study limitations and imprecise effect estimate (very small sample size).
8. Proportion of children with (delayed) antibiotic prescriptions
We included data from one trial (56 randomised children, 56 (100%) included in analysis) (Little 2013). No difference was observed in the proportion of children with delayed antibiotics between those treated with ibuprofen and paracetamol versus paracetamol alone (52% versus 41%, RR 1.27, 95% CI 0.71 to 2.26) (Analysis 4.15).
Quality of evidence
The evidence for this outcome was very low quality; we downgraded it from high to very low quality due to study limitations and imprecise effect estimate (very small sample size).
9. Total days lost from nursery or school for children because of AOM
None of the included trials reported on this pre‐specified secondary outcome.
10. Total days lost from work or education for parents and carers because of their child's AOM
None of the included trials reported on this pre‐specified secondary outcome.
11. Serious complications
We pooled data from two trials for this outcome (71 randomised children, 71 (100%) included in analysis) (Hay 2009; Little 2013). No serious complications related to AOM were reported in either of the trials (Analysis 4.16). Subgroup and sensitivity analyses were deemed not to be useful because of the low number of trials and included children.
Quality of evidence
The evidence for this outcome was very low quality; we downgraded it from high to very low quality due to study limitations and imprecise effect estimate (small sample size and infrequent occurrence of the outcome).
Discussion
Summary of main results
Current evidence on the effectiveness of paracetamol or NSAIDs, alone or combined, in relieving pain in children with AOM is limited.
We included three RCTs (327 children) with low to moderate risk of bias. One RCT compared paracetamol versus ibuprofen versus placebo in 219 children with AOM. In this trial, children received concurrent antibiotic therapy and those with fever > 39 °C could have received paracetamol (30 mg to 60 mg) in addition to the studied treatments. Authors of two RCTs comparing paracetamol versus ibuprofen versus paracetamol and ibuprofen in children with fever and patients with respiratory tract infections provided crude subgroup data on children with AOM (26 and 82 children, respectively).
We found low quality evidence, derived from one trial, that both paracetamol and ibuprofen as monotherapies were more effective than placebo in relieving pain at 48 hours (paracetamol versus placebo: proportion of children with pain 10% versus 25%, NNTB 7; ibuprofen versus placebo: proportion of children with pain 7% versus 25%, NNTB 6).
Adverse events did not significantly differ between children treated with either paracetamol, ibuprofen or placebo. However, this finding should be interpreted with caution because it occurred infrequently and limited numbers of participants' data were available for analysis.
We found insufficient evidence of a difference between ibuprofen and paracetamol in relieving short‐term ear pain.
We could not draw any firm conclusions on the effectiveness of ibuprofen plus paracetamol versus paracetamol alone in relieving ear pain in children with AOM mainly because of the very limited participants' data available for analysis.
Overall completeness and applicability of evidence
We included one trial comparing the effectiveness of paracetamol, ibuprofen and placebo in children with AOM as diagnosed by otoscopy (Bertin 1996). All trial participants, however, received co‐treatment with antibiotics (cefaclor 15 to 30 mg/kg twice daily for 7 days) which is no longer routinely recommended for use in the management of children with AOM. Although oral antibiotics have only marginal beneficial effect in relieving ear pain in children with AOM (Venekamp 2015), co‐treatment with antibiotics may potentially have influenced the trial findings.
For the other included trials (Hay 2009; Little 2013), we included subgroup data from children with fever and patients with respiratory tract infections. In these trials, AOM was diagnosed either by the GP or research nurse without further specification of diagnostic criteria applied.
Furthermore, the dosage of paracetamol used in the double‐blind randomised trial comparing paracetamol versus ibuprofen versus placebo was relatively low (10 mg/kg 3 times daily) (Bertin 1996). This may have underestimated the effect of paracetamol in this trial. In the same trial (Bertin 1996), children with fever > 39 °C could be given paracetamol (30 mg to 60 mg) in addition to the studied treatments which may have substantially influenced trial findings. As such, the overall degree of completeness and applicability of evidence is low.
Quality of the evidence
The quality of the evidence for primary outcomes looking at effectiveness in the trial comparing paracetamol versus placebo and ibuprofen versus placebo was low, whereas the quality of evidence for adverse events and secondary effectiveness outcomes was very low.
The quality of the evidence for primary outcomes looking at effectiveness in the trials comparing ibuprofen versus paracetamol varied from low to very low quality, whereas the quality of evidence for adverse events and secondary effectiveness outcomes was mostly very low.
The quality of evidence for all outcomes in the trials comparing ibuprofen plus paracetamol versus paracetamol alone was very low.
Potential biases in the review process
We used a broad search strategy (not only including otitis media but also upper respiratory tract infection as search terms) without language or publication restrictions. For feasibility purposes we did not include fever in our search strategy, but we systematically screened reference lists of all relevant reviews on the effectiveness of paracetamol and/or NSAIDs for children with fever including relevant Cochrane reviews (Meremikwu 2005; Wong 2013). After screening reference lists of these reviews, we found three potentially relevant trials that were not retrieved from our database searches (Hay 2009; Sarrell 2006; McIntyre 1996). We therefore feel confident that our review includes all relevant trials.
We were unable to retrieve AOM subgroup data from one potentially relevant trial (Sarrell 2006). However, it is unlikely these subgroup data would have a major impact on our review findings.
Agreements and disagreements with other studies or reviews
No previous review has been undertaken to assess the effectiveness of paracetamol or NSAIDs, alone or combined, in children with AOM. Previous Cochrane reviews on paracetamol or NSAIDs (or both) focused either on children with fever due to infectious diseases (Meremikwu 2005; Wong 2013), or included both children and adults with the common cold (Kim 2013). For children with fever, the reviews found only few trials comparing paracetamol against placebo (Meremikwu 2005), some evidence that both alternating and combined antipyretic therapy may be more effective at reducing temperatures than monotherapy alone and inconclusive evidence for measures of child discomfort (Wong 2013). For the common cold, the review concluded that "NSAIDs are somewhat effective in relieving discomfort caused by a cold but there is no clear evidence of their effect in easing respiratory symptoms" (Kim 2013).
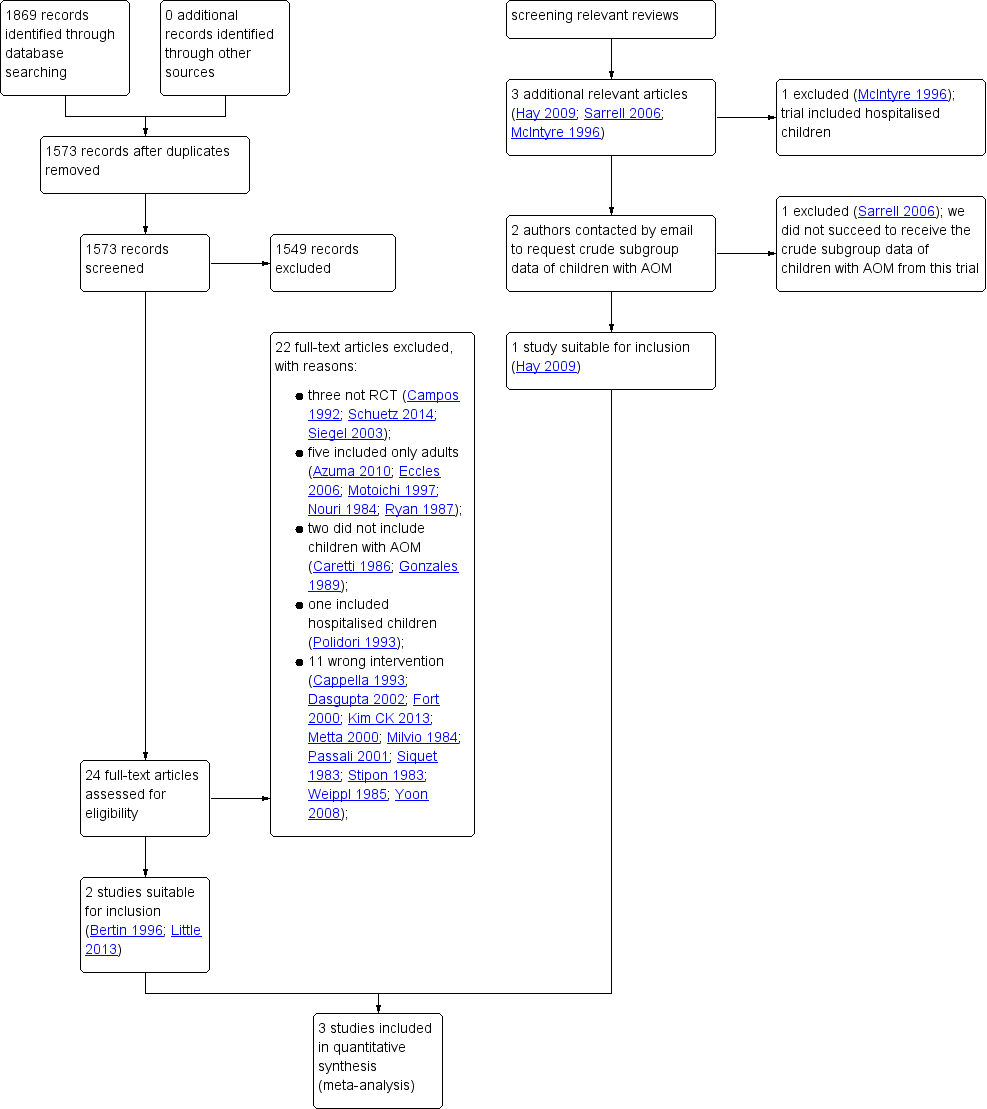
Study flow diagram

Risk of bias summary: review authors' judgements about each risk of bias item for each included study

Risk of bias graph: review authors' judgements about each risk of bias item presented as percentages across all included studies

Forest plot of comparison: 1 Paracetamol versus placebo, outcome: 1.1 Pain at 48 hours

Forest plot of comparison: 2 NSAIDs versus placebo, outcome: 2.1 Pain at 48 hours

Forest plot of comparison: 3 NSAIDs versus paracetamol, outcome: 3.2 Pain at 48 to 72 hours

Comparison 1 Paracetamol versus placebo, Outcome 1 Pain at 48 hours.

Comparison 1 Paracetamol versus placebo, Outcome 2 Adverse events.

Comparison 1 Paracetamol versus placebo, Outcome 3 Fever at 48 hours.

Comparison 2 NSAIDs versus placebo, Outcome 1 Pain at 48 hours.

Comparison 2 NSAIDs versus placebo, Outcome 2 Adverse events.

Comparison 2 NSAIDs versus placebo, Outcome 3 Fever at 48 hours.

Comparison 3 NSAIDs versus paracetamol, Outcome 1 Pain at 24 hours.

Comparison 3 NSAIDs versus paracetamol, Outcome 2 Pain at 48 to 72 hours.

Comparison 3 NSAIDs versus paracetamol, Outcome 3 Pain at 4 to 7 days.

Comparison 3 NSAIDs versus paracetamol, Outcome 4 Adverse events.

Comparison 3 NSAIDs versus paracetamol, Outcome 5 Mild pain at 24 hours.

Comparison 3 NSAIDs versus paracetamol, Outcome 6 Mild pain at 48 to 72 hours.

Comparison 3 NSAIDs versus paracetamol, Outcome 7 Mild pain at 4 to 7 days.

Comparison 3 NSAIDs versus paracetamol, Outcome 8 Mean pain score at 24 hours.

Comparison 3 NSAIDs versus paracetamol, Outcome 9 Mean pain score at 48 to 72 hours.

Comparison 3 NSAIDs versus paracetamol, Outcome 10 Mean pain score at 4 to 7 days.

Comparison 3 NSAIDs versus paracetamol, Outcome 11 Fever at 24 hours.

Comparison 3 NSAIDs versus paracetamol, Outcome 12 Fever at 48 to 72 hours.

Comparison 3 NSAIDs versus paracetamol, Outcome 13 Fever at 4 to 7 days.

Comparison 3 NSAIDs versus paracetamol, Outcome 14 Re‐consultations.

Comparison 3 NSAIDs versus paracetamol, Outcome 15 Delayed antibiotic prescriptions.

Comparison 4 NSAIDs + paracetamol versus paracetamol, Outcome 1 Pain at 24 hours.

Comparison 4 NSAIDs + paracetamol versus paracetamol, Outcome 2 Pain at 48 to 72 hours.

Comparison 4 NSAIDs + paracetamol versus paracetamol, Outcome 3 Pain at 4 to 7 days.

Comparison 4 NSAIDs + paracetamol versus paracetamol, Outcome 4 Adverse events.

Comparison 4 NSAIDs + paracetamol versus paracetamol, Outcome 5 Mild pain at 24 hours.

Comparison 4 NSAIDs + paracetamol versus paracetamol, Outcome 6 Mild pain at 48 to 72 hours.

Comparison 4 NSAIDs + paracetamol versus paracetamol, Outcome 7 Mild pain at 4 to 7 days.

Comparison 4 NSAIDs + paracetamol versus paracetamol, Outcome 8 Mean pain at 24 hours.

Comparison 4 NSAIDs + paracetamol versus paracetamol, Outcome 9 Mean pain at 48 to 72 hours.

Comparison 4 NSAIDs + paracetamol versus paracetamol, Outcome 10 Mean pain at 4 to 7 days.

Comparison 4 NSAIDs + paracetamol versus paracetamol, Outcome 11 Fever at 24 hours.

Comparison 4 NSAIDs + paracetamol versus paracetamol, Outcome 12 Fever at 48 to 72 hours.

Comparison 4 NSAIDs + paracetamol versus paracetamol, Outcome 13 Fever at 4 to 7 days.

Comparison 4 NSAIDs + paracetamol versus paracetamol, Outcome 14 Re‐consultations.

Comparison 4 NSAIDs + paracetamol versus paracetamol, Outcome 15 Delayed antibiotic prescriptions.

Comparison 4 NSAIDs + paracetamol versus paracetamol, Outcome 16 Serious complications.
| Paracetamol versus placebo for acute otitis media in children | ||||||
| Patients: children with acute otitis media | ||||||
| Outcomes | Anticipated absolute effects* (95% CI) | Relative effect | № of participants | Quality of the evidence | Comments | |
| Risk with placebo | Risk with paracetamol | |||||
| Pain at various time points | ||||||
| 24 hours | no data available | n/a | n/a | n/a | ||
| 48 to 72 hours (48 hours) | Study population | RR 0.38 | 148 | ⊕⊕⊝⊝ | NNTB based on the study population risk was 1/(253 to 96)*1000 = 7 | |
| 253 per 1000 | 96 per 1000 | |||||
| 4 to 7 days | no data available | |||||
| Adverse events | Study population | RR 1.03 | 148 | ⊕⊝⊝⊝ | ||
| 40 per 1000 | 41 per 1000 | |||||
| Mean time to resolution of pain | no data available | n/a | n/a | n/a | ||
| Mean pain score at various time points | no data available | n/a | n/a | n/a | ||
| Fever at various time points | ||||||
| 24 hours | no data available | n/a | n/a | n/a | ||
| 48 to 72 hours (48 hours) | Study population | RR 1.03 | 148 | ⊕⊝⊝⊝ | ||
| 13 per 1000 | 14 per 1000 | |||||
| 4 to 7 days | no data available | n/a | n/a | n/a | ||
| Re‐consultations | no data available | n/a | n/a | n/a | ||
| Delayed antibiotic prescriptions | no data available | n/a | n/a | n/a | ||
| *The risk in the intervention group (and its 95% CI) is based on the assumed risk in the comparison group and the relative effect of the intervention (and its 95% CI). CI: Confidence interval; NNTB: number needed to treat to benefit; RR: Risk ratio; RCT: randomised controlled trial; | ||||||
| GRADE Working Group grades of evidence | ||||||
| ¹ We downgraded the evidence from high to low quality due to study limitations and questions about the applicability of evidence. ² We downgraded the evidence from high to very low quality due to study limitations and imprecise effect estimate (small sample size and infrequent occurrence of the outcome). ³ We downgraded the evidence from high to very low quality due to study limitations, imprecise effect estimate (infrequent occurrence of the outcome) and questions about the applicability of evidence. | ||||||
| NSAIDs versus placebo for acute otitis media in children | ||||||
| Patients: children with acute otitis media | ||||||
| Outcomes | Anticipated absolute effects* (95% CI) | Relative effect | № of participants | Quality of the evidence | Comments | |
| Risk with placebo | Risk with ibuprofen | |||||
| Pain at various time points | ||||||
| 24 hours | no data available | n/a | n/a | n/a | ||
| 48 to 72 hours (48 hours) | Study population | RR 0.28 | 146 | ⊕⊕⊝⊝ | NNTB based on the study population risk was 1/(253 to 71)*1000 = 6 | |
| 253 per 1000 | 71 per 1000 | |||||
| 4 to 7 days | no data available | n/a | n/a | n/a | ||
| Adverse events | Study population | RR 1.76 | 146 | ⊕⊝⊝⊝ | ||
| 40 per 1000 | 70 per 1000 | |||||
| Mean time to resolution of pain | no data available | n/a | n/a | n/a | ||
| Mean pain score at various time points | no data available | n/a | n/a | n/a | ||
| Fever at various time points | ||||||
| 24 hours | no data available | n/a | n/a | n/a | ||
| 48 to 72 hours (48 hours) | Study population | RR 1.06 | 146 | ⊕⊝⊝⊝ | ||
| 13 per 1000 | 14 per 1000 | |||||
| 4 to 7 days | no data available | n/a | n/a | n/a | ||
| Re‐consultations | no data available | n/a | n/a | n/a | ||
| Delayed antibiotic prescriptions | no data available | n/a | n/a | n/a | ||
| *The risk in the intervention group (and its 95% CI) is based on the assumed risk in the comparison group and the relative effect of the intervention (and its 95% CI). CI: Confidence interval; NNTB: number needed to treat to benefit; RR: Risk ratio; RCT: randomised controlled trial; | ||||||
| GRADE Working Group grades of evidence | ||||||
| ¹ We downgraded the evidence from high to low quality due to study limitations and questions about the applicability of evidence. ² We downgraded the evidence from high to very low quality due to study limitations and imprecise effect estimate (small sample size and infrequent occurrence of the outcome). ³ We downgraded the evidence from high to very low quality due to study limitations, imprecise effect estimate (infrequent occurrence of the outcome) and questions about the applicability of evidence. | ||||||
| NSAIDs versus paracetamol for acute otitis media in children | ||||||
| Patients: children with acute otitis media | ||||||
| Outcomes | Anticipated absolute effects* (95% CI) | Relative effect | № of participants | Quality of the evidence | Comments | |
| Risk with paracetamol | Risk with ibuprofen | |||||
| Pain at various time points | ||||||
| 24 hours | Study population | RR 0.83 | 39 | ⊕⊝⊝⊝ | ||
| 778 per 1000 | 646 per 1000 | |||||
| 48 to 72 hours | Study population | RR 0.91 | 183 | ⊕⊕⊝⊝ | ||
| 178 per 1000 | 162 per 1000 | |||||
| 4 to 7 days | Study population | RR 0.74 | 38 | ⊕⊝⊝⊝ | ||
| 188 per 1000 | 139 per 1000 | |||||
| Adverse events | Study population | RR 1.71 | 197 | ⊕⊝⊝⊝ | ||
| 30 per 1000 | 51 per 1000 | |||||
| Mean time to resolution of pain | no data available | n/a | n/a | n/a | ||
| Mean pain score at various time points** | ||||||
| 24 hours | The mean pain score with ibuprofen ranged from 2.5 to 3.9 | The mean pain score with paracetamol was on average 0.10 lower (0.67 lower to 0.47 higher) | n/a | 39 (2 RCTs) | ⊕⊝⊝⊝ | |
| 48 to 72 hours | The mean pain score with ibuprofen ranged from 1.6 to 2.4 | The mean pain score with paracetamol was on average 0.19 lower (0.65 lower to 0.27 higher) | n/a | 39 (2 RCTs) | ⊕⊝⊝⊝ | |
| 4 to 7 days | The mean pain score with ibuprofen ranged from 1 to 2.2 | The mean pain score with paracetamol was on average 0.30 higher (1.78 lower to 2.38 higher) | n/a | 31 (2 RCTs) | ⊕⊝⊝⊝ | |
| Fever at various time points | ||||||
| 24 hours | Study population | RR 0.69 | 39 | ⊕⊝⊝⊝ | ||
| 294 per 1000 | 203 per 1000 | |||||
| 48 to 72 hours | Study population | RR 1.18 | 182 | ⊕⊕⊝⊝ | ||
| 33 per 1000 | 39 per 1000 | |||||
| 4 to 7 days | Study population | RR 2.75 | 39 | ⊕⊝⊝⊝ | ||
| 0 per 1000 | 0 per 1000 | |||||
| Re‐consultations | Study population | RR 1.13 | 53 | ⊕⊝⊝⊝ | ||
| 815 per 1000 | 921 per 1000 | |||||
| Delayed antibiotic prescriptions | Study population | RR 1.32 | 53 | ⊕⊝⊝⊝ | ||
| 407 per 1000 | 538 per 1000 | |||||
| *The risk in the intervention group (and its 95% CI) is based on the assumed risk in the comparison group and the relative effect of the intervention (and its 95% CI). ** Hay 2009 assessed fever‐associated discomfort using a validated comfort scale (no comfort; not quite normal; some pain/distress; crying/very distressed), whereas Little 2013 assessed ear pain using a validated symptom score (ranging from 0 to 6 with 0 = no problem and 6 = as bad as it could be). CI: Confidence interval; NNTB: number needed to treat to benefit; RR: Risk ratio; RCT: randomised controlled trial; | ||||||
| GRADE Working Group grades of evidence | ||||||
| ¹ We downgraded the evidence high to very low quality due to study limitations and imprecise effect estimate (very small sample size). ² We downgraded the evidence from high to low quality due to study limitations and questions about the applicability of evidence. ³ We downgraded the evidence from high to very low quality due to study limitations and imprecise effect estimate (small sample size and infrequent occurrence of the outcome). | ||||||
| Outcome or subgroup title | No. of studies | No. of participants | Statistical method | Effect size |
| 1 Pain at 48 hours Show forest plot | 1 | 148 | Risk Ratio (M‐H, Fixed, 95% CI) | 0.38 [0.17, 0.85] |
| 2 Adverse events Show forest plot | 1 | 148 | Risk Ratio (M‐H, Fixed, 95% CI) | 1.03 [0.21, 4.93] |
| 3 Fever at 48 hours Show forest plot | 1 | 148 | Risk Ratio (M‐H, Fixed, 95% CI) | 1.03 [0.07, 16.12] |
| Outcome or subgroup title | No. of studies | No. of participants | Statistical method | Effect size |
| 1 Pain at 48 hours Show forest plot | 1 | 146 | Risk Ratio (M‐H, Fixed, 95% CI) | 0.28 [0.11, 0.70] |
| 2 Adverse events Show forest plot | 1 | 146 | Risk Ratio (M‐H, Fixed, 95% CI) | 1.76 [0.44, 7.10] |
| 3 Fever at 48 hours Show forest plot | 1 | 146 | Risk Ratio (M‐H, Fixed, 95% CI) | 1.06 [0.07, 16.57] |
| Outcome or subgroup title | No. of studies | No. of participants | Statistical method | Effect size |
| 1 Pain at 24 hours Show forest plot | 2 | 39 | Risk Ratio (M‐H, Fixed, 95% CI) | 0.83 [0.59, 1.18] |
| 2 Pain at 48 to 72 hours Show forest plot | 3 | 183 | Risk Ratio (M‐H, Fixed, 95% CI) | 0.91 [0.54, 1.54] |
| 3 Pain at 4 to 7 days Show forest plot | 2 | 38 | Risk Ratio (M‐H, Fixed, 95% CI) | 0.74 [0.17, 3.23] |
| 4 Adverse events Show forest plot | 2 | 197 | Risk Ratio (M‐H, Random, 95% CI) | 1.71 [0.43, 6.90] |
| 5 Mild pain at 24 hours Show forest plot | 2 | 39 | Risk Ratio (M‐H, Fixed, 95% CI) | 1.08 [0.31, 3.73] |
| 6 Mild pain at 48 to 72 hours Show forest plot | 2 | 39 | Risk Ratio (M‐H, Fixed, 95% CI) | 1.35 [0.62, 2.91] |
| 7 Mild pain at 4 to 7 days Show forest plot | 2 | 39 | Risk Ratio (M‐H, Fixed, 95% CI) | 0.91 [0.37, 2.23] |
| 8 Mean pain score at 24 hours Show forest plot | 2 | 39 | Mean Difference (IV, Fixed, 95% CI) | 0.10 [‐0.47, 0.67] |
| 9 Mean pain score at 48 to 72 hours Show forest plot | 2 | 39 | Mean Difference (IV, Fixed, 95% CI) | 0.19 [‐0.27, 0.65] |
| 10 Mean pain score at 4 to 7 days Show forest plot | 2 | 31 | Mean Difference (IV, Fixed, 95% CI) | ‐0.30 [‐2.38, 1.78] |
| 11 Fever at 24 hours Show forest plot | 2 | 39 | Risk Ratio (M‐H, Fixed, 95% CI) | 0.69 [0.24, 2.00] |
| 12 Fever at 48 to 72 hours Show forest plot | 3 | 182 | Risk Ratio (M‐H, Fixed, 95% CI) | 1.18 [0.31, 4.44] |
| 13 Fever at 4 to 7 days Show forest plot | 2 | 39 | Risk Ratio (M‐H, Fixed, 95% CI) | 2.75 [0.12, 60.70] |
| 14 Re‐consultations Show forest plot | 1 | 53 | Risk Ratio (M‐H, Fixed, 95% CI) | 1.13 [0.92, 1.40] |
| 15 Delayed antibiotic prescriptions Show forest plot | 1 | 53 | Risk Ratio (M‐H, Fixed, 95% CI) | 1.32 [0.74, 2.35] |
| Outcome or subgroup title | No. of studies | No. of participants | Statistical method | Effect size |
| 1 Pain at 24 hours Show forest plot | 2 | 41 | Risk Ratio (M‐H, Fixed, 95% CI) | 1.07 [0.78, 1.47] |
| 2 Pain at 48 to 72 hours Show forest plot | 2 | 41 | Risk Ratio (M‐H, Fixed, 95% CI) | 0.71 [0.42, 1.20] |
| 3 Pain at 4 to 7 days Show forest plot | 2 | 41 | Risk Ratio (M‐H, Fixed, 95% CI) | 1.65 [0.58, 4.72] |
| 4 Adverse events Show forest plot | 1 | 56 | Risk Ratio (M‐H, Fixed, 95% CI) | 0.0 [0.0, 0.0] |
| 5 Mild pain at 24 hours Show forest plot | 2 | 41 | Risk Ratio (M‐H, Fixed, 95% CI) | 0.21 [0.02, 1.74] |
| 6 Mild pain at 48 to 72 hours Show forest plot | 2 | 41 | Risk Ratio (M‐H, Fixed, 95% CI) | 0.63 [0.24, 1.62] |
| 7 Mild pain at 4 to 7 days Show forest plot | 2 | 41 | Risk Ratio (M‐H, Fixed, 95% CI) | 0.5 [0.17, 1.43] |
| 8 Mean pain at 24 hours Show forest plot | 2 | 40 | Mean Difference (IV, Random, 95% CI) | 0.32 [‐0.59, 1.23] |
| 9 Mean pain at 48 to 72 hours Show forest plot | 2 | 40 | Mean Difference (IV, Fixed, 95% CI) | 0.60 [‐0.77, 1.97] |
| 10 Mean pain at 4 to 7 days Show forest plot | 2 | 33 | Mean Difference (IV, Fixed, 95% CI) | 0.7 [‐1.01, 2.41] |
| 11 Fever at 24 hours Show forest plot | 2 | 41 | Risk Ratio (M‐H, Fixed, 95% CI) | 1.48 [0.73, 2.99] |
| 12 Fever at 48 to 72 hours Show forest plot | 2 | 41 | Risk Ratio (M‐H, Fixed, 95% CI) | 2.13 [0.60, 7.60] |
| 13 Fever at 4 to 7 days Show forest plot | 2 | 41 | Risk Ratio (M‐H, Fixed, 95% CI) | 0.0 [0.0, 0.0] |
| 14 Re‐consultations Show forest plot | 1 | 56 | Risk Ratio (M‐H, Fixed, 95% CI) | 0.80 [0.58, 1.11] |
| 15 Delayed antibiotic prescriptions Show forest plot | 1 | 56 | Risk Ratio (M‐H, Fixed, 95% CI) | 1.27 [0.71, 2.26] |
| 16 Serious complications Show forest plot | 2 | 71 | Risk Ratio (M‐H, Fixed, 95% CI) | 0.0 [0.0, 0.0] |