蒙脱石对小儿急性感染性腹泻。
Abstract
研究背景
随着全球范围内继发于急性传染性腹泻患者的死亡率下降,重点转向了以减轻疾病负担为主的辅助性治疗。蒙脱石,一种药用黏土,可以作为一种补充替代干预疗法来减少腹泻的持续时间。
研究目的
旨在评估蒙脱石对于治疗小儿急性感染性腹泻的效果。
检索策略
我们检索了Cochrane传染病数据组专业注册库( Cochrane Infectious Diseases Group Specialized Register),Cochrane对照试验中心注册库(CENTRAL),MEDLINE(Pubmed),Embase(Ovid),LILACS中截止到2017年7月27日,已发表的研究,以往文献综述以及会议摘要的参考文献列表。
标准/纳入排除标准
纳入随机和半随机对照试验将1个月至18岁急性感染性腹泻患儿,分为蒙脱石组和对照组进行对比。
数据收集与分析
两位综述作者独立检查了摘要和纳入的整篇文章,提取资料,并评估了偏倚风险。我们的主要结局是腹泻持续时长和第三天的临床治愈率。我们用平均差(MD)表示连续数据结局,用风险比(RR)和95%置信区间(CI)表示二分类数据结局。我们酌情用Meta分析合并数据,并且评估了异质性。我们使用漏斗图检测了发表偏倚。
主要结果
18项试验共2016名儿童符合纳入准则。研究在门诊和住院处进行,同时涉及高收入和中低收入国家。大多数研究纳入了轮状病毒感染的儿童,以及其中一半包含了母乳喂养的儿童。
蒙脱石可能减少腹泻时长将近一天(平均差值‐24.38小时,95%置信区间‐30.91至‐17.85;14项研究;2209名儿童;低确定性证据);可能提高第三天的临床治愈率(危险比(RR)2.10,95%置信区间1.30至3.39,;5项试验;312名儿童;低确定性证据)以及可能减少排便量(平均差值‐11.37,95%置信区间‐21.94至‐0.79;3项试验;634名儿童;低确定性证据)。
我们不确定蒙脱石是否减少排便频率,以每天的沉积物来衡量(平均差值‐1.33,95%置信区间‐2.28至‐0.38;3项研究;954名儿童;极低确定性证据)。没有需要住院治疗(危险比0.93,95%置信区间0.75至1.15;2项研究;885名儿童;低确定性证据)和静脉补液(危险比0.77,95%置信区间0.54至1.11;1项研究;81名儿童;适中确定性证据)的有效证据。最频繁报道的副作用是便秘,在组别中无区别(危险比4.71,95%置信区间0.56至39.19;2项研究;128名儿童;低确定性证据)。没有死亡或严重不良反应报告。
作者结论
基于低确定性证据,蒙脱石作为一种辅助补液治疗可能减少急性腹泻儿童的腹泻持续时长一天;可能提高在第三天的治愈率;也可能减少排便,但是对住院率和静脉补液需要没有影响。
PICO
Plain language summary
蒙脱石治疗急性腹泻的儿童。
本综述的目的是什么
本Cochrane综述的目的是查明蒙脱石(或蒙脱石散),一种药用黏土,腹泻患者的常用处方用以减少排便量,是否可以帮助急性腹泻患儿。我们收集和分析了所有相关的研究来回答这个问题,并且找到了18项相关研究。
主要信息
给急性腹泻患儿服用蒙脱石可能减少症状持续时间。然而,仍需要更多高质量的研究,包括评估不同原因引起的腹泻以及这种疗法的经济效益的研究。
本综述研究了什么?
急性腹泻是最常见的儿童疾病之一。它通常由一种病毒感染引起。治疗的主要目的是为了维持良好水合作用状态。这是通过口服补液溶液实现的,少数患儿需要接受住院治疗,或需静脉补液。即便通过适当的补液,便溏仍是父母和患儿的一个烦恼。
蒙脱石可能减轻肠道炎症;作为一个减少毒素渗透的屏障;或通过增强吸水性。
主要的结果是什么?
我们找到18项相关研究,共纳入来自高收入和中收入、低收入国家的2616名儿童。这些研究比较了接受蒙脱石治疗和接受常规护理或安慰剂(不含药的药丸或液体)治疗的患儿。八项研究都是由制造商资助的。
蒙脱石可能在一天内(低确定性证据)就可减少腹泻的持续时间;可能在第三天就增加治愈儿童的数量(低确定性证据);以及可能轻微减少便溏量(低确定性证据)。
我们不确定蒙脱石对于多少腹泻患儿有效(十分低确定性证据)。这可能对需要住院治疗的患儿数量没有影响(低确定性证据),也可能对需要静脉补液的患儿数量没有影响(适中确定性证据)。
我们没有找到严重不良反应的报告。出现较轻的不良反应包括便秘、呕吐和纳差,但这些在组间无区别。
本综述的时效性如何?
我们检索了截至2017年6月27日前发表的研究。
Authors' conclusions
Summary of findings
| Smectite compared to control for acute infectious diarrhoea in children | ||||||
| Patient or population: acute infectious diarrhoea in children | ||||||
| Outcomes | Anticipated absolute effects* (95% CI) | Relative effect | Number of participants | Certainty of the evidence | Comments (compared with control) | |
| Risk with control | Risk with smectite | |||||
| Duration of diarrhoea | The mean duration of diarrhoea ranged from 32.6 to 118.92 hours | MD 24.38 hours fewer | ‐ | 2209 | ⊕⊕⊝⊝ | Smectite may reduce the duration of diarrhoea |
| Clinical resolution at day 3 | Study population | RR 2.10 | 312 | ⊕⊕⊝⊝ | Smectite may increase the resolution of diarrhoea by the third day | |
| 342 per 1000 | 718 per 1000 | |||||
| Stool frequency assessed with: clinical assessment as number of depositions per day | The mean stool frequency was 0 depositions per day | MD 1.33 depositions per day fewer | ‐ | 954 | ⊕⊝⊝⊝ | We are uncertain whether or not smectite reduces stool frequency |
| Stool output assessed with: grams of stool output per kg of body weight in a 72‐hour period | The mean stool output ranged from 90.7 to 118.8 g/kg | MD 11.37 g/kg fewer | ‐ | 634 | ⊕⊕⊝⊝ | Smectite may decrease stool output |
| Need for hospitalization | Study population | RR 0.93 | 885 | ⊕⊕⊝⊝ | Smectite may make little or no difference in the need for hospitalization | |
| 85 per 1000 | 79 per 1000 | |||||
| Need for intravenous access for rehydration | Study population | RR 0.77 | 81 | ⊕⊕⊕⊝ | Smectite probably makes little or no difference in the need for intravenoous access | |
| 676 per 1000 | 520 per 1000 | |||||
| Adverse events – constipation | Study population | RR 4.71 | 128 | ⊕⊕⊝⊝ | Smectite may make little or no difference in the appeareance of adverse events | |
| 0 per 1000 | 0 per 1000 | |||||
| Death | ‐ | ‐ | ‐ | ‐ | ‐ | There were no deaths in the included studies |
| Serious adverse events | ‐ | ‐ | ‐ | ‐ | ‐ | There were no serious side effects in the included studies |
| *The risk in the intervention group (and its 95% CI) is based on the assumed risk in the comparison group and the relative effect of the intervention (and its 95% CI). Abbreviations: CI: confidence interval; MD: mean difference; RCT: randomized controlled trial; RR: risk ratio | ||||||
| GRADE Working Group grades of evidence | ||||||
| 1Four trials are quasi‐randomized and without adequate blinding of participants. | ||||||
Background
Description of the condition
Acute diarrhoea is defined as the passage of unusually loose or watery stools, usually at least three times in a 24‐hour period, for less than 14 days (King 2003; WHO 2005; WHO/UNICEF 2013). Incidence of acute diarrhoea in children under five years of age is approximately two to three episodes per child per year (Walker 2013). The aetiology is usually infectious, and is usually transmitted by faecal‐oral route, or by contaminated water or food. Although most cases of acute diarrhoea are self limited, the most common complication is dehydration where children are at higher risk compared to adults. The objective of treatment in many countries is to relieve symptoms and avoid complications. In low‐ and middle‐income countries there are additional concerns to prevent dehydration and prevent the illness contributing to malnutrition. Therapeutic options for the latter objective include probiotics (Allen 2010), zinc (Lazzerini 2016), lactose‐free formula (MacGillivray 2013), antibiotics, and antidiarrhoeal agents such as loperamide, racecadotril, and smectite.
Description of the intervention
Smectite is a medicinal clay commonly prescribed to reduce stool output in people with diarrhoea. A survey conducted in 29 European countries with a response rate of 34% found that 22% of physicians (9% in Western European countries and 41% in Eastern European countries) would give smectite as an adjuvant treatment to children with gastroenteritis (Szajewska 2000). In France, the use of smectite by private paediatricians may be as high as 84% (Uhlen 2004). Another survey, conducted in Prague, Czech Republic, found that 45.7% of children with acute diarrhoea received smectite (Kudlova 2010). A survey carried out in 20 hospitals in two Chinese provinces found that smectite was prescribed to 59.3% of adults with acute infectious diarrhoea (Hou 2013).
How the intervention might work
Dioctahedral smectite, or diosmectite, is a natural clay formed from sheets of aluminium and magnesium silicate. Its proposed mechanism of action differs from other antidiarrhoeal agents such as loperamide, which is an opioid‐receptor agonist, and racecadotril, which acts as an enkephalinase inhibitor. Three possible mechanisms of action of smectite against diarrhoea have been proposed: an anti‐inflammatory activity, alteration of the gut mucus barrier to reduce penetration of toxins, and adsorptive properties. These mechanisms have been replicated mainly in vitro and in animal models (Dupont 2009). In theory, these mechanisms would reduce stool output in children, thereby providing symptomatic relief and possibly preventing dehydration.
Why it is important to do this review
In many countries, symptomatic relief of diarrhoea is important to the public. Smectite is one such option for providing this relief. Two previous systematic reviews including 13 randomized controlled trials published between 1986 and 2013 provide evidence that smectite reduces the frequency and duration of diarrhoea in children (Das 2015; Szajewska 2006). The only reported adverse event was constipation. Since acute diarrhoea is usually a self limited illness, provided the person is properly hydrated, it is important to assess the efficacy and safety of adjuvant therapies such as smectite. With the publication of recent trials, there was a need to update the evidence on this topic.
Objectives
To assess the effects of smectite for treating acute infectious diarrhoea in children.
Methods
Criteria for considering studies for this review
Types of studies
Randomized and quasi‐randomized trials comparing children with acute diarrhoea treated with smectite against a control group.
Types of participants
We included trials evaluating children, aged one month to 18 years old, with clinically defined diarrhoea of less than 14 days duration, presumed to be caused by an infectious agent. We excluded studies with other causes of diarrhoea, such as chronic or antibiotic‐associated diarrhoea.
Types of interventions
We included trials assessing oral smectite against a control group, either placebo or no smectite. We did not exclude trials that administered other interventions, such as probiotics or zinc, provided that the intervention and control arms were treated identically.
Types of outcome measures
Primary outcomes
-
Duration of diarrhoea, measured in hours.
-
Clinical resolution at day 3 after starting treatment.
Secondary outcomes
-
Stool frequency, measured as number of depositions per day, on day 3 after starting treatment.
-
Stool output, measured in g or mL/kg per day.
-
Need for hospitalization.
-
Need for intravenous access for rehydration.
-
Death (from any cause or diarrhoea‐related).
-
Adverse events:
-
serious adverse events (life‐threatening events).
-
other adverse events (for example, constipation, vomiting, among others).
-
Search methods for identification of studies
We attempted to identify all relevant trials regardless of language or publication status (published, unpublished, in press, and in progress).
Electronic searches
We searched the following databases using the search terms and strategy described in Appendix 1: Cochrane Infectious Diseases Group Specialized Register (27 June 2017); Cochrane Central Register of Controlled Trials (CENTRAL) (27 June 2017), published in the Cochrane Library (2017, Issue 5); MEDLINE (Pubmed; 1946 to 27 June 2017); Embase (Ovid; 1974 to 27 June 2017); and LILACS (Latin American and Caribbean Health Sciences Literature) (1982 to 27 June 2017). We also searched the metaRegister of Controlled Trials (mRCT) (27 June 2017) and the World Health Organization International Clinical Trials Registry Platform (WHO ICTRP) (27 June 2017) using ‘smectite' and ‘diosmectite' as search terms (Appendix 1).
Searching other resources
Conference proceedings
We searched the following conference proceedings of the last two years (2014 to 2016) for relevant abstracts.
-
Interscience Conference on Antimicrobial Agents and Chemotherapy (ICAAC).
-
Infectious Diseases Society of America (IDSA) conferences.
-
International Congress on Infectious Diseases (ICID) from the International Society for Infectious Diseases (ISID).
Researchers and organizations
We contacted researchers, authors of included trials, other experts in the field of infectious diseases, and pharmaceutical companies that manufacture smectite.
Reference lists
We also checked the reference lists of all studies identified by the above methods.
Data collection and analysis
Selection of studies
Two review authors (GP and CC) independently screened the search results to identify potentially relevant trials and retrieved the full‐text articles of these trials. GP and CC independently applied the inclusion criteria using an eligibility form, resolving any differences by discussing them with a third review author (VP or IF). We scrutinized the trial reports to ensure that multiple publications from the same trial were included only once. We listed the excluded studies and the reasons for their exclusion in the ‘Characteristics of excluded studies' section. Finally, when we were unsure whether a trial should be included because further information was needed, we attempted to contact the trial authors for clarification and allocated the trial to the ‘Studies awaiting classification' section. We have presented an adapted PRISMA flowchart showing study selection (Liberati 2009).
Data extraction and management
Two review authors (GP and CC) independently extracted prespecified characteristics of each trial using a standardized, piloted data extraction form. We attempted to contact trial authors in cases of unclear or missing data. We extracted the following data.
-
The numbers of randomized and analysed participants in each treatment group for each outcome.
-
The mean and standard deviation (SD) for each treatment group for continuous outcomes, and the number of participants with the event for each treatment group for dichotomous outcomes. If these values were not explicitly presented, we attempted to transform data where possible from available numbers such as 95% confidence intervals (CIs), standard errors, range or test statistics (that is, t, F, Z scores, P values, etc.). We obtained the SD from 95% CIs in one study according to the guidelines in the Cochrane Handbook for Systematic Reviews of Interventions (Higgins 2011). We imputed SDs for studies that did not present any measure of data dispersion. We extracted information from figures in three trials that presented the results in this format and did not provide numerical values for measures of dispersion (Dupont 2009a; Dupont 2009b; Pociecha 1998a; Pociecha 1998b), using the Plot Digitizer open source software (Jelicic 2016). Two trials presented the information using median and 95% CI and provided a Kaplan‐Meier curve with the data for both intervention and control group (Dupont 2009a; Dupont 2009b). We applied the Hozo and colleagues approach to calculate the best estimation of mean and SD (Hozo 2005).
Assessment of risk of bias in included studies
Two review authors (GP and CC) independently assessed the risk of bias of the included studies, resolving any disagreements by discussion with a third review author (VP or IF). We attempted to contact trial authors regarding unclear or unspecified information. We used the Cochrane ‘Risk of bias' assessment tool, which includes the following domains (Higgins 2011).
-
Sequence generation: describe the method used to generate the allocation sequence in sufficient detail to allow an assessment of whether it should produce comparable groups.
-
Allocation concealment: describe the method used to conceal the allocation sequence in sufficient detail to determine whether intervention allocations could have been foreseen in advance of, or during, enrolment.
-
Blinding (masking) of participants, personnel, and outcome assessors: describe all measures used, if any, to mask trial participants, personnel, and outcome assessors from knowledge of which intervention a participant received. Provide any information relating to whether the intended masking was effective.
-
Incomplete outcome data: describe the completeness of outcome data for each main outcome, including attrition and exclusions from the analysis. State whether attrition and exclusions were reported, the numbers in each intervention group (compared with total randomized participants), reasons for attrition or exclusions where reported, and any re‐inclusions in analyses performed by the review authors.
-
Selective outcome reporting: state how the possibility of selective outcome reporting was examined by the review authors and what was found.
-
Other sources of bias: state any important concerns about bias not addressed in the other domains in the tool.
We assessed the risk of bias for each component using ‘yes', ‘no', or ‘unclear' to indicate a low, high, or unclear risk of bias, respectively. We have presented the ‘Risk of bias' assessment in a ‘Risk of bias' graph and the ‘Risk of bias' tables.
Certainty of the evidence
We have presented the certainty of the evidence according to the GRADE approach. Two review authors (GP and CC) independently rated the certainty of the evidence for each outcome. Since we included randomized controlled trials, which are considered as high certainty, review authors could downgrade the body of evidence depending on five criteria: limitations, inconsistency, indirectness, imprecision, and publication bias. Evidence could be upgraded if a large effect size was found, if there was a dose‐response association, or if trial authors considered plausible confounding factors. We have presented a summary of the evidence in a ‘Summary of findings' table, which provides key information about the best estimate of the magnitude of the effect in relative terms and absolute differences for each relevant comparison of alternative management strategies, numbers of participants and studies addressing each important outcome, and the rating of the overall certainty in effect estimates for each outcome. We used GRADEpro GDT to create the ‘Summary of findings' table (GRADEpro GDT).
Measures of treatment effect
For continuous outcomes, we used mean differences (MD) as the measure of effect with 95% CIs. For outcomes with different measurements, for example stool output, which can be measured in grams or mL per kg, we used standardized mean differences (SMD). For dichotomous outcomes, we used risk ratios (RR) as the measure of effect with 95% CIs.
Unit of analysis issues
Given the condition under study and the trial participants, we did not expect to find cluster randomized controlled trials or cross‐over trials. When we found trials with repeated measurements, we decided on a single time point (for example, diarrhoea resolution at day 3).
Dealing with missing data
When there were no missing data, we carried out analyses according to the intention‐to‐treat principle, that is all children were analysed according to the group to which they were initially randomized. If there were missing data, we attempted to contact trial authors to request any missing data. If the trial authors did not respond within four to eight weeks, we conducted the analyses based on only the available information.
Assessment of heterogeneity
We used forest plots to detect overlapping CIs, and applied the Chi2 test with a P value < 0.10 to indicate statistical significance for heterogeneity. We investigated inconsistency with the I2 statistic, considering a value from 0% to 40% as not important.
Assessment of reporting biases
We assessed reporting biases by examining asymmetry of funnel plots.
Data synthesis
One review author (GP) analysed the data using Review Manager 5 (RevMan 2014). When appropriate, we combined data by meta‐analysis using a fixed‐effect model. When we found inconsistency (I2 statistic > 40%) or heterogeneity (Chi2 test at a significant P value < 0.10), we combined the results using the random‐effects model.
Subgroup analysis and investigation of heterogeneity
We expected to perform subgroup analysis based on age groups, given that severity of disease might be different among infants, children, and adolescents. Since the higher burden and mortality of acute diarrhoea is in infants (Walker 2013), we analysed subgroups under and over two years of age.
Sensitivity analysis
We performed sensitivity analyses regarding risk of bias to investigate the robustness of the results, that is restricting the analysis by taking into account trials at low versus high or unclear risk of bias, as specified in the Assessment of risk of bias in included studies section. We explored if the following markers affected the direction of results: randomization, allocation concealment, blinding, follow‐up, and missing data. We also performed a sensitivity analysis excluding the trials that required estimations and figure extractions (Dupont 2009a; Dupont 2009b; Pociecha 1998a; Pociecha 1998b).
Results
Description of studies
See: Characteristics of included studies; Characteristics of excluded studies; Characteristics of studies awaiting classification.
Results of the search
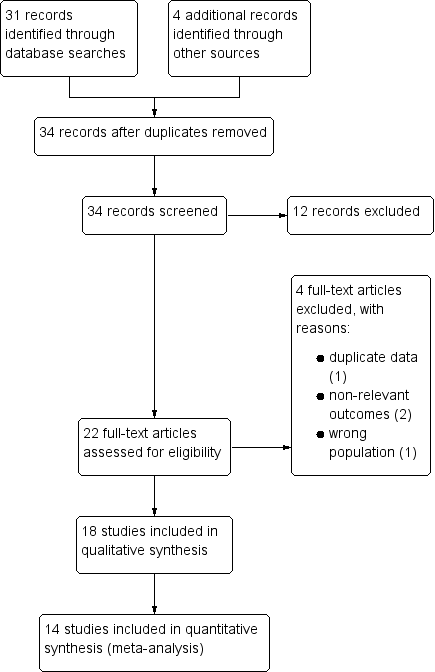
Our search strategy identified 34 potentially relevant studies, of which 22 studies were screened in full text. Eighteen studies met the inclusion criteria, and four were excluded (Dupont 1991; Dupont 1992; Karas 1996; Madkour 1994). The study flow diagram is shown in Figure 1. One reference included two studies (Dupont 2009a; Dupont 2009b). Another study is presented in the results as two separate studies because data were divided by age group (Pociecha 1998a; Pociecha 1998b).

Study flow diagram.
Included studies
Study location
Eleven studies were conducted in low‐ or middle‐income countries: Peru, Malaysia, Egypt, Thailand, India, Pakistan, Indonesia, and China (Dupont 2009a; Dupont 2009b; Lachaux 1986; Lexomboon 1994; Madkour 1993; Mujawar 2012; Rehman 2013; Vivatvakin 1992; Wang 1995; Widiasa 2009; Zong 1997). Seven were conducted in high‐income countries: France, Italy, Lithuania, and Poland (Gilbert 1991; Guarino 2001; Lachaux 1986; Milocco 1999; Narkeviciute 2002; Pieścik‐Lech 2013; Pociecha 1998a; Pociecha 1998b). Most trials were conducted in hospitals, with two studies conducted in both hospital and an ambulatory setting (Madkour 1993; Wang 1995), three exclusively with outpatients (Guarino 2001; Lexomboon 1994; Mujawar 2012), and two that did not specify (Gilbert 1991; Zong 1997).
Participants
Most studies included infants aged one to 24 months. One study did not include infants (Mujawar 2012), and one did not report age (Wang 1995). Nine studies included children aged two to 12 years old. No trials included adolescents. Two trials included only males (Dupont 2009a; Dupont 2009b). One report divided its results into two age groups: less than 12 months and 13 to 36 months (Pociecha 1998a; Pociecha 1998b).
Two studies included exclusively breastfed infants (Dupont 2009a; Dupont 2009b), and seven studies included children who were breastfed (Lexomboon 1994; Osman 1992; Pieścik‐Lech 2013; Pociecha 1998a; Pociecha 1998b; Rehman 2013; Vivatvakin 1992; Widiasa 2009). One study excluded breastfed infants (Narkeviciute 2002). Thirteen trials reported rotavirus as the most frequent gastroenteritis aetiology. No studies included dysentery or bloody diarrhoea or children with cholera. One study included children with moderate malnutrition (Widiasa 2009), while the other studies excluded children with any degree of malnutrition.
Most trials defined diarrhoea as three or more loose stools, but the duration varied among studies: four defined it as less than two days (Guarino 2001; Lexomboon 1994; Mujawar 2012; Widiasa 2009); six as less than three days (Dupont 2009a; Dupont 2009b; Narkeviciute 2002; Pociecha 1998a; Pociecha 1998b; Rehman 2013; Vivatvakin 1992); one as less than four days (Lachaux 1986); five as less than five days (Madkour 1993; Milocco 1999; Pieścik‐Lech 2013; Wang 1995; Zong 1997); one as less than seven days (Osman 1992); and one referred to it as "recent" (Gilbert 1991).
Interventions
Doses of smectite varied between 1 g and 6 g per dose, and frequency of administration varied from once daily to every six hours. Most trials used 1.5 g per dose in infants less one year and 3 g in older infants or children. Two trials administered 3 g twice a day for three days, and then once a day in infants less than one year, and double the dose in older children (Dupont 2009a; Dupont 2009b). Five trials gave 1.5 g of smectite twice a day to infants less than one year, with double the dose for older children (Gilbert 1991; Guarino 2001; Milocco 1999; Pociecha 1998a; Pociecha 1998b; Wang 1995). Two studies gave a loading dose of 3 g (Lexomboon 1994; Narkeviciute 2002). Two trials administered smectite every eight hours (Mujawar 2012; Rehman 2013), and one study gave it every six hours (Madkour 1993). Two trials gave smectite every eight hours to children weighing less than 10 kg, and every six hours to children above 10 kg (Osman 1992; Vivatvakin 1992). Two studies gave Lactobacillus rhamnosus GG to both the intervention and the control group (Pieścik‐Lech 2013; Pociecha 1998a; Pociecha 1998b). Two studies did not report the dose (Widiasa 2009; Zong 1997).
The duration of treatment also differed among studies. Four studies gave smectite until recovery (Dupont 2009a; Dupont 2009b; Narkeviciute 2002; Pieścik‐Lech 2013); two administered the treatment for three days (Madkour 1993; Milocco 1999); five for five days (Mujawar 2012; Osman 1992; Rehman 2013; Vivatvakin 1992; Widiasa 2009); and one for six days (Pociecha 1998a; Pociecha 1998b). The remaining studies did not specify the duration of treatment.
Outcomes
Primary outcomes
Fifteen studies reported the duration of diarrhoea (Dupont 2009a; Dupont 2009b; Gilbert 1991; Guarino 2001; Lachaux 1986; Madkour 1993; Milocco 1999; Mujawar 2012; Narkeviciute 2002; Pieścik‐Lech 2013; Pociecha 1998a; Pociecha 1998b; Rehman 2013; Vivatvakin 1992; Widiasa 2009; Zong 1997), but the outcome was defined differently. Six trials defined it as time to the last loose stool (Guarino 2001; Madkour 1993; Narkeviciute 2002; Pieścik‐Lech 2013; Vivatvakin 1992; Widiasa 2009); three as time to first formed stool (Dupont 2009a; Lachaux 1986; Rehman 2013); one as time to first soft or formed stool (Dupont 2009b); three as time to normalization of stools (Gilbert 1991; Mujawar 2012; Pociecha 1998a; Pociecha 1998b); and two did not provide a clear definition (Milocco 1999; Zong 1997).
Five trials reported clinical resolution of diarrhoea at day 3 (Lachaux 1986; Lexomboon 1994; Madkour 1993; Osman 1992; Vivatvakin 1992).
Secondary outcomes
Four studies reported stool frequency: three as number of depositions per day (Guarino 2001; Madkour 1993; Osman 1992), and one as the total number of stools during follow‐up (Milocco 1999). Three trials reported stool output as grams per kilogram of child's weight at 72 hours (Dupont 2009a; Dupont 2009b), and one in grams per day (Osman 1992). Two studies reported need for hospitalization (Guarino 2001; Pieścik‐Lech 2013). One study reported need for intravenous access for rehydration (Pieścik‐Lech 2013). No studies reported deaths.
Risk of bias in included studies
See: Characteristics of included studies; Figure 2; Figure 3 for the risk of bias in included studies.
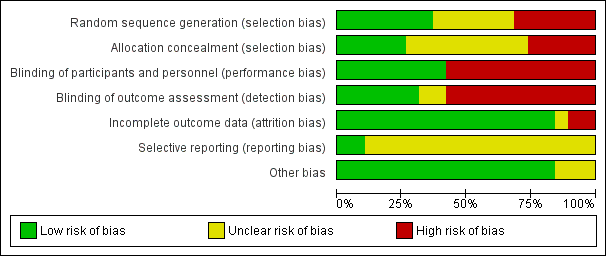
‘Risk of bias' graph: review authors' judgements about each risk of bias item presented as percentages across all included studies.

‘Risk of bias' summary: review authors' judgements about each risk of bias item for each included study.
Allocation
Seven studies had an adequate description of randomization method (Dupont 2009a; Dupont 2009b; Lachaux 1986; Madkour 1993; Pieścik‐Lech 2013; Rehman 2013; Widiasa 2009). In five trials the information about random allocation was unclear (Gilbert 1991; Lexomboon 1994; Pociecha 1998a; Pociecha 1998b; Wang 1995; Zong 1997). Five studies were quasi‐randomized trials in which children were allocated alternately, by birthday or serial number (Guarino 2001; Milocco 1999; Mujawar 2012; Narkeviciute 2002; Osman 1992). We suspected selection bias in one study as groups differed in the aetiology of diarrhoea, and the method of randomization was not described (Vivatvakin 1992).
Five studies adequately described allocation concealment (Dupont 2009a; Dupont 2009b; Madkour 1993; Pieścik‐Lech 2013; Widiasa 2009). We considered all quasi‐randomized trials as having high risk of bias regarding allocation concealment.
Blinding
Eight trials were reported as double‐blind and used a placebo as control (Dupont 2009a; Dupont 2009b; Gilbert 1991; Lachaux 1986; Madkour 1993; Pieścik‐Lech 2013; Rehman 2013; Widiasa 2009). The remaining trials were not blinded (Guarino 2001; Lexomboon 1994; Milocco 1999; Mujawar 2012; Narkeviciute 2002; Osman 1992; Pociecha 1998a; Pociecha 1998b; Vivatvakin 1992; Wang 1995; Zong 1997).
Incomplete outcome data
Fourteen trials had appropriate follow‐up and analysis of more than 90% of participants. Two included less than 90% in the analysis (Dupont 2009a; Osman 1992). In one trial information was insufficient to permit judgement (Guarino 2001).
Selective reporting
Two trials had a registered protocol (Dupont 2009a; Dupont 2009b).
Effects of interventions
Primary outcomes
1.1 Duration of diarrhoea
Overall, duration of diarrhoea was reduced by approximately 24 hours (mean difference (MD) ‐24.38, 95% confidence interval (CI) ‐30.91 to ‐17.85; 14 trials; 2209 children, Analysis 1.1; low‐certainty evidence). There was significant heterogeneity (I2 = 96%). This high inconsistency was due to differences in effect size of the benefit, not because of opposing directions of effects (Figure 4).

Forest plot of comparison: 1 Diarrhoea primary outcomes, outcome: 1.1 Mean duration of diarrhoea (hours).
A sensitivity analysis exploring the effect of randomization, allocation concealment, blinding, and follow‐up did not change the result of the meta‐analysis significantly. Sensitivity analysis excluding the trials that required estimations and figure extractions did not significantly change the result of the meta‐analysis (MD ‐22.07, 95% CI ‐30.38 to ‐13.76) (Dupont 2009a; Dupont 2009b; Pociecha 1998a; Pociecha 1998b).
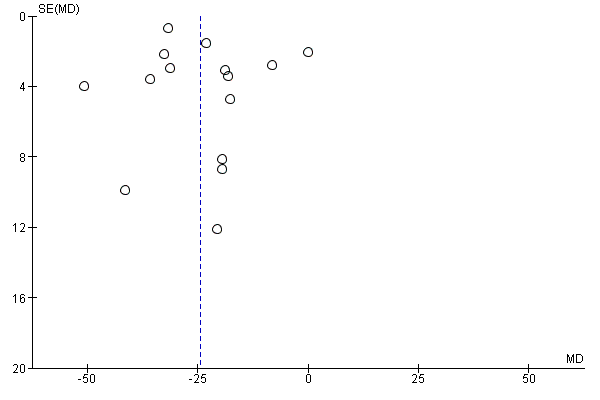
On visual inspection, the funnel plot was roughly symmetric, with most studies centred together at the top, probably reflecting spuriously small standard deviations of the continuous outcome that is skewed (Figure 5).

Funnel plot of comparison: 1 Diarrhoea primary outcomes, outcome: 1.1 Mean duration of diarrhoea (hours).
1.2 Duration of diarrhoea, infants less than two years
Five studies included only infants younger than two years (Gilbert 1991; Lachaux 1986; Madkour 1993; Rehman 2013; Vivatvakin 1992). One study reported results for infants less than 12 months (Pociecha 1998a). Smectite reduced the duration of diarrhoea by 24 hours (MD ‐24.11, 95% CI ‐31.35 to ‐16.87; 441 infants; Analysis 1.2). Other studies included both infants and children, but they did not provide enough information to be able to perform a subgroup analysis according to age (Figure 6).
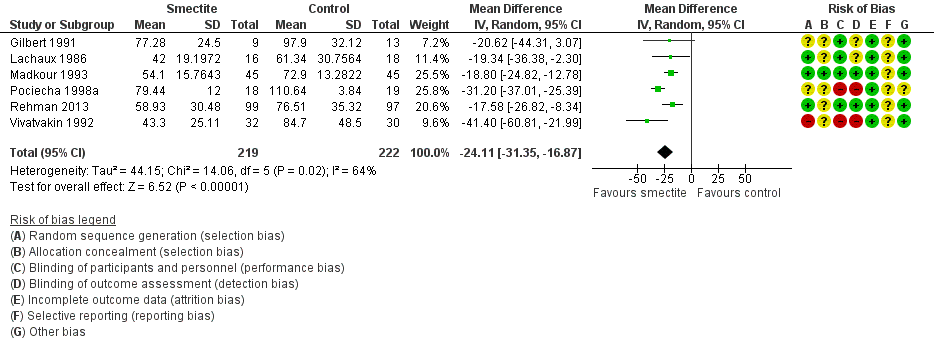
Forest plot of comparison: 1 Diarrhoea primary outcomes, outcome: 1.2 Mean duration of diarrhoea, studies including only infants < 2 years.
1.3 Clinical resolution at day 3 after starting treatment
Smectite increased the rate of clinical resolution at day 3 (risk ratio (RR) 2.10, 95% CI 1.30 to 3.39; 5 trials; 312 children; Analysis 1.3; low‐certainty evidence) (Figure 7). After performing a sensitivity analysis excluding trials with high risk of bias (Osman 1992; Vivatvakin 1992), the pooled effect was not significant (RR 1.90, 95% CI 0.96 to 3.77; 3 trials; 190 children).

Forest plot of comparison: 1 Diarrhoea primary outcomes, outcome: 1.3 Clinical resolution at day 3 after starting treatment.
Secondary outcomes
2.1 Stool frequency
Three studies measured stool frequency as number of depositions per day, all of them reporting data on day 3 (Guarino 2001; Madkour 1993; Osman 1992). Smectite reduced stool frequency by one (MD ‐1.33, 95% CI ‐2.28 to ‐0.38; 3 trials; 954 children; Analysis 2.1; very low‐certainty evidence) (Figure 8). One study measured stool frequency as total number of depositions during follow‐up; the mean number of depositions was 10 in both groups (Milocco 1999).
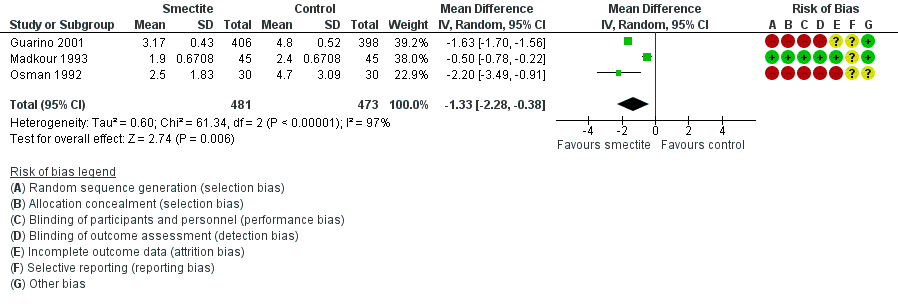
Forest plot of comparison: 2 Diarrhoea secondary outcomes, outcome: 2.1 Stool frequency, measured as number of depositions per day, on day 3 after starting treatment.
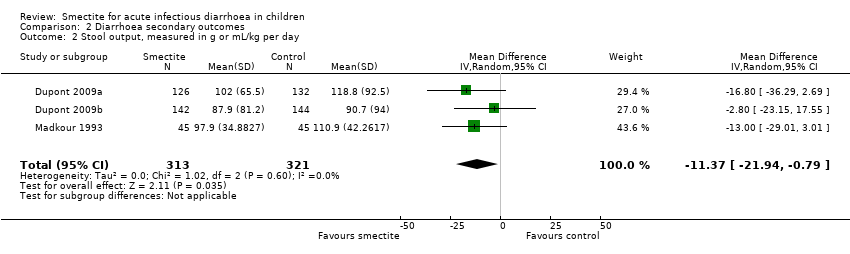
2.2 Stool output
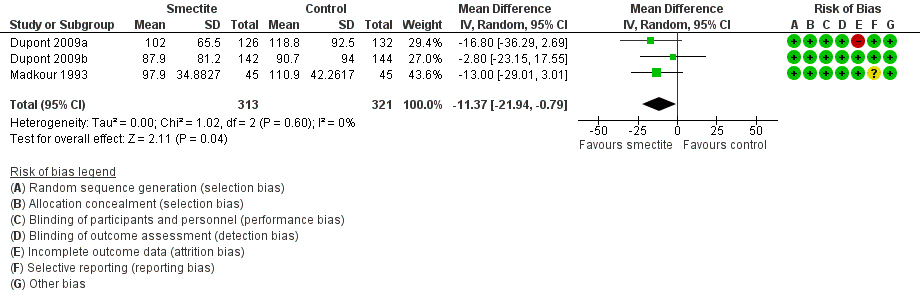
Four studies evaluated stool output. Three studies reported cumulative stool output at 72 hours (Dupont 2009a; Dupont 2009b; Madkour 1993). Smectite reduced stool output by 11 g/kg (MD ‐11.37, 95% CI ‐21.94 to ‐0.79; 3 trials; 634 children; Analysis 2.2; low‐certainty evidence) (Figure 9). Another study was not pooled because the authors reported stool output as stool weight in total grams per day with an effect estimate favouring smectite (mean of 255.67 g in the smectite group versus 741.33 g in the control group) at day 3 of treatment (Osman 1992).

Forest plot of comparison: 2 Diarrhoea secondary outcomes, outcome: 2.2 Stool output, measured in g/kg at 72 hours.
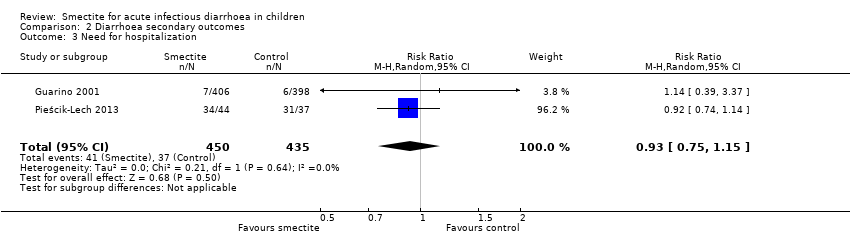
2.3 Need for hospitalization
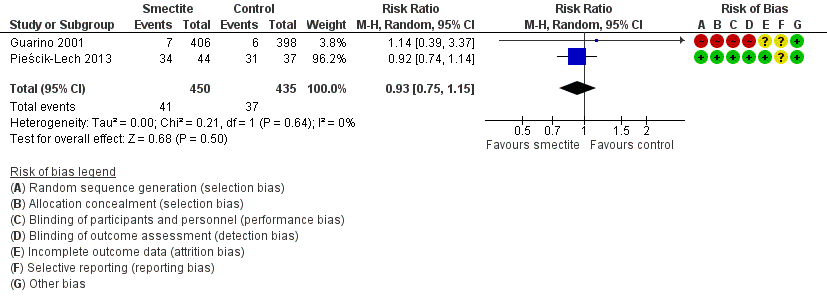
Two studies reported data on need for hospitalization. There was no evidence of benefit using smectite (RR 0.93, 95% CI 0.75 to 1.15; 2 trials; 885 children; Analysis 2.3; low‐certainty evidence) (Figure 10).

Forest plot of comparison: 2 Diarrhoea secondary outcomes, outcome: 2.3 Need for hospitalization.
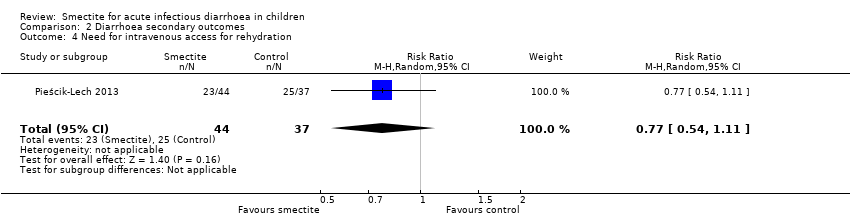
2.4 Need for intravenous access for rehydration
There was no evidence of an effect on need for intravenous rehydration (RR 0.77, 95% CI 0.54 to 1.11; 1 trial; 81 children; Analysis 2.4; moderate‐certainty evidence).
2.5 Death (from any cause or diarrhoea‐related)
No deaths were reported in any of the included trials.
2.6 Serious adverse events (life‐threatening events)
There were no reports of serious adverse events.
2.7 Other adverse events (constipation, vomiting)
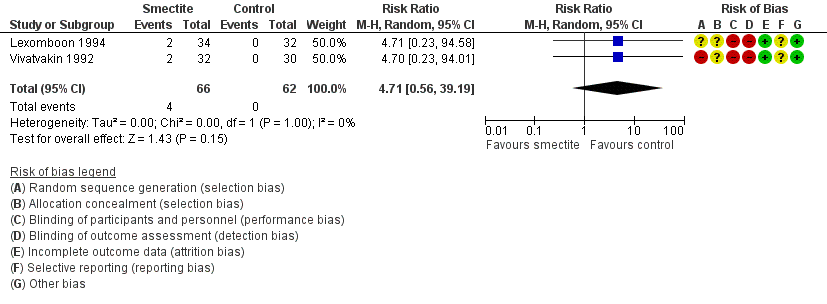
The most commonly reported adverse effect was constipation. However, the risk of constipation using smectite was very uncertain due to imprecision, with very few events and wide confidence intervals (RR 4.71, 95% CI 0.56 to 39.19; 2 trials; 128 children; Analysis 2.5; low‐certainty evidence) (Figure 11). There were also no differences between groups regarding vomiting or fever. Another minor adverse event mentioned in trials was bad taste, but there were no specific numbers for the intervention and control groups.

Forest plot of comparison: 2 Diarrhoea secondary outcomes, outcome: 2.5 Constipation.
Discussion
Summary of main results
We identified 18 studies that compared smectite to a control group. Overall, smectite reduced the duration of diarrhoea by approximately a day, increased clinical resolution by day 3, and had a modest benefit on stool frequency and output. This evidence of benefit persisted after a sensitivity analysis accounting for randomization method, even though five trials were quasi‐randomized. Eight trials reported the inclusion of breastfed infants.
There was no evidence of an effect on the need for hospitalization or intravenous rehydration, deaths, or serious side effects.
Overall completeness and applicability of evidence
Studies were conducted in diverse settings in both high‐income and low‐ or middle‐income countries, and including both ambulatory and hospital patients. Aetiology also varied, with most trials including a large proportion of children with rotavirus. Most studies excluded children with malnutrition. Most of the studies were funded by the industry. Although external funding and commercial interests are well recognized as a potential source of bias in clinical trials, most investigators provided reasonable information that shows that the manufacturers had no, or a very limited, active role in the design and conduct of the studies.
Quality of the evidence
We assessed the certainty of the evidence using the GRADE system, which is displayed in ‘Summary of findings' table 1 (summary of findings Table for the main comparison). Overall, the certainty of the body of evidence ranged from very low to moderate. For our primary outcomes, the certainty of evidence was low mainly due to concerns of risk of bias and inconsistency of the results. Regarding risk of bias, we included four quasi‐randomized trials, and another four trials did not clearly describe the randomization process. Also, seven trials were not blinded.
The high heterogeneity observed may be due to differences in the definition of the condition, the age of participants, and the different aetiologies. In one study, Pieścik‐Lech 2013, another explanation for heterogeneity could be that both the intervention and the control group received a probiotic, but the other study that added a probiotic as a co‐intervention did not contribute to such inconsistency (Pociecha 1998a; Pociecha 1998b). The high inconsistency observed was mainly due to differences in effect size of the benefit and not because of opposing directions of effects.
Potential biases in the review process
We made every attempt to limit biases during the review process by ensuring a comprehensive search for potentially eligible studies. We believe that the authors’ independent assessments of eligibility of studies for inclusion and data extraction have minimized the potential for additional bias beyond that detailed in the ‘Risk of bias' tables in the Characteristics of included studies and in the funnel plot.
Agreements and disagreements with other studies or reviews
Our findings agree with those of previous systematic reviews (Das 2015; Szajewska 2006). Due to the differences in time of publication, our review includes more trials than the review by Szajewska 2006, and assesses the certainty of the evidence based on the GRADE approach. The review by Das 2015 included 13 out of the 18 studies that were included in this review. Szajewska 2006 reported a reduction of 22.7 hours in the duration of diarrhoea, while Das 2015 reported 22.39 hours. Szajewska 2006 and Das 2015 also report significant results for cure rate at day 3. While Das 2015 reported clinical resolution at day 5 and 7, we considered day 3 to be more clinically relevant.
Study flow diagram.

‘Risk of bias' graph: review authors' judgements about each risk of bias item presented as percentages across all included studies.

‘Risk of bias' summary: review authors' judgements about each risk of bias item for each included study.

Forest plot of comparison: 1 Diarrhoea primary outcomes, outcome: 1.1 Mean duration of diarrhoea (hours).
Funnel plot of comparison: 1 Diarrhoea primary outcomes, outcome: 1.1 Mean duration of diarrhoea (hours).

Forest plot of comparison: 1 Diarrhoea primary outcomes, outcome: 1.2 Mean duration of diarrhoea, studies including only infants < 2 years.

Forest plot of comparison: 1 Diarrhoea primary outcomes, outcome: 1.3 Clinical resolution at day 3 after starting treatment.

Forest plot of comparison: 2 Diarrhoea secondary outcomes, outcome: 2.1 Stool frequency, measured as number of depositions per day, on day 3 after starting treatment.
Forest plot of comparison: 2 Diarrhoea secondary outcomes, outcome: 2.2 Stool output, measured in g/kg at 72 hours.
Forest plot of comparison: 2 Diarrhoea secondary outcomes, outcome: 2.3 Need for hospitalization.
Forest plot of comparison: 2 Diarrhoea secondary outcomes, outcome: 2.5 Constipation.

Comparison 1 Diarrhoea primary outcomes, Outcome 1 Mean duration of diarrhoea.

Comparison 1 Diarrhoea primary outcomes, Outcome 2 Mean duration of diarrhoea, studies including only infants < 2 years.

Comparison 1 Diarrhoea primary outcomes, Outcome 3 Clinical resolution at day 3 after starting treatment.

Comparison 2 Diarrhoea secondary outcomes, Outcome 1 Stool frequency, measured as number of depositions per day, on day 3 after starting treatment.
Comparison 2 Diarrhoea secondary outcomes, Outcome 2 Stool output, measured in g or mL/kg per day.
Comparison 2 Diarrhoea secondary outcomes, Outcome 3 Need for hospitalization.
Comparison 2 Diarrhoea secondary outcomes, Outcome 4 Need for intravenous access for rehydration.

Comparison 2 Diarrhoea secondary outcomes, Outcome 5 Constipation.
| Smectite compared to control for acute infectious diarrhoea in children | ||||||
| Patient or population: acute infectious diarrhoea in children | ||||||
| Outcomes | Anticipated absolute effects* (95% CI) | Relative effect | Number of participants | Certainty of the evidence | Comments (compared with control) | |
| Risk with control | Risk with smectite | |||||
| Duration of diarrhoea | The mean duration of diarrhoea ranged from 32.6 to 118.92 hours | MD 24.38 hours fewer | ‐ | 2209 | ⊕⊕⊝⊝ | Smectite may reduce the duration of diarrhoea |
| Clinical resolution at day 3 | Study population | RR 2.10 | 312 | ⊕⊕⊝⊝ | Smectite may increase the resolution of diarrhoea by the third day | |
| 342 per 1000 | 718 per 1000 | |||||
| Stool frequency assessed with: clinical assessment as number of depositions per day | The mean stool frequency was 0 depositions per day | MD 1.33 depositions per day fewer | ‐ | 954 | ⊕⊝⊝⊝ | We are uncertain whether or not smectite reduces stool frequency |
| Stool output assessed with: grams of stool output per kg of body weight in a 72‐hour period | The mean stool output ranged from 90.7 to 118.8 g/kg | MD 11.37 g/kg fewer | ‐ | 634 | ⊕⊕⊝⊝ | Smectite may decrease stool output |
| Need for hospitalization | Study population | RR 0.93 | 885 | ⊕⊕⊝⊝ | Smectite may make little or no difference in the need for hospitalization | |
| 85 per 1000 | 79 per 1000 | |||||
| Need for intravenous access for rehydration | Study population | RR 0.77 | 81 | ⊕⊕⊕⊝ | Smectite probably makes little or no difference in the need for intravenoous access | |
| 676 per 1000 | 520 per 1000 | |||||
| Adverse events – constipation | Study population | RR 4.71 | 128 | ⊕⊕⊝⊝ | Smectite may make little or no difference in the appeareance of adverse events | |
| 0 per 1000 | 0 per 1000 | |||||
| Death | ‐ | ‐ | ‐ | ‐ | ‐ | There were no deaths in the included studies |
| Serious adverse events | ‐ | ‐ | ‐ | ‐ | ‐ | There were no serious side effects in the included studies |
| *The risk in the intervention group (and its 95% CI) is based on the assumed risk in the comparison group and the relative effect of the intervention (and its 95% CI). Abbreviations: CI: confidence interval; MD: mean difference; RCT: randomized controlled trial; RR: risk ratio | ||||||
| GRADE Working Group grades of evidence | ||||||
| 1Four trials are quasi‐randomized and without adequate blinding of participants. | ||||||
| Outcome or subgroup title | No. of studies | No. of participants | Statistical method | Effect size |
| 1 Mean duration of diarrhoea Show forest plot | 15 | 2209 | Mean Difference (IV, Random, 95% CI) | ‐24.38 [‐30.91, ‐17.85] |
| 2 Mean duration of diarrhoea, studies including only infants < 2 years Show forest plot | 6 | 441 | Mean Difference (IV, Random, 95% CI) | ‐24.11 [‐31.35, ‐16.87] |
| 3 Clinical resolution at day 3 after starting treatment Show forest plot | 5 | 312 | Risk Ratio (M‐H, Random, 95% CI) | 2.10 [1.30, 3.39] |
| Outcome or subgroup title | No. of studies | No. of participants | Statistical method | Effect size |
| 1 Stool frequency, measured as number of depositions per day, on day 3 after starting treatment Show forest plot | 3 | 954 | Mean Difference (IV, Random, 95% CI) | ‐1.33 [‐2.28, ‐0.38] |
| 2 Stool output, measured in g or mL/kg per day Show forest plot | 3 | 634 | Mean Difference (IV, Random, 95% CI) | ‐11.37 [‐21.94, ‐0.79] |
| 3 Need for hospitalization Show forest plot | 2 | 885 | Risk Ratio (M‐H, Random, 95% CI) | 0.93 [0.75, 1.15] |
| 4 Need for intravenous access for rehydration Show forest plot | 1 | 81 | Risk Ratio (M‐H, Random, 95% CI) | 0.77 [0.54, 1.11] |
| 5 Constipation Show forest plot | 2 | 128 | Risk Ratio (M‐H, Random, 95% CI) | 4.71 [0.56, 39.19] |