Evaluación y apoyo durante el trabajo de parto temprano para mejorar los resultados del parto
Información
- DOI:
- https://doi.org/10.1002/14651858.CD011516.pub2Copiar DOI

- Base de datos:
-
- Cochrane Database of Systematic Reviews
- Versión publicada:
-
- 20 abril 2017see what's new
- Tipo:
-
- Intervention
- Etapa:
-
- Review
- Grupo Editorial Cochrane:
-
Grupo Cochrane de Embarazo y parto
- Copyright:
-
- Copyright © 2017 The Cochrane Collaboration. Published by John Wiley & Sons, Ltd.
Cifras del artículo
Altmetric:
Citado por:
Autores
Contributions of authors
Nobutsugu Hanada (NH) drafted the protocol with support from Erika Ota (EO), Masayo Matsuzaki (MM) and Rintaro Mori (RM).
NH, Shinobu Kobayashi (SK) and Kenji Takehara (KT) selected studies and extracted data. SK, KT, Hatoko Sasaki (HS) and EO conducted analysis and interpretation. EO, SK, KT, HS, MM, and Chie Nagata (CN) drafted the review.
Sources of support
Internal sources
-
National Center for Child Health and Development, Japan.
External sources
-
Ministry of Health, Labour and Welfare, Japan.
Health Labour Sciences Research Grant (No.13800128)
-
UNDP‐UNFPA‐UNICEF‐WHO‐World Bank Special Programme of Research, Development and Research Training in Human Reproduction (HRP), Department of Reproductive Health and Research (RHR), World Health Organization, Switzerland.
Declarations of interest
Nobutsugu Hanada: none known.
Masayo Matsuzaki: none known.
Erika Ota: none known.
Rintaro Mori: none known.
Shinobu Kobayashi: none known.
Kenji Takehara: none known.
Hatoko Sasaki: none known.
Chie Nagata: Chie Nagata's institution receives government funding from the Clinical Research Program for Child Health and Development, AMED, Japan to provide support for the Cochrane Pregnancy and Childbirth Satellite.
Acknowledgements
We thank Ms Emma Barber for her editorial support.
This project was supported by the National Institute for Health Research, via Cochrane Infrastructure funding to Cochrane Pregnancy and Childbirth. The views and opinions expressed therein are those of the authors and do not necessarily reflect those of the Systematic Reviews Programme, NIIHR, NHS or the Department of Health.
Rintaro Mori's and Chie Nagata's institution receives government funding from the Clinical Research Program for Child Health and Development, AMED, Japan to provide support for the Pregnancy and Childbirth Satellite in Japan.
As part of the prepublication editorial process, this review has been commented on by four peers (an editor and three referees who are external to the editorial team), members of Cochrane Pregnancy and Childbirth's international panel of consumers and the Group's Statistical Adviser.
Version history
| Published | Title | Stage | Authors | Version |
| 2017 Apr 20 | Assessment and support during early labour for improving birth outcomes | Review | Shinobu Kobayashi, Nobutsugu Hanada, Masayo Matsuzaki, Kenji Takehara, Erika Ota, Hatoko Sasaki, Chie Nagata, Rintaro Mori | |
| 2015 Feb 06 | Psychosocial and educational interventions in latent phase or early labour for improving birth outcomes | Protocol | Nobutsugu Hanada, Masayo Matsuzaki, Erika Ota, Rintaro Mori | |
Differences between protocol and review
In our protocol (Hanada 2015), the types of participants were defined as pregnant women. We decided to focus on healthy pregnant women and redefined the types of participants as 'healthy pregnant women'. We may need to revise this further.
The title has changed to ‘Assessment and support in early labour for improving birth outcomes’.
The scope has changed slightly to early labour interventions only (five included studies, two excluded).
The background has been revised to include labour assessment as an intervention and the psychosocial aspect has been toned down.
Keywords
MeSH
Medical Subject Headings (MeSH) Keywords
- *Delivery, Obstetric [statistics & numerical data];
- *Hospitalization;
- *Midwifery;
- *Parturition;
- Anesthesia, Conduction [statistics & numerical data];
- Anesthesia, Epidural [statistics & numerical data];
- Apgar Score;
- Cesarean Section [statistics & numerical data];
- Home Childbirth;
- House Calls;
- Labor, Obstetric [*physiology, psychology];
- Randomized Controlled Trials as Topic;
- Telephone;
- Time Factors;
- Triage [methods];
Medical Subject Headings Check Words
Female; Humans; Infant, Newborn; Pregnancy;
PICO

Study flow diagram.
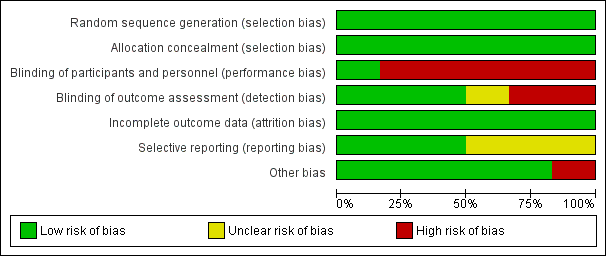
Risk of bias graph: review authors' judgements about each risk of bias item presented as percentages across all included studies

Risk of bias summary: review authors' judgements about each risk of bias item for each included study

Comparison 1 Assessment vs direct admission in early labour, Outcome 1 Length of labour (hours).

Comparison 1 Assessment vs direct admission in early labour, Outcome 2 Rate of caesarean section.

Comparison 1 Assessment vs direct admission in early labour, Outcome 3 Rate of instrumental vaginal birth.

Comparison 1 Assessment vs direct admission in early labour, Outcome 4 Baby born before arrival at hospital or unplanned home birth.

Comparison 1 Assessment vs direct admission in early labour, Outcome 5 Augmentation of labour.
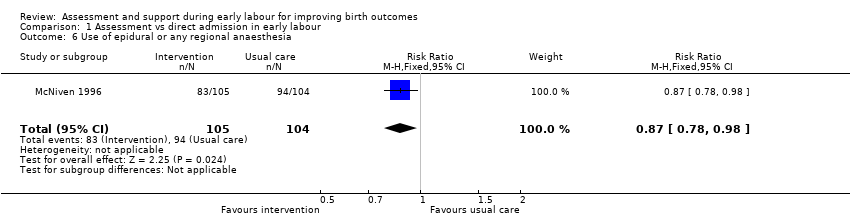
Comparison 1 Assessment vs direct admission in early labour, Outcome 6 Use of epidural or any regional anaesthesia.
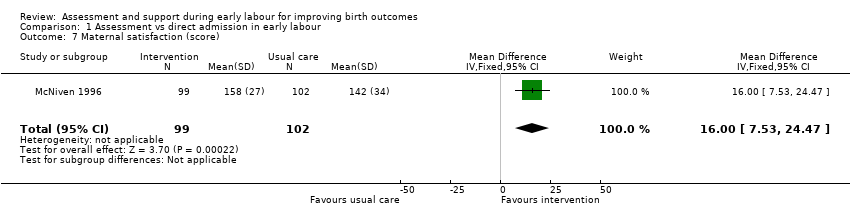
Comparison 1 Assessment vs direct admission in early labour, Outcome 7 Maternal satisfaction (score).
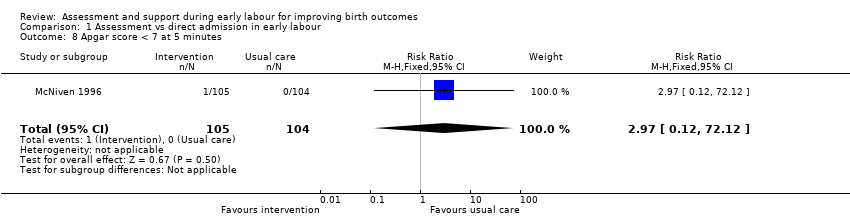
Comparison 1 Assessment vs direct admission in early labour, Outcome 8 Apgar score < 7 at 5 minutes.

Comparison 2 Home support vs telephone triage, Outcome 1 Length of labour (hours).
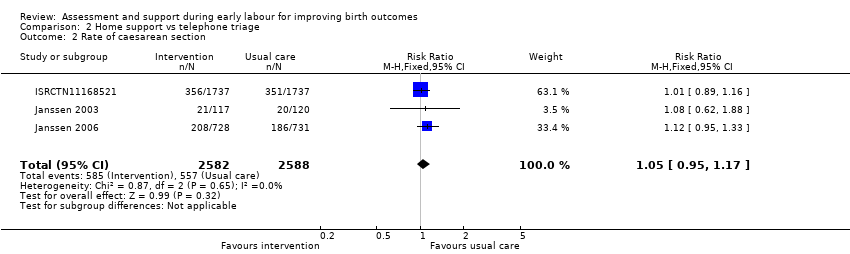
Comparison 2 Home support vs telephone triage, Outcome 2 Rate of caesarean section.
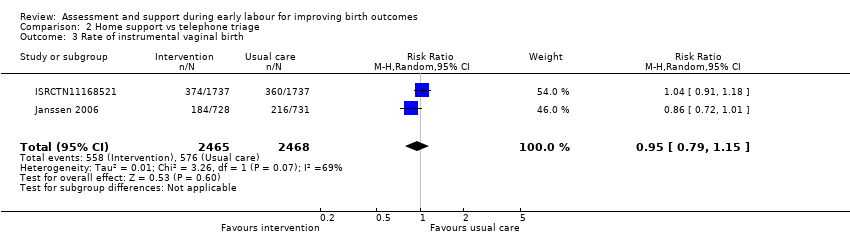
Comparison 2 Home support vs telephone triage, Outcome 3 Rate of instrumental vaginal birth.

Comparison 2 Home support vs telephone triage, Outcome 4 Baby born before arrival at hospital or unplanned home birth.

Comparison 2 Home support vs telephone triage, Outcome 5 Serious maternal morbidity.
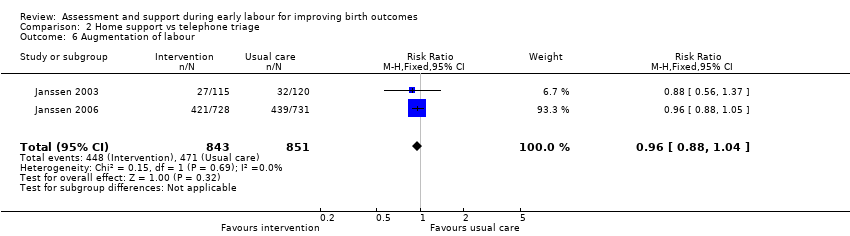
Comparison 2 Home support vs telephone triage, Outcome 6 Augmentation of labour.

Comparison 2 Home support vs telephone triage, Outcome 7 Use of epidural or any regional anaesthesia.

Comparison 2 Home support vs telephone triage, Outcome 8 Duration of hospital stay (prolonged postpartum stay in hospital > 5 days).
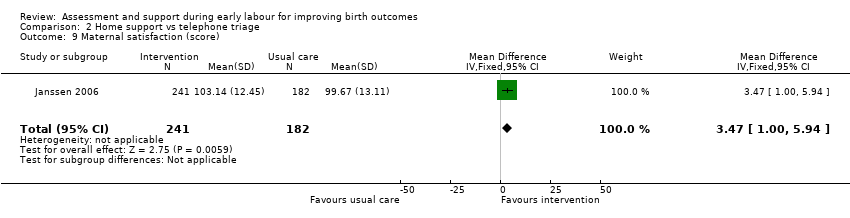
Comparison 2 Home support vs telephone triage, Outcome 9 Maternal satisfaction (score).

Comparison 2 Home support vs telephone triage, Outcome 10 Postpartum depression (EPDS score ≥ 13).

Comparison 2 Home support vs telephone triage, Outcome 11 Perinatal death.

Comparison 2 Home support vs telephone triage, Outcome 12 Neonatal admission to special care.
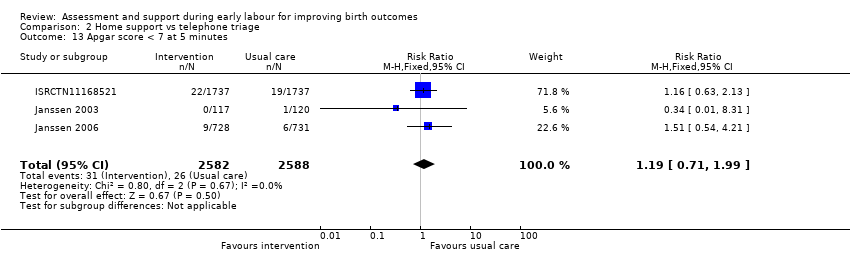
Comparison 2 Home support vs telephone triage, Outcome 13 Apgar score < 7 at 5 minutes.
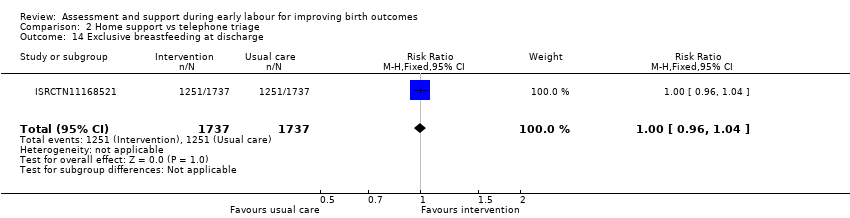
Comparison 2 Home support vs telephone triage, Outcome 14 Exclusive breastfeeding at discharge.
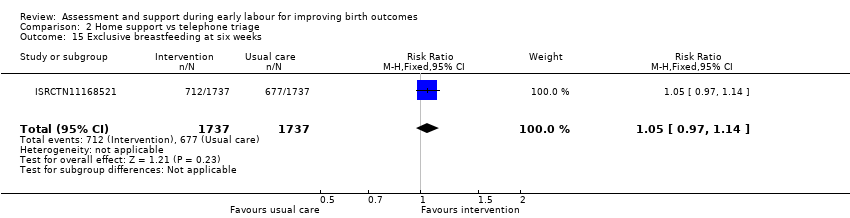
Comparison 2 Home support vs telephone triage, Outcome 15 Exclusive breastfeeding at six weeks.

Comparison 3 One‐to‐one structured care vs usual care, Outcome 1 Rate of caesarean section.
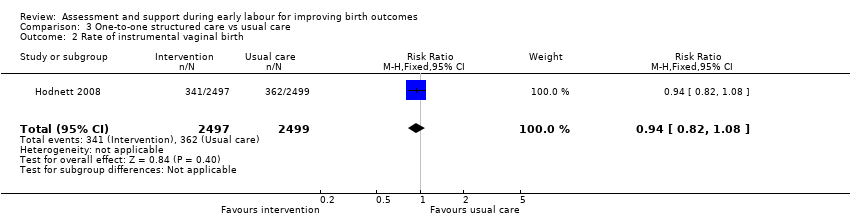
Comparison 3 One‐to‐one structured care vs usual care, Outcome 2 Rate of instrumental vaginal birth.

Comparison 3 One‐to‐one structured care vs usual care, Outcome 3 Serious maternal morbidity.

Comparison 3 One‐to‐one structured care vs usual care, Outcome 4 Use of epidural or any regional anaesthesia.
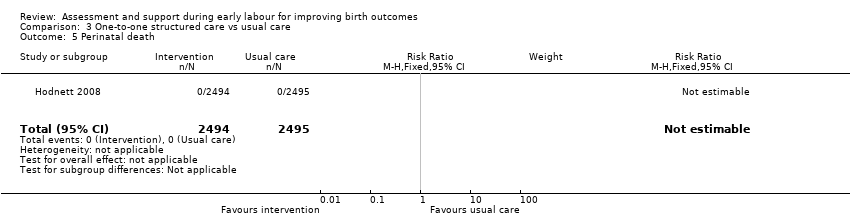
Comparison 3 One‐to‐one structured care vs usual care, Outcome 5 Perinatal death.
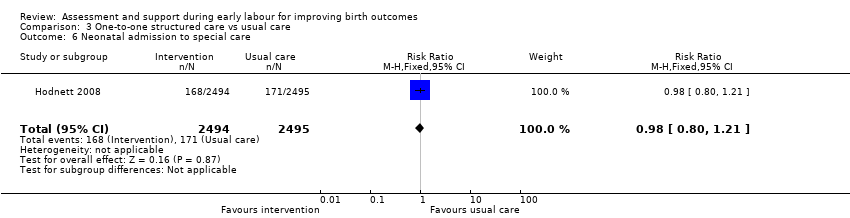
Comparison 3 One‐to‐one structured care vs usual care, Outcome 6 Neonatal admission to special care.

Comparison 3 One‐to‐one structured care vs usual care, Outcome 7 Apgar score < 7 at 5 minutes.
| Assessment compared with direct admission in early labour for improving birth outcomes | ||||||
| Patient or population: healthy pregnant women | ||||||
| Outcomes | Anticipated absolute effects* (95% CI) | Relative effect | № of participants | Quality of the evidence | Comments | |
| Risk with direct admission in early labour | Risk with assessment | |||||
| Length of labour (hours) | The mean length of labour (hours) was 8.3 hours in the intervention group and 13.5 hours in the control group | MD 5.2 lower | ‐ | 209 | ⊕⊕⊝⊝ | This outcome relates to the length of labour in hospital |
| Rate of caesarean section | Study population | RR 0.72 | 209 | ⊕⊝⊝⊝ | ||
| 106 per 1000 | 76 per 1000 | |||||
| Rate of instrumental vaginal birth | Study population | RR 0.86 | 209 | ⊕⊝⊝⊝ | ||
| 356 per 1000 | 306 per 1000 | |||||
| Serious maternal morbidity | Study population | ‐ | (0 RCTs) | ‐ | Serious maternal morbidity was not reported | |
| see comment | See comment | |||||
| Use of epidural or any regional anaesthesia | Study population | RR 0.87 | 209 | ⊕⊕⊝⊝ | ||
| 904 per 1000 | 786 per 1000 | |||||
| Neonatal admission to special care | Study population | |||||
| see comment | See comment | |||||
| Apgar score < 7 at 5 minutes | Study population | RR 2.97 | 209 | ⊕⊝⊝⊝ | ||
| 0 per 1000 | 0 per 1000 | |||||
| *The risk in the intervention group (and its 95% confidence interval) is based on the assumed risk in the comparison group and the relative effect of the intervention (and its 95% CI). | ||||||
| GRADE Working Group grades of evidence | ||||||
| 1 Single trial with design limitations (lack of blinding) (‐1) 2 Single trial with small sample size (‐1) 3 Wide 95% CI crossing the line of no effect and small sample size (‐2) 4 Wide 95% CI crossing the line of no effect, small sample size and low event rate (‐2) | ||||||
| Home support compared with telephone triage for improving birth outcomes | ||||||
| Patient or population: healthy pregnant women | ||||||
| Outcomes | Anticipated absolute effects* (95% CI) | Relative effect | № of participants | Quality of the evidence | Comments | |
| Risk with telephone triage | Risk with home support | |||||
| Length of labour (hours) | The mean length of labour (hours) was 9.66 in the intervention group and 9.37 in the control group | MD 0.29 higher | ‐ | 3474 | ⊕⊕⊝⊝ | Criteria for start of labour were not clearly described |
| Rate of caesarean section | Study population | RR 1.05 | 5170 | ⊕⊕⊕⊝ | ||
| 215 per 1000 | 226 per 1000 | |||||
| Rate of instrumental vaginal birth | Study population | RR 0.95 | 4933 | ⊕⊕⊝⊝ | ||
| 233 per 1000 | 222 per 1000 | |||||
| Serious maternal morbidity | Study population | RR 0.93 | 3474 | ⊕⊕⊝⊝ | ||
| 25 per 1000 | 23 per 1000 | |||||
| Use of epidural or any regional anaesthesia | Study population | RR 0.95 | 5168 | ⊕⊕⊝⊝ | ||
| 505 per 1000 | 480 per 1000 | |||||
| Neonatal admission to special care | Study population | RR 0.84 | 5170 | ⊕⊝⊝⊝ | ||
| 58 per 1000 | 49 per 1000 | |||||
| Apgar score < 7 at 5 minutes | Study population | RR 1.19 | 5170 | ⊕⊕⊝⊝ | ||
| 10 per 1000 | 12 per 1000 | |||||
| *The risk in the intervention group (and its 95% confidence interval) is based on the assumed risk in the comparison group and the relative effect of the intervention (and its 95% CI). | ||||||
| GRADE Working Group grades of evidence | ||||||
| 1 Study with design limitations (lack of blinding) (‐1) 2 Wide 95% CI crossing line of no effect (‐1) 3 All studies contributing data had design limitations (lack of blinding) (‐1) 4 High heterogeneity (I2 69%) (‐1) 5 High heterogeneity (I2 60%) (‐1) 6 High heterogeneity (I2 71%) (‐1) | ||||||
| One‐to‐one structured care compared to usual care for improving birth outcomes | ||||||
| Patient or population: healthy pregnant women | ||||||
| Outcomes | Anticipated absolute effects* (95% CI) | Relative effect | № of participants | Quality of the evidence | Comments | |
| Risk with usual care | Risk with one‐to‐one structured care | |||||
| Length of labour (hours) | ‐ | See comment | ‐ | (0 study) | ‐ | Not reported |
| Rate of caesarean section | Study population | RR 0.93 | 4996 | ⊕⊕⊕⊕ | ||
| 242 per 1000 | 225 per 1000 | |||||
| Rate of instrumental vaginal birth | Study population | RR 0.94 | 4996 | ⊕⊕⊕⊕ | ||
| 145 per 1000 | 136 per 1000 | |||||
| Serious maternal morbidity | Study population | RR 1.13 | 4996 | ⊕⊕⊕⊝ | ||
| 32 per 1000 | 36 per 1000 | |||||
| Use of epidural or any regional anaesthesia | Study population | RR 1.00 | 4996 | ⊕⊕⊕⊕ | ||
| 955 per 1000 | 955 per 1000 | |||||
| Neonatal admission to special care | Study population | RR 0.98 | 4989 | ⊕⊕⊕⊕ | ||
| 69 per 1000 | 67 per 1000 | |||||
| Apgar score < 7 at 5 minutes | Study population | RR 1.07 | 4989 | ⊕⊕⊕⊝ | ||
| 11 per 1000 | 12 per 1000 | |||||
| *The risk in the intervention group (and its 95% confidence interval) is based on the assumed risk in the comparison group and the relative effect of the intervention (and its 95% CI). | ||||||
| GRADE Working Group grades of evidence | ||||||
| 1 Wide 95% CI crossing line of no effect (‐1) | ||||||
| OUTCOME | Intervention (after ) n = 892 | Control (after) n = 1279 | Difference between groups adjusted for baseline differences between clusters with 95% CI | P value |
| Spontaneous vertex delivery | 526 | 785 | ‐3.2 (‐15.1 to 8.7) | 0.6 |
| ARM | 401 | 500 | 5.6 (‐2.2 to 13.4) | 0.1 |
| Electronic fetal monitoring | 557 | 820 | ‐0.1 (‐14.2 to 14.1) | 1.0 |
| Assisted vaginal delivery | 241 | 323 | ||
| Caesarean section | 123 | 168 | ||
| 3rd or 4th degree tear | 7 | 8 | ||
| Epidural | 290 | 441 | 2.1 (‐8.0 to 12.2) | 0.7 |
| Additional analgesia required Opiate | 532 | 649 | 1.5 (‐4.6 to 7.6) | 0.6 |
| Additional analgesia required Epidural and opiate | 177 | 225 | 4.4 (‐2.8 to 11.7) | 0.2 |
| Any maternal complication | 439 | 596 | 3.9 (‐9.4 to 17.2) | 0.5 |
| PP haemorrhage (specify) Intrapartum Post partum | 5 10 | 7 20 | ||
| Labour augmentation with oxytocin | 343 | 484 | 0.3 (‐9.2 to 9.8) | 0.9 |
| Unplanned birth out of hospital | 11 | 11 | ||
| Fetal distress | 166 | 242 | 2.4 (‐6.6 to 11.3) | 0.6 |
| Meconium stained liquor | 133 | 211 | ‐0.5 (‐7.2 to 6.3) | 0.9 |
| Neonatal resuscitation | 106 | 145 | ‐0.9 (‐6.4 to 4.7) | 0.7 |
| Admission to special care | 29 | 60 | ‐0.4 (‐2.6 to 1.8) | 0.7 |
| Apgar score < 7 at 5 minutes | 9 | 13 | ||
| Admission to hospital at first presentation (1 admission) One presentations before admission in labour Two presentations before admission in labour Three or more presentations before admission in labour | 398 305 149 35 | 795 366 88 20 | ‐19.2 (‐29.9 to ‐8.6) | 0.002 |
| Failure to progress 1st stage Failure to progress 2nd stage | 42 142 | 59 119 | ‐3.4 (‐15.3 to 8.6) 15.2 (‐4.5 to 34.9) | 0.5 0.1 |
| OUTCOME | Intervention n =892 Mean | SD | Control n=1279 Mean | SD | Difference between groups adjusted for baseline differences between clusters | P value |
| Duration of labour from admission to labour ward to delivery | 9.6 | 11.29 | 8.06 | 5.41 | 0.75 (‐0.55 to 2.05) | 0.2 |
| Mean number of vaginal examinations | 3.67 | Range 0‐11 | 3.46 | Range 0‐11 | 0.2 (‐0.3 to 0.7) | 0.3 |
| Outcome or subgroup title | No. of studies | No. of participants | Statistical method | Effect size |
| 1 Length of labour (hours) Show forest plot | 1 | 209 | Mean Difference (IV, Fixed, 95% CI) | ‐5.20 [‐7.06, ‐3.34] |
| 2 Rate of caesarean section Show forest plot | 1 | 209 | Risk Ratio (M‐H, Fixed, 95% CI) | 0.72 [0.30, 1.72] |
| 3 Rate of instrumental vaginal birth Show forest plot | 1 | 209 | Risk Ratio (M‐H, Fixed, 95% CI) | 0.86 [0.58, 1.26] |
| 4 Baby born before arrival at hospital or unplanned home birth Show forest plot | 1 | 209 | Risk Ratio (M‐H, Fixed, 95% CI) | 0.0 [0.0, 0.0] |
| 5 Augmentation of labour Show forest plot | 1 | 209 | Risk Ratio (M‐H, Fixed, 95% CI) | 0.57 [0.37, 0.86] |
| 6 Use of epidural or any regional anaesthesia Show forest plot | 1 | 209 | Risk Ratio (M‐H, Fixed, 95% CI) | 0.87 [0.78, 0.98] |
| 7 Maternal satisfaction (score) Show forest plot | 1 | 201 | Mean Difference (IV, Fixed, 95% CI) | 16.0 [7.53, 24.47] |
| 8 Apgar score < 7 at 5 minutes Show forest plot | 1 | 209 | Risk Ratio (M‐H, Fixed, 95% CI) | 2.97 [0.12, 72.12] |
| Outcome or subgroup title | No. of studies | No. of participants | Statistical method | Effect size |
| 1 Length of labour (hours) Show forest plot | 1 | 3474 | Mean Difference (IV, Fixed, 95% CI) | 0.29 [‐0.14, 0.72] |
| 2 Rate of caesarean section Show forest plot | 3 | 5170 | Risk Ratio (M‐H, Fixed, 95% CI) | 1.05 [0.95, 1.17] |
| 3 Rate of instrumental vaginal birth Show forest plot | 2 | 4933 | Risk Ratio (M‐H, Random, 95% CI) | 0.95 [0.79, 1.15] |
| 4 Baby born before arrival at hospital or unplanned home birth Show forest plot | 1 | 3474 | Risk Ratio (M‐H, Fixed, 95% CI) | 1.33 [0.30, 5.95] |
| 5 Serious maternal morbidity Show forest plot | 1 | 3474 | Risk Ratio (M‐H, Fixed, 95% CI) | 0.93 [0.61, 1.42] |
| 6 Augmentation of labour Show forest plot | 2 | 1694 | Risk Ratio (M‐H, Fixed, 95% CI) | 0.96 [0.88, 1.04] |
| 7 Use of epidural or any regional anaesthesia Show forest plot | 3 | 5168 | Risk Ratio (M‐H, Random, 95% CI) | 0.95 [0.87, 1.05] |
| 8 Duration of hospital stay (prolonged postpartum stay in hospital > 5 days) Show forest plot | 1 | 3474 | Risk Ratio (M‐H, Fixed, 95% CI) | 1.15 [0.83, 1.60] |
| 9 Maternal satisfaction (score) Show forest plot | 1 | 423 | Mean Difference (IV, Fixed, 95% CI) | 3.47 [1.00, 5.94] |
| 10 Postpartum depression (EPDS score ≥ 13) Show forest plot | 1 | 2584 | Risk Ratio (M‐H, Fixed, 95% CI) | 1.08 [0.82, 1.42] |
| 11 Perinatal death Show forest plot | 1 | 3474 | Risk Ratio (M‐H, Fixed, 95% CI) | 1.0 [0.42, 2.40] |
| 12 Neonatal admission to special care Show forest plot | 3 | 5170 | Risk Ratio (M‐H, Random, 95% CI) | 0.84 [0.50, 1.42] |
| 13 Apgar score < 7 at 5 minutes Show forest plot | 3 | 5170 | Risk Ratio (M‐H, Fixed, 95% CI) | 1.19 [0.71, 1.99] |
| 14 Exclusive breastfeeding at discharge Show forest plot | 1 | 3474 | Risk Ratio (M‐H, Fixed, 95% CI) | 1.0 [0.96, 1.04] |
| 15 Exclusive breastfeeding at six weeks Show forest plot | 1 | 3474 | Risk Ratio (M‐H, Fixed, 95% CI) | 1.05 [0.97, 1.14] |
| Outcome or subgroup title | No. of studies | No. of participants | Statistical method | Effect size |
| 1 Rate of caesarean section Show forest plot | 1 | 4996 | Risk Ratio (M‐H, Fixed, 95% CI) | 0.93 [0.84, 1.02] |
| 2 Rate of instrumental vaginal birth Show forest plot | 1 | 4996 | Risk Ratio (M‐H, Fixed, 95% CI) | 0.94 [0.82, 1.08] |
| 3 Serious maternal morbidity Show forest plot | 1 | 4996 | Risk Ratio (M‐H, Fixed, 95% CI) | 1.13 [0.84, 1.52] |
| 4 Use of epidural or any regional anaesthesia Show forest plot | 1 | 4996 | Risk Ratio (M‐H, Fixed, 95% CI) | 1.00 [0.99, 1.01] |
| 5 Perinatal death Show forest plot | 1 | 4989 | Risk Ratio (M‐H, Fixed, 95% CI) | 0.0 [0.0, 0.0] |
| 6 Neonatal admission to special care Show forest plot | 1 | 4989 | Risk Ratio (M‐H, Fixed, 95% CI) | 0.98 [0.80, 1.21] |
| 7 Apgar score < 7 at 5 minutes Show forest plot | 1 | 4989 | Risk Ratio (M‐H, Fixed, 95% CI) | 1.07 [0.64, 1.79] |