نقش ارزیابی و حمایت در طول لیبر زودهنگام برای بهبود پیامدهای زایمان
چکیده
پیشینه
پیشرفت لیبر زودهنگام معمولا آهسته است و ممکن است شامل انقباضات دردناک رحم باشد. زنان ممکن است احساس ناراحتی کنند و اعتماد به نفس خود را در این مرحله از دست بدهند. مداخلات حمایتی و ارزیابی در دو مرور قبلی کاکرین مورد ارزیابی قرار گرفت. این مرور نسخه بهروز شده و جایگزین این دو مرور است.
اهداف
بررسی تاثیر ارزیابی و حمایت مداخلات برای زنان در لیبر زودهنگام در طول لیبر، نرخ مداخلات زایمانی، و سایر پیامدهای مادری و نوزادی.
روشهای جستوجو
پایگاه ثبت کارآزماییهای گروه بارداری و زایمان در کاکرین، ClinicalTrials.gov، پلتفرم بینالمللی پایگاه ثبت کارآزماییهای بالینی (ICTRP) سازمان جهانی بهداشت (WHO) (31 اکتبر 2016) و فهرست منابع مطالعات بازیابی شده را جستوجو کردیم.
معیارهای انتخاب
کارآزماییهای تصادفیسازی و کنترل شده و خوشهای تصادفیسازی شده مربوط به هرگونه مداخله ارزیابی یا حمایتی در مرحله پنهان لیبر.
گردآوری و تجزیهوتحلیل دادهها
دو نویسنده مرور بهطور مستقل از هم به ارزیابی کارآزماییها برای ورود و خطر سوگیری (bias) پرداختند و دادهها را استخراج کردند. هر گونه اختلاف نظر را از طریق بحث یا مشارکت ارزیاب سوم حل کردیم. کیفیت شواهد با استفاده از رویکرد درجهبندی توصیه، ارزیابی، توسعه و ارزشیابی (GRADE) ارزیابی شد.
نتایج اصلی
پنج کارآزمایی را شامل 10,421 زن باردار و یک کارآزمایی خوشهای تصادفیسازی شده را با 2183 زن وارد کردیم. کارآزماییها در انگلستان، کانادا و آمریکا انجام شدند و مداخلات لیبر زودهنگام را در برابر مراقبت معمول مقایسه کردند. ما چهار مقایسه را ارزیابی کردیم: ارزیابی لیبر زودهنگام در برابر پذیرش فوری در بیمارستان؛ ویزیت در خانه توسط ماماها در برابر مراقبت معمول (تریاژ تلفنی)؛ و مراقبتهای ساختار یافته یکبهیک توسط ماما در برابر مراقبت معمول و ارزیابی در بیمارستان با استفاده از یک الگوریتم برای تشخیص لیبر در برابر ارزیابی معمول. کارآزماییها عمدتا به این دلیل که کورسازی زنان و کارکنان برای این مداخلات عموما امکانپذیر نبود، در معرض خطر متوسط سوگیری قرار داشتند. شواهد مربوط به پیامدهای مهم را با استفاده از GRADE ارزیابی کردیم؛ سطح شواهد مربوط به محدودیتهای طراحی مطالعه، عدم دقت را کاهش دادیم، و در جایی که ناهمگونی وجود داشت متاآنالیز (meta‐analysis) انجام دادیم.
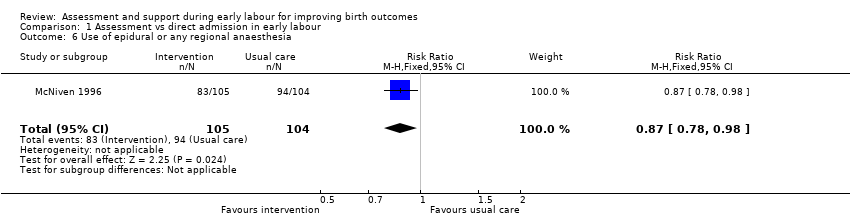
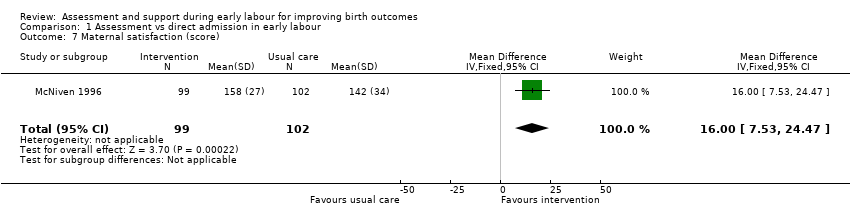
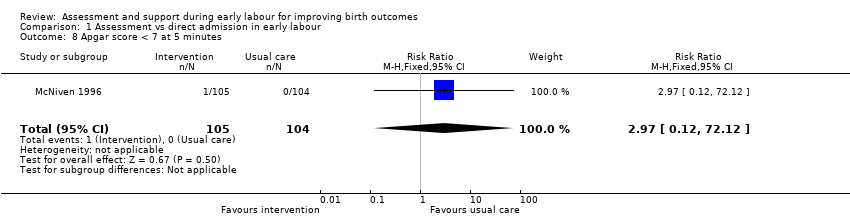
یک کارآزمایی با 209 زن، ارزیابی لیبر زودهنگام را با پذیرش مستقیم در بیمارستان مقایسه کرد. مدت زمان لیبر برای زنان در گروه ارزیابی با پذیرش در بیمارستان کاهش یافت (تفاوت میانگین (MD): 5.20‐ ساعت؛ 95% فاصله اطمینان (CI): 7.06‐ تا 3.34‐؛ 209 زن؛ شواهد با کیفیت پائین). تفاوت واضحی بین گروهها برای زایمان سزارین یا زایمان واژینال با کمک ابزار وجود نداشت (به ترتیب؛ خطر نسبی (RR): 0.72؛ 95% CI؛ 0.30 تا 1.72؛ شواهد با کیفیت بسیار پائین؛ و RR: 0.86؛ 95% CI؛ 0.58 تا 1.26؛ شواهد با کیفیت بسیار پائین). موربیدیتی جدی مادر گزارش نشده بود. زنان در گروه ارزیابی اولیه اندکی کمتر احتمال داشت که برای تقویت لیبر (به ترتیب، RR: 0.87؛ 95% CI؛ 0.78 تا 0.98؛ شواهد با کیفیت پائین؛ RR: 0.57؛ 95% CI؛ 0.37 تا 0.86) و افزایش رضایت مراقبت (MD: 16.00؛ 95% CI؛ 7.53 تا 24.47) نیاز به اپیدورال یا اکسیتوسین (oxytocin) داشته باشند. هیچ نوزادی پیش از بستری در بیمارستان متولد نشد و فقط یک نوزاد نمره آپگار پائینی در پنج دقیقه داشت (شواهد با کیفیت بسیار پائین). پذیرش در بخش مراقبتهای ویژه نوزادان (neonatal intensive care; NICU) گزارش نشده بود.
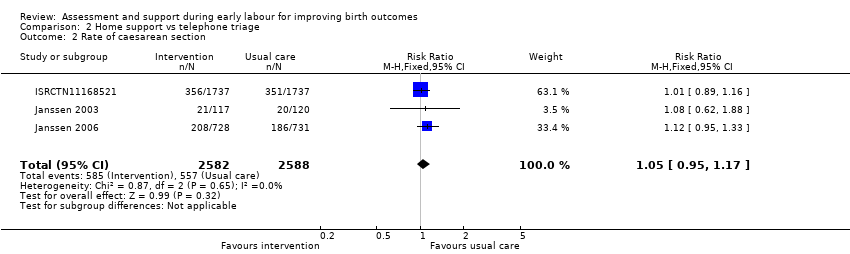
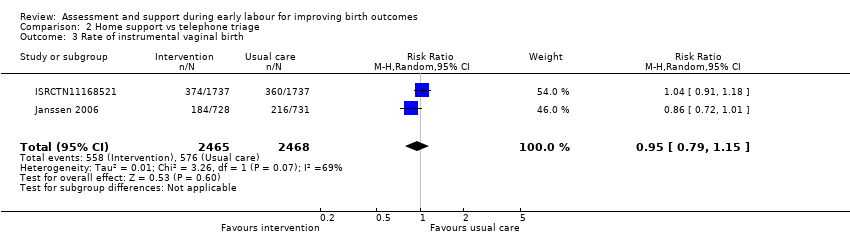
سه مطالعه، ارزیابی در خانه و حمایت ماما را در برابر تریاژ تلفنی مورد بررسی قرار دادند. یک کارآزمایی طول مدت لیبر را گزارش کرد؛ ویزیت در خانه در مقایسه با مراقبت معمول اثر واضحی نداشت (MD: 0.29 ساعت؛ 95% CI؛ 0.14‐ تا 0.72؛ 1 کارآزمایی؛ 3474 زن؛ شواهد با کیفیت پائین). تفاوت واضحی برای نرخ زایمان سزارین (RR: 1.05؛ 95% CI؛ 0.95 تا 1.17؛ 3 کارآزمایی؛ 5170 زن؛ I² = 0%؛ شواهد با کیفیت متوسط) یا زایمان واژینال با کمک ابزار (میانگین RR: 0.95؛ 95% CI؛ 0.79 تا 1.15؛ 2 کارآزمایی؛ 4933 زن؛ I² = 69%؛ شواهد با کیفیت پائین) وجود نداشت یک کارآزمایی زایمان پیش از رسیدن به بیمارستان را گزارش کرد؛ تفاوت واضحی میان گروهها وجود نداشت (RR: 1.33؛ 95% CI؛ 0.30 تا 5.95؛ 1 کارآزمایی؛ 3474 زن). تفاوت آشکاری برای موربیدیتی جدی مادر (RR: 0.93؛ 95% CI؛ 0.61 تا 1.42؛ 1 کارآزمایی؛ 3474 زن؛ شواهد با کیفیت پائین)، یا استفاده از اپیدورال (میانگین RR: 0.95؛ 95% CI؛ 0.87 تا 1.05؛ 3 کارآزمایی، 5168 زن؛ I² = 60%؛ شواهد با کیفیت پائین) وجود نداشت. تفاوت واضحی برای پذیرش در NICU (میانگین RR: 0.84؛ 95% CI؛ 0.50 تا 1.42؛ 3 کارآزمایی؛ 5170 نوزاد؛ I² = 71%؛ شواهد با کیفیت بسیار پائین) یا برای نمره آپگار پائین در پنج دقیقه (RR: 1.19؛ 95% CI؛ 0.71 تا 1.99؛ 3 کارآزمایی؛ 5170 نوزاد؛ I² = 0%؛ شواهد با کیفیت پائین) وجود نداشت.
یک مطالعه (5002 زن)، مراقبت ساختار یافته یکبهیک را در لیبر زودهنگام در برابر مراقبت معمول مورد بررسی قرار داد. مدت زمان لیبر گزارش نشد. تفاوت واضحی بین گروهها برای زایمان سزارین (RR: 0.93؛ 95% CI؛ 0.84 تا 1.02؛ 4996 زن؛ شواهد با کیفیت بالا)، زایمان واژینال با کمک ابزار (RR: 0.94؛ 95% CI؛ 0.82 تا 1.08؛ 4996 زن؛ شواهد با کیفیت بالا)، یا موربیدیتی جدی مادر (RR: 1.13؛ 95% CI؛ 0.84 تا 1.52؛ 4996 زن؛ شواهد با کیفیت بالا) وجود نداشت. استفاده از اپیدورال در دو گروه مشابه بود (RR: 1.00؛ 95% CI؛ 0.99 تا 1.01؛ 4996 زن؛ شواهد با کیفیت بالا). برای پیامدهای نوزادی، تفاوت واضحی بین گروهها وجود نداشت (پذیرش در NICU: RR: 0.98؛ 95% CI؛ 0.80 تا 1.21؛ 4989 نوزاد؛ شواهد با کیفیت بالا؛ نمره آپگار پائین در پنج دقیقه: RR: 1.07؛ 95% CI؛ 0.64 تا 1.79؛ 4989 نوزاد؛ شواهد با کیفیت متوسط).
یک کارآزمایی خوشهای تصادفیسازی شده با 2183 زن، یک ابزار تشخیص لیبر را که توسط ماماها استفاده شد در مقایسه با ارزیابی معمول مورد بررسی قرار داد. برای بسیاری از پیامدهای اندازهگیری شده تفاوت واضحی بین گروهها وجود نداشت. مداخلات در لیبر (تقویت با اکسیتوسین) (RD: 0.3؛ 95% CI؛ 9.2‐ تا 9.8)، اپیدورال (RD: 2.1؛ 95% CI؛ 8.0‐ تا 12.2)، زایمان با کمک ابزار یا سزارین (زایمان ورتکس (vertex) خودبهخودی RD: ‐3.2؛ 95% CI؛ 15.1‐ تا 8.7)) پس از تعدیل بر اساس تفاوتهای خط پایه بین واحدهای زایمان، بین گروهها مشابه بود. زنان در گروه مداخله کمتر احتمال داشت که در اولین مراجعه در بیمارستان بستری شوند. تفاوت آشکاری بین گروهها برای پیامد نوزادی وجود نداشت.
نتیجهگیریهای نویسندگان
ارزیابی و حمایت از لیبر زودهنگام تاثیر واضحی بر نرخ زایمان سزارین یا زایمان با کمک ابزار، یا زایمان پیش از رسیدن به بیمارستان نداشت. با این حال، برخی شواهد نشان دادند که مداخلات ممکن است بر کاهش استفاده از اپیدورال، و افزایش رضایت مادران از مراقبت تاثیر داشته باشد. شواهد مربوط به استفاده از اکسیتوسین برای افزایش لیبر ترکیب شدند. شواهد مربوط به اثربخشی ارزیابی لیبر زودهنگام در برابر پذیرش فوری بسیار محدود بود و پژوهش بیشتری در این زمینه مورد نیاز است.
PICO
خلاصه به زبان ساده
نقش ارزیابی و حمایت در طول لیبر زودهنگام برای بهبود پیامدهای زایمان
موضوع چیست؟
پیشرفت لیبر زودهنگام ممکن است آهسته باشد. زنان شروع لیبر را از روی علائم مختلفی شناسایی میکنند از جمله انقباضات دردناک و از دست دادن لکه خون واژینال، ممکن است در مورد پیشرفت لیبر و برای اطمینان از متخصصین سلامت مشاوره دریافت کنند. ممکن است به زنان توصیه شود که تا زمانی که امکانپذیر است در خانه بمانند، یا از بیمارستان به خانه منتقل شوند، به این دلیل که لیبر آنها شروع نشده است. با این حال، اگر پیشرفت در لیبر سریعتر از حد انتظار باشد، تاخیر در پذیرش ممکن است منجر به زایمان ناخواسته در خانه شود.
چرا این موضوع مهم است؟
زنان ممکن است در لیبر زودهنگام احساس اضطراب یا ناراحتی کنند و اعتماد به نفس خود را از دست بدهند؛ این مرحله ممکن است به آرامی پیشرفت کند و احتمال زیادی وجود دارد که زنان زایمان طبیعی را تجربه کنند. در این مرور ما این موضوع را بررسی کردیم که ارزیابی و حمایت از زنان در طول لیبر زودهنگام طول مدت لیبر، نیاز به مداخلات و پیامدهای دیگر را تحت تاثیر قرار میدهد یا خیر.
ما چه شواهدی به دست آوردیم؟
منابع علمی پزشکی (31 اکتبر 2016) را جستوجو کردیم. پنج کارآزمایی تصادفیسازی و کنترل شده را، شامل 10,421 زن از کانادا، ایالات متحده آمریکا، و انگلستان و یک کارآزمایی را که در آن واحدهای مادران در اسکاتلند انگلستان با 2183 زن تصادفیسازی شدند، وارد مرور کردیم. کیفیت شواهد برای پیامدهای مختلف بین بسیار پائین تا بالا درجهبندی شد.
یک کارآزمایی (209 زن) ارزیابی با پذیرش مستقیم را در زنانی که به بیمارستان رسیدند مقایسه کرد. زنان در گروه ارزیابی، لیبرهای کوتاهتری در بیمارستان داشتند (شواهد با کیفیت پائین). تفاوت واضحی بین گروهها برای زایمان سزارین یا زایمان واژینال با کمک ابزار (یعنی فورسپس یا ونتوس (ventouse) وجود نداشت (شواهد با کیفیت بسیار پائین). عوارض جدی گزارش نشده بود. زنان در گروه ارزیابی اندکی کمتر احتمال داشت که اپیدورال (شواهد با کیفیت پائین)، یا تقویت لیبر با اکسیتوسین (oxytocin) داشته باشند، و رضایت بیشتری از مراقبت داشتند. هیچ نوزادی پیش از بستری شدن در بیمارستان متولد نشده بودند. پذیرش در بخش مراقبتهای ویژه نوزادان گزارش نشد.
سه مطالعه، حمایت ماما را در خانه در برابر تریاژ تلفنی مورد بررسی قرار دادند. در یک کارآزمایی به نظر میرسد که ویزیت در خانه تاثیر واضحی بر طول مدت لیبر نداشت (شواهد با کیفیت پائین). تفاوت آشکاری بین گروهها برای زایمان سزارین (سه کارآزمایی، شواهد با کیفیت متوسط) یا زایمان واژینال با کمک ابزار (دو کارآزمایی، شواهد با کیفیت پائین) وجود نداشت. یک کارآزمایی زایمان پیش از رسیدن به بیمارستان را گزارش کرد؛ تفاوت واضحی برای این پیامد یا برای موربیدیتی جدی مادری (شواهد با کیفیت پائین)، یا استفاده از اپیدورال (سه کارآزمایی، شواهد با کیفیت پائین) وجود نداشت. تفاوتهای واضحی برای پذیرش نوزاد در بخش مراقبتهای ویژه (شواهد با کیفیت بسیار پائین)، یا برای نمره پنج دقیقهای آپگار پائین پس از زایمان (شواهد با کیفیت پائین) وجود نداشت.
در یک مطالعه با 5002 زن، مراقبت ساختار یافته یکبهیک در لیبر زودهنگام در برابر مراقبت معمول مورد بررسی قرار گرفت. مدت زمان لیبر گزارش نشد. تفاوت واضحی میان گروهها برای نرخ سزارین، زایمان واژینال با کمک ابزار (شواهد با کیفیت بالا)، یا موربیدیتی جدی مادری (شواهد با کیفیت متوسط) وجود نداشت. استفاده از اپیدورال در دو گروه مشابه بود (شواهد با کیفیت بالا). برای پیامدهای نوزادی، تفاوت واضحی بین گروهها برای پذیرش در بخش مراقبتهای ویژه (شواهد با کیفیت بالا) یا نمره آپگار پائین (شواهد با کیفیت متوسط) وجود نداشت.
یک کارآزمایی با 2183 زن که در آن واحدهای زایمان تصادفیسازی شده بودند معیارهای بسیار دقیقی را برای تشخیص لیبر در مقایسه با ارزیابی معمول مامایی بررسی کردند. برای اغلب پیامدها، تفاوتهای واضحی میان زنان و نوزادان در دو گروه وجود نداشت. مداخلات در لیبر (تقویت با اکسیتوسین، اپیدورال، زایمان با کمک ابزار یا سزارین) مشابه بود، در حالی که تفاوتهای خط پایه بین واحدهای زایمانی در نظر گرفته شد. زنان در گروه مداخله کمتر احتمال داشت که در مراجعه اول برای لیبر در بیمارستان بستری شوند. تفاوت واضحی میان گروهها برای پیامدهای نوزادی وجود نداشت.
این یافتهها چه معنایی دارند؟
ارزیابی و حمایت در لیبر زودهنگام تاثیر بارزی بر نرخ زایمان سزارین یا واژینال با کمک ابزار، یا بر اینکه نوزادان پیش از رسیدن به بیمارستان متولد میشوند یا خیر، ندارد. با این حال، برخی از شواهد نشان داد که این مداخلات ممکن است کاهش استفاده از اپیدورال، نیاز به تقویت لیبر با اکسیتوسین و افزایش رضایت مادران را تحت تاثیر قرار دهد. شواهد مربوط به اثربخشی ارزیابی لیبر زودهنگام در برابر پذیرش فوری بسیار محدود بود و پژوهش بیشتری در این زمینه مورد نیاز است.
Authors' conclusions
Summary of findings
| Assessment compared with direct admission in early labour for improving birth outcomes | ||||||
| Patient or population: healthy pregnant women | ||||||
| Outcomes | Anticipated absolute effects* (95% CI) | Relative effect | № of participants | Quality of the evidence | Comments | |
| Risk with direct admission in early labour | Risk with assessment | |||||
| Length of labour (hours) | The mean length of labour (hours) was 8.3 hours in the intervention group and 13.5 hours in the control group | MD 5.2 lower | ‐ | 209 | ⊕⊕⊝⊝ | This outcome relates to the length of labour in hospital |
| Rate of caesarean section | Study population | RR 0.72 | 209 | ⊕⊝⊝⊝ | ||
| 106 per 1000 | 76 per 1000 | |||||
| Rate of instrumental vaginal birth | Study population | RR 0.86 | 209 | ⊕⊝⊝⊝ | ||
| 356 per 1000 | 306 per 1000 | |||||
| Serious maternal morbidity | Study population | ‐ | (0 RCTs) | ‐ | Serious maternal morbidity was not reported | |
| see comment | See comment | |||||
| Use of epidural or any regional anaesthesia | Study population | RR 0.87 | 209 | ⊕⊕⊝⊝ | ||
| 904 per 1000 | 786 per 1000 | |||||
| Neonatal admission to special care | Study population | |||||
| see comment | See comment | |||||
| Apgar score < 7 at 5 minutes | Study population | RR 2.97 | 209 | ⊕⊝⊝⊝ | ||
| 0 per 1000 | 0 per 1000 | |||||
| *The risk in the intervention group (and its 95% confidence interval) is based on the assumed risk in the comparison group and the relative effect of the intervention (and its 95% CI). | ||||||
| GRADE Working Group grades of evidence | ||||||
| 1 Single trial with design limitations (lack of blinding) (‐1) 2 Single trial with small sample size (‐1) 3 Wide 95% CI crossing the line of no effect and small sample size (‐2) 4 Wide 95% CI crossing the line of no effect, small sample size and low event rate (‐2) | ||||||
| Home support compared with telephone triage for improving birth outcomes | ||||||
| Patient or population: healthy pregnant women | ||||||
| Outcomes | Anticipated absolute effects* (95% CI) | Relative effect | № of participants | Quality of the evidence | Comments | |
| Risk with telephone triage | Risk with home support | |||||
| Length of labour (hours) | The mean length of labour (hours) was 9.66 in the intervention group and 9.37 in the control group | MD 0.29 higher | ‐ | 3474 | ⊕⊕⊝⊝ | Criteria for start of labour were not clearly described |
| Rate of caesarean section | Study population | RR 1.05 | 5170 | ⊕⊕⊕⊝ | ||
| 215 per 1000 | 226 per 1000 | |||||
| Rate of instrumental vaginal birth | Study population | RR 0.95 | 4933 | ⊕⊕⊝⊝ | ||
| 233 per 1000 | 222 per 1000 | |||||
| Serious maternal morbidity | Study population | RR 0.93 | 3474 | ⊕⊕⊝⊝ | ||
| 25 per 1000 | 23 per 1000 | |||||
| Use of epidural or any regional anaesthesia | Study population | RR 0.95 | 5168 | ⊕⊕⊝⊝ | ||
| 505 per 1000 | 480 per 1000 | |||||
| Neonatal admission to special care | Study population | RR 0.84 | 5170 | ⊕⊝⊝⊝ | ||
| 58 per 1000 | 49 per 1000 | |||||
| Apgar score < 7 at 5 minutes | Study population | RR 1.19 | 5170 | ⊕⊕⊝⊝ | ||
| 10 per 1000 | 12 per 1000 | |||||
| *The risk in the intervention group (and its 95% confidence interval) is based on the assumed risk in the comparison group and the relative effect of the intervention (and its 95% CI). | ||||||
| GRADE Working Group grades of evidence | ||||||
| 1 Study with design limitations (lack of blinding) (‐1) 2 Wide 95% CI crossing line of no effect (‐1) 3 All studies contributing data had design limitations (lack of blinding) (‐1) 4 High heterogeneity (I2 69%) (‐1) 5 High heterogeneity (I2 60%) (‐1) 6 High heterogeneity (I2 71%) (‐1) | ||||||
| One‐to‐one structured care compared to usual care for improving birth outcomes | ||||||
| Patient or population: healthy pregnant women | ||||||
| Outcomes | Anticipated absolute effects* (95% CI) | Relative effect | № of participants | Quality of the evidence | Comments | |
| Risk with usual care | Risk with one‐to‐one structured care | |||||
| Length of labour (hours) | ‐ | See comment | ‐ | (0 study) | ‐ | Not reported |
| Rate of caesarean section | Study population | RR 0.93 | 4996 | ⊕⊕⊕⊕ | ||
| 242 per 1000 | 225 per 1000 | |||||
| Rate of instrumental vaginal birth | Study population | RR 0.94 | 4996 | ⊕⊕⊕⊕ | ||
| 145 per 1000 | 136 per 1000 | |||||
| Serious maternal morbidity | Study population | RR 1.13 | 4996 | ⊕⊕⊕⊝ | ||
| 32 per 1000 | 36 per 1000 | |||||
| Use of epidural or any regional anaesthesia | Study population | RR 1.00 | 4996 | ⊕⊕⊕⊕ | ||
| 955 per 1000 | 955 per 1000 | |||||
| Neonatal admission to special care | Study population | RR 0.98 | 4989 | ⊕⊕⊕⊕ | ||
| 69 per 1000 | 67 per 1000 | |||||
| Apgar score < 7 at 5 minutes | Study population | RR 1.07 | 4989 | ⊕⊕⊕⊝ | ||
| 11 per 1000 | 12 per 1000 | |||||
| *The risk in the intervention group (and its 95% confidence interval) is based on the assumed risk in the comparison group and the relative effect of the intervention (and its 95% CI). | ||||||
| GRADE Working Group grades of evidence | ||||||
| 1 Wide 95% CI crossing line of no effect (‐1) | ||||||
Background
Description of the condition
In clinical practice, the first stage of labour is usually the longest stage and consists of two phases: the latent phase (early labour) and the active phase. The latent phase has been described as "a period of time when there are painful contractions, and there is some cervical change, including cervical dilatation up to 4 cm" (NICE 2007).
The progress of labour in the latent phase is usually slow and may include painful uterine contractions. Women may feel distressed and lose their confidence during this phase (Austin 1999). Distressed feelings, loneliness, or anxiety may theoretically trigger the secretion of catecholamines that counteract the effect of oxytocin (Lederman 1979; Simkin 2011), and slow down the progress of labour (Alehagen 2005). Therefore, maternal distress could be associated with prolongation of the latent and active phases and the second stage of labour. Emotional distress in the latent phase increases the likelihood of instrumental vaginal birth, and women with higher levels of pain in the latent phase may be less likely to experience spontaneous vaginal delivery (Wuitchik 1989).
Although it is difficult to determine exactly when labour begins, it is usually thought to start at the point where regular uterine contractions are perceptible to women (Friedman 1972). Gross 2003 investigated how women experienced the onset of labour and found that women identified onset from various signs and symptoms including recurrent or non‐recurrent pain, rupture of the amniotic membranes, the appearance of blood stained vaginal discharge, gastrointestinal symptoms, altered sleep patterns, and emotional upheaval. Some women reported that labour began several days before the baby was born (Gross 2006).
Cheyne 2007 found that labouring women decided to go to hospital because of painful contractions, the need for reassurance, or when following their partner's advice; the combination of pain, uncertainty and anxiety influenced women's decisions in the latent phase of labour. Women admitted to the labour ward during early labour tended to show an urgency to place the responsibility for the labour into the hands of professionals (Carlsson 2009).
Because of an association between early admission and subsequent interventions (including caesarean section, labour augmentation, and epidural analgesia) (Bailit 2005; Hemminki 1986; Holmes 2001; Klein 2004; Petersen 2013; Rahnama 2006), women are advised by midwives to stay at home as long as possible during the latent phase, or are sent home because their labour is not established. Flamm 1998 recommended the avoidance of hospital admissions for 'false' labour in order to reduce the rates of caesarean section. However, it is unclear whether avoiding admission or being sent home during the latent phase might result in better outcomes. The effect of deferred admission on the rate of caesarean sections has not been clearly established in randomized trials, but negative effects of deferring admission have been highlighted in observational studies, including confusion, anger, and resentment (Jackson 2003), as well as stress and feelings of being neglected among both women and their partners (Baxter 2007). Barnett 2008 interviewed six nulliparous women in Scotland who were sent home in the latent phase of labour. The women reported that they had felt unsupported and their anxiety had increased after being sent home. If the progress of labour is more rapid than expected, the policy of delayed admission might result in an unplanned home birth and a baby born before arrival (at hospital), which increases the risk of both maternal and neonatal complications (Loughney 2006).
Description of the intervention
In this review, support interventions are defined as non‐pharmacological interventions that support pregnant women during early labour, including: relaxation or stress management training and education; professional or lay visits at home, telephone‐based peer support; educational counselling; non‐directive counselling; comfort measures and various other supportive interventions. Assessment interventions are interventions delivered at home or in hospital to determine the stage of labour and progress in labour, and to assess how well women are coping, as well as their physical and psychological well‐being, in order to plan labour management (including immediate or delayed admission to hospital). Intervention providers are health professionals such as nurses, midwives, childbirth educators, physicians, or psychologists, or lay people, who deliver interventions at hospital, at home, or via telephone (see Types of interventions).
How the intervention might work
During early labour, women are encouraged to keep active, to walk about and to eat and drink as usual in order to prevent prolonged labour. Some women are advised to stay at home for as long as possible. This advice, or being asked to return home, may cause some women to feel unsupported and more anxious, and such feelings might affect the progress of their labour adversely (Wuitchik 1989), and also their satisfaction with childbirth. In the latent phase of labour, women seek out the advice of health professionals to address their need for information about the progress of their labour and reassurance that what they are experiencing is normal. Professional home visits, lay home visits, or telephone‐based peer support during early labour may give assurance to women and relieve their anxiety and distress. Early labour assessment by midwives or doctors may result in the reduction of unnecessary admissions during the latent phase, which in turn might improve obstetric outcomes. Educational information about the patterns of spontaneous labour may influence women's decision making about when to go to hospital. Support and encouragement, relaxation or stress management techniques might improve women's ability to cope with labour (Hodnett 1996). Provision of emotional support, comfort measures, information and advice, advocacy and support of the woman's partner by healthcare providers might encourage women to cope with their labour. This might relieve their anxiety, fear and stress and so avoid an unnecessary cascade of obstetric interventions, and improve obstetric and neonatal outcomes. Overall, the rates of prolonged labour, caesarean section, or instrumental vaginal birth might decrease.
Why it is important to do this review
Several Cochrane Reviews have assessed the effectiveness of support or psychosocial interventions for women at high risk of complications, such as women undergoing treatment for alcohol abuse during pregnancy (Lui 2008), antenatal depression (Dennis 2007b), postpartum depression (Dennis 2007a; Dennis 2013), and maternal smoking cessation (Chamberlain 2013). More generally, supportive interventions have been found to be effective for reducing emotional distress and improving coping abilities in people who have been treated for cancer, HIV/AIDS and cardiovascular disease (Fekete 2007; Vos 2006).
Existing Cochrane Reviews have also assessed educational interventions such as self‐diagnosis of the onset of active labour at term (Lauzon 1998), and delayed admission until active labour (Lauzon 2001). This review will update and replace the Lauzon 2001 review which is now out of date. In addition, in this review we aim to investigate systematically whether assessment, support and educational interventions in the early stages of labour (latent phase) are effective in improving maternal and neonatal outcomes.
Objectives
To investigate the effect of assessment and support interventions for women during early labour on the duration of labour, the rate of obstetric interventions, and on other maternal and neonatal outcomes.
Methods
Criteria for considering studies for this review
Types of studies
We included all published and unpublished randomized controlled trials and cluster randomised trials that evaluated the efficacy of early labour assessment interventions and any support intervention for women in the latent phase of labour. We included studies published in abstract form only, if the abstract contained sufficient information to assess eligibility and risk of bias, and if the results were described in detail. We did not include quasi‐randomised trials.
Types of participants
We included pregnant women in this review. However, we excluded trials with participants who were high‐risk pregnant women, such as those with mental health conditions (Fenwick 2015; Jesse 2015; Toohill 2014).
Types of interventions
We included trials examining assessment programmes in early labour that aimed to assess physical and emotional well‐being and progress in labour with a view to planning hospital admission, along with support interventions in early labour to optimise outcomes for women and babies.
We included interventions that were provided either by healthcare professionals caring for labouring women (e.g. physicians, nurses, or midwives), or by a trained female companion (e.g. doula). Both individual or group interventions were included. We included interventions that were administered at the maternity unit, the woman's home, over the telephone, online (e.g. websites or social media), or via electronic devices.
Examples of assessment in early labour include:
-
home or hospital physical examination by health professional to assess stage of labour;
-
home, hospital or telephone assessment of progress in labour (by maternal report);
-
home, hospital or telephone assessment of psychological well‐being.
Each of these types of assessment might include advice to women about when to seek hospital admission.
Examples of support that encompass psychosocial interventions in early labour include:
-
psychosocial supportive interventions (e.g. emotional support for the labouring woman and her birth companions, advice and guidance about her labour, attention to physical comfort, non‐directive counselling, maintaining conversation, telephone‐based peer support, counselling visits at home);
-
cognitive behavioural therapy (CBT), cognitive and behavioural interventions (e.g. mental image training, stress reduction program, relaxation training program);
-
exercise therapies (e.g. exercise program, fitness, physical activity);
-
non‐pharmacological alternative strategies (e.g. acupuncture, Reiki, hypnosis, guided imagery, meditation);
-
comfort measures (e.g. massage, aromatherapy, or music therapy).
Support also encompasses educational interventions. These aim to distribute new knowledge or promote coping skills to pregnant women, such as information about the progress of labour, managing the latent phase, or when to go to the labour ward. Examples of educational interventions include:
-
information about relaxation;
-
information about coping with labour pain;
-
information about labour progress.
Interventions were compared to no intervention, other interventions or usual care. Usual care was defined as the care that might be provided to pregnant women if they were not included in the clinical trial.
We included combined interventions that consisted of two or more types of interventions in this review (for example, interventions including both assessment and support). We excluded studies that included support interventions combined with pharmacological treatments. We excluded any educational interventions that provided women with information without any personal contact and communication, e.g. giving women a booklet. We did not apply any language restrictions.
Types of outcome measures
Primary outcomes
Maternal outcomes
-
Length of labour
-
Rate of caesarean section or instrumental vaginal birth
Neonatal outcomes
-
Baby born before arrival at hospital or in an unplanned home birth
Secondary outcomes
Maternal outcomes
-
Serious maternal morbidity (e.g. uterine rupture, admission to intensive care unit, septicaemia, postpartum haemorrhage (defined by trialist))
-
Augmentation of labour
-
Use of epidural or any regional anaesthesia
-
Prolonged labour (defined by trialist)
-
Duration of hospital stay (antenatal, postnatal)
-
Maternal satisfaction (intrapartum, postpartum) with the childbirth (defined by trialist)
-
Postpartum depression (defined by trialist)
Neonatal outcomes
-
Perinatal death (stillbirth or early neonatal death)
-
Neonatal admission to special care and/or intensive care unit
-
Apgar score of less than seven at five minutes
-
Exclusive breastfeeding at discharge
-
Exclusive breastfeeding at three months
Search methods for identification of studies
The methods section of this review is based on a standard template used by Cochrane Pregnancy and Childbirth.
Electronic searches
We searched the Cochrane Pregnancy and Childbirth's Trials Register by contacting their Information Specialist (31 October 2016).
The Register is a database containing over 23,000 reports of controlled trials in the field of pregnancy and childbirth. For full search methods used to populate Pregnancy and Childbirth’s Trials Register, including the detailed search strategies for CENTRAL, MEDLINE, Embase and CINAHL, the list of handsearched journals and conference proceedings, and the list of journals reviewed via the current awareness service, please follow this link to the editorial information about the Cochrane Pregnancy and Childbirth in the Cochrane Library and select the ‘Specialized Register ’ section from the options on the left side of the screen.
Briefly, the Cochrane Pregnancy and Childbirth's Trials Register is maintained by their Information Specialist and contains trials identified from:
-
monthly searches of the Cochrane Central Register of Controlled Trials (CENTRAL);
-
weekly searches of MEDLINE (Ovid);
-
weekly searches of Embase (Ovid);
-
monthly searches of CINAHL (EBSCO);
-
handsearches of 30 journals and the proceedings of major conferences;
-
weekly current awareness alerts for a further 44 journals, plus monthly BioMed Central email alerts.
Search results are screened by two people and the full text of all relevant trial reports identified through the searching activities described above is reviewed. Based on the intervention described, each trial report is assigned a number that corresponds to a specific Pregnancy and Childbirth review topic (or topics), and is then added to the Register. The Information Specialist searches the Register for each review using this topic number rather than keywords. This results in a more specific search set, which has been fully accounted for in the relevant review sections (Included studies; Excluded studies).
In addition, we searched ClinicalTrials.gov and the World Health Organization (WHO) International Clinical Trials Registry Platform (ICTRP) for unpublished, planned and ongoing trial reports (31 Octoer 2016) (see: Appendix 1).
Searching other resources
We contacted key personnel and organisations in the relevant field for published and unpublished references.
We also searched the reference lists of retrieved studies.
We did not apply any language or date restrictions.
Data collection and analysis
The following methods section of this review was based on a standard template used by Cochrane Pregnancy and Childbirth.
Selection of studies
Review authors S Kobayashi (SK) and K Takehara (KT), independently assessed full text of all potential studies identified as a result of the search strategy for inclusion. We resolved any disagreement through discussion or, if required, we consulted the third review author, H Sasaki (HS).
We created a study flow diagram to map out the number of records identified, included and excluded (Figure 1).

Study flow diagram.
Data extraction and management
We designed a form to extract data. For eligible studies, two review authors extracted data using the agreed form. We resolved discrepancies through discussion or, if required, we consulted the third review author. Data were entered into Review Manager 5.3 software (RevMan 2014), and checked for accuracy.
When information regarding any of the above was unclear, for example only an abstract was available, we attempted to contact the authors of the original reports to ask them to provide further details.
Assessment of risk of bias in included studies
We (SK, KT) independently assessed risk of bias for each study using the criteria outlined in the Cochrane Handbook for Systematic Reviews of Interventions (Higgins 2011). Any disagreement was resolved by discussion or by involving a third assessor (HS).
(1) Random sequence generation (checking for possible selection bias)
For each included study we described the method used to generate the allocation sequence in sufficient detail to allow an assessment of whether it should produce comparable groups.
We assessed the method as being at:
-
low risk of bias (any truly random process, e.g. random number table; computer random number generator);
-
high risk of bias (any non‐random process, e.g. odd or even date of birth; hospital or clinic record number);
-
unclear risk of bias.
(2) Allocation concealment (checking for possible selection bias)
For each included study we described the method used to conceal allocation to interventions prior to assignment and assessed whether intervention allocation could have been foreseen in advance of, or during recruitment, or changed after assignment.
We assessed the methods as being at:
-
low risk of bias (e.g. telephone or central randomisation; consecutively numbered sealed opaque envelopes);
-
high risk of bias (open random allocation; unsealed or non‐opaque envelopes, alternation; date of birth);
-
unclear risk of bias.
(3.1) Blinding of participants and personnel (checking for possible performance bias)
For each included study we described the methods used, if any, to blind study participants and personnel from knowledge of which intervention a participant received. We considered that studies were at low risk of bias if they were blinded, or if we judged that the lack of blinding unlikely to affect results. We assessed blinding separately for different outcomes or classes of outcomes.
We assessed the methods as being at:
-
low, high or unclear risk of bias for participants;
-
low, high or unclear risk of bias for personnel.
(3.2) Blinding of outcome assessment (checking for possible detection bias)
For each included study we described the methods used, if any, to blind outcome assessors from knowledge of which intervention a participant received. We assessed blinding separately for different outcomes or classes of outcomes.
We assessed methods used to blind outcome assessment as being at:
-
low risk of bias;
-
high risk of bias;
-
unclear risk of bias.
(4) Incomplete outcome data (checking for possible attrition bias due to the amount, nature and handling of incomplete outcome data)
For each included study, and for each outcome or class of outcomes, we described the completeness of data including attrition and exclusions from the analysis. We stated whether attrition and exclusions were reported and the numbers included in the analysis at each stage (compared with the total randomized participants), reasons for attrition or exclusion where reported, and whether missing data were balanced across groups or were related to outcomes. Where sufficient information was reported, or could be supplied by the trial authors, we planned to re‐include missing data in the analyses which we undertook.
We assessed methods as being at:
-
low risk of bias (e.g. no missing outcome data; missing outcome data balanced across groups);
-
high risk of bias (e.g. numbers or reasons for missing data imbalanced across groups; ‘as treated’ analysis done with substantial departure of intervention received from that assigned at randomisation);
-
unclear risk of bias.
(5) Selective reporting (checking for reporting bias)
For each included study we described how we investigated the possibility of selective outcome reporting bias and what we found.
We assessed the methods as being at:
-
low risk of bias (where it is clear that all of the study’s pre‐specified outcomes and all expected outcomes of interest to the review have been reported);
-
high risk of bias (where not all the study’s pre‐specified outcomes have been reported; one or more reported primary outcomes were not pre‐specified; outcomes of interest are reported incompletely and so cannot be used; study fails to include results of a key outcome that would have been expected to have been reported);
-
unclear risk of bias.
(6) Other bias (checking for bias due to problems not covered by (1) to (5) above)
For each included study we described any important concerns we had about other possible sources of bias.
(7) Overall risk of bias
We made explicit judgements about whether studies were at high risk of bias, according to the criteria given in the Cochrane Handbook for Systematic Reviews of Interventions (Higgins 2011). With reference to (1) to (6) above, we planned to assess the likely magnitude and direction of the bias and whether we considered it is likely to have an impact on the findings. In future updates, we will explore the impact of the level of bias through undertaking sensitivity analyses ‐ seeSensitivity analysis.
Assessment of the quality of the evidence using the GRADE approach
For this update, we assessed the quality of the evidence using the GRADE approach as outlined in the GRADE handbook. We assessed the quality of the body of evidence relating to the following outcomes for the main comparisons (i.e. assessment versus direct admission in labour; home support versus telephone triage, and one‐to‐one structured care versus usual care).
-
Length of labour
-
Rate of caesarean section
-
Rate of instrumental vaginal birth
-
Serious maternal morbidity (e.g. postpartum haemorrhage)
-
Use of epidural or any regional anaesthesia
-
Neonatal admission to special care or intensive care unit, or both
-
Apgar score of less than seven at five minutes
We used the GRADEpro Guideline Development Tool to import data from Review Manager 5.3 (RevMan 2014) in order to create 'Summary of findings' tables. We produced a summary of the intervention effect and a measure of quality for each of the above outcomes using the GRADE approach. The GRADE approach uses five considerations (study limitations, consistency of effect, imprecision, indirectness and publication bias) to assess the quality of the body of evidence for each outcome. The evidence can be downgraded from 'high quality' by one level for serious (or by two levels for very serious) limitations, depending on assessments for risk of bias, indirectness of evidence, serious inconsistency, imprecision of effect estimates or potential publication bias.
Measures of treatment effect
Dichotomous data
For dichotomous data, we presented pooled results as summary risk ratios with 95% confidence intervals.
Continuous data
We used the mean difference if outcomes were measured in the same way between pooled trials. In future updates, if appropriate, we will use the standardised mean difference to combine trials that measured the same outcome, but used different methods.
Unit of analysis issues
Cluster‐randomised trials
We included a cluster‐randomised trials in the analyses along with individually‐randomised trials. In future updates, we had intended to adjust the event rates and sample sizes using the methods described in the Cochrane Handbook for Systematic Reviews of Interventions. However, we were unable to obtain an estimate of the intracluster correlation co‐efficient (ICC) derived from the trial, or from a similar trial or a study of a similar population. We have therefore presented unadjusted figures in our data and analyses which do not take into account the cluster design effect.
Multi‐armed trials
If we identify eligible multi‐armed trials in future updates, we will include them in the analyses. We will combine all relevant interventions into a single group and incorporate all relevant control groups into a single group so that we create single pair‐wise comparisons as recommended in the Cochrane Handbook for Systematic Reviews of Interventions (Section 16.5.4) (Higgins 2011).
Dealing with missing data
We noted the levels of attrition of included studies. In future updates, if more eligible studies are included, we will explore the impact of including studies with high levels of missing data in the overall assessment of treatment effect by using sensitivity analysis.
For all outcomes, we carried out analyses, as far as possible, on an intention‐to‐treat basis, that is, we attempted to include all participants randomized to each group in the analyses. The denominator for each outcome in each trial was the number randomized minus any participants whose outcomes were known to be missing.
Assessment of heterogeneity
We assessed statistical heterogeneity in each meta‐analysis using the Tau², I² and Chi² statistics. We regarded heterogeneity as substantial if I² was greater than 30% and either Tau² was greater than zero, or there was a low P value (less than 0.10) in the Chi² test for heterogeneity. If we identified substantial heterogeneity (above 30%), we planned to explore it by prespecified subgroup analysis.
Assessment of reporting biases
In future updates, if there are 10 or more studies in the meta‐analysis, we will investigate reporting biases (such as publication bias) using funnel plots. We will assess funnel plot asymmetry visually. If asymmetry is suggested by a visual assessment, we will perform exploratory analyses to investigate it.
Data synthesis
We carried out statistical analysis using the Review Manager 5.3 software (RevMan 2014). We used fixed‐effect meta‐analysis for combining data where it was reasonable to assume that studies were estimating the same underlying treatment effect, that is, where trials were examining the same intervention, and the trials’ populations and methods were judged to be sufficiently similar.
If clinical heterogeneity was sufficient to lead us to expect that the underlying treatment effects differed between trials, or if substantial statistical heterogeneity was detected, we used random‐effects meta‐analysis to produce an overall summary, where we considered an average treatment effect across trials to be clinically meaningful. The random‐effects summary was treated as the average range of possible treatment effects, and we have discussed the clinical implications of treatment effects differing between trials. If we considered that the average treatment effect was not clinically meaningful, we planned not to combine trials. When we have used random‐effects analyses, the results have been presented as the average treatment effect with 95% confidence intervals.
Subgroup analysis and investigation of heterogeneity
If we identified substantial heterogeneity, we planned to investigate it using subgroup analyses and sensitivity analyses and to consider whether an overall summary was meaningful. If it was, we planned to use random‐effects analysis to produce it.
We planned the following subgroup analyses:
-
the use of epidural or any regional anaesthesia by parity (nulliparity versus multiparity).
We were unable to carry out this planned subgroup analysis due to insufficient data.
In future updates if subgroup analysis is carried out, we will assess subgroup differences using interaction tests available within the current version of Review Manager. We will report the results of subgroup analyses quoting the Chi² statistic and P value, and the interaction test I² value.
Sensitivity analysis
We did not carry out a sensitivity analysis. However, in future updates of this review, we will perform sensitivity analysis to assess the affect of results due to the high risk of bias of some of the included trials. For the purpose of this sensitivity analysis, 'high quality' will be defined as a trial having a low risk of bias for random sequence generation and allocation concealment, and missing less than 20% of the data, given the stated importance of attrition as a quality measure (Tierney 2005). We will include only the primary outcome in the sensitivity analyses. If statistical heterogeneity is evident, we will carry out the sensitivity analysis to explore the effects of fixed‐effect or random‐effects analyses. Furthermore, if we made any assumptions for ICC values used in cluster‐randomised trials, we will perform a sensitivity analysis using a range of ICC values.
Results
Description of studies
Results of the search
See: Figure 1.
The search identified 36 reports. We screened out 13 (not randomised controlled trials (RCTs) or not within the scope of the review). As a result of reviewing the 23 remaining full texts, we included six trials (nine reports) in the analysis and excluded 14.
Included studies
The included trials were published between 1996 and 2008. Three trials had two reports each (Cheyne 2008; Janssen 2006; McNiven 1996). One trial was not a journal publication but a report for a national centre (ISRCTN11168521).
Design
Five studies were designed as RCTs. Four of these trials were multi‐centre, randomised trials (Hodnett 2008; ISRCTN11168521; Janssen 2003; Janssen 2006). One study was a cluster randomised trial; 14 maternity units in Scotland (UK) were randomised.
Sample sizes
The number of women randomised in the RCTs ranged from 209 to 5002. In the cluster randomised trial the sample included 2183 women (Cheyne 2008).
Setting
All trials were conducted in hospital settings. Three trials were conducted in Canada (Janssen 2003; Janssen 2006; McNiven 1996). The other trials were from the USA and UK (Hodnett 2008; ISRCTN11168521). The cluster randomised trial was conducted in Scotland (UK) (Cheyne 2008).
Participants
The participants of all studies were pregnant women. All trials focused on women in early labour (Cheyne 2008; Hodnett 2008; ISRCTN11168521; Janssen 2003; Janssen 2006; McNiven 1996). Five trials included only nulliparous women (Cheyne 2008; Hodnett 2008; ISRCTN11168521; Janssen 2006; McNiven 1996), and five trials clearly stated that they included only women who had a singleton fetus (Cheyne 2008; Hodnett 2008; ISRCTN11168521; Janssen 2003; Janssen 2006). One trial did not have an age limit for participation, and informed consent was obtained from a parent or guardian; participants as young as 14 years of age were included in the trial (Hodnett 2008). One trial did not describe eligibility regarding age (McNiven 1996). The other trials had a lower age limit, which was 16 years of age (Cheyne 2008; ISRCTN11168521; Janssen 2003; Janssen 2006).
Interventions and comparisons
The six trials assessed the impact of methods of assessment or special care for women in early labour (Cheyne 2008; Hodnett 2008; ISRCTN11168521; Janssen 2003; Janssen 2006; McNiven 1996). Of these, three trials reported the impact of an intervention for home visit assessment by health professionals versus telephone triage (Janssen 2003; Janssen 2006), while ISRCTN11168521 evaluated an intervention that involved a home visit by a community midwife that included advice, support, and encouragement versus usual care (telephone triage and direct admission). Hodnett 2008 evaluated structured early labour care by a midwife (one‐to‐one care) with support and encouragement versus usual care; McNiven 1996 compared early labour assessment with individually planned care versus immediate admission to hospital. In the cluster randomised trial midwives caring for women in the intervention group used an algorithm with strict criteria for labour diagnosis compared with women receiving routine care (Cheyne 2008).
Outcomes
The included trials focused on mode of delivery, analgesia, length of labour, and maternal and neonatal outcomes. One trial also assessed self‐diagnosis for onset of labour (Janssen 2006). Three trials evaluated women’s satisfaction and perception of care programs (Hodnett 2008; ISRCTN11168521; Janssen 2003).
Excluded studies
We excluded a total of 14 studies. Of these studies, five trials were not RCTs (Dowding 2011; IRCT138903063078N4; Janssen 2013; Lumluk 2011; Memon 2015), one trial included participants who were only at risk for depression (Werner 2016), one trial included participants who were not pregnant women but healthcare providers (Cheyne 2008a), and seven trials were excluded because the intervention or participants did not match our inclusion criteria (Bonovich 1990; Fenwick 2015; Jesse 2015; Karp 2013; Khooshide 2015; Magriples 2015; Toohill 2014; Zocco 2007).
Risk of bias in included studies
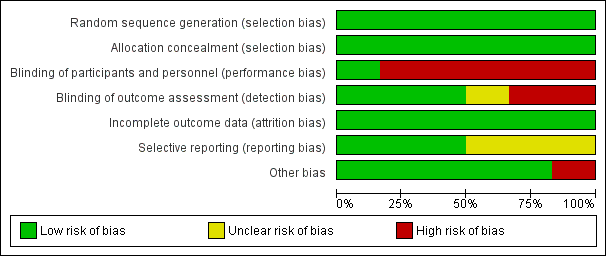
A risk‐of‐bias graph and summary can be found in Figure 2 and Figure 3.

Risk of bias graph: review authors' judgements about each risk of bias item presented as percentages across all included studies

Risk of bias summary: review authors' judgements about each risk of bias item for each included study
Allocation
Allocation sequence generation
We judged all five RCTs to be at a low risk of bias because they used appropriate methods for randomisation of participants, such as computer‐generated randomisation and sealed opaque envelopes (Hodnett 2008; ISRCTN11168521; Janssen 2003; Janssen 2006; McNiven 1996). In the cluster randomised trial methods of randomisation were also appropriate (Cheyne 2008).
Allocation concealment
We judged all RCTs to be at a low risk of bias because allocation of participants and investigators was concealed by use of sealed opaque envelopes and central allocation systems (Hodnett 2008; ISRCTN11168521; Janssen 2003; Janssen 2006; McNiven 1996). In the cluster trial the randomisation process was also judged to be low risk of bias (Cheyne 2008).
Blinding
Participants and personnel
Blinding of participants and care providers in these types of interventions was not easy because caregivers such as nurses, midwives, and physicians provided interventions or usual care to participants as required by the results of allocation. However, one trial had low risk of bias for this domain because objective data were collected as a part of routine practice (Hodnett 2008). We evaluated the remaining five studies as being at high risk (Cheyne 2008; ISRCTN11168521; Janssen 2003; Janssen 2006; McNiven 1996).
Outcome assessment
We assessed three trials as being at a low risk of bias because the outcome was not likely to be influenced by lack of blinding (Hodnett 2008; ISRCTN11168521; Janssen 2006). Two trials were not blinded and trialists highlighted that outcomes may have been influenced by lack of blinding (Janssen 2003; McNiven 1996). In the cluster randomised trial the effect of lack of blinding was not clear (Cheyne 2008).
Incomplete outcome data
We assessed all studies as being at a low risk of attrition bias as overall sample attrition was low and balanced across randomised groups (Cheyne 2008; Hodnett 2008; ISRCTN11168521; Janssen 2003; Janssen 2006; McNiven 1996). For the cluster randomised trial we were unable to obtain the information we needed to be able to adjust the results for cluster design effect and so we have presented raw data. The likely effect of adjustment would be to widen 95% CIs, so the results we have presented for this study should be interpreted with caution (Cheyne 2008).
Selective reporting
We assessed only three of the studies as being at a low risk of reporting bias (Cheyne 2008; Hodnett 2008; ISRCTN11168521). We judged the others to be at an unclear risk of bias because the reports provided insufficient information for us to make an informed decision.
Other potential sources of bias
We judged only one trial to have a high risk of bias for this domain because the compliance in the intervention group was very low (25.5%) (ISRCTN11168521). In the cluster randomised trial there was some imbalance between clusters at baseline but this was appropriately accounted for in the analysis (Cheyne 2008).The remaining trials did not have any apparent source of other bias.
Effects of interventions
See: Summary of findings for the main comparison Assessment compared to direct admission in early labour for improving birth outcomes; Summary of findings 2 Home support compared to telephone triage for improving birth outcomes; Summary of findings 3 One‐to‐one structured care compared to usual care for improving birth outcomes
Assessment in early labour versus direct admission (one trial with 209 women)
One trial with 209 participants is included in this comparison (McNiven 1996). In this trial women attending hospital with contractions were randomised to either assessment or direct admission to hospital. Women who were assessed were either admitted if labour was diagnosed, advised to go home or to go for a walk (with encouragement and education about when to return), or were advised to remain on the hospital premises and were reassessed at a later period.
Primary outcomes
Length of labour
Length of labour from the point of hospital admission was reported. Women in the early assessment group had a shorter time labouring in hospital (mean difference (MD) ‐5.20 hours, 95% confidence interval (CI) ‐7.06 to ‐3.34; 209 women; low‐quality evidence;Analysis 1.1). (Women in this study were also asked to estimate the duration of labour at home; women in the early assessment group estimated a longer period in labour at home. Data not shown.)
Rate of caesarean section or instrumental vaginal birth
There were no clear differences between groups for the number of women undergoing caesarean section (risk ratio (RR) 0.72, 95% CI 0.30 to 1.72; very low quality evidence; Analysis 1.2) or instrumental vaginal birth (RR 0.86, 95% CI 0.58 to 1.26, very low quality evidence;Analysis 1.3).
Baby born before arrival at hospital or unplanned home birth
No babies were born before hospital admission (Analysis 1.4).
Secondary outcomes
McNiven 1996 did not report serious maternal morbidity such as postpartum haemorrhage (loss of more than 1000 mL of blood), postnatal fever, blood transfusion and maternal death.
Women who had early labour assessment were less likely to receive oxytocin for labour augmentation (RR 0.57, 95% CI 0.37 to 0.86; Analysis 1.5), and were slightly less likely to have epidural anaesthesia (RR 0.87, 95% CI 0.78 to 0.98; low‐quality evidence;Analysis 1.6). Women in this group were also more satisfied with their care than women in the direct admission group (MD 16.00, 95% CI 7.53 to 24.47; Analysis 1.7).
Only one infant had a low Apgar score at five minutes after the birth (RR 2.97, 95% CI 0.12 to 72.12; very low quality evidence;Analysis 1.8).
Our other secondary outcomes (i.e. duration of hospital stay, postpartum depression, perinatal death, neonatal admission to special care, breastfeeding at discharge or at three months postpartum) were not reported.
Home assessment and support versus telephone triage (three studies with 5210 women)
Three studies are included in this comparison (ISRCTN11168521; Janssen 2003; Janssen 2006).
Primary outcomes
Length of labour
One trial reported the duration of labour (although it was not clear exactly how this outcome was assessed). Home visiting and assessment in early labour by midwives did not appear to have any clear impact on the length of labour compared with usual care (MD 0.29 hours, 95% CI ‐0.14 to 0.72; 1 trial, 3474 women; low‐quality evidence; Analysis 2.1).
Rate of caesarean section or instrumental vaginal birth
Three trials reported rate of caesarean section (ISRCTN11168521; Janssen 2003; Janssen 2006), and two reported instrumental vaginal birth (ISRCTN11168521; Janssen 2006). There was no clear difference for the rate of caesarean section (RR 1.05, 95% CI 0.95 to 1.17; 3 trials, 5170 women; I² = 0%; moderate‐quality evidence; Analysis 2.2), or for the rate of instrumental vaginal birth (average RR 0.95, 95% CI 0.79 to 1.15; 2 trials, 4933 women; I² = 69%; low‐quality evidence; Analysis 2.3).
Baby born before arrival at hospital or unplanned home birth
Only one trial evaluated the effect on the number of babies born before arrival at hospital or unplanned home births (ISRCTN11168521), and reported that there was no clear difference between groups (RR 1.33, 95% CI 0.30 to 5.95; 1 trial, 3474 women; Analysis 2.4).
Secondary outcomes
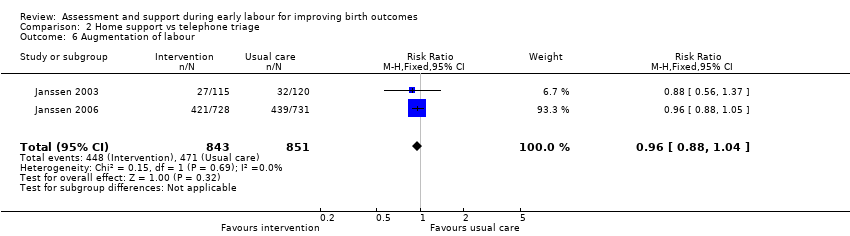
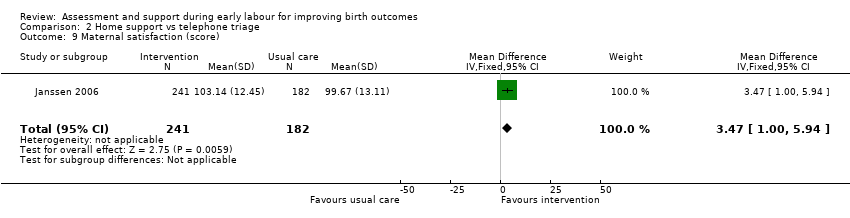
No clear differences were reported for serious maternal morbidity such as postpartum haemorrhage of more than 1000 mL, postnatal fever, blood transfusion and maternal death (RR 0.93, 95% CI 0.61 to 1.42; 1 trial, 3474 women; low‐quality evidence;Analysis 2.5); augmentation of labour (RR 0.96, 95% CI 0.88 to 1.04; 2 trials, 1694 women; I² = 0%; Analysis 2.6); use of epidural or any regional anaesthesia (average RR 0.95, 95% CI 0.87 to 1.05; 3 trials, 5168 women; I² = 60%; low‐quality evidence; Analysis 2.7); duration of hospital stay (postpartum stay in hospital more than five days) (RR 1.15, 95% CI 0.83 to 1.60; 1 trial, 3474 women; Analysis 2.8), and postpartum depression using Edinburgh Post‐natal Depression Scale (EPDS) (RR 1.08, 95% CI 0.82 to 1.42; 1 trial, 2584 women; Analysis 2.10). There was a slight increase in maternal satisfaction among women in the intervention group (MD 3.47, 95% CI 1.00 to 5.94; 1 trial, 423 women; Analysis 2.9).
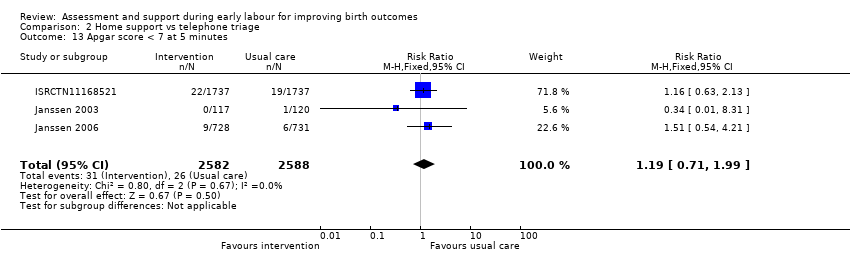
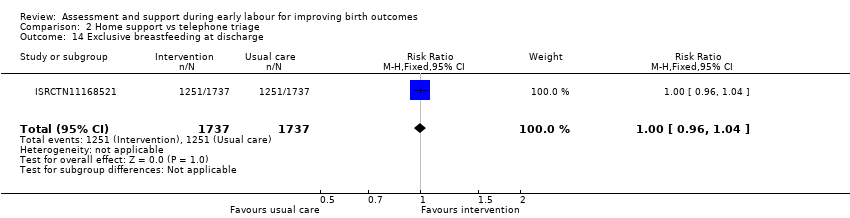
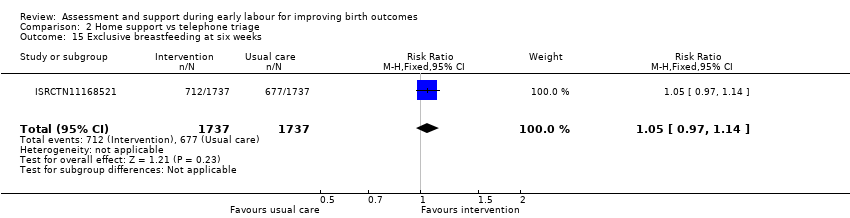
One trial evaluated perinatal death showing no clear difference between groups (RR 1.00, 95% CI 0.42 to 2.40; 3474 infants; Analysis 2.11). Other neonatal outcomes that also showed no clear difference between groups included; neonatal admission to special care (average RR 0.84, 95% CI 0.50 to 1.42; 3 trials, 5170 infants; I² = 71%; very low quality evidence; Analysis 2.12), and Apgar score of less than seven at five minutes after birth (RR 1.19, 95% CI 0.71 to 1.99; 3 studies, 5170 infants; I² = 0%; low‐quality evidence; Analysis 2.13). ISRCTN11168521 reported that exclusive breastfeeding both at discharge and at six weeks did not show any differences: exclusive breastfeeding at discharge (RR 1.00, 95% CI 0.96 to 1.04; 3474 women; Analysis 2.14), and exclusive breastfeeding at six weeks postpartum (RR 1.05, 95% CI 0.97 to 1.14; 3474 women; Analysis 2.15).
One‐to‐one structured care in early labour versus usual care (one study with 5002 women)
One study with a large sample size was included in this comparison (Hodnett 2008).
Primary outcomes
Length of labour
Length of labour was not reported.
Rate of caesarean section or instrumental vaginal birth
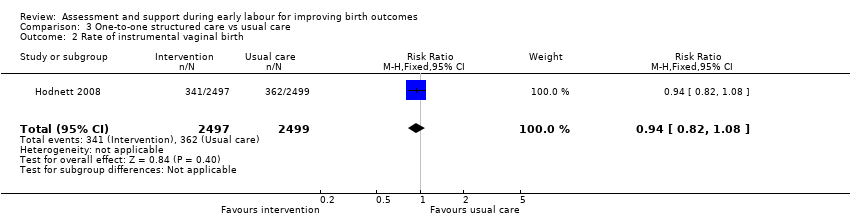
There were no clear differences between women receiving one‐to‐one structured midwifery care and usual care for the rate of caesarean section (RR 0.93, 95% CI 0.84 to 1.02; 4996 women, high‐quality evidence; Analysis 3.1), or for instrumental vaginal birth (RR 0.94, 95% CI 0.82 to 1.08; 4996 women, high‐quality evidence; Analysis 3.2).
Baby born before arrival at hospital or unplanned home birth
The number of babies born before arrival at hospital or unplanned home births was not reported.
Secondary outcomes
No clear differences between groups were reported for serious maternal morbidity such as postpartum haemorrhage of more than 1000 mL, postnatal fever, blood transfusion and maternal death (RR 1.13, 95% CI 0.84 to 1.52; 4996 women, moderate‐quality evidence; Analysis 3.3). Use of epidural or any regional anaesthesia was similar in the two groups (RR 1.00, 95% CI 0.99 to 1.01; 4996 women, high‐quality evidence' Analysis 3.4). Other maternal outcomes including augmentation of labour, duration of hospital stay, postpartum depression and breastfeeding were not reported.
For infant outcomes, there were no cases of perinatal death in this study and there were no clear differences between groups for neonatal outcomes (neonatal intensive care unit admission: RR 0.98, 95% CI 0.80 to 1.21; 4989 infants, high‐quality evidence; Analysis 3.6; Apgar score of less than seven at five minutes: RR 1.07, 95% CI 0.64 to 1.79; 4989 infants, moderate‐quality evidence; Analysis 3.7).
Labour diagnosis by algorithm versus routine midwifery care (one cluster randomised trial, 14 maternity units, 2183 women)
One cluster randomised trial was included in this comparison (Cheyne 2008). The trial was assessed as low risk of bias for most domains except blinding. The trial compared women attending units where assessment by midwives was carried out either by using strict criteria for labour diagnosis using an algorithm or by routine assessment to decide whether women were in labour.
We were unable to enter data from this trial into RevMan 2014 data and analysis tables or carry out assessment using GRADEpro. Results are set out in additional tables (Table 1; Table 2) using data from the main trial report (Cheyne 2008). Adjustment was carried out by the trial statistician taking account of differences between clusters (maternity units) at baseline. Results are expressed as differences between intervention and control groups (adjusted). For some outcomes (e.g. unplanned birth outside hospital or postpartum haemorrhage) there were insufficient data to carry out meaningful adjustment and for these outcomes the event data are set out in Table 1. The number of women included in the analysis following the intervention for all outcomes was 2171.
| OUTCOME | Intervention (after ) n = 892 | Control (after) n = 1279 | Difference between groups adjusted for baseline differences between clusters with 95% CI | P value |
| Spontaneous vertex delivery | 526 | 785 | ‐3.2 (‐15.1 to 8.7) | 0.6 |
| ARM | 401 | 500 | 5.6 (‐2.2 to 13.4) | 0.1 |
| Electronic fetal monitoring | 557 | 820 | ‐0.1 (‐14.2 to 14.1) | 1.0 |
| Assisted vaginal delivery | 241 | 323 | ||
| Caesarean section | 123 | 168 | ||
| 3rd or 4th degree tear | 7 | 8 | ||
| Epidural | 290 | 441 | 2.1 (‐8.0 to 12.2) | 0.7 |
| Additional analgesia required Opiate | 532 | 649 | 1.5 (‐4.6 to 7.6) | 0.6 |
| Additional analgesia required Epidural and opiate | 177 | 225 | 4.4 (‐2.8 to 11.7) | 0.2 |
| Any maternal complication | 439 | 596 | 3.9 (‐9.4 to 17.2) | 0.5 |
| PP haemorrhage (specify) Intrapartum Post partum | 5 10 | 7 20 | ||
| Labour augmentation with oxytocin | 343 | 484 | 0.3 (‐9.2 to 9.8) | 0.9 |
| Unplanned birth out of hospital | 11 | 11 | ||
| Fetal distress | 166 | 242 | 2.4 (‐6.6 to 11.3) | 0.6 |
| Meconium stained liquor | 133 | 211 | ‐0.5 (‐7.2 to 6.3) | 0.9 |
| Neonatal resuscitation | 106 | 145 | ‐0.9 (‐6.4 to 4.7) | 0.7 |
| Admission to special care | 29 | 60 | ‐0.4 (‐2.6 to 1.8) | 0.7 |
| Apgar score < 7 at 5 minutes | 9 | 13 | ||
| Admission to hospital at first presentation (1 admission) One presentations before admission in labour Two presentations before admission in labour Three or more presentations before admission in labour | 398 305 149 35 | 795 366 88 20 | ‐19.2 (‐29.9 to ‐8.6) | 0.002 |
| Failure to progress 1st stage Failure to progress 2nd stage | 42 142 | 59 119 | ‐3.4 (‐15.3 to 8.6) 15.2 (‐4.5 to 34.9) | 0.5 0.1 |
| OUTCOME | Intervention n =892 Mean | SD | Control n=1279 Mean | SD | Difference between groups adjusted for baseline differences between clusters | P value |
| Duration of labour from admission to labour ward to delivery | 9.6 | 11.29 | 8.06 | 5.41 | 0.75 (‐0.55 to 2.05) | 0.2 |
| Mean number of vaginal examinations | 3.67 | Range 0‐11 | 3.46 | Range 0‐11 | 0.2 (‐0.3 to 0.7) | 0.3 |
Primary outcomes
Length of labour
There was no clear difference between the women assessed by midwives using a labour diagnosis algorithm compared with routine midwife assessment for duration of labour from admission to the labour ward until delivery (adjusted difference between means (hours) 0.75, 95% CI ‐0.55 to 2.05).
Rate of caesarean section or instrumental vaginal birth
After adjustment for baseline differences between units there was no clear difference between the two types of assessment for instrumental vaginal birth or caesarean section (see Table 1) (spontaneous vertex birth, risk difference (RD) ‐3.2, 95% CI ‐15.1 to 8.7).
Baby born before arrival at hospital or unplanned home birth
There were 11 babies in each group born before arrival in hospital.
Secondary outcomes
No clear differences between groups were reported for intrapartum or postpartum haemorrhage (Table 1). Adjusted data showed no clear differences in the use of epidural (RD 2.1, 95% CI ‐8.0 to 12.2) opioid analgesia (RD 1.5, 95% CI ‐4.6 to 7.6) or both (RD 4.4, 95% CI ‐2.8 to 11.7).
The primary outcome in the trial was labour augmentation with oxytocin; there was no clear evidence that the intervention reduced labour augmentation (RD 0.3, 95 % CI ‐9.2 to 9.8). There were similar rates of severe perineal trauma in both groups (7 versus 8). Other maternal outcomes including postpartum depression and breastfeeding were not reported.
A review non‐prespecified outcome that was reported in this trial was the number of times women presented at hospital before they were admitted to the labour ward. It was less likely that women would be admitted at the first presentation in the intervention group (RD ‐19.2, 95% CI ‐29.9 to ‐8.6). Some women attended hospital three or more times before admission (Table 1).
For infant outcomes, there were no clear differences between groups for neonatal outcomes (neonatal intensive care unit admission: RD ‐0.4, 95% CI ‐2.6 to 1.8; Apgar score of less than seven at five minutes: 9 versus 13 babies; and need for neonatal resuscitation RD ‐0.9, 95% CI ‐6.4 to 4.7).
Discussion
Summary of main results
This review included five randomised controlled trials involving 10,421 women and their babies, and a cluster randomised trial with 2183 women. We assessed non‐pharmacological assessment and support interventions that were administered in early labour.
A trial with a small sample size (209 women) that examined the impact of early labour assessment versus immediate admission showed some differences between groups, but many outcomes of interest to this review were not reported. Women in the early assessment group had a shorter time in labour in hospital (low‐quality evidence), had increased satisfaction with their care, were less likely to have labour augmentation and were slightly less likely to have an epidural (low‐quality evidence). There were similar rates of other labour interventions between the groups, including caesarean section and instrumental birth (very low quality evidence). Only one infant had a low Apgar score at five minutes (very low quality evidence).
Three trials examined home midwifery assessment and support versus telephone triage. For this comparison, results should be interpreted with caution because of the statistical heterogeneity of the trials combined in the meta‐analysis.
One trial reported the duration of labour, but the intervention did not appear to have any clear impact on the length of labour (low‐quality evidence). There was no clear difference between groups for the rate of caesarean section (reported in three trials, moderate‐quality evidence) or the rate of instrumental vaginal birth (reported in two trials, low‐quality evidence). One trial reported serious maternal morbidity, where there was no clear difference between groups (low‐quality evidence). Use of epidural in intervention and control groups was not clearly different in the three studies (low‐quality evidence), and neonatal outcomes also showed no clear differences (neonatal admission to special care, very low quality evidence, and Apgar score of less than seven at five minutes, low‐quality evidence).
One large trial compared one‐to‐one midwifery care in early labour with usual care. Length of labour was not reported and there were few clear differences between groups for other outcomes, including caesarean section and instrumental vaginal birth (both high‐quality evidence), serious maternal morbidity (moderate‐quality evidence), or use of epidural (high‐quality evidence). There were no cases of perinatal death in this study and there were no clear differences between groups for neonatal outcomes (neonatal intensive care unit admission, high‐quality evidence; Apgar score of less than seven at five minutes, moderate‐quality evidence).
A cluster randomised trial examined the impact of a labour diagnosis tool used by midwives compared with usual midwifery assessment when women attended hospital. There were no clear differences in outcomes for women and babies in the two groups for most of the outcomes measured. Interventions in labour (augmentation, epidural, instrumental or caesarean birth) were similar after adjustment for baseline differences between maternity units. Women in the intervention group were less likely to be admitted to hospital in labour at first presentation. There were no clear differences between groups for the infant outcome reported.
Overall completeness and applicability of evidence
The interventions examined in this review were very varied and results were mixed. The interventions included assessment of pregnant women at home by health workers before hospital admission (ISRCTN11168521; Janssen 2003; Janssen 2006), assessment versus immediate hospital admission, and structured care including physical assessment of pain and emotional support by nurses or midwives after admission to hospital (Hodnett 2008). The outcome data from these trials were limited.
Only two of the five trials examined the length of labour as a main outcome in this review (ISRCTN11168521; McNiven 1996).
All the trials were conducted in Western, high‐income countries including Canada, the USA and the UK, therefore, the applicability of evidence to low‐income and middle‐income countries is limited.
Quality of the evidence
We judged the overall risk of bias in the individually randomised trials as being low to unclear for most of the included studies, although lack of blinding was a source of bias.
We assessed the quality of the evidence for the outcomes presented in the 'Summary of findings' tables using GRADE. Overall, the evidence ranged from very low to high quality. We downgraded the evidence in four of the five studies included in the review due to study design limitations, and for many outcomes the effect estimates were imprecise. Where data were pooled in meta‐analysis, results from trials were inconsistent and we downgraded the evidence for high statistical heterogeneity.
The cluster randomised trial was at risk of bias from lack of blinding but otherwise the trial was at low risk of bias. All data were appropriately adjusted for baseline differences between clusters.
Potential biases in the review process
We tried to reduce bias to a minimum during the review process. Two authors assessed the eligibility of studies and risk of bias, and extracted data independently. Although we followed Cochrane Pregnancy and Childbirth search strategies and its recommended review process, there may be relevant unpublished trials that we were unable to find. It is also possible that a different review team may have made different judgments when assessing study eligibility and risks of bias.
Agreements and disagreements with other studies or reviews
We identified no other studies or reviews that addressed this area. However, one systematic review demonstrated that walking and maintaining an upright position in the first stage of labour reduces the length of labour (Lawrence 2013). Only one trial adapted walking and keeping an upright position into an intervention (McNiven 1996). In future research, interventions should include not only support, encouragement, and advice, but also instructions to walk around and maintain an upright position in early labour (Lawrence 2013; McNiven 1996).
Use of epidural or any regional anaesthesia and labour augmentation were reduced in intervention groups in some of the trials, however, use of these interventions was likely to be influenced by lack of blinding.

Study flow diagram.
Risk of bias graph: review authors' judgements about each risk of bias item presented as percentages across all included studies

Risk of bias summary: review authors' judgements about each risk of bias item for each included study

Comparison 1 Assessment vs direct admission in early labour, Outcome 1 Length of labour (hours).

Comparison 1 Assessment vs direct admission in early labour, Outcome 2 Rate of caesarean section.

Comparison 1 Assessment vs direct admission in early labour, Outcome 3 Rate of instrumental vaginal birth.

Comparison 1 Assessment vs direct admission in early labour, Outcome 4 Baby born before arrival at hospital or unplanned home birth.

Comparison 1 Assessment vs direct admission in early labour, Outcome 5 Augmentation of labour.
Comparison 1 Assessment vs direct admission in early labour, Outcome 6 Use of epidural or any regional anaesthesia.
Comparison 1 Assessment vs direct admission in early labour, Outcome 7 Maternal satisfaction (score).
Comparison 1 Assessment vs direct admission in early labour, Outcome 8 Apgar score < 7 at 5 minutes.

Comparison 2 Home support vs telephone triage, Outcome 1 Length of labour (hours).
Comparison 2 Home support vs telephone triage, Outcome 2 Rate of caesarean section.
Comparison 2 Home support vs telephone triage, Outcome 3 Rate of instrumental vaginal birth.

Comparison 2 Home support vs telephone triage, Outcome 4 Baby born before arrival at hospital or unplanned home birth.

Comparison 2 Home support vs telephone triage, Outcome 5 Serious maternal morbidity.
Comparison 2 Home support vs telephone triage, Outcome 6 Augmentation of labour.

Comparison 2 Home support vs telephone triage, Outcome 7 Use of epidural or any regional anaesthesia.

Comparison 2 Home support vs telephone triage, Outcome 8 Duration of hospital stay (prolonged postpartum stay in hospital > 5 days).
Comparison 2 Home support vs telephone triage, Outcome 9 Maternal satisfaction (score).

Comparison 2 Home support vs telephone triage, Outcome 10 Postpartum depression (EPDS score ≥ 13).

Comparison 2 Home support vs telephone triage, Outcome 11 Perinatal death.

Comparison 2 Home support vs telephone triage, Outcome 12 Neonatal admission to special care.
Comparison 2 Home support vs telephone triage, Outcome 13 Apgar score < 7 at 5 minutes.
Comparison 2 Home support vs telephone triage, Outcome 14 Exclusive breastfeeding at discharge.
Comparison 2 Home support vs telephone triage, Outcome 15 Exclusive breastfeeding at six weeks.

Comparison 3 One‐to‐one structured care vs usual care, Outcome 1 Rate of caesarean section.
Comparison 3 One‐to‐one structured care vs usual care, Outcome 2 Rate of instrumental vaginal birth.

Comparison 3 One‐to‐one structured care vs usual care, Outcome 3 Serious maternal morbidity.

Comparison 3 One‐to‐one structured care vs usual care, Outcome 4 Use of epidural or any regional anaesthesia.
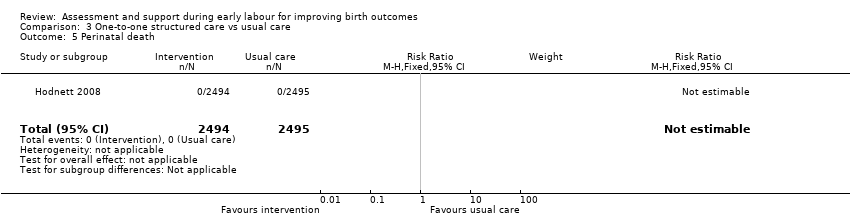
Comparison 3 One‐to‐one structured care vs usual care, Outcome 5 Perinatal death.
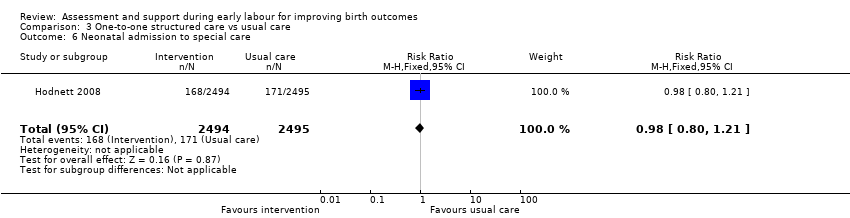
Comparison 3 One‐to‐one structured care vs usual care, Outcome 6 Neonatal admission to special care.

Comparison 3 One‐to‐one structured care vs usual care, Outcome 7 Apgar score < 7 at 5 minutes.
| Assessment compared with direct admission in early labour for improving birth outcomes | ||||||
| Patient or population: healthy pregnant women | ||||||
| Outcomes | Anticipated absolute effects* (95% CI) | Relative effect | № of participants | Quality of the evidence | Comments | |
| Risk with direct admission in early labour | Risk with assessment | |||||
| Length of labour (hours) | The mean length of labour (hours) was 8.3 hours in the intervention group and 13.5 hours in the control group | MD 5.2 lower | ‐ | 209 | ⊕⊕⊝⊝ | This outcome relates to the length of labour in hospital |
| Rate of caesarean section | Study population | RR 0.72 | 209 | ⊕⊝⊝⊝ | ||
| 106 per 1000 | 76 per 1000 | |||||
| Rate of instrumental vaginal birth | Study population | RR 0.86 | 209 | ⊕⊝⊝⊝ | ||
| 356 per 1000 | 306 per 1000 | |||||
| Serious maternal morbidity | Study population | ‐ | (0 RCTs) | ‐ | Serious maternal morbidity was not reported | |
| see comment | See comment | |||||
| Use of epidural or any regional anaesthesia | Study population | RR 0.87 | 209 | ⊕⊕⊝⊝ | ||
| 904 per 1000 | 786 per 1000 | |||||
| Neonatal admission to special care | Study population | |||||
| see comment | See comment | |||||
| Apgar score < 7 at 5 minutes | Study population | RR 2.97 | 209 | ⊕⊝⊝⊝ | ||
| 0 per 1000 | 0 per 1000 | |||||
| *The risk in the intervention group (and its 95% confidence interval) is based on the assumed risk in the comparison group and the relative effect of the intervention (and its 95% CI). | ||||||
| GRADE Working Group grades of evidence | ||||||
| 1 Single trial with design limitations (lack of blinding) (‐1) 2 Single trial with small sample size (‐1) 3 Wide 95% CI crossing the line of no effect and small sample size (‐2) 4 Wide 95% CI crossing the line of no effect, small sample size and low event rate (‐2) | ||||||
| Home support compared with telephone triage for improving birth outcomes | ||||||
| Patient or population: healthy pregnant women | ||||||
| Outcomes | Anticipated absolute effects* (95% CI) | Relative effect | № of participants | Quality of the evidence | Comments | |
| Risk with telephone triage | Risk with home support | |||||
| Length of labour (hours) | The mean length of labour (hours) was 9.66 in the intervention group and 9.37 in the control group | MD 0.29 higher | ‐ | 3474 | ⊕⊕⊝⊝ | Criteria for start of labour were not clearly described |
| Rate of caesarean section | Study population | RR 1.05 | 5170 | ⊕⊕⊕⊝ | ||
| 215 per 1000 | 226 per 1000 | |||||
| Rate of instrumental vaginal birth | Study population | RR 0.95 | 4933 | ⊕⊕⊝⊝ | ||
| 233 per 1000 | 222 per 1000 | |||||
| Serious maternal morbidity | Study population | RR 0.93 | 3474 | ⊕⊕⊝⊝ | ||
| 25 per 1000 | 23 per 1000 | |||||
| Use of epidural or any regional anaesthesia | Study population | RR 0.95 | 5168 | ⊕⊕⊝⊝ | ||
| 505 per 1000 | 480 per 1000 | |||||
| Neonatal admission to special care | Study population | RR 0.84 | 5170 | ⊕⊝⊝⊝ | ||
| 58 per 1000 | 49 per 1000 | |||||
| Apgar score < 7 at 5 minutes | Study population | RR 1.19 | 5170 | ⊕⊕⊝⊝ | ||
| 10 per 1000 | 12 per 1000 | |||||
| *The risk in the intervention group (and its 95% confidence interval) is based on the assumed risk in the comparison group and the relative effect of the intervention (and its 95% CI). | ||||||
| GRADE Working Group grades of evidence | ||||||
| 1 Study with design limitations (lack of blinding) (‐1) 2 Wide 95% CI crossing line of no effect (‐1) 3 All studies contributing data had design limitations (lack of blinding) (‐1) 4 High heterogeneity (I2 69%) (‐1) 5 High heterogeneity (I2 60%) (‐1) 6 High heterogeneity (I2 71%) (‐1) | ||||||
| One‐to‐one structured care compared to usual care for improving birth outcomes | ||||||
| Patient or population: healthy pregnant women | ||||||
| Outcomes | Anticipated absolute effects* (95% CI) | Relative effect | № of participants | Quality of the evidence | Comments | |
| Risk with usual care | Risk with one‐to‐one structured care | |||||
| Length of labour (hours) | ‐ | See comment | ‐ | (0 study) | ‐ | Not reported |
| Rate of caesarean section | Study population | RR 0.93 | 4996 | ⊕⊕⊕⊕ | ||
| 242 per 1000 | 225 per 1000 | |||||
| Rate of instrumental vaginal birth | Study population | RR 0.94 | 4996 | ⊕⊕⊕⊕ | ||
| 145 per 1000 | 136 per 1000 | |||||
| Serious maternal morbidity | Study population | RR 1.13 | 4996 | ⊕⊕⊕⊝ | ||
| 32 per 1000 | 36 per 1000 | |||||
| Use of epidural or any regional anaesthesia | Study population | RR 1.00 | 4996 | ⊕⊕⊕⊕ | ||
| 955 per 1000 | 955 per 1000 | |||||
| Neonatal admission to special care | Study population | RR 0.98 | 4989 | ⊕⊕⊕⊕ | ||
| 69 per 1000 | 67 per 1000 | |||||
| Apgar score < 7 at 5 minutes | Study population | RR 1.07 | 4989 | ⊕⊕⊕⊝ | ||
| 11 per 1000 | 12 per 1000 | |||||
| *The risk in the intervention group (and its 95% confidence interval) is based on the assumed risk in the comparison group and the relative effect of the intervention (and its 95% CI). | ||||||
| GRADE Working Group grades of evidence | ||||||
| 1 Wide 95% CI crossing line of no effect (‐1) | ||||||
| OUTCOME | Intervention (after ) n = 892 | Control (after) n = 1279 | Difference between groups adjusted for baseline differences between clusters with 95% CI | P value |
| Spontaneous vertex delivery | 526 | 785 | ‐3.2 (‐15.1 to 8.7) | 0.6 |
| ARM | 401 | 500 | 5.6 (‐2.2 to 13.4) | 0.1 |
| Electronic fetal monitoring | 557 | 820 | ‐0.1 (‐14.2 to 14.1) | 1.0 |
| Assisted vaginal delivery | 241 | 323 | ||
| Caesarean section | 123 | 168 | ||
| 3rd or 4th degree tear | 7 | 8 | ||
| Epidural | 290 | 441 | 2.1 (‐8.0 to 12.2) | 0.7 |
| Additional analgesia required Opiate | 532 | 649 | 1.5 (‐4.6 to 7.6) | 0.6 |
| Additional analgesia required Epidural and opiate | 177 | 225 | 4.4 (‐2.8 to 11.7) | 0.2 |
| Any maternal complication | 439 | 596 | 3.9 (‐9.4 to 17.2) | 0.5 |
| PP haemorrhage (specify) Intrapartum Post partum | 5 10 | 7 20 | ||
| Labour augmentation with oxytocin | 343 | 484 | 0.3 (‐9.2 to 9.8) | 0.9 |
| Unplanned birth out of hospital | 11 | 11 | ||
| Fetal distress | 166 | 242 | 2.4 (‐6.6 to 11.3) | 0.6 |
| Meconium stained liquor | 133 | 211 | ‐0.5 (‐7.2 to 6.3) | 0.9 |
| Neonatal resuscitation | 106 | 145 | ‐0.9 (‐6.4 to 4.7) | 0.7 |
| Admission to special care | 29 | 60 | ‐0.4 (‐2.6 to 1.8) | 0.7 |
| Apgar score < 7 at 5 minutes | 9 | 13 | ||
| Admission to hospital at first presentation (1 admission) One presentations before admission in labour Two presentations before admission in labour Three or more presentations before admission in labour | 398 305 149 35 | 795 366 88 20 | ‐19.2 (‐29.9 to ‐8.6) | 0.002 |
| Failure to progress 1st stage Failure to progress 2nd stage | 42 142 | 59 119 | ‐3.4 (‐15.3 to 8.6) 15.2 (‐4.5 to 34.9) | 0.5 0.1 |
| OUTCOME | Intervention n =892 Mean | SD | Control n=1279 Mean | SD | Difference between groups adjusted for baseline differences between clusters | P value |
| Duration of labour from admission to labour ward to delivery | 9.6 | 11.29 | 8.06 | 5.41 | 0.75 (‐0.55 to 2.05) | 0.2 |
| Mean number of vaginal examinations | 3.67 | Range 0‐11 | 3.46 | Range 0‐11 | 0.2 (‐0.3 to 0.7) | 0.3 |
| Outcome or subgroup title | No. of studies | No. of participants | Statistical method | Effect size |
| 1 Length of labour (hours) Show forest plot | 1 | 209 | Mean Difference (IV, Fixed, 95% CI) | ‐5.20 [‐7.06, ‐3.34] |
| 2 Rate of caesarean section Show forest plot | 1 | 209 | Risk Ratio (M‐H, Fixed, 95% CI) | 0.72 [0.30, 1.72] |
| 3 Rate of instrumental vaginal birth Show forest plot | 1 | 209 | Risk Ratio (M‐H, Fixed, 95% CI) | 0.86 [0.58, 1.26] |
| 4 Baby born before arrival at hospital or unplanned home birth Show forest plot | 1 | 209 | Risk Ratio (M‐H, Fixed, 95% CI) | 0.0 [0.0, 0.0] |
| 5 Augmentation of labour Show forest plot | 1 | 209 | Risk Ratio (M‐H, Fixed, 95% CI) | 0.57 [0.37, 0.86] |
| 6 Use of epidural or any regional anaesthesia Show forest plot | 1 | 209 | Risk Ratio (M‐H, Fixed, 95% CI) | 0.87 [0.78, 0.98] |
| 7 Maternal satisfaction (score) Show forest plot | 1 | 201 | Mean Difference (IV, Fixed, 95% CI) | 16.0 [7.53, 24.47] |
| 8 Apgar score < 7 at 5 minutes Show forest plot | 1 | 209 | Risk Ratio (M‐H, Fixed, 95% CI) | 2.97 [0.12, 72.12] |
| Outcome or subgroup title | No. of studies | No. of participants | Statistical method | Effect size |
| 1 Length of labour (hours) Show forest plot | 1 | 3474 | Mean Difference (IV, Fixed, 95% CI) | 0.29 [‐0.14, 0.72] |
| 2 Rate of caesarean section Show forest plot | 3 | 5170 | Risk Ratio (M‐H, Fixed, 95% CI) | 1.05 [0.95, 1.17] |
| 3 Rate of instrumental vaginal birth Show forest plot | 2 | 4933 | Risk Ratio (M‐H, Random, 95% CI) | 0.95 [0.79, 1.15] |
| 4 Baby born before arrival at hospital or unplanned home birth Show forest plot | 1 | 3474 | Risk Ratio (M‐H, Fixed, 95% CI) | 1.33 [0.30, 5.95] |
| 5 Serious maternal morbidity Show forest plot | 1 | 3474 | Risk Ratio (M‐H, Fixed, 95% CI) | 0.93 [0.61, 1.42] |
| 6 Augmentation of labour Show forest plot | 2 | 1694 | Risk Ratio (M‐H, Fixed, 95% CI) | 0.96 [0.88, 1.04] |
| 7 Use of epidural or any regional anaesthesia Show forest plot | 3 | 5168 | Risk Ratio (M‐H, Random, 95% CI) | 0.95 [0.87, 1.05] |
| 8 Duration of hospital stay (prolonged postpartum stay in hospital > 5 days) Show forest plot | 1 | 3474 | Risk Ratio (M‐H, Fixed, 95% CI) | 1.15 [0.83, 1.60] |
| 9 Maternal satisfaction (score) Show forest plot | 1 | 423 | Mean Difference (IV, Fixed, 95% CI) | 3.47 [1.00, 5.94] |
| 10 Postpartum depression (EPDS score ≥ 13) Show forest plot | 1 | 2584 | Risk Ratio (M‐H, Fixed, 95% CI) | 1.08 [0.82, 1.42] |
| 11 Perinatal death Show forest plot | 1 | 3474 | Risk Ratio (M‐H, Fixed, 95% CI) | 1.0 [0.42, 2.40] |
| 12 Neonatal admission to special care Show forest plot | 3 | 5170 | Risk Ratio (M‐H, Random, 95% CI) | 0.84 [0.50, 1.42] |
| 13 Apgar score < 7 at 5 minutes Show forest plot | 3 | 5170 | Risk Ratio (M‐H, Fixed, 95% CI) | 1.19 [0.71, 1.99] |
| 14 Exclusive breastfeeding at discharge Show forest plot | 1 | 3474 | Risk Ratio (M‐H, Fixed, 95% CI) | 1.0 [0.96, 1.04] |
| 15 Exclusive breastfeeding at six weeks Show forest plot | 1 | 3474 | Risk Ratio (M‐H, Fixed, 95% CI) | 1.05 [0.97, 1.14] |
| Outcome or subgroup title | No. of studies | No. of participants | Statistical method | Effect size |
| 1 Rate of caesarean section Show forest plot | 1 | 4996 | Risk Ratio (M‐H, Fixed, 95% CI) | 0.93 [0.84, 1.02] |
| 2 Rate of instrumental vaginal birth Show forest plot | 1 | 4996 | Risk Ratio (M‐H, Fixed, 95% CI) | 0.94 [0.82, 1.08] |
| 3 Serious maternal morbidity Show forest plot | 1 | 4996 | Risk Ratio (M‐H, Fixed, 95% CI) | 1.13 [0.84, 1.52] |
| 4 Use of epidural or any regional anaesthesia Show forest plot | 1 | 4996 | Risk Ratio (M‐H, Fixed, 95% CI) | 1.00 [0.99, 1.01] |
| 5 Perinatal death Show forest plot | 1 | 4989 | Risk Ratio (M‐H, Fixed, 95% CI) | 0.0 [0.0, 0.0] |
| 6 Neonatal admission to special care Show forest plot | 1 | 4989 | Risk Ratio (M‐H, Fixed, 95% CI) | 0.98 [0.80, 1.21] |
| 7 Apgar score < 7 at 5 minutes Show forest plot | 1 | 4989 | Risk Ratio (M‐H, Fixed, 95% CI) | 1.07 [0.64, 1.79] |