Administración prenatal de suplementos dietéticos con mioinositol en pacientes embarazadas para prevenir la diabetes gestacional
Resumen
Antecedentes
La diabetes gestacional, la intolerancia a la glucosa al inicio o en el primer reconocimiento durante el embarazo, es un problema creciente en todo el mundo. Los enfoques no farmacológicos y farmacológicos para la prevención de la diabetes gestacional se han explorado y aún se exploran. El mioinositol, un isómero del inositol, es un azúcar natural que se encuentra habitualmente en los cereales, el maíz, las leguminosas y la carne. Es uno de los mediadores intracelulares de la señal de insulina y se correlaciona con la sensibilidad a la insulina en la diabetes tipo 2. El posible efecto beneficioso sobre la mejoría en la sensibilidad a la insulina indica que el mioinositol puede ser útil en las mujeres para prevenir la diabetes gestacional.
Objetivos
Evaluar si la administración prenatal de suplementos dietéticos con mioinositol es segura y eficaz, en la madre y el feto, para prevenir la diabetes gestacional.
Métodos de búsqueda
Se hicieron búsquedas en el registro de ensayos del Grupo Cochrane de Embarazo y Parto (Cochrane Pregnancy and Childbirth Group), ClinicalTrials.gov, WHO ICTRP (2 noviembre 2015) y en listas de referencias de estudios recuperados.
Criterios de selección
Se buscaron los ensayos controlados aleatorios publicados y no publicados, incluidos los resúmenes de congresos, que evaluaran los efectos del mioinositol para la prevención de la diabetes mellitus gestacional (DMG). Los ensayos cuasialeatorios y cruzados no fueron elegibles para inclusión, pero fueron elegibles los diseños grupales. Las participantes en los ensayos eran mujeres embarazadas. Se excluyeron las embarazadas con diabetes tipo 1 o tipo 2 preexistente. Fueron elegibles para inclusión los ensayos que compararon la administración de cualquier dosis de mioinositol, solo o en una preparación combinada. Fueron elegibles para inclusión los ensayos que utilizaron ningún tratamiento, placebo u otra intervención como comparador.
Obtención y análisis de los datos
Dos autores de la revisión evaluaron de forma independiente los ensayos para inclusión, el riesgo de sesgo y extrajeron los datos. Se verificó la exactitud de los datos.
Resultados principales
Se incluyeron cuatro ensayos controlados aleatorios (todos realizados en Italia) que informaron sobre 567 mujeres con menos de 11 semanas a 24 semanas de embarazo al comienzo de los ensayos. Los ensayos tuvieron tamaños pequeños de la muestra y un ensayo solamente informó un análisis intermedio. Dos ensayos fueron abiertos. El riesgo general de sesgo fue incierto.
Para la madre, la administración de suplementos con mioinositol se asoció con una reducción en la incidencia de diabetes gestacional en comparación con control (cociente de riesgos [CR] 0,43; intervalo de confianza [IC] del 95%: 0,29 a 0,64; tres ensayos; n = 502 mujeres). Al utilizar los métodos GRADE estas pruebas se evaluaron de calidad baja al disminuirse debido al riesgo incierto de sesgo de la ocultación de la asignación en dos de los ensayos incluidos y la falta de generalizabilidad de los resultados. En las embarazadas que recibieron suplementos con mioinositol, la incidencia de DMG varió del 8% al 18%; en las embarazadas del grupo control, la incidencia de DMG fue del 28%, al utilizar los criterios del International Association of Diabetes and Pregnancy Study Groups Consensus Panel 2010 para diagnosticar la DMG.
Dos ensayos informaron los trastornos hipertensivos del embarazo, un resultado materno primario de esta revisión. No hubo diferencias claras en el riesgo de trastornos hipertensivos del embarazo entre los grupos de mioinositol y control (CR promedio 0,43; IC del 95%: 0,02 a 8,41; dos ensayos; n = 398 mujeres; Tau2 = 3,23; I2= 69%). Al utilizar los métodos GRADE, estas pruebas se evaluaron de calidad muy baja al disminuirse debido a los intervalos de confianza amplios con tasas de eventos muy bajas, un tamaño pequeño de la muestra, la falta de cegamiento, los métodos inciertos de ocultación de la asignación y la falta de generalizabilidad. En las embarazadas que recibieron mioinositol el riesgo de trastornos hipertensivos del embarazo varió del 0% a 33%; en las embarazadas del grupo control el riesgo fue del 4%.
Para el lactante, ninguno de los ensayos incluidos informó los resultados neonatales primarios de esta revisión sistemática (grande para la edad gestacional, mortalidad perinatal, resultado compuesto mortalidad o morbilidad).
En cuanto a los resultados secundarios de esta revisión, no hubo diferencias claras en el riesgo de cesárea entre los grupos de mioinositol y control (CR 0,95; IC del 95%: 0,76 a 1,19; dos ensayos; n = 398 mujeres). Al utilizar los métodos GRADE, estas pruebas se evaluaron de calidad baja al disminuirse debido al riesgo incierto de sesgo en un ensayo y la falta de generalizabilidad. En las embarazadas que recibieron suplementos con mioinositol, el riesgo de tener una cesárea varió del 34% al 54%; en las embarazadas del grupo control fue del 45%. No hubo efectos adversos maternos del tratamiento en los dos ensayos que informaron este resultado (los otros dos ensayos no informaron este resultado).
Dos ensayos no encontraron diferencias claras en el riesgo de macrosomía entre los lactantes cuyas madres recibieron suplementos con mioinositol en comparación con los controles (CR promedio 0,35; IC del 95%: 0,02 a 6,37; dos ensayos; n = 398 lactantes; Tau2 = 3,33; I2 = 73%). De manera similar, no hubo diferencias claras entre los grupos en cuanto a la hipoglucemia neonatal (CR 0,36; IC del 95%: 0,01 a 8,66) o la distocia de hombro (CR promedio 2,33; IC del 95%: 0,12 a 44,30; Tau2 = 3,24; I2 = 72%).
No hubo datos disponibles de un gran número de resultados secundarios maternos y neonatales, y tampoco hubo datos de ninguno de los resultados de la niñez o de la adultez a largo plazo, ni de los resultados de costo de los servicios de salud.
Conclusiones de los autores
Las pruebas de cuatro ensayos de la administración prenatal de suplementos dietéticos con mioinositol durante el embarazo muestran un posible efecto beneficioso de reducción de la incidencia de diabetes gestacional. No se informaron datos de los resultados prenatales primarios de esta revisión. Hubo muy pocos datos de resultado para la mayoría de los resultados secundarios de esta revisión. No existen pruebas claras de una diferencia en la macrosomía en comparación con el control.
Las pruebas actuales se basan en ensayos pequeños que no tienen poder estadístico suficiente para detectar diferencias en resultados que incluyen la mortalidad perinatal y la morbilidad infantil grave. Todos los estudios incluidos se realizaron en Italia, lo que hace que surjan inquietudes con respecto a la falta de generalizabilidad de las pruebas a otros contextos. Hay pruebas de inconsistencia y falta de direccionalidad, por lo que muchas de las calificaciones de la calidad de las pruebas se disminuyeron a baja o muy baja calidad (GRADEpro Guideline Development Tool).
Se estimula la realización de ensayos adicionales sobre esta intervención prenatal para la prevención de la diabetes gestacional y se deben incluir embarazadas de diferentes grupos étnicos y factores de riesgo variables y comparar la administración de mioinositol (diferentes dosis, frecuencia y momento de administración) con placebo, dieta y ejercicios o intervenciones farmacológicas. Los resultados deben incluir los posibles efectos perjudiciales, incluidos los efectos adversos.
PICOs
Resumen en términos sencillos
Tomar mioinositol como suplemento dietético durante el embarazo para prevenir el desarrollo de diabetes gestacional
¿Cuál es el tema?
Esta revisión intentó investigar si el mioinositol es un suplemento dietético prenatal eficaz para prevenir la diabetes gestacional en las pacientes embarazadas. Las mujeres que desarrollan diabetes gestacional tienen un riesgo mayor de presentar complicaciones durante el embarazo y el parto, así como de desarrollar diabetes más adelante en la vida. Los recién nacidos de madres que tienen diabetes gestacional pueden ser más grandes que lo que deben ser, lo que posiblemente causa lesiones a los recién nacidos al momento del parto. Estos recién nacidos tienen riesgo de presentar diabetes cuando son niños pequeños o adultos jóvenes.
¿Por qué es importante?
El número de embarazadas que son diagnosticadas con diabetes gestacional ha aumentado en todo el mundo, por lo que es importante encontrar formas sencillas y costo‐eficaces para evitar que las mujeres desarrollen diabetes gestacional. El mioinositol es un azúcar natural que se encuentra en los cereales, el maíz, las hortalizas verdes y la carne y que tiene una función en la sensibilidad del cuerpo a la insulina.
¿Qué pruebas se encontraron?
Se buscaron los estudios el 2 de noviembre de 2015 y se incluyeron cuatro ensayos controlados aleatorios pequeños con 567 mujeres que tenían menos de 11 semanas y hasta 24 semanas de embarazo al comienzo de los ensayos. La calidad de las pruebas se calificó de baja o muy baja y el riesgo general de sesgo fue incierto.
El mioinositol se asoció con una reducción en la tasa de diabetes gestacional (pruebas de calidad baja), con una reducción en la incidencia del 28% en las embarazadas que no tomaron el suplemento, y de entre el 8% y el 18% en las embarazas que lo recibieron. No hubo diferencias entre los grupos en cuanto al número de pacientes que presentaron trastornos hipertensivos del embarazo (que incluyen preeclampsia, eclampsia y presión anormalmente alta durante embarazo) (pruebas de calidad muy baja). Los ensayos no proporcionaron información acerca del número de recién nacidos que murieron (antes de nacer o poco después) ni los recién nacidos que fueron grandes para la edad gestacional. No hubo efectos adversos maternos del tratamiento en los dos ensayos que informaron este resultado (los otros dos ensayos no mencionaron este resultado).
Esta revisión no encontró ninguna repercusión sobre otros resultados como el riesgo de tener una cesárea (pruebas de calidad baja), un recién nacido grande, parto obstruido cuando el hombro del feto se traba (distocia de hombro) o un recién nacido con niveles bajos de glucosa en sangre. Lo anterior se puede deber a que los ensayos son demasiado pequeños para detectar diferencias en estos resultados y a que los resultados no se informaron en todos los ensayos. Los cuatro ensayos procedían de Italia.
Los ensayos incluidos no informaron un gran número de otros resultados de la madre y los recién nacidos enumerados en esta revisión y no se encontraron datos con respecto a resultados a más largo plazo de la madre o el lactante, ni sobre el costo de los servicios sanitarios.
¿Qué quiere decir esto?
El mioinositol como suplemento dietético durante el embarazo es promisorio para prevenir la diabetes gestacional, pero no hay suficientes pruebas en este estadio para apoyar su uso sistemático. Se necesitan ensayos controlados aleatorios grandes bien diseñados adicionales para evaluar la efectividad del mioinositol en la prevención de la diabetes gestacional y para mejorar otros resultados de salud de las madres y los recién nacidos.
En condiciones ideales, los estudios futuros deben considerar la posibilidad de incluir embarazadas de diferentes grupos étnicos y con factores de riesgo diferentes de diabetes gestacional. Sería útil que los estudios futuros consideraran las formas en las que se puede administrar el mioinositol (diferentes dosis, frecuencia y cuándo tomarlo) y comparar la intervención con un control placebo, dieta y ejercicios o intervenciones farmacológicas. Se recomienda que los estudios futuros utilicen los resultados enumerados en esta revisión y que se incluyan los posibles efectos perjudiciales, incluidos los efectos adversos.
Authors' conclusions
Summary of findings
| Antenatal supplementation with myo‐inositol for preventing gestational diabetes | ||||||
| Patient or population: pregnant women (women with pre‐existing type 1 or type 2 diabetes are NOT included) Setting: Italy | ||||||
| Outcomes | Anticipated absolute effects* (95% CI) | Relative effect | № of participants | Quality of the evidence | Comments | |
| Risk with control | Risk with Myo‐inositol | |||||
| Gestational diabetes mellitus | Study population | RR 0.43 | 502 | ⊕⊕⊝⊝ | GDM diagnosed using IADPSG 2010 criteria | |
| 28 per 100 | 12 per 100 | |||||
| Weight gain during pregnancy | The mean weight gain during pregnancy was 0 | The mean weight gain during pregnancy in the intervention group was 0.64 more (0.41 fewer to 1.7 more) | ‐ | 411 | ⊕⊝⊝⊝ | D'Anna 2015 included obese pregnant women and D'Anna 2013 included non‐obese women with a family history of type 2 diabetes Random‐effects model |
| Hypertensive disorders of pregnancy | Study population | RR 0.43 | 398 | ⊕⊝⊝⊝ | Random‐effects model | |
| 4 per 100 | 2 per 100 | |||||
| Caesarean section | Study population | RR 0.95 | 398 | ⊕⊕⊝⊝ | ||
| 45 per 100 | 43 per 100 | |||||
| Perineal trauma | Not estimable | (0 studies) | No data reported for perineal trauma in any of the included studies | |||
| Postnatal depression | Not estimable | (0 studies) | No data reported for postnatal depression in any of the included studies | |||
| Type 2 diabetes | Not estimable | (0 studies) | No data reported for type 2 diabetes in any of the included studies | |||
| *The risk in the intervention group (and its 95% confidence interval) is based on the assumed risk in the comparison group and the relative effect of the intervention (and its 95% CI). | ||||||
| GRADE Working Group grades of evidence | ||||||
| 1 Downgraded (‐1) due to unclear risk of bias for allocation concealment in two of the included trials (one trial did not provide sufficient detail to determine allocation concealment and one trial (reported as a conference abstract) had no details of random sequence generation, allocation concealment or blinding) and for high risk of performance bias for lack of blinding (two trials were open‐label trials with no blinding of participants or researchers, however one trial explicitly described blinding of outcome assessors and was assessed as low risk of detection bias). 2 Studies were conducted in Italy with Caucasian women and generalisability of findings is limited, downgraded (‐1). 3 Evidence of imprecision with wide confidence intervals crossing the line of no effect, downgraded (‐1). 4 Heterogeneity high with I2 = 54% (indirectness) probably due to different study populations, downgraded (‐1). 5 Wide confidence intervals with very low event rates and a small sample size suggest evidence of imprecision, downgraded (‐1). 6 Downgraded (‐1) due to insufficient evidence to judge allocation concealment in one trial and subsequent judgement of unclear risk of bias. The other trial had a low risk of bias for allocation concealment. Both trials were open‐label with no blinding of participants or researchers, although one trial explicitly stated that outcome assessors were blinded to treatment allocation. | ||||||
| Antenatal supplementation with myo‐inositol for preventing gestational diabetes | ||||||
| Patient or population: pregnant women who were at risk of GDM Setting: Italy | ||||||
| Outcomes | Anticipated absolute effects* (95% CI) | Relative effect | № of participants | Quality of the evidence | Comments | |
| Risk with control | Risk with Myo‐inositol | |||||
| Large‐for‐gestational age | not estimable | (0 studies) | No data reported for large‐for‐gestational age in any of the included studies | |||
| Perinatal mortality | not estimable | (0 studies) | No data reported for perinatal mortality in any of the included studies | |||
| Composite of serious neonatal outcomes | not estimable | (0 studies) | No data reported for composite of serious neonatal outcomes in any of the included studies | |||
| Neonatal hypoglycaemia | Study population | RR 0.36 | 398 | ⊕⊝⊝⊝ | ||
| 0 per 100 | 0 per 100 | |||||
| Adiposity | not estimable | (0 studies) | No data reported for adiposity in any of the included studies | |||
| Diabetes | not estimable | (0 studies) | No data reported for diabetes in any of the included studies | |||
| Neurosensory disability | not estimable | (0 studies) | No data reported for neurosensory disability in any of the included studies | |||
| *The risk in the intervention group (and its 95% confidence interval) is based on the assumed risk in the comparison group and the relative effect of the intervention (and its 95% CI). | ||||||
| GRADE Working Group grades of evidence | ||||||
| 1 No blinding in either study and reporting of allocation concealment was unclear in one of the studies, downgraded (‐1). 2 Both studies were conducted in Italy with Caucasian women and may not be generalisable to other settings, downgraded (‐1). 3 Wide confidence intervals with very low event rates suggest evidence of imprecision, downgraded (‐1). | ||||||
Background
Description of the condition
Gestational diabetes mellitus (GDM) is defined as any degree of glucose intolerance with onset or first recognition during pregnancy (Alberti 1998). GDM imposes several complications for affected women and their babies making it crucial for effective strategies for prevention.
Screening for, and diagnosis of GDM, usually undertaken between 24 and 28 weeks' of pregnancy, varies from country to country, with some countries selectively screening based on risk factors (NICE 2015), and other countries using universal screening of all pregnant women (Nankervis 2013). If thresholds for the oral glucose challenge test (OGCT) are exceeded, a diagnostic oral glucose tolerance test (OGTT) is used to confirm diagnosis, or a diagnostic OGTT can be used without screening by OGCT (MoH 2014).
A number of risk factors are associated with developing gestational diabetes mellitus (Nankervis 2013):
-
previous GDM;
-
previously elevated blood glucose level;
-
ethnicity: south and southeast Asian, Aboriginal, Pacific Islander, Maori, Middle Eastern, African;
-
age ≥ 40 years;
-
family history of diabetes mellitus (first‐degree relative with diabetes mellitus or a sister with GDM);
-
obesity, especially body mass index (BMI) greater than 35 kg/m2;
-
previous macrosomia (baby with birthweight greater than 4500 g or greater than 90th percentile);
-
polycystic ovarian syndrome;
-
medications: corticosteroids, antipsychotics;
-
pregnancy weight gain.
Several studies have reported an increasing prevalence of GDM (Ferrara 2007). As many as 50% of women with GDM will develop type 2 diabetes within five years of the index pregnancy (Kim 2002). Gestational diabetes mellitus increases the risk of serious injury at birth, the likelihood of caesarean delivery, and the incidence of newborn intensive care unit (NICU) admission (Ali 2011). Infants of women with GDM are at increased risk of developing obesity, impaired glucose tolerance, and diabetes as children or young adults (Pettitt 1983; Pettitt 1988; Silverman 1998).
Description of the intervention
Both non‐pharmacological and pharmacological interventions have been used to try and prevent gestational diabetes.
A Cochrane review 'Dietary advice in pregnancy for preventing gestational diabetes mellitus’ (Tieu 2008) concluded that while a low glycaemic index (GI) diet was beneficial for some outcomes for the mother (lower maternal fasting glucose concentration) and child (reduction in large‐for‐gestational‐age infants, lower ponderal index), the evidence is limited. Similarly, the review 'Exercise for pregnant women for preventing gestational diabetes mellitus' concluded that there is limited evidence to currently support exercise during pregnancy for the prevention of glucose intolerance or GDM (Han 2012). A recently published review 'Diet and exercise interventions for preventing gestational diabetes mellitus' assessing the effects of physical exercise in combination with dietary advice for pregnant women for preventing GDM, and health consequences for the mother and her infant/child (Bain 2015), found no clear differences in outcomes between women receiving diet and exercise interventions compared with those receiving no intervention.
Metformin, an oral anti‐diabetic drug in the biguanide class, is the first‐line drug of choice for the treatment of type 2 diabetes (Nankervis 2013). Metformin has been used to prevent GDM in pregnant women with a history of polycystic ovary syndrome (PCOS) with contrasting results (Glueck 2008; Tang 2012). A recent trial on the effect of metformin on obese pregnant women found that while fasting glucose and insulin were lower at 28 weeks' gestation in the metformin group, there was no difference in the risk of developing gestational diabetes, by either IADSPG or WHO criteria, between those women who received metformin and those who received placebo (Chiswick 2015).
Myo‐inositol is a nutrient the body requires for cell membrane formation and cellular reactions to environmental messages (Croze 2013). It is an isomer of inositol, one of the intracellular mediators of the insulin signal and is correlated with insulin sensitivity in type 2 diabetes (Kennington 1990; Suzuki 1994). Inositol is commonly found in cereals, legumes and nuts (Croze 2013).
Due to its role as a second messenger, myo‐inositol has many benefits. When used as a co‐treatment in patients with subclinical hypothyroidism and autoimmune thyroiditis, it aided in maintaining euthyroidism (normal production of thyroid hormone) (Nordio 2013). Myo‐inositol has been associated with an improvement in premenstrual dysphoric disorder (PMDD), a mood disorder disrupting the social and/or occupational life of affected women (Carlomagno 2011). Myo‐inositol has also been associated with improvements in a range of symptoms of PCOS, a medical condition characterised by insulin resistance (Papaleo 2007). Inositol has been associated with improvements in insulin sensitivity and ovulatory function in young women affected by PCOS (Genazzani 2008; Nestler 1999). Furthermore, myo‐inositol has been associated with improvements in hyperandrogenism in women with PCOS (Minozzi 2008), and increased number and quality of oocytes in women undergoing IVF treatment for a previous history of infertility (Unfer 2011).
How the intervention might work
Given the above beneficial effects on improving insulin sensitivity, myo‐inositol may be useful for women with gestational diabetes. In a small randomised controlled trial of myo‐inositol in 69 women with gestational diabetes, markers of insulin resistance were improved in the study group (n = 24) compared with the control group (n = 45) (Corrado 2011). A retrospective review of 46 pregnant women treated with myo‐inositol compared with 37 controls described it as safe during the pre‐pregnancy and early pregnancy period when used in insulin‐resistant conditions (D'Anna 2012). No women in either of these studies reported side effects of treatment.
Why it is important to do this review
GDM is an increasing problem worldwide. Identification of effective preventive measures for GDM is of great importance.
Objectives
To assess if supplements of myo‐inositol are safe and effective, for the mother and fetus, in preventing gestational diabetes.
Methods
Criteria for considering studies for this review
Types of studies
All published and unpublished randomised controlled trials and conference abstracts assessing the effects of myo‐inositol for the prevention of gestational diabetes mellitus (GDM) were considered for inclusion. We planned to include cluster‐randomised trials but none were identified. Quasi‐randomised trials and cross‐over trials were not eligible for inclusion.
Types of participants
Trials that recruited pregnant women. Women with pre‐existing type 1 or type 2 diabetes were excluded.
Types of interventions
The intervention includes administration of any doses of myo‐inositol in pregnancy, alone or in a combination preparation, for the purpose of preventing GDM. We included studies where such intervention was compared with those who received no treatment, placebo or another intervention.
Types of outcome measures
Primary outcomes
Maternal outcomes
-
Gestational diabetes mellitus (diagnostic criteria as defined in individual trials)
-
Hypertensive disorders of pregnancy (including pre‐eclampsia, eclampsia, pregnancy‐induced hypertension)
Neonatal outcomes
-
Large‐for‐gestational age (birthweight greater than the 90th centile; or as defined by individual trial)
-
Perinatal mortality (stillbirth and neonatal mortality)
-
Mortality or morbidity composite (variously defined by trials, e.g. infant death, shoulder dystocia, bone fracture or nerve palsy)
Secondary outcomes
Maternal outcomes
-
Caesarean section
-
Placental abruption
-
Induction of labour
-
Perineal trauma
-
Postpartum haemorrhage
-
Postpartum infection
-
Weight gain during pregnancy
-
Adherence to the intervention (as defined by trialists)
-
Behaviour changes associated with the intervention (as defined by trialists)
-
Relevant biomarker changes associated with the intervention (e.g. adiponectin, free fatty acids, triglycerides, high‐density lipoproteins (HDL), low‐density lipoproteins (LDL), insulin)
-
Sense of well‐being and quality of life
-
Views of the intervention
-
Breastfeeding (e.g. at discharge, six weeks postpartum)
-
Adverse effects of intervention
Long‐term maternal outcomes
-
Postnatal depression
-
Postnatal weight retention or return to pre‐pregnancy weight
-
Body mass index (BMI)
-
Gestational diabetes mellitus in a subsequent pregnancy
-
Type I diabetes mellitus
-
Type II diabetes mellitus
-
Impaired glucose tolerance
-
Cardiovascular health (as defined by trialists, including blood pressure (BP), hypertension, cardiovascular disease, metabolic syndrome)
Infant outcomes
-
Stillbirth
-
Neonatal mortality
-
Gestational age at birth
-
Preterm birth (less than 37 weeks' gestation and less than 32 weeks' gestation)
-
Apgar score (less than seven at five minutes)
-
Macrosomia
-
Small‐for‐gestational age
-
Birthweight and z‐score
-
Head circumference and z‐score
-
Length and z‐score
-
Ponderal index
-
Adiposity
-
Shoulder dystocia
-
Bone fracture
-
Nerve palsy
-
Respiratory distress syndrome
-
Hypoglycaemia (variously defined)
-
Hyperbilirubinaemia
Childhood outcomes
-
Weight and z scores
-
Height and z scores
-
Head circumference and z scores
-
Adiposity (e.g. as measured by BMI, skinfold thickness)
-
Blood pressure
-
Type I diabetes mellitus
-
Type II diabetes mellitus
-
Impaired glucose tolerance
-
Dyslipidaemia or metabolic syndrome
-
Neurodisability
-
Educational achievement
Adulthood outcomes
-
Weight
-
Height
-
Adiposity (e.g. as measured by BMI, skinfold thickness)
-
Cardiovascular health (as defined by trialists, including BP, hypertension, cardiovascular disease, metabolic syndrome)
-
Type I diabetes mellitus
-
Type II diabetes mellitus
-
Impaired glucose tolerance
-
Dyslipidaemia or metabolic syndrome
-
Employment, education and social status/achievement
Health services cost
-
Number of hospital or health professional visits (e.g. midwife, obstetrician, physician, dietitian, diabetic nurse)
-
Number of antenatal visits or admissions
-
Length of antenatal stay
-
Neonatal intensive care unit (NICU) admission
-
Length of postnatal stay (mother)
-
Length of postnatal stay (baby)
-
Costs to families associated with the management provided
-
Costs associated with the intervention
-
Cost of maternal care
-
Cost of offspring care
Search methods for identification of studies
The following methods section of this protocol is based on a standard template used by the Cochrane Pregnancy and Childbirth Group.
Electronic searches
We searched the Cochrane Pregnancy and Childbirth Group’s Trials Register by contacting the Trials Search Co‐ordinator (2 November 2015).
For full search methods used to populate the Pregnancy and Childbirth Group's Trials Register including the detailed search strategies for CENTRAL, MEDLINE, Embase and CINAHL; the list of handsearched journals and conference proceedings, and the list of journals reviewed via the current awareness service, please follow this link to the editorial information about the Cochrane Pregnancy and Childbirth Group in The Cochrane Library and select the ‘Specialized Register ’ section from the options on the left side of the screen.
Briefly, the Cochrane Pregnancy and Childbirth Group’s Trials Register is maintained by the Trials Search Co‐ordinator and contains trials identified from:
-
monthly searches of the Cochrane Central Register of Controlled Trials (CENTRAL);
-
weekly searches of MEDLINE (Ovid);
-
weekly searches of Embase (Ovid);
-
monthly searches of CINAHL (EBSCO);
-
handsearches of 30 journals and the proceedings of major conferences;
-
weekly current awareness alerts for a further 44 journals plus monthly BioMed Central email alerts.
Search results are screened by two people and the full text of all relevant trial reports identified through the searching activities described above is reviewed. Based on the intervention described, each trial report is assigned a number that corresponds to a specific Pregnancy and Childbirth Group review topic (or topics), and is then added to the Register. The Trials Search Co‐ordinator searches the Register for each review using this topic number rather than keywords. This results in a more specific search set which has been fully accounted for in the relevant review sections (Included, Excluded, Awaiting Classification or Ongoing).
In addition, we searched ClinicalTrials.gov and the WHO International Clinical Trials Registry Platform (ICTRP) for unpublished, planned and ongoing trial reports. The search terms used are given in Appendix 1.
Searching other resources
We searched reference lists of retrieved studies.
We did not apply any language or date restrictions.
Data collection and analysis
Selection of studies
Two review authors (TC and JB) independently assessed for inclusion all the potential studies identified as a result of the search strategy. We resolved any disagreement through discussion. We created a study flow diagram (Figure 1) to map out the number of records identified, included and excluded.
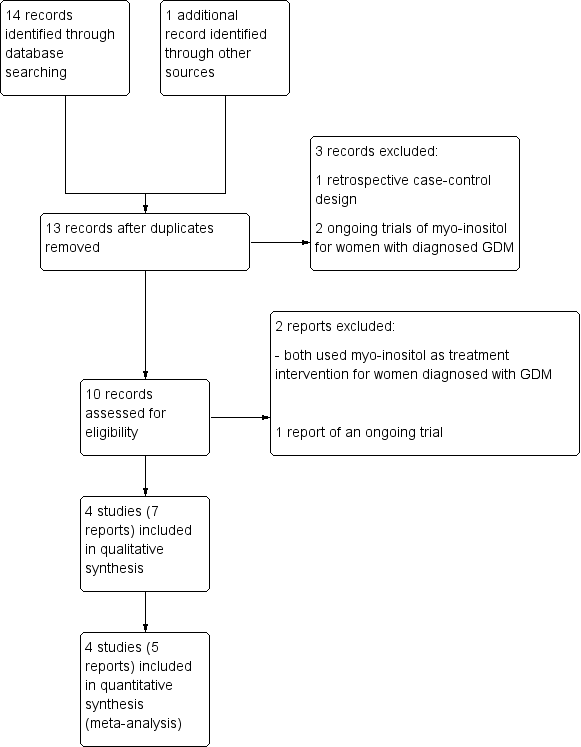
‐Study flow diagram.
Data extraction and management
We designed a form to extract data based on the Cochrane Pregnancy and Childbirth Group's data extraction form. For eligible studies, two review authors (TC and JB or JA) independently extracted the data using the agreed form. We resolved discrepancies through discussion. Data were entered into Review Manager software (RevMan 2014) and checked for accuracy. When information regarding any of the above was unclear, we attempted to contact authors of the original reports to provide further details.
Assessment of risk of bias in included studies
The following methods section of this review is based on a standard template used by the Cochrane Pregnancy and Childbirth Group.
Two review authors independently assessed risk of bias for each study using the criteria outlined in the Cochrane Handbook for Systematic Reviews of Interventions (Higgins 2011). We resolved any disagreement by discussion.
(1) Random sequence generation (checking for possible selection bias)
We described for each included study the method used to generate the allocation sequence in sufficient detail to allow an assessment of whether it should produce comparable groups.
We assessed the method as:
-
low risk of bias (any truly random process, e.g. random number table; computer random number generator);
-
high risk of bias (any non‐random process, e.g. odd or even date of birth; hospital or clinic record number);
-
unclear risk of bias.
(2) Allocation concealment (checking for possible selection bias)
We described for each included study the method used to conceal allocation to interventions prior to assignment and assessed whether intervention allocation could have been foreseen in advance of, or during recruitment, or changed after assignment.
We assessed the methods as:
-
low risk of bias (e.g. telephone or central randomisation; consecutively numbered sealed opaque envelopes);
-
high risk of bias (open random allocation; unsealed or non‐opaque envelopes, alternation; date of birth);
-
unclear risk of bias.
(3.1) Blinding of participants and personnel (checking for possible performance bias)
We described for each included study the methods used, if any, to blind study participants and personnel from knowledge of which intervention a participant received. We considered that studies were at low risk of bias if they were blinded, or if we judged that the lack of blinding would be unlikely to affect results. We assessed blinding separately for different outcomes or classes of outcomes.
We assessed the methods as:
-
low, high or unclear risk of bias for participants;
-
low, high or unclear risk of bias for personnel.
(3.2) Blinding of outcome assessment (checking for possible detection bias)
We described for each included study the methods used, if any, to blind outcome assessors from knowledge of which intervention a participant received. We assessed blinding separately for different outcomes or classes of outcomes.
We assessed the methods used to blind outcome assessment as:
-
low, high or unclear risk of bias.
(4) Incomplete outcome data (checking for possible attrition bias due to the amount, nature and handling of incomplete outcome data)
We described for each included study, and for each outcome or class of outcomes, the completeness of data including attrition and exclusions from the analysis. We stated whether attrition and exclusions were reported and the numbers included in the analysis at each stage (compared with the total randomised participants), reasons for attrition or exclusion where reported, and whether missing data were balanced across groups or were related to outcomes. Where sufficient information was reported, or could be supplied by the trial authors, we re‐included missing data in the analyses which we undertook.
We assessed the methods as:
-
low risk of bias (e.g. no missing outcome data; missing outcome data balanced across groups);
-
high risk of bias (e.g. numbers or reasons for missing data imbalanced across groups; ‘as treated’ analysis done with substantial departure of intervention received from that assigned at randomisation);
-
unclear risk of bias.
(5) Selective reporting (checking for reporting bias)
We described for each included study how we investigated the possibility of selective outcome reporting bias and what we found.
We assessed the methods as:
-
low risk of bias (where it is clear that all of the study’s pre‐specified outcomes and all expected outcomes of interest to the review have been reported);
-
high risk of bias (where not all the study’s pre‐specified outcomes have been reported; one or more reported primary outcomes were not pre‐specified; outcomes of interest are reported incompletely and so cannot be used; study fails to include results of a key outcome that would have been expected to have been reported);
-
unclear risk of bias.
(6) Other bias (checking for bias due to problems not covered by (1) to (5) above)
We described for each included study any important concerns we have about other possible sources of bias.
We assessed whether each study was free of other problems that could put it at risk of bias:
-
low risk of other bias;
-
high risk of other bias;
-
unclear whether there is risk of other bias.
(7) Overall risk of bias
We made explicit judgements about whether studies are at high risk of bias, according to the criteria given in the Handbook (Higgins 2011). With reference to (1) to (6) above, we assessed the likely magnitude and direction of the bias and whether we considered it is likely to impact on the findings. We explored the impact of the level of bias through undertaking sensitivity analyses ‐ seeSensitivity analysis.
Assessing the quality of the body of evidence using the GRADE approach
We assessed the quality of the evidence using the GRADE approach as outlined in the GRADE handbook in order to assess the quality of the body of evidence relating to the following outcomes for the main comparisons.
Maternal
-
Diagnosis of GDM
-
Gestational weight gain
-
Hypertensive disorders of pregnancy (including pre‐eclampsia, eclampsia, pregnancy‐induced hypertension)
-
Caesarean section
-
Perineal trauma
-
Postnatal depression
-
Development of subsequent type II diabetes mellitus
Neonatal, child, adult outcomes
-
Large‐for‐gestational age
-
Perinatal mortality (stillbirth and neonatal mortality)
-
Composite of serious neonatal outcomes
-
Neonatal hypoglycaemia (variously defined)
-
Adiposity (e.g. as measured by BMI, skinfold thickness)
-
Diabetes
-
Neurosensory disability
We used the GRADEpro Guideline Development Tool to import data from Review Manager 5.3 (RevMan 2014) in order to create 'Summary of findings’ tables. A summary of the intervention effect and a measure of quality for each of the above outcomes was produced using the GRADE approach. The GRADE approach uses five considerations (study limitations, consistency of effect, imprecision, indirectness and publication bias) to assess the quality of the body of evidence for each outcome. The evidence can be downgraded from 'high quality' by one level for serious (or by two levels for very serious) limitations, depending on assessments for risk of bias, indirectness of evidence, serious inconsistency, imprecision of effect estimates or potential publication bias.
Measures of treatment effect
Dichotomous data
For dichotomous data, we presented results as summary risk ratio with 95% confidence intervals.
Continuous data
For continuous data, we used the mean difference with 95% confidence intervals. We planned to use the standardised mean difference to combine trials that measured the same outcome, but used different methods, again with 95% confidence intervals.
Unit of analysis issues
Cluster‐randomised trials
No cluster‐randomised trials were identified for inclusion in this review. If cluster‐randomised trials are identified for inclusion in future updates of this review, they will be included in the analyses along with individually‐randomised trials. We will make adjustments using the methods described in the Handbook [Section 16.3.4 or 16.3.6] using an estimate of the intracluster correlation co‐efficient (ICC) derived from the trial (if possible), from a similar trial or from a study of a similar population. If we use ICCs from other sources, we will report this and conduct sensitivity analyses to investigate the effect of variation in the ICC. We will consider it reasonable to combine the results from both cluster‐randomised trials and individually‐randomised trials if there is little heterogeneity between the study designs and the interaction between the effect of intervention and the choice of randomisation unit is considered to be unlikely.
Multiple pregnancy
There may be unit of analysis issues that arise when the women randomised have a multiple pregnancy. We present maternal data as per woman randomised and neonatal data per infant.
Multiple arm studies
In future updates of this review, where a trial has multiple intervention arms we will avoid 'double counting' of participants by combining groups to create a single pair‐wise comparison if possible. Where this is not possible we will split the 'shared' group into two or more groups with smaller sample size and include two or more (reasonably independent) comparisons.
Dealing with missing data
For included studies, we noted levels of attrition. We planned to explore the impact of including studies with high levels of missing data in the overall assessment of treatment effect by using sensitivity analysis.
For all outcomes, we carried out analyses, as far as possible, on an intention‐to‐treat basis, i.e. we attempted to include all participants randomised to each group in the analyses, and all participants were analysed in the group to which they were allocated, regardless of whether or not they received the allocated intervention. The denominator for each outcome in each trial was the number randomised minus any participants whose outcomes were known to be missing.
Assessment of heterogeneity
We assessed statistical heterogeneity in each meta‐analysis using the Tau², I² and Chi² statistics. We regarded heterogeneity as substantial if an I² was greater than 30% and either a Tau² was greater than zero, or there was a low P value (less than 0.10) in the Chi² test for heterogeneity.
Assessment of reporting biases
As there were only four studies identified we did not undertake investigation of reporting biases. In future updates of this review, if 10 or more studies are included in the meta‐analysis, we will investigate reporting biases (such as publication bias) using funnel plots. We will assess funnel plot asymmetry visually. If asymmetry is suggested by a visual assessment, we will perform exploratory analyses to investigate it.
Data synthesis
We carried out statistical analysis using the Review Manager software (RevMan 2014). We used fixed‐effect meta‐analyses for combining data where it was reasonable to assume that studies are estimating the same underlying treatment effect: i.e. where trials are examining the same intervention, and the trials’ populations and methods are judged sufficiently similar. If there was clinical heterogeneity sufficient to expect that the underlying treatment effects differed between trials, or if substantial statistical heterogeneity was detected, we used random‐effects meta‐analysis to produce an overall summary, if an average treatment effect across trials was considered clinically meaningful. The random‐effects summary was treated as the average of the range of possible treatment effects and we discussed the clinical implications of treatment effects differing between trials. If the average treatment effect was not clinically meaningful, we did not combine trials.
Where we used random‐effects analyses, the results are presented as the average treatment effect with 95% confidence intervals, and the estimates of Tau² and I².
Subgroup analysis and investigation of heterogeneity
If we identified substantial heterogeneity, we investigated it using subgroup analyses and sensitivity analyses where data were available. We considered whether an overall summary was meaningful, and if it was, used random‐effects analysis to produce it.
We planned to conduct the following subgroup analyses, but were unable to split the participant data into subgroups and none of the included trials commenced supplementation with myo‐inositol pre‐pregnancy.
-
Polycystic ovary syndrome (PCOS) women versus non‐PCOS women
-
Obese women versus non‐obese women
-
Dosage ‐ high versus low dose
-
Myo‐inositol alone or in combination versus non myo‐inositol combination
-
Commencement of myo‐inositol supplementation ‐ pre‐pregnancy versus first trimester
We planned to restrict subgroup analysis to this review's primary outcomes.
In future versions of this review, we will assess subgroup differences by interaction tests available within RevMan (RevMan 2014). We will report the results of subgroup analyses quoting the Chi2 statistic and P value, and the interaction test I² value.
Sensitivity analysis
We had insufficient trials to conduct sensitivity analysis for this review. If in future updates there are sufficient trials for analysis, and there is evidence of significant heterogeneity for primary outcomes, we will explore heterogeneity by using the quality of the included trials. We will compare trials that have low risk of bias for allocation concealment with those judged to be of unclear or high risk of bias.
Results
Description of studies
Results of the search
See: Figure 1.
We assessed 15 trial reports, two were duplicates, three were screened out at title and abstract stage. Four trials (seven reports) are included, two are excluded and we added one to Ongoing studies.
Included studies
Study design
We included four randomised controlled trials, three published trials (D'Anna 2013; D'Anna 2015; Malvasi 2014) and a conference abstract (Facchinetti 2013).
Setting
All trials were conducted in Italy.
Participants
All trials were conducted in pregnant women.
Gestational age at trial entry
-
< 11 weeks' gestation (Facchinetti 2013)
-
12 to 13 weeks' gestation (D'Anna 2013; D'Anna 2015)
-
13 to 24 weeks' gestation (Malvasi 2014)
Body mass index (BMI)
-
< 30 kg/m2 (D'Anna 2013)
-
≥ 30 kg/m2 (D'Anna 2015)
-
> 27 kg/m2 (Facchinetti 2013)
-
Between 25 and 30 kg/m2 (Malvasi 2014)
Groups were comparable at baseline for age, parity, BMI and haematological parameters in Malvasi 2014. In both D'Anna 2015 and D'Anna 2013, the participants were comparable between groups at baseline for maternal age, gestational age at commencement of treatment and gestational age at time of oral glucose tolerance test (OGTT). D'Anna 2013 included women exclusively of Caucasian ethnicity. Ethnicty is not mentioned in the inclusion criteria in D'Anna 2015; Facchinetti 2013 and Malvasi 2014. An inclusion criterion in D'Anna 2013 was a first‐degree relative with type 2 diabetes. Women with pre‐existing diabetes mellitus were excluded from D'Anna 2013, D'Anna 2015, and Malvasi 2014.
Intervention and comparison
Myo‐inositol dose
The following doses of myo‐inositol were reported.
-
4 g myo‐inositol plus 400 mcg folic acid daily in divided doses (2 g myo‐inositol plus 200 mcg folic acid twice a day) (D'Anna 2013; D'Anna 2015; Facchinetti 2013)
-
2 g myo‐inositol, 400 mg d‐chiro‐inositol, 400 mcg folic acid and 10 mg manganese per day in one dose (Malvasi 2014)
Comparison
The following comparisons were reported.
-
200 mcg folic acid (D'Anna 2013; D'Anna 2015)
-
Folic acid dose not stated (Facchinetti 2013)
-
No description of what constituted the 'placebo' administered to the control group (Malvasi 2014)
D'Anna 2015 provided nutritional and lifestyle counselling to women in both the treatment and control group. None of the other included trials detailed the provision of any nutritional or lifestyle counselling to their participants.
Diagnostic criteria used to diagnose GDM
-
International Association of Diabetes and Pregnancy Study Groups (IADPSG 2010): (D'Anna 2013; D'Anna 2015)
-
Not stated: (Facchinetti 2013; Malvasi 2014)
Outcomes
Three trials reported on gestational diabetes mellitus and provided fasting, one‐ and two‐hour blood glucose results (D'Anna 2013; D'Anna 2015; Facchinetti 2013). Two trials reported a number of maternal and infant outcomes such as hypertensive disorders of pregnancy, caesarean section, weight gain during pregnancy, adverse effects of intervention, gestational age at birth, preterm birth, macrosomia, birthweight, shoulder dystocia and neonatal hypoglycaemia (D'Anna 2013; D'Anna 2015).
One trial reported on relevant biomarker changes associated with the intervention (Malvasi 2014), and only one trial reported on neonatal respiratory distress syndrome (D'Anna 2013).
Funding sources
Three trials did not state the source of funding (D'Anna 2013; Facchinetti 2013; Malvasi 2014). D'Anna 2015 was funded by a grant from Messina Univeristy, Italy. Two trials reported that none of the authors had any potential financial conflicts of interest (D'Anna 2015; Malvasi 2014).
Ongoing studies
One ongoing trial using myo‐inositol 4 g plus folic acid 400 mcg as the intervention and folic acid 400 mcg as the control has been identified for potential inclusion in an update of this review when it is published (Farren 2013) (See Ongoing studies).
Excluded studies
Two studies were excluded (Corrado 2011; Matarrelli 2013) as they did not use myo‐inositol as a preventative intervention in women at risk of developing gestational diabetes, but rather used myo‐inositol as a treatment for women already diagnosed with gestational diabetes. See Characteristics of excluded studies.
Risk of bias in included studies
The overall risk of bias appears to be 'unclear', in part due to the insufficient information provided in Facchinetti 2013 and Malvasi 2014 to make an assessment of risk of bias, and part due to the lack of blinding of participants and clinicians in D'Anna 2013 and D'Anna 2015. Refer to Figure 2 and Figure 3.
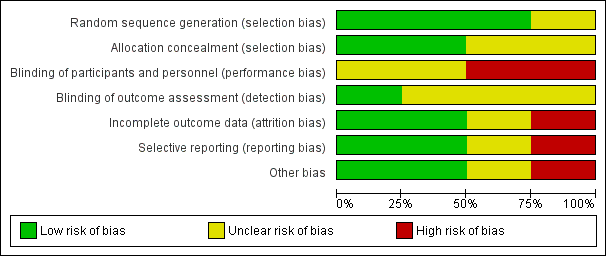
'Risk of bias' graph: review authors' judgements about each risk of bias item presented as percentages across all included studies.
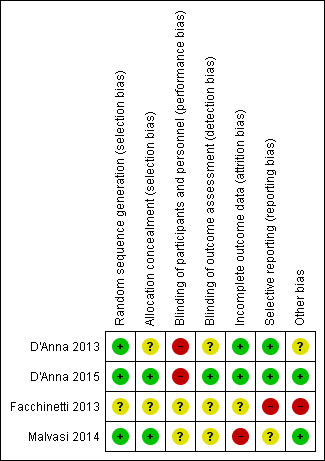
'Risk of bias' summary: review authors' judgements about each risk of bias item for each included study.
Allocation
Two trials used a computer‐generated random sequence (D'Anna 2015, D'Anna 2013), and one used a random number table (Malvasi 2014) and were assessed as having a low risk of selection bias. Facchinetti 2013 stated the participants were randomised but the abstract did not provide any further information on the method of sequence generation. Consequently, this trial was assessed as having an unclear risk of selection bias.
The method of allocation concealment was not stated in two of the trials (D'Anna 2013; Facchinetti 2013), and these were assessed as having an unclear risk of bias. D'Anna 2015 and Malvasi 2014 described allocation assignment by a centralised contact who was independent of the recruitment process these were assessed as low risk of bias.
Blinding
Facchinetti 2013 did not provide sufficient information to make a judgement and was assessed as having an unclear risk of bias. D'Anna 2013 states that the trial was open label with blinding not being undertaken. This was assessed as having a high risk of performance bias. Neither of these trials described blinding of outcome assessment and both were therefore assessed as having an unclear risk of detection bias. Whilst the outcome of incidence of gestational diabetes is diagnosed by blood test and is unlikely to be affected by blinding, other outcomes such as neonatal respiratory distress syndrome are more subjective and may be impacted by knowledge of treatment group.
D'Anna 2015 was an open‐label trial and was assessed as high risk for performance bias. However, researchers collecting data were blinded to allocation group and the primary outcome was an objective measurement of laboratory values. This study was assessed as having a low risk of detection bias.
Malvasi 2014 blinded participants but the clinicians involved were aware of the treatment allocation. This was assessed as an unclear risk of performance bias. No mention was made of blinding of outcome assessors and was therefore assessed as having an unclear risk of detection bias.
Incomplete outcome data
D'Anna 2015, and D'Anna 2013 were assessed as having a low risk of attrition bias for minimal losses to follow‐up. There was 9% overall loss to follow‐up in D'Anna 2015, and 10% overall loss to follow‐up in D'Anna 2013.
Malvasi 2014 was assessed as having a high risk of attrition bias due to 26% overall attrition (17 women excluded from final analysis). Seven women left the trial spontaneously but their group allocation, or reasons for withdrawing were not stated.
Facchinetti 2013 was assessed as having an unclear risk of attrition bias as it was an interim analysis at 50% of recruitment and it is unclear how many women had been recruited at that point as the denominator is not stated.
Selective reporting
Two trials were assessed as having a low risk of reporting bias as all pre‐specified outcome measures were reported on (D'Anna 2015; D'Anna 2013). While Malvasi 2014 reported on all pre‐specified outcomes, it was assessed as having an unclear risk of reporting bias as blood glucose concentration was not specified if it was fasting or post prandial and the results were not able to be included in the analysis. In addition, this trial did not include any pregnancy outcome or neonatal results.
One trial was assessed as having a high risk of bias as primary as secondary outcomes were not stated, and only OGTT results and the incidence of GDM were reported (Facchinetti 2013).
Other potential sources of bias
Facchinetti 2013 was assessed as being at high risk of other bias, as it was available only as a conference abstract. D'Anna 2013 has an unclear risk of other bias for stating in the manuscript that intention‐to‐treat analysis was conducted on the available data, but only per‐protocol analysis is published. D'Anna 2015 and Malvasi 2014 were both assessed as being at a low risk of 'other' bias.
Effects of interventions
See: Summary of findings for the main comparison Myo‐inositol for preventing gestational diabetes maternal outcomes (maternal outcomes); Summary of findings 2 Myo‐inositol for preventing gestational diabetes (neonatal, child and adult outcomes)
The quality of the evidence of the included studies is summarised in the summary of findings Table for the main comparison and summary of findings Table 2 for the pre‐specified outcomes of this review.
1.0 Myo‐inositol versus control
Four trials were identified that compared myo‐inositol and control groups who received 'placebo' (D'Anna 2015; D'Anna 2013; Facchinetti 2013; Malvasi 2014).
Maternal primary outcomes
1.1 Gestational diabetes mellitus
For the mother, myo‐inositol was associated with a reduction in the incidence of gestational diabetes mellitus (GDM) compared with control (risk ratio (RR) 0.43, 95% confidence interval (CI) 0.29 to 0.64; three trials; n = 502 women) (D'Anna 2013; D'Anna 2015; Facchinetti 2013) (Analysis 1.1).
Using the GRADEpro Guideline Development Tool, the quality of the evidence was considered to be low due to issues around risk of bias and indirectness. For women who received myo‐inositol, the risk of GDM ranged from 8% to 18%; for women in the control group, the risk of GDM was 28%.
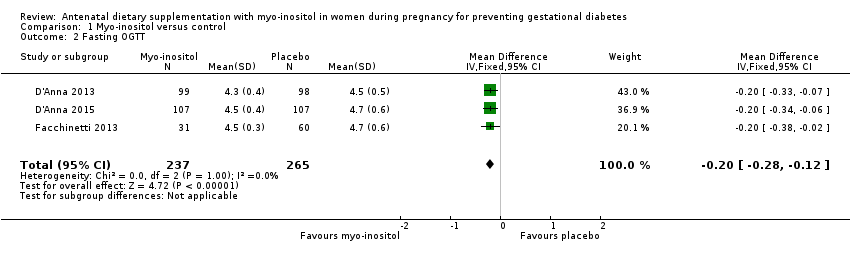
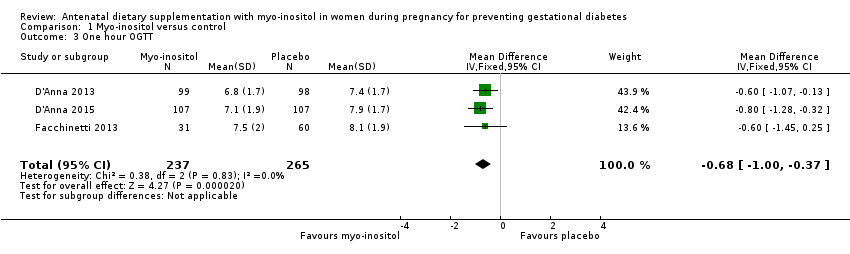
Three studies reported on blood glucose concentrations at the time of the diagnostic 75 g oral glucose tolerance test at 24 to 28 weeks' gestation. Myo‐inositol was associated with a reduction in blood glucose concentrations compared to the control group.
-
Fasting: mean difference (MD) ‐0.20 mmol/L, 95% CI ‐0.28 to ‐0.12; three trials; n = 502 women; Analysis 1.2.
-
One hour: MD ‐0.68 mmol/L, 95% CI ‐1.00 to ‐0.37; three trials; n = 502 women; Analysis 1.3.
-
Two hours: MD ‐0.75 mmol/L, 95% CI ‐1.07 to ‐0.43; three trials; n = 502 women; Analysis 1.4.
1.2 Hypertensive disorders of pregnancy (including pre‐eclampsia, eclampsia, pregnancy‐induced hypertension)
Two trials reported on hypertensive disorders of pregnancy (D'Anna 2013; D'Anna 2015). There was no clear difference in the risk of gestational hypertension between women treated with myo‐inositol and those receiving a 'placebo' (average RR 0.43, 95%CI 0.02 to 8.41; two trials, n = 398 women; random‐effects model used; Tau2 = 3.23; I2 = 69%) (Analysis 1.5). Using the GRADEpro Guideline Development Tool, the quality of the evidence was considered to bevery low due to issues around risk of bias, imprecision and indirectness. For women who received myo‐inositol, the risk of hypertensive disorders of pregnancy ranged from 0% to 33%; for women in the control group, the risk of was 4%. Heterogeneity is most likely explained through the different populations recruited into the trials. The inclusion criteria for D'Anna 2015 was for obese pregnant women and D'Anna 2013 recruited women who were not obese but had a family history of type 2 diabetes. Additionally, nutritional and lifestyle counselling was provided to both the intervention and control groups in D'Anna 2015, but was not provided in D'Anna 2013.
Neonatal primary outcomes
Large‐for‐gestational age
None of the included trials reported data on the primary neonatal outcome of large‐for‐gestational age.
Perinatal mortality
None of the included trials reported data on the primary neonatal outcome of perinatal mortality.
Mortality or morbidity composite (variously defined by trials, e.g. infant death, shoulder dystocia, bone fracture or nerve palsy)
None of the included trials reported data on the primary neonatal outcome of death or morbidity composite.
Maternal secondary outcomes
Caesarean section
There was no clear difference in the risk of caesarean section between the myo‐inositol and control groups (RR 0.95, 95% CI 0.76 to 1.19; two trials; n = 398 women) (D'Anna 2013; D'Anna 2015) (Analysis 1.6).
Using the GRADEpro Guideline Development Tool, the quality of the evidence was considered to be low due to issues around risk of bias and indirectness. For women who received myo‐inositol, the risk of birth by caesarean section ranged from 34% to 54%; for women in the control group, the risk of having a caesarean section was 45%.
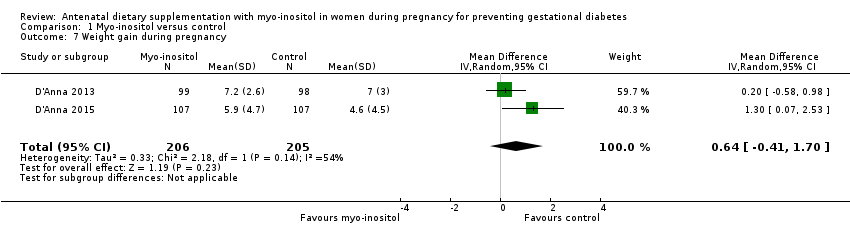
Weight gain during pregnancy
There was no difference in weight gain during pregnancy between those women who received myo‐inositol supplementation compared with those in the control group (MD 0.64 kg, 95% CI ‐0.41 to 1.70; two trials; n = 411 women, random‐effects model, Tau2 = 0.33, I2 = 54% ) (D'Anna 2013; D'Anna 2015) (Analysis 1.7). Using the GRADEpro Guideline Development Tool, the quality of the evidence was considered to be very low due to issues around risk of bias, imprecision and indirectness. Heterogeneity is most likely explained through the different populations recruited into the trials. The inclusion criteria for D'Anna 2015 was for obese pregnant women and D'Anna 2013 recruited women who were not obese but had a family history of type 2 diabetes. Additionally, nutritional and lifestyle counselling was provided to both the intervention and control groups in D'Anna 2015, but was not provided in D'Anna 2013.
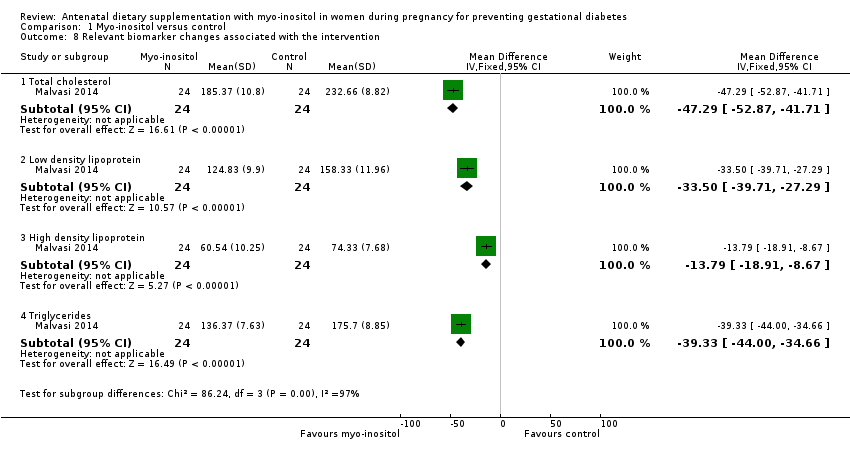
Relevant biomarker changes associated with the intervention
One trial reported on relevant biomarkers (Malvasi 2014) (Analysis 1.8). Myo‐inositol was associated with reduced total cholesterol (MD ‐47.29 mg/dL, 95%CI ‐52.87 to ‐41.71; one trial, n = 48 women), low‐density lipoproteins (LDL) (MD ‐33.50 mg/dL, 95%CI ‐39.71 to ‐27.29; one trial, n = 48 women), high‐density lipoproteins (HDL) (MD ‐13.79 mg/dL, 95%CI ‐18.91 to ‐8.67; one trial, n = 48 women), and triglycerides (MD ‐39.33 mg/dL, 95%CI ‐44.00 to ‐34.66; one trial, n = 48 women) compared with the control group.
Adverse effects of intervention
There were no adverse effects of therapy in the two trials that reported on this outcome (D'Anna 2013; Malvasi 2014). The remaining two trials did not report on adverse effects (D'Anna 2015; Facchinetti 2013).
Other secondary outcomes
No data were reported for any of the other pre‐specified maternal secondary outcomes for this systematic review (placental abruption, induction of labour, perineal trauma, postpartum haemorrhage, postpartum infection, adherence to the intervention (as defined by trialists), behaviour changes associated with the intervention (as defined by trialists), sense of well‐being and quality of life, views of the intervention, breastfeeding (e.g. at discharge, six weeks postpartum), postnatal depression, postnatal weight retention or return to pre‐pregnancy weight, body mass index (BMI), gestational diabetes mellitus in a subsequent pregnancy, type I diabetes, type 2 diabetes, impaired glucose tolerance or cardiovascular health (as defined by trialists, including blood pressure (BP), hypertension, cardiovascular disease, metabolic syndrome)).
Other outcomes not pre‐specified
Although the main aim of the included studies was the prevention of GDM, two of the included trials that continued the intervention until the end of pregnancy reported on the need for additional pharmacological therapy (D'Anna 2013; D'Anna 2015). For interest we include a summary of these data. There was no difference between the myo‐inositol and control groups for the need for supplementary insulin therapy (RR 0.48, 95% CI 0.11 to 2.09; two trials; n = 398 women (Analysis 1.10)).
Neonatal secondary outcomes (infant, child and adult)
There were no differences in secondary neonatal outcomes between infants of mothers supplemented with myo‐inositol and the control groups.
Gestational age at birth
There was no difference in the gestational age at birth between myo‐inositol and control groups (MD 5.50 days, ‐7.24 to 18.24; two trials; n = 398 infants; random‐effects model, Tau2 = 81.58, I2 = 97%) (D'Anna 2013; D'Anna 2015) (Analysis 1.11). Caution is required when interpreting the data due to significant heterogeneity (I2 = 97%). The difference is most likely due to differences in the populations. The inclusion criteria for D'Anna 2015 was for obese pregnant women and D'Anna 2013 recruited women who were not obese but had a family history of type 2 diabetes. Additionally, nutritional and lifestyle counselling was provided to both the intervention and control groups in D'Anna 2015, but was not provided in D'Anna 2013.
Preterm birth
There was no difference for the risk of preterm birth between the myo‐inositol and the control groups (RR 0.45, 95% CI 0.17 to 1.14; two trials; n = 398 infants) (D'Anna 2013; D'Anna 2015) (Analysis 1.12).
Macrosomia
There was no clear difference between myo‐inositol and control groups for the risk of macrosomia (RR 0.35, 95% CI 0.02 to 6.37; two trials; n = 398 infants; random‐effects model, Tau2 = 3.33, I2 = 73%) (D'Anna 2013; D'Anna 2015) (Analysis 1.13).
Caution is required when interpreting the data due to significant heterogeneity (I2 = 73%). The difference is most likely due to differences in the populations. The inclusion criteria for D'Anna 2015 was for obese pregnant women and D'Anna 2013 recruited women who were not obese but had a family history of type 2 diabetes. Additionally, nutritional and lifestyle counselling was provided to both the intervention and control groups in D'Anna 2015, but was not provided in D'Anna 2013.
Birthweight
There was no difference between myo‐inositol and control groups for birthweight (MD ‐60.47 g, 95% CI ‐265.21 to 144.26; two trials; n = 398 infants; random‐effects model, Tau2 = 16609.07, I2 = 76%) (D'Anna 2013; D'Anna 2015) (Analysis 1.14). No data were reported for birthweight z scores.
Caution is required when interpreting the data due to significant heterogeneity (I2 = 76%). The difference is most likely due to differences in the populations. The inclusion criteria for D'Anna 2015 was for obese pregnant women and D'Anna 2013 recruited women who were not obese but had a family history of type 2 diabetes. Additionally, nutritional and lifestyle counselling was provided to both the intervention and control groups in D'Anna 2015, but was not provided in D'Anna 2013.
Shoulder dystocia
There was no difference between myo‐inositol and control groups for the risk of shoulder dystocia (RR 2.33, 95% CI 0.12 to 44.30; two trials; n = 398 infants. Random‐effects model used Tau2 = 3.24%, I2 = 72%) (D'Anna 2013; D'Anna 2015) (Analysis 1.15).
Caution is required when interpreting the data due to significant heterogeneity (I2 = 72%). The difference is most likely due to differences in the populations. The inclusion criteria for D'Anna 2015 was for obese pregnant women and D'Anna 2013 recruited women who were not obese but had a family history of type 2 diabetes. Additionally, nutritional and lifestyle counselling was provided to both the intervention and control groups in D'Anna 2015, but was not provided in D'Anna 2013.
Respiratory distress syndrome
There was no difference between myo‐inositol and control groups for the risk of respiratory distress syndrome (RR 0.99, 95% CI 0.06 to 15.60; one trial; n = 197 infants (D'Anna 2013).
Neonatal hypoglycaemia
There was no difference between myo‐inositol and control groups for the risk of neonatal hypoglycaemia (RR 0.36, 95% CI 0.01 to 8.66; two trials; n = 398 infants) (D'Anna 2013; D'Anna 2015)(Analysis 1.17). Using the GRADEpro Guideline Development Tool, the quality of the evidence was considered to be very low due to issues around risk of bias, imprecision and indirectness. For infants of women who received myo‐inositol, the risk of neonatal hypoglycaemia ranged from 0% to 4%; for infants of women in the control group, the risk of neonatal hypoglycaemia was 0%.
Other secondary outcomes
No other secondary neonatal (infant, child, adult) outcomes of this systematic review were reported (stillbirth, neonatal mortality, Apgar score < five at seven minutes, small‐for‐gestational age, head circumference and z score, length and z score, ponderal index, adiposity, bone fracture, nerve palsy, hyperbilirubinaemia. For the infant as a child and adult, no data were reported for any of the pre‐specified outcomes (weight, height, adiposity (e.g. as measured by BMI, skinfold thickness), cardiovascular health (as defined by trialists, including BP, hypertension, cardiovascular disease, metabolic syndrome), type I diabetes, type 2 diabetes mellitus, impaired glucose tolerance, dyslipidaemia or metabolic syndrome, employment, education and social status/achievement).
Health service outcomes
One trial reported on admission to the neonatal intensive care unit (NICU) (D'Anna 2015). There was no difference in risk of admission to the NICU between myo‐inositol and control groups (RR 0.09, 95% CI 0.01 to 1.70; one trial; n = 201 (D'Anna 2015).
None of the included trials reported any of the other health service outcomes (number of hospital or health professional visits (e.g. midwife, obstetrician, physician, dietitian, diabetic nurse), number of antenatal visits or admissions, length of antenatal stay, length of postnatal stay (mother), length of postnatal stay (baby), costs to families associated with the management provided, costs associated with the intervention, cost of maternal care, cost of offspring care).
Discussion
Summary of main results
Although the evidence is based on four, small trials (three published trials and a conference abstract), it appears that myo‐inositol shows promise in reducing the risk of gestational diabetes. None of the current trials reported on any of the primary neonatal outcomes of this review (large‐for‐gestational age, perinatal mortality or a composite of serious neonatal outcomes), and only two of the included trials reported on hypertensive disorders of pregnancy, one of the maternal primary outcomes of this review.
Overall completeness and applicability of evidence
The included trials were conducted in healthy women and those considered at high risk of developing gestational diabetes mellitus (GDM), including obese and non‐obese women, and those with a family history of type 2 diabetes mellitus. However, applicability is limited by all trials being conducted in Italy amongst predominantly Caucasian women. Further trials in diverse settings, including participants of different ethnicities and varying risk factors would be useful in improving the applicability of the evidence. Not all of the outcomes of interest for this review were addressed in the included studies including pre‐eclampsia, neonatal mortality, or longer‐term maternal and infant health outcomes.
Quality of the evidence
The current available evidence is based on three randomised controlled trials, and a conference abstract that included a total of 567 women and their infants. Overall, there was unclear risk of bias due to insufficient information provided to enable a judgement of risk, particularly with regard to allocation concealment and blinding of outcome assessment. In addition, Facchinetti 2013 was only available as a conference abstract and was considered at high risk of publication bias.
Using the GRADE method, we assessed the quality of the body of evidence for the maternal outcomes of GDM, weight gain during pregnancy, hypertensive disorders of pregnancy, caesarean section, perineal trauma, postnatal depression and type 2 diabetes, and the neonatal outcomes of large‐for‐gestational age, perinatal mortality, composite of serious neonatal outcomes, neonatal hypoglycaemia, adiposity, diabetes and neurosensory disability. The GRADE method considers the risk of bias of the included studies, the directness of the evidence, consistency or heterogeneity of the results, the precision of the effect estimates and the risk for publication bias. No data were reported for the maternal outcomes perineal trauma, postnatal depression and type 2 diabetes, or for the neonatal outcomes large‐for‐gestational age, perinatal mortality, composite of serious neonatal outcomes, adiposity, diabetes and neurosensory disability. The quality of the body of evidence was downgraded in the summary of findings Table for the main comparison and summary of findings Table 2 to low or very low. Two trials were open‐label trials with no blinding of participants or clinicians (D'Anna 2013; D'Anna 2015). However, one trial did explicitly state that outcome assessors were blinded to treatment allocation (D'Anna 2015); the other trial lacked sufficient detail to determine allocation concealment (D'Anna 2013). One trial (reported as a conference abstract) had no details of random sequence generation, allocation concealment or blinding and was thus downgraded (Facchinetti 2013).
Potential biases in the review process
Multiple databases were searched by the Trials Search Co‐ordinator of the Cochrane Pregnancy and Childbirth Group, without language or date restrictions in an attempt to limit bias by identifying all relevant trials. Where necessary, contact was made with authors to seek clarification or further information. As per the Cochrane Handbook for Systematic Reviews of Interventions (Higgins 2011), two review authors appraised studies for inclusion, and extracted the data in order to minimise bias.
Agreements and disagreements with other studies or reviews
The increasing prevalence of GDM worldwide has led to greater interest in new and novel ways to prevent and treat GDM. The body of evidence for the use of antenatal myo‐inositol supplementation for the prevention of GDM is still relatively small. Other literature (Di Benedetto 2013), and a systematic review (Rogozinska 2015) citing the trials included in this review, draw similar conclusions that myo‐inositol shows significant potential to prevent GDM, with unanimous calls for larger, high‐quality, randomised controlled trials to confirm this. As the body of randomised controlled trial evidence on the use of myo‐inositol for prevention of GDM grows, we await the publication of ongoing trials that can be incorporated into future updates of this review.
'Risk of bias' graph: review authors' judgements about each risk of bias item presented as percentages across all included studies.
'Risk of bias' summary: review authors' judgements about each risk of bias item for each included study.
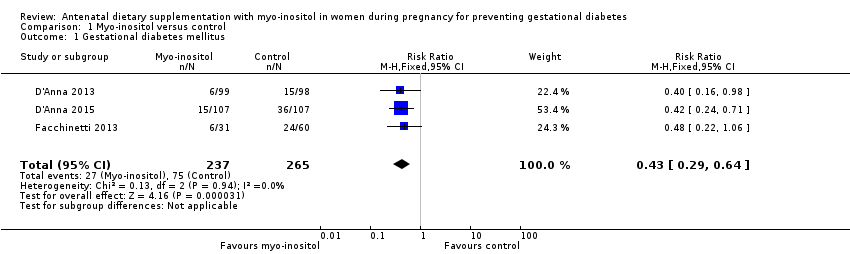
Comparison 1 Myo‐inositol versus control, Outcome 1 Gestational diabetes mellitus.
Comparison 1 Myo‐inositol versus control, Outcome 2 Fasting OGTT.
Comparison 1 Myo‐inositol versus control, Outcome 3 One hour OGTT.

Comparison 1 Myo‐inositol versus control, Outcome 4 Two hour OGTT.

Comparison 1 Myo‐inositol versus control, Outcome 5 Hypertensive disorders of pregnancy.

Comparison 1 Myo‐inositol versus control, Outcome 6 Caesarean section.
Comparison 1 Myo‐inositol versus control, Outcome 7 Weight gain during pregnancy.
Comparison 1 Myo‐inositol versus control, Outcome 8 Relevant biomarker changes associated with the intervention.

Comparison 1 Myo‐inositol versus control, Outcome 9 Adverse effects of intervention.
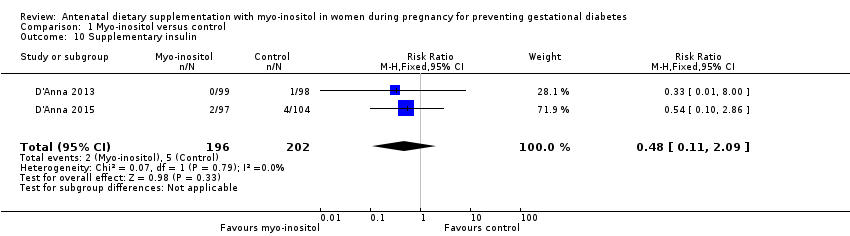
Comparison 1 Myo‐inositol versus control, Outcome 10 Supplementary insulin.
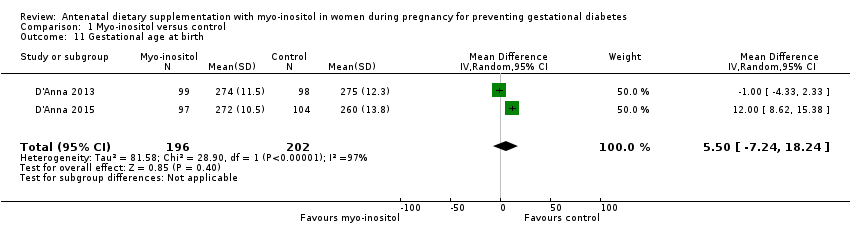
Comparison 1 Myo‐inositol versus control, Outcome 11 Gestational age at birth.
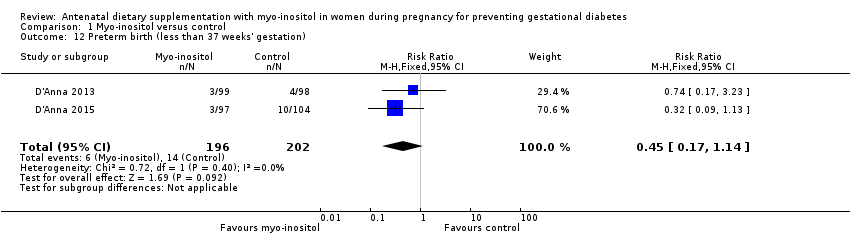
Comparison 1 Myo‐inositol versus control, Outcome 12 Preterm birth (less than 37 weeks' gestation).

Comparison 1 Myo‐inositol versus control, Outcome 13 Macrosomia.

Comparison 1 Myo‐inositol versus control, Outcome 14 Birthweight.

Comparison 1 Myo‐inositol versus control, Outcome 15 Shoulder dystocia.

Comparison 1 Myo‐inositol versus control, Outcome 16 Respiratory distress syndrome.
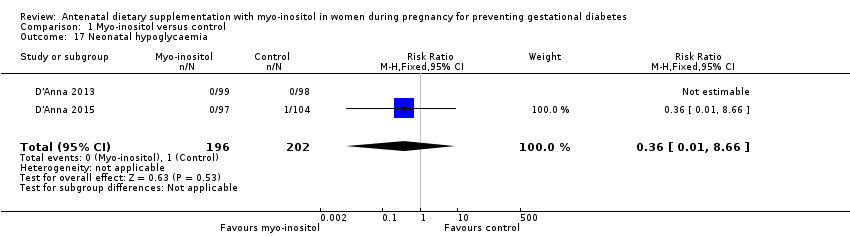
Comparison 1 Myo‐inositol versus control, Outcome 17 Neonatal hypoglycaemia.
| Antenatal supplementation with myo‐inositol for preventing gestational diabetes | ||||||
| Patient or population: pregnant women (women with pre‐existing type 1 or type 2 diabetes are NOT included) Setting: Italy | ||||||
| Outcomes | Anticipated absolute effects* (95% CI) | Relative effect | № of participants | Quality of the evidence | Comments | |
| Risk with control | Risk with Myo‐inositol | |||||
| Gestational diabetes mellitus | Study population | RR 0.43 | 502 | ⊕⊕⊝⊝ | GDM diagnosed using IADPSG 2010 criteria | |
| 28 per 100 | 12 per 100 | |||||
| Weight gain during pregnancy | The mean weight gain during pregnancy was 0 | The mean weight gain during pregnancy in the intervention group was 0.64 more (0.41 fewer to 1.7 more) | ‐ | 411 | ⊕⊝⊝⊝ | D'Anna 2015 included obese pregnant women and D'Anna 2013 included non‐obese women with a family history of type 2 diabetes Random‐effects model |
| Hypertensive disorders of pregnancy | Study population | RR 0.43 | 398 | ⊕⊝⊝⊝ | Random‐effects model | |
| 4 per 100 | 2 per 100 | |||||
| Caesarean section | Study population | RR 0.95 | 398 | ⊕⊕⊝⊝ | ||
| 45 per 100 | 43 per 100 | |||||
| Perineal trauma | Not estimable | (0 studies) | No data reported for perineal trauma in any of the included studies | |||
| Postnatal depression | Not estimable | (0 studies) | No data reported for postnatal depression in any of the included studies | |||
| Type 2 diabetes | Not estimable | (0 studies) | No data reported for type 2 diabetes in any of the included studies | |||
| *The risk in the intervention group (and its 95% confidence interval) is based on the assumed risk in the comparison group and the relative effect of the intervention (and its 95% CI). | ||||||
| GRADE Working Group grades of evidence | ||||||
| 1 Downgraded (‐1) due to unclear risk of bias for allocation concealment in two of the included trials (one trial did not provide sufficient detail to determine allocation concealment and one trial (reported as a conference abstract) had no details of random sequence generation, allocation concealment or blinding) and for high risk of performance bias for lack of blinding (two trials were open‐label trials with no blinding of participants or researchers, however one trial explicitly described blinding of outcome assessors and was assessed as low risk of detection bias). 2 Studies were conducted in Italy with Caucasian women and generalisability of findings is limited, downgraded (‐1). 3 Evidence of imprecision with wide confidence intervals crossing the line of no effect, downgraded (‐1). 4 Heterogeneity high with I2 = 54% (indirectness) probably due to different study populations, downgraded (‐1). 5 Wide confidence intervals with very low event rates and a small sample size suggest evidence of imprecision, downgraded (‐1). 6 Downgraded (‐1) due to insufficient evidence to judge allocation concealment in one trial and subsequent judgement of unclear risk of bias. The other trial had a low risk of bias for allocation concealment. Both trials were open‐label with no blinding of participants or researchers, although one trial explicitly stated that outcome assessors were blinded to treatment allocation. | ||||||
| Antenatal supplementation with myo‐inositol for preventing gestational diabetes | ||||||
| Patient or population: pregnant women who were at risk of GDM Setting: Italy | ||||||
| Outcomes | Anticipated absolute effects* (95% CI) | Relative effect | № of participants | Quality of the evidence | Comments | |
| Risk with control | Risk with Myo‐inositol | |||||
| Large‐for‐gestational age | not estimable | (0 studies) | No data reported for large‐for‐gestational age in any of the included studies | |||
| Perinatal mortality | not estimable | (0 studies) | No data reported for perinatal mortality in any of the included studies | |||
| Composite of serious neonatal outcomes | not estimable | (0 studies) | No data reported for composite of serious neonatal outcomes in any of the included studies | |||
| Neonatal hypoglycaemia | Study population | RR 0.36 | 398 | ⊕⊝⊝⊝ | ||
| 0 per 100 | 0 per 100 | |||||
| Adiposity | not estimable | (0 studies) | No data reported for adiposity in any of the included studies | |||
| Diabetes | not estimable | (0 studies) | No data reported for diabetes in any of the included studies | |||
| Neurosensory disability | not estimable | (0 studies) | No data reported for neurosensory disability in any of the included studies | |||
| *The risk in the intervention group (and its 95% confidence interval) is based on the assumed risk in the comparison group and the relative effect of the intervention (and its 95% CI). | ||||||
| GRADE Working Group grades of evidence | ||||||
| 1 No blinding in either study and reporting of allocation concealment was unclear in one of the studies, downgraded (‐1). 2 Both studies were conducted in Italy with Caucasian women and may not be generalisable to other settings, downgraded (‐1). 3 Wide confidence intervals with very low event rates suggest evidence of imprecision, downgraded (‐1). | ||||||
| Outcome or subgroup title | No. of studies | No. of participants | Statistical method | Effect size |
| 1 Gestational diabetes mellitus Show forest plot | 3 | 502 | Risk Ratio (M‐H, Fixed, 95% CI) | 0.43 [0.29, 0.64] |
| 2 Fasting OGTT Show forest plot | 3 | 502 | Mean Difference (IV, Fixed, 95% CI) | ‐0.20 [‐0.28, ‐0.12] |
| 3 One hour OGTT Show forest plot | 3 | 502 | Mean Difference (IV, Fixed, 95% CI) | ‐0.68 [1.00, ‐0.37] |
| 4 Two hour OGTT Show forest plot | 3 | 502 | Mean Difference (IV, Random, 95% CI) | ‐0.75 [‐1.07, ‐0.43] |
| 5 Hypertensive disorders of pregnancy Show forest plot | 2 | 398 | Risk Ratio (M‐H, Random, 95% CI) | 0.43 [0.02, 8.41] |
| 6 Caesarean section Show forest plot | 2 | 398 | Risk Ratio (M‐H, Fixed, 95% CI) | 0.95 [0.76, 1.19] |
| 7 Weight gain during pregnancy Show forest plot | 2 | 411 | Mean Difference (IV, Random, 95% CI) | 0.64 [‐0.41, 1.70] |
| 8 Relevant biomarker changes associated with the intervention Show forest plot | 1 | Mean Difference (IV, Fixed, 95% CI) | Subtotals only | |
| 8.1 Total cholesterol | 1 | 48 | Mean Difference (IV, Fixed, 95% CI) | ‐47.29 [‐52.87, ‐41.71] |
| 8.2 Low density lipoprotein | 1 | 48 | Mean Difference (IV, Fixed, 95% CI) | ‐33.50 [‐39.71, ‐27.29] |
| 8.3 High density lipoprotein | 1 | 48 | Mean Difference (IV, Fixed, 95% CI) | ‐13.79 [‐18.91, ‐8.67] |
| 8.4 Triglycerides | 1 | 48 | Mean Difference (IV, Fixed, 95% CI) | ‐39.33 [‐44.00, ‐34.66] |
| 9 Adverse effects of intervention Show forest plot | 2 | 245 | Risk Ratio (M‐H, Fixed, 95% CI) | 0.0 [0.0, 0.0] |
| 10 Supplementary insulin Show forest plot | 2 | 398 | Risk Ratio (M‐H, Fixed, 95% CI) | 0.48 [0.11, 2.09] |
| 11 Gestational age at birth Show forest plot | 2 | 398 | Mean Difference (IV, Random, 95% CI) | 5.50 [‐7.24, 18.24] |
| 12 Preterm birth (less than 37 weeks' gestation) Show forest plot | 2 | 398 | Risk Ratio (M‐H, Fixed, 95% CI) | 0.45 [0.17, 1.14] |
| 13 Macrosomia Show forest plot | 2 | 398 | Risk Ratio (M‐H, Random, 95% CI) | 0.35 [0.02, 6.37] |
| 14 Birthweight Show forest plot | 2 | 398 | Mean Difference (IV, Random, 95% CI) | ‐60.47 [‐265.21, 144.26] |
| 15 Shoulder dystocia Show forest plot | 2 | 398 | Risk Ratio (M‐H, Random, 95% CI) | 2.33 [0.12, 44.30] |
| 16 Respiratory distress syndrome Show forest plot | 1 | 197 | Risk Ratio (M‐H, Fixed, 95% CI) | 0.99 [0.06, 15.60] |
| 17 Neonatal hypoglycaemia Show forest plot | 2 | 398 | Risk Ratio (M‐H, Fixed, 95% CI) | 0.36 [0.01, 8.66] |