| 1 Quality of life Show forest plot | 2 | | Mean Difference (IV, Fixed, 95% CI) | Subtotals only |
|
| 1.1 SIS: Physical domain | 1 | 22 | Mean Difference (IV, Fixed, 95% CI) | 5.20 [‐12.28, 22.68] |
| 1.2 SIS: Emotion domain | 1 | 22 | Mean Difference (IV, Fixed, 95% CI) | 6.80 [‐8.55, 22.15] |
| 1.3 SIS: Memory domain | 1 | 22 | Mean Difference (IV, Fixed, 95% CI) | 15.30 [1.29, 29.31] |
| 1.4 SIS: Communication domain | 1 | 22 | Mean Difference (IV, Fixed, 95% CI) | 1.40 [‐9.45, 12.25] |
| 1.5 SIS: Social participation domain | 1 | 22 | Mean Difference (IV, Fixed, 95% CI) | 16.10 [‐6.79, 38.99] |
| 1.6 SIS: Stroke recovery domain | 1 | 22 | Mean Difference (IV, Fixed, 95% CI) | 2.0 [‐17.70, 21.70] |
| 1.7 Stroke‐specific QoL scale | 1 | 47 | Mean Difference (IV, Fixed, 95% CI) | 2.80 [‐2.03, 7.63] |
| 2 Balance: Berg Balance Scale Show forest plot | 2 | 69 | Mean Difference (IV, Fixed, 95% CI) | 2.38 [‐1.41, 6.17] |
|
| 3 Balance confidence Show forest plot | 1 | 47 | Mean Difference (IV, Fixed, 95% CI) | 10.60 [‐7.08, 28.28] |
|
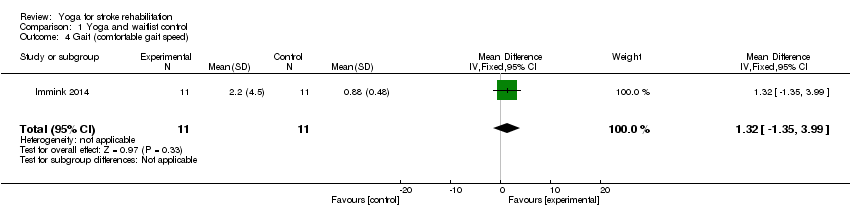
| 4 Gait (comfortable gait speed) Show forest plot | 1 | 22 | Mean Difference (IV, Fixed, 95% CI) | 1.32 [‐1.35, 3.99] |
|
| 5 Motor Assessment (Motor Assessment Scale) Show forest plot | 1 | 22 | Mean Difference (IV, Fixed, 95% CI) | ‐4.0 [‐12.42, 4.42] |
|
| 6 Walk distance (2‐Minute Walk Distance) Show forest plot | 1 | 22 | Mean Difference (IV, Fixed, 95% CI) | ‐13.80 [‐56.02, 28.42] |
|
| 7 Fear of falling Show forest plot | 1 | 47 | Odds Ratio (M‐H, Fixed, 95% CI) | 3.40 [0.63, 18.22] |
|
| 8 Range of movement Show forest plot | 1 | 376 | Mean Difference (IV, Fixed, 95% CI) | 4.26 [1.96, 6.55] |
|
| 8.1 Active cervical rotation, left | 1 | 47 | Mean Difference (IV, Fixed, 95% CI) | 3.97 [‐4.70, 12.64] |
| 8.2 Active cervical rotation, right | 1 | 47 | Mean Difference (IV, Fixed, 95% CI) | 7.40 [‐0.42, 15.22] |
| 8.3 Active cervical lateral flexion, left | 1 | 47 | Mean Difference (IV, Fixed, 95% CI) | 1.5 [‐2.61, 5.61] |
| 8.4 Active cervical lateral flexion, right | 1 | 47 | Mean Difference (IV, Fixed, 95% CI) | 6.64 [1.95, 11.33] |
| 8.5 Hamstrings passive ROM, left | 1 | 47 | Mean Difference (IV, Fixed, 95% CI) | 7.80 [1.33, 14.27] |
| 8.6 Hamstrings passive ROM, right | 1 | 47 | Mean Difference (IV, Fixed, 95% CI) | ‐0.43 [‐6.25, 5.39] |
| 8.7 Hip flexion active ROM, left | 1 | 47 | Mean Difference (IV, Fixed, 95% CI) | 30.11 [‐2.25, 62.47] |
| 8.8 Hip flexion active ROM, right | 1 | 47 | Mean Difference (IV, Fixed, 95% CI) | 32.45 [4.69, 60.21] |
| 9 Strength Show forest plot | 1 | 94 | Mean Difference (IV, Fixed, 95% CI) | ‐1.32 [‐2.75, 0.12] |
|
| 9.1 Upper extremity strength | 1 | 47 | Mean Difference (IV, Fixed, 95% CI) | ‐1.67 [‐4.76, 1.42] |
| 9.2 Lower extremity strength | 1 | 47 | Mean Difference (IV, Fixed, 95% CI) | ‐1.22 [‐2.84, 0.40] |
| 10 Endurance Show forest plot | 1 | 94 | Mean Difference (IV, Fixed, 95% CI) | ‐7.89 [‐20.18, 4.41] |
|
| 10.1 6‐minute walk | 1 | 47 | Mean Difference (IV, Fixed, 95% CI) | ‐31.80 [‐263.55, 199.95] |
| 10.2 2‐minute step test | 1 | 47 | Mean Difference (IV, Fixed, 95% CI) | ‐7.82 [‐20.13, 4.49] |
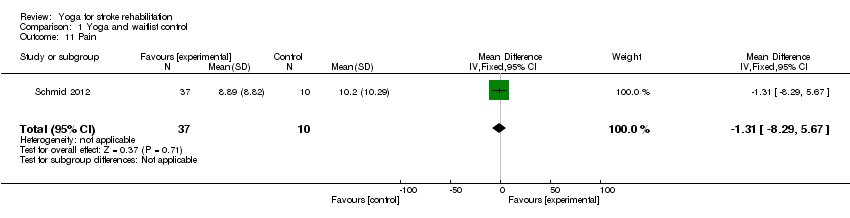
| 11 Pain Show forest plot | 1 | 47 | Mean Difference (IV, Fixed, 95% CI) | ‐1.31 [‐8.29, 5.67] |
|
| 12 Disability Show forest plot | 1 | 47 | Odds Ratio (M‐H, Fixed, 95% CI) | 2.08 [0.50, 8.60] |
|
| 13 Depression: Geriatric Depression Scale (GDS15) Show forest plot | 1 | 22 | Mean Difference (IV, Fixed, 95% CI) | ‐2.10 [‐4.70, 0.50] |
|
| 14 State Trait Anxiety (STAI‐Y1) Show forest plot | 1 | 22 | Mean Difference (IV, Fixed, 95% CI) | ‐8.40 [‐16.74, ‐0.06] |
|
| 15 Trait Anxiety Inventory (STAI‐Y2) Show forest plot | 1 | 22 | Mean Difference (IV, Fixed, 95% CI) | ‐6.70 [‐15.35, 1.95] |
|