Персонализированные цифровые вмешательства по сокращению опасного и вредного потребления алкоголя среди населения
Información
- DOI:
- https://doi.org/10.1002/14651858.CD011479.pub2Copiar DOI

- Base de datos:
-
- Cochrane Database of Systematic Reviews
- Versión publicada:
-
- 25 septiembre 2017see what's new
- Tipo:
-
- Intervention
- Etapa:
-
- Review
- Grupo Editorial Cochrane:
-
Grupo Cochrane de Alcohol y drogas
- Copyright:
-
- Copyright © 2017 The Cochrane Collaboration. Published by John Wiley & Sons, Ltd.
Cifras del artículo
Altmetric:
Citado por:
Autores
Contributions of authors
The protocol was drafted by FB, EK and SM. All authors commented on and approved the final version of the protocol.
FB and JR designed and piloted the outcome data extraction form.
FB, AOD, MH, EK, GM, JN, JR, FdV carried out outcome data extraction.
CM carried out the outcomes meta analyses and wrote up the outcomes analysis.
DC carried out data extraction for and wrote up the BCT analysis.
CG carried out data extraction for and wrote up the theory analysis.
HB wrote the summary of economic studies section.
JB, DC and CG drafted the BCT and theory analysis plans.
EK and FB wrote up the first draft of the Background, Discussion and Authors' conclusions sections; other authors added to them.
CM, DC, CG and FB wrote up the Methods section.
All authors commented on and agreed the final version of the review.
Sources of support
Internal sources
-
Newcastle University, UK.
This is the host institution for some of the authors.
-
Bristol University, UK.
This is the host institution for some of the authors.
-
University College London, UK.
This is the host institution for some of the authors.
External sources
-
NHS National Institute of Health Research, School for Public Health Research, UK.
NIHR SPHR funded salaries and consumables for this systematic review.
Declarations of interest
Eileen Kaner, Fiona Beyer and Colin Muirhead are authors on a related Cochrane Review (Kaner 2007).
Eileen Kaner is an investigator on the ongoing SIPS Junior trial (NIHR programme grant number NIHR RP‐PG‐0609‐10162), which will have an app component in one arm of the trial.
Jamie Brown, David Crane, Claire Garnett and Susan Michie are currently working on the development and evaluation of an app to reduce excessive alcohol consumption (ISRCTN40104069).
Matthew Hickman, Frank de Vocht, and James Redmore, Amy O'Donnell, James Newham, Heather Brown and Gregory Maniatopoulos have no interests to declare.
Acknowledgements
We thank Professor Robert West for helpful advice during the drafting of the protocol.
We are grateful to Janice Armstrong and Brenda Nyakang'o for administrative support on this review.
Version history
| Published | Title | Stage | Authors | Version |
| 2017 Sep 25 | Personalised digital interventions for reducing hazardous and harmful alcohol consumption in community‐dwelling populations | Review | Eileen FS Kaner, Fiona R Beyer, Claire Garnett, David Crane, Jamie Brown, Colin Muirhead, James Redmore, Amy O'Donnell, James J Newham, Frank de Vocht, Matthew Hickman, Heather Brown, Gregory Maniatopoulos, Susan Michie | |
| 2015 Jan 16 | Personalised digital interventions for reducing hazardous and harmful alcohol consumption in community‐dwelling populations | Protocol | Eileen F.S. Kaner, Fiona R Beyer, Jamie Brown, David Crane, Claire Garnett, Matthew Hickman, Colin Muirhead, James Redmore, Susan Michie, Frank de Vocht | |
Differences between protocol and review
Authorship
The following changes have been made to the authorship of the review:
-
Professor Michie has been made last author ‐ this was agreed before the protocol was published but erroneously left as it was.
-
Dr Amy O'Donnell, Dr Gregory Maniatopous and Dr James Newham helped with the data extraction and interpretation.
-
Dr Heather Brown is a health economist and wrote the section dealing with cost‐effectiveness.
Secondary objectives
One of the secondary objectives described in the protocol was "to develop a taxonomy of interventions according to their mode of delivery (e.g. functionality features) and assess their impact on outcomes". Early on in the conduct of the review we decided that to develop a taxonomy was beyond the scope of an effectiveness review, and this secondary objective was changed to read "to specify interventions according to their mode of delivery (e.g. functionality features) and assess the impact of mode of delivery on outcomes". In the event there were insufficient studies describing different modes of delivery to allow us to address this objective.
Participants: exclusion criteria
When we assessed the results of the search for eligibility we discovered a group of trials in which participants were mandated to complete the intervention, and where an individual's progression (e.g. at university) depended on the intervention being deemed to have been successful in reducing their alcohol consumption. We decided to exclude these trials because the results of the intervention itself were likely to be extremely confounded by the compulsory nature of the intervention and the extra pressure for it to work.
Subgroup analysis by time: immediate versus delayed outcomes
We planned a subgroup analysis according to immediate versus delayed outcomes at the protocol stage, but it became clear that the follow‐up times of the included studies did not fall into obvious immediate and delayed times. Rather than define an arbitrary (and potentially meaningless, controversial or both) dichotomy, we carried out the subgroup analysis according to the follow‐up times reported in the studies.
Sensitivity analysis imputing standard deviations and number of participants
We carried out a sensitivity analysis imputing missing standard deviations and participant numbers because we wanted to understand how much of an impact the missing data had on the overall effect estimate.
Sensitivity analysis accounting for performance bias
We carried out a sensitivity analysis, omitting studies at high risk of performance bias, to assess whether the effect of self‐reporting in unblinded studies might account for the reduction in consumption reported in the primary meta‐analysis.
Meta‐regression analyses
We carried out a meta‐regression analysis looking at the longest period of follow‐up to investigate any potential decay in effect of the intervention over time, which may be analogous to the decay noted from face‐to‐face brief interventions (Kaner 2007). We also carried out a meta‐regression analysis on year of publication; again an effect had been noticed in other alcohol interventions and we decided to investigate.
Keywords
MeSH
Medical Subject Headings (MeSH) Keywords
- *Cell Phone;
- *Computers, Handheld;
- *Minicomputers;
- Alcohol Drinking [epidemiology, therapy];
- Alcohol‐Related Disorders [epidemiology, *therapy];
- Behavior Therapy [*methods];
- Binge Drinking [epidemiology, therapy];
- Cost‐Benefit Analysis;
- Motivational Interviewing;
- Randomized Controlled Trials as Topic;
- Therapy, Computer‐Assisted [*methods];
Medical Subject Headings Check Words
Humans;
PICO
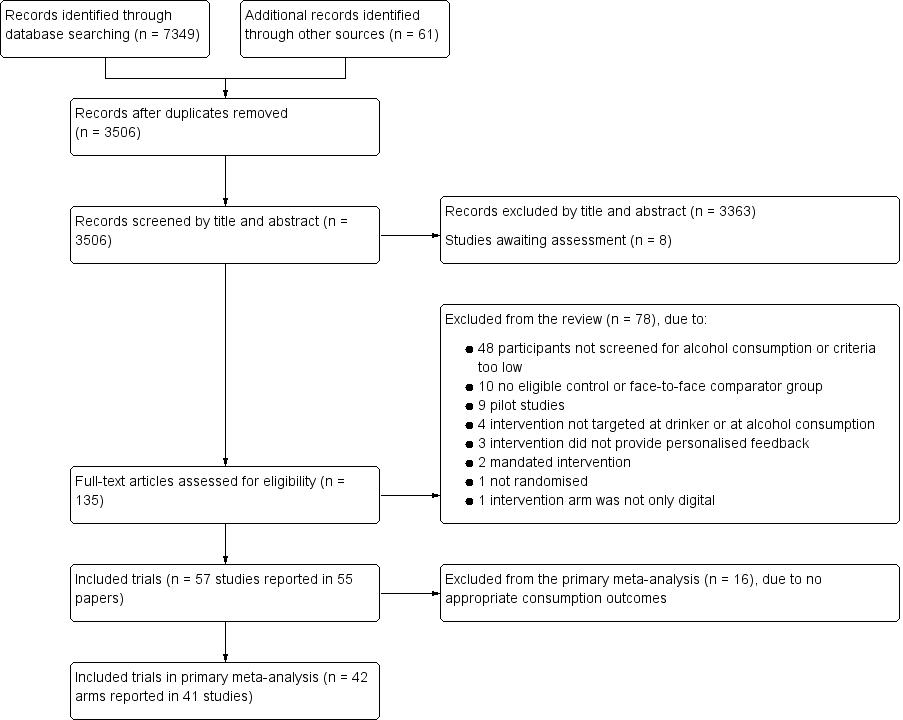
Study flow diagram

Risk of bias summary: review authors' judgements about each risk of bias item for each included study

Funnel plot of comparison 1: Digital intervention vs. control, outcome 1.1: Quantity of drinking (g/week), based on longest follow‐up

Funnel plot of comparison 1: Digital intervention vs. control, outcome 1.6: Quantity of drinking (g/week), based on longest follow‐up and categorised on whether restricted to adolescents or young adults

Comparison 1 Digital intervention versus no or minimal intervention, Outcome 1 Quantity of drinking (g/week), based on longest follow‐up.

Comparison 1 Digital intervention versus no or minimal intervention, Outcome 2 Quantity of drinking (g/week), categorised by length of follow‐up.

Comparison 1 Digital intervention versus no or minimal intervention, Outcome 3 Quantity of drinking (g/week), based on longest follow‐up and categorised on whether restricted to adolescents or young adults.
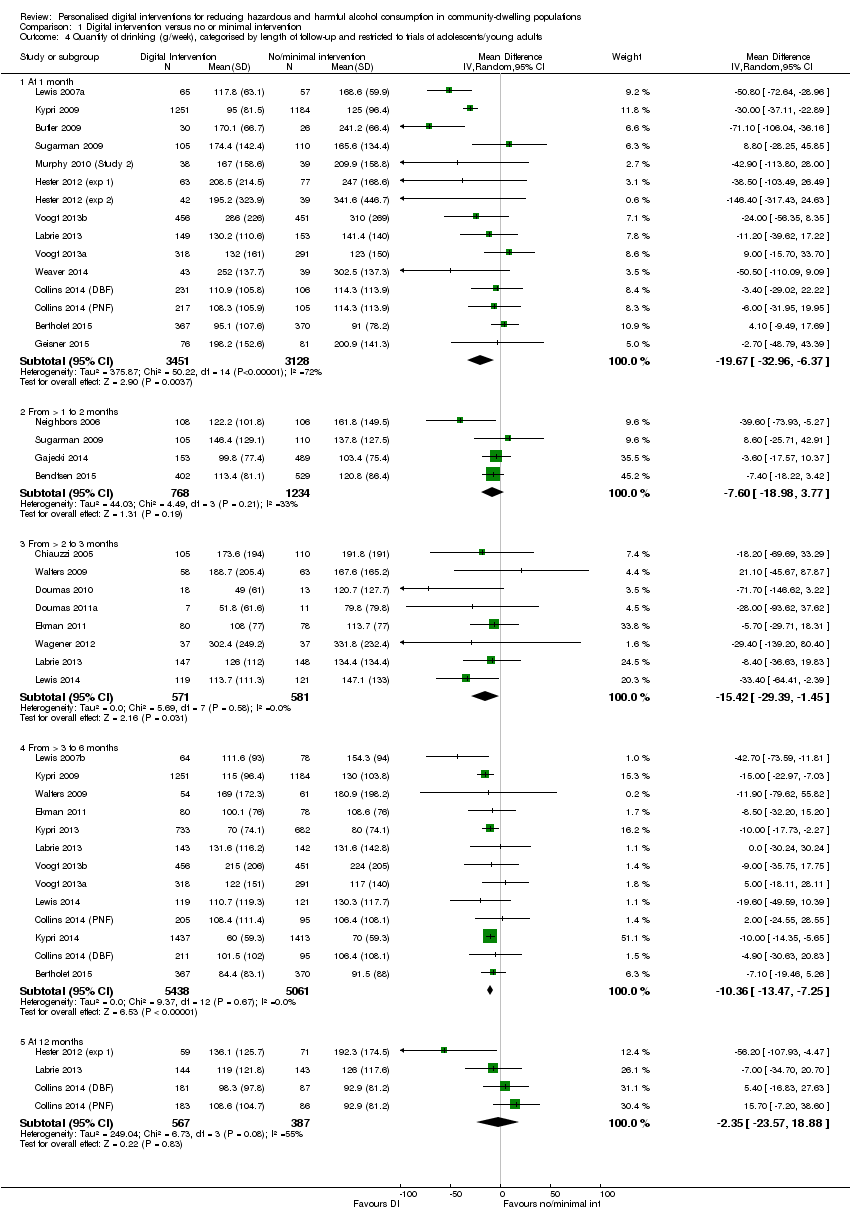
Comparison 1 Digital intervention versus no or minimal intervention, Outcome 4 Quantity of drinking (g/week), categorised by length of follow‐up and restricted to trials of adolescents/young adults.
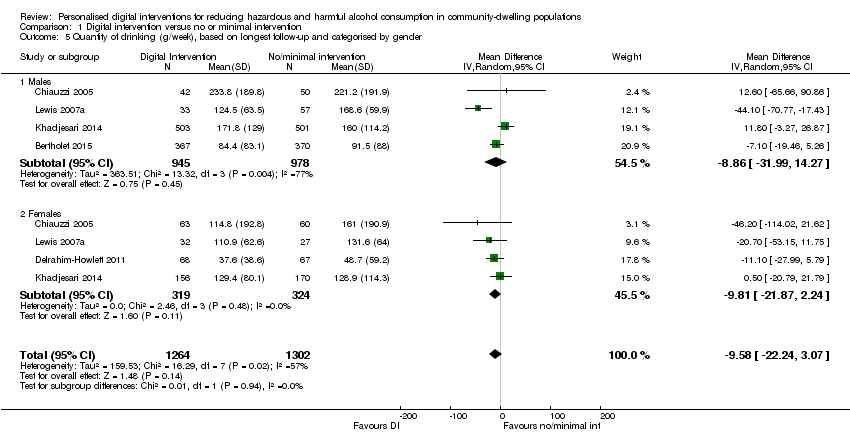
Comparison 1 Digital intervention versus no or minimal intervention, Outcome 5 Quantity of drinking (g/week), based on longest follow‐up and categorised by gender.

Comparison 1 Digital intervention versus no or minimal intervention, Outcome 6 Quantity of drinking (g/week), based on longest follow‐up and omitting trials at high risk of bias owing to incomplete data.
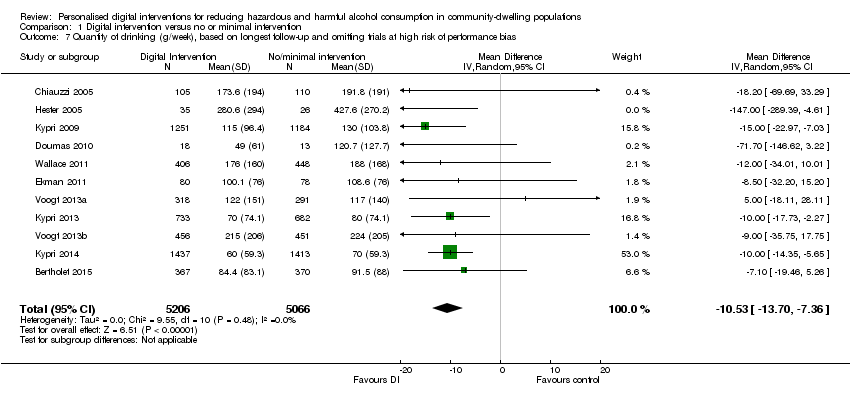
Comparison 1 Digital intervention versus no or minimal intervention, Outcome 7 Quantity of drinking (g/week), based on longest follow‐up and omitting trials at high risk of performance bias.

Comparison 1 Digital intervention versus no or minimal intervention, Outcome 8 Quantity of drinking (g/week), based on longest follow‐up, with imputation of missing standard deviations or number of participants per arm.

Comparison 1 Digital intervention versus no or minimal intervention, Outcome 9 Quantity of drinking (g/week), categorised by length of follow‐up, with imputation of missing standard deviations or number of participants per arm.

Comparison 1 Digital intervention versus no or minimal intervention, Outcome 10 Frequency of drinking (no. of days drinking/week), based on longest follow‐up.

Comparison 1 Digital intervention versus no or minimal intervention, Outcome 11 Frequency of binge drinking (no. of binges/week), based on longest follow‐up.

Comparison 1 Digital intervention versus no or minimal intervention, Outcome 12 Intensity of drinking (g/drinking day), based on longest follow‐up.
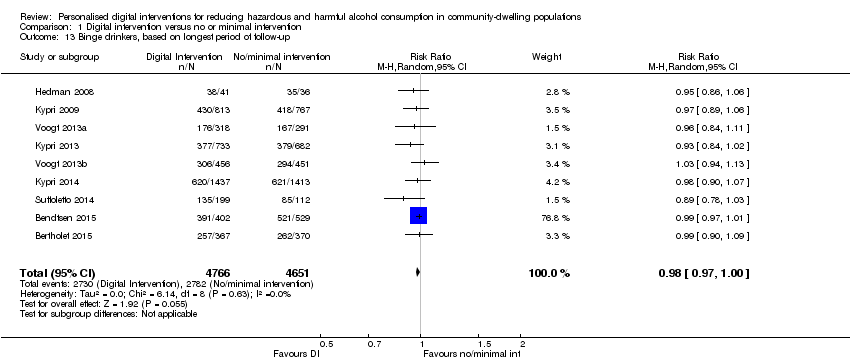
Comparison 1 Digital intervention versus no or minimal intervention, Outcome 13 Binge drinkers, based on longest period of follow‐up.

Comparison 2 Digital intervention versus face‐to‐face intervention, Outcome 1 Quantity of drinking (g/week), based on longest follow‐up.

Comparison 2 Digital intervention versus face‐to‐face intervention, Outcome 2 Quantity of drinking (g/week), categorised by length of follow‐up.
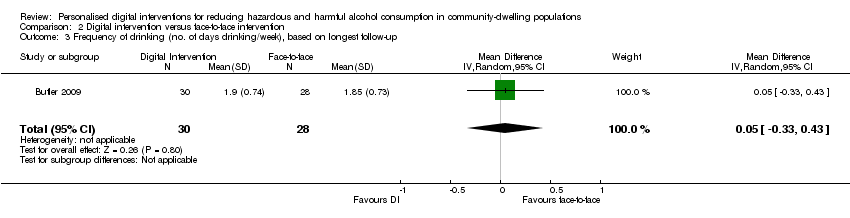
Comparison 2 Digital intervention versus face‐to‐face intervention, Outcome 3 Frequency of drinking (no. of days drinking/week), based on longest follow‐up.

Comparison 2 Digital intervention versus face‐to‐face intervention, Outcome 4 Frequency of binge drinking (no. of binges/week), based on longest follow‐up.
| Digital intervention compared to no or minimal intervention for reducing hazardous and harmful alcohol consumption in community‐dwelling populations | ||||||
| Patient or population: People living in the community | ||||||
| Outcomes | Anticipated absolute effects* (95% CI) | Relative effect | № of participants | Quality of the evidence | Comments | |
| Risk with no or minimal intervention | Risk with digital intervention | |||||
| Quantity of drinking (g/week), based on longest follow‐up (quantity) | The mean quantity of drinking (g/week), based on longest follow‐up was 176 g/week | MD 23 g/week lower | ‐ | 19,241 | ⊕⊕⊕⊝ | Heterogeneity was substantial (78%) but not unexplained; interventions differed in content and delivery. The direction of effect favoured the intervention in 88% of the studies. |
| Frequency of drinking (number of days drinking/week), based on longest follow‐up (frequency) | The mean frequency of drinking (number of days drinking/week), based on longest follow‐up was 2.5 drinking days/week | MD 0.16 drinking days/week lower | ‐ | 10,862 | ⊕⊕⊕⊝ | |
| Frequency of binge drinking (number of binges/week), based on longest follow‐up | The mean frequency of binge drinking (number of binges/week), based on longest follow‐up was 1.2 binges/week | MD 0.24 binges/week lower | ‐ | 3587 | ⊕⊕⊕⊝ | Heterogeneity was moderate (53%) but not unexplained; interventions differed in content and delivery. The direction of effect favoured the intervention in 93% of the studies. |
| Intensity of drinking (g/drinking day), based on longest follow‐up (intensity) | The mean intensity of drinking (g/drinking day), based on longest follow‐up was 56 g/drinking day | MD 5 g/drinking day lower | ‐ | 9791 | ⊕⊕⊕⊝ | Heterogeneity was substantial (78%) but not unexplained; interventions differed in content and delivery. The direction of effect favoured the intervention in 73% of the studies. |
| Adverse events | Not reported | Not reported | ‐ | ‐ | ‐ | No studies assessed this outcome. |
| *The risk in the intervention group (and its 95% confidence interval) is based on the assumed risk in the comparison group and the relative effect of the intervention (and its 95% CI). | ||||||
| GRADE Working Group grades of evidence | ||||||
| 1 Downgraded due to high risk of attrition or performance bias or both in many studies. A sensitivity analysis based on the primary meta‐analysis, which omitted studies at high risk of performance bias and contained 11 studies, suggested that the intervention led to a reduction of at least 11 g alcohol (7 to 14 g) or 1.5 UK units (Analysis 1.7). | ||||||
| Digital intervention compared to face‐to‐face intervention for reducing hazardous and harmful alcohol consumption in community‐dwelling populations | ||||||
| Patient or population: People living in the community | ||||||
| Outcomes | Anticipated absolute effects* (95% CI) | Relative effect | № of participants | Quality of the evidence | Comments | |
| Risk with face‐to‐face intervention | Risk with digital intervention | |||||
| Quantity of drinking (g/week), based on longest follow‐up (quantity) follow up: range 1 month to 12 months | The mean quantity of drinking (g/week), based on longest follow‐up was 180 g/week | MD 0.52 g/week higher | ‐ | 390 | ⊕⊕⊝⊝ | |
| Frequency of drinking (number of days drinking/week), based on longest follow‐up (frequency) follow up: range 1 months to 12 months | The mean frequency of drinking (no. of days drinking/week), based on longest follow‐up was 1.85 drinking days/week | MD 0.05 drinking days/week higher | ‐ | 58 | ⊕⊕⊝⊝ | |
| Frequency of binge drinking (number of binges/week), based on longest follow‐up | The mean frequency of binge drinking (no. of binges/week), based on longest follow‐up was 0.7 binges/week | MD 0.04 binges/week higher | ‐ | 206 | ⊕⊕⊝⊝ | |
| Intensity of drinking (g/drinking day) | Not reported | Not reported | ‐ | ‐ | ‐ | No studies assessed this outcome. |
| Adverse events | Not reported | Not reported | ‐ | ‐ | ‐ | No studies assessed this outcome. |
| *The risk in the intervention group (and its 95% confidence interval) is based on the assumed risk in the comparison group and the relative effect of the intervention (and its 95% CI). | ||||||
| GRADE Working Group grades of evidence | ||||||
| 1 Downgraded one level due to serious risk of bias (high risk of attrition or performance bias or both). 2 Downgraded one level due to serious imprecision (fewer than 400 participants). | ||||||
| Behaviour change technique | % age (N) |
| 2.2. Feedback on behaviour | 85.7% (36) |
| 6.2. Social comparison | 81.0% (34) |
| 5.3. Information about social and environmental consequences | 71.4% (30) |
| 2.7. Feedback on outcome(s) of behaviour | 69.0% (29) |
| 3.1. Social support (unspecified) | 64.3% (27) |
| 4.1. Instruction on how to perform the behaviour | 52.4% (22) |
| 2.6. Biofeedback | 50.0% (21) |
| 5.2. Salience of consequences | 50.0% (21) |
| 9.2. Pros and cons | 35.7% (15) |
| 1.2. Problem solving | 33.3% (14) |
| 5.1. Information about health consequences | 33.3% (14) |
| 1.4. Action planning | 31.0% (13) |
| 9.1. Credible source | 31.0% (13) |
| 1.1. Goal setting (behaviour) | 28.6% (12) |
| 2.3. Self‐monitoring of behaviour | 26.2% (11) |
| 3.2. Social support (practical) | 16.7% (7) |
| 2.4. Self‐monitoring of outcome(s) of behaviour | 14.3% (6) |
| 4.2. Information about antecedents | 14.3% (6) |
| 1.3. Goal setting (outcome) | 11.9% (5) |
| 1.6. Discrepancy between current behaviour and goal | 11.9% (5) |
| 8.2. Behaviour substitution | 9.5% (4) |
| 12.2. Restructuring the social environment | 9.5% (4) |
| 15.4. Self‐talk | 9.5% (4) |
| 5.6. Information about emotional consequences | 7.1% (3) |
| 7.1. Prompts/cues | 7.1% (3) |
| 11.2. Reduce negative emotions | 7.1% (3) |
| 12.3. Avoidance/reducing exposure to cues for the behaviour | 7.1% (3) |
| 1.5. Review behaviour goal(s) | 4.8% (2) |
| 5.4. Monitoring of emotional consequences | 4.8% (2) |
| 10.3. Non‐specific reward | 4.8% (2) |
| 10.9. Self‐reward | 4.8% (2) |
| 1.7. Review outcome goal(s) | 2.4% (1) |
| 1.8. Behavioural contract | 2.4% (1) |
| 3.3. Social support (emotional) | 2.4% (1) |
| 4.4. Behavioural experiments | 2.4% (1) |
| 8.1. Behavioural practice/rehearsal | 2.4% (1) |
| 8.7. Graded tasks | 2.4% (1) |
| 10.4. Social reward | 2.4% (1) |
| 10.6. Non‐specific incentive | 2.4% (1) |
| 13.2. Framing/reframing | 2.4% (1) |
| 14.2. Punishment | 2.4% (1) |
| 15.1. Verbal persuasion about capability | 2.4% (1) |
| 15.3. Focus on past success | 2.4% (1) |
| The following behaviour change techniques were not used in any digital intervention: 1.9. Commitment, 2.1. Monitoring of behaviour by others without feedback, 2.5. Monitoring of outcome(s) of behaviour without feedback, 4.3. Re‐attribution, 5.5. Anticipated regret, 6.1. Demonstration of the behaviour, 6.3. Information about others’ approval, 7.2. Cue signalling reward, 7.3. Reduce prompts/cues, 7.4. Remove access to the reward, 7.5. Remove aversive stimulus, 7.6. Satiation, 7.7. Exposure, 7.8. Associative learning, 8.3. Habit formation, 8.5. Overcorrection, 8.6. Generalisation of target behaviour, 9.3. Comparative imagining of future outcomes, 10.1. Material incentive (behaviour), 10.2. Material reward (behaviour), 10.5. Social incentive, 10.7. Self‐incentive, 10.8. Incentive (outcome), 10.10. Reward (outcome), 10.11. Future punishment, 11.1. Pharmacological support, 11.3. Conserving mental resources, 11.4. Paradoxical instructions, 12.1. Restructuring the physical environment, 12.4. Distraction, 12.5. Adding objects to the environment, 12.6. Body changes, 13.1. Identification of self as role model, 13.3. Incompatible beliefs, 13.4. Valued self‐identify, 13.5. Identity associated with changed behaviour, 14.1. Behaviour cost, 14.3. Remove reward, 14.4. Reward approximation, 14.5. Rewarding completion, 14.6. Situation‐specific reward, 14.7. Reward incompatible behaviour, 14.8. Reward alternative behaviour, 14.9. Reduce reward frequency, 14.10. Remove punishment, 15.2. Mental rehearsal of successful performance, 16.1. Imaginary punishment, 16.2. Imaginary reward, 16.3. Vicarious consequences. | |
| Behaviour change technique | B (SE) | P | 95% CI | I² | Adj R² | |
| 1.1 | Goal setting (behaviour) | ‐43.94 (17.14) | 0.01 | ‐78.59 to ‐9.30 | 78.05% | 6.64% |
| 1.2 | Problem solving | ‐48.03 (14.72) | < 0.01 | ‐77.79 to ‐18.27 | 74.64% | 25.01% |
| 1.3 | Goal setting (outcome) | ‐14.43 (23.46) | 0.54 | ‐61.85 to 32.99 | 77.71% | ‐2.95% |
| 1.4 | Action planning | ‐26.21 (16.58) | 0.12 | ‐59.73 to 7.30 | 77.57% | 5.45% |
| 1.6 | Discrepancy between current behaviour and goal | ‐33.88 (24.97) | 0.18 | ‐84.35 to 16.58 | 78.24% | 0.15% |
| 2.2 | Feedback on behaviour | 12.97 (21.30) | 0.55 | ‐30.08 to 56.02 | 78.31% | ‐7.13% |
| 2.3 | Self‐monitoring of behaviour | ‐30.39 (17.14) | 0.08 | ‐65.03 to 4.26 | 78.36% | 2.07% |
| 2.4 | Self‐monitoring of outcome(s) of behaviour | ‐8.60 (22.37) | 0.70 | ‐53.81 to 36.61 | 78.52% | ‐4.67% |
| 2.6 | Biofeedback | 10.81 (15.24) | 0.48 | ‐19.99 to 41.62 | 77.85% | 1.55% |
| 2.7 | Feedback on outcome(s) of behaviour | ‐4.62 (16.45) | 0.78 | ‐37.87 to 28.63 | 78.48% | ‐5.63% |
| 3.1 | Social support (unspecified) | ‐19.55 (15.39) | 0.21 | ‐50.65 to 11.55 | 78.53% | ‐0.41% |
| 3.2 | Social support (practical) | ‐26.35 (22.59) | 0.25 | ‐72.01 to 19.31 | 77.18% | 0.29% |
| 4.1 | Instruction on how to perform the behaviour | 4.46 (15.51) | 0.78 | ‐26.89 to 35.80 | 78.55% | ‐5.77% |
| 4.2 | Information about antecedents | ‐74.20 (21.53) | <0.01 | ‐117.72 to ‐30.68 | 74.91% | 32.15% |
| 5.1 | Information about health consequences | 16.75 (15.70) | 0.29 | ‐14.99 to 48.49 | 78.42% | 0.06% |
| 5.2 | Salience of consequences | 21.99 (14.86) | 0.15 | ‐8.05 to 52.02 | 78.17% | 4.92% |
| 5.3 | Information about social and environmental consequences | 28.88 (16.56) | 0.09 | ‐4.59 to 62.34 | 77.59% | 1.01% |
| 6.2 | Social comparison | 24.25 (18.95) | 0.21 | ‐14.06 to 62.56 | 78.53% | ‐4.98% |
| 8.2 | Behaviour substitution | ‐123.71 (30.14) | < 0.001 | ‐184.63 to ‐62.80 | 72.92% | 48.53% |
| 9.1 | Credible source | ‐39.89 (16.22) | 0.02 | ‐72.66 to ‐7.11 | 75.84% | 15.60% |
| 9.2 | Pros and cons | ‐30.10 (15.77) | 0.06 | ‐61.97 to 1.78 | 77.57% | 10.15% |
| 12.2 | Restructuring the social environment | ‐22.91 (31.52) | 0.47 | ‐86.62 to 40.79 | 78.56% | ‐7.66% |
| 15.4 | Self‐talk | ‐41.53 (26.37) | 0.12 | ‐94.84 to 11.77 | 77.93% | 6.04% |
| Abbreviation: B = regression coefficient Rows in italics denote BCTs demonstrating a significant association with effect size in the unadjusted analysis | ||||||
| Behaviour change technique | B (SE) | P | 95% CI | |
| 1.1 | Goal setting (behaviour) | 0.75 (19.60) | 0.97 | ‐39.40 to 40.89 |
| 1.2 | Problem solving | ‐45.92 (21.99) | 0.05 | ‐90.97 to ‐0.87 |
| 1.4 | Action planning | 30.75 (19.50) | 0.13 | ‐9.19 to 70.68 |
| 1.6 | Discrepancy between current behaviour and goal | ‐29.86 (23.97) | 0.22 | ‐78.97 to 19.25 |
| 2.3 | Self‐monitoring of behaviour | ‐6.34 (18.35) | 0.73 | ‐43.91 to 31.24 |
| 3.2 | Social support (practical) | 33.73 (21.85) | 0.13 | ‐11.03 to 78.49 |
| 4.2 | Information about antecedents | ‐43.38 (23.93) | 0.08 | ‐92.39 to 5.63 |
| 5.2 | Salience of consequences | 13.20 (14.96) | 0.39 | ‐17.55 to 43.95 |
| 5.3 | Information about social and environmental consequences | 24.64 (12.17) | 0.05 | ‐0.30 to 49.57 |
| 8.2 | Behaviour substitution | ‐95.12 (33.09) | 0.01 | ‐162.90 to ‐27.34 |
| 9.1 | Credible source | ‐32.09 (13.94) | 0.03 | ‐60.64 to ‐3.55 |
| 9.2 | Pros and cons | 6.68 (13.68) | 0.63 | ‐21.33 to 34.69 |
| 15.4 | Self‐talk | ‐8.41 (26.69) | 0.76 | ‐63.09 to 46.27 |
| Abbreviation: B = regression coefficient Rows in italics denote BCTs demonstrating a significant association with effect size in the adjusted analysis | ||||
| Theory Coding Scheme item description (item number) | N (%) of studies where item = 1 |
| Theory/model of behaviour mentioned (I1) | 21 (50%) |
| Targeted construct mentioned as predictor of behaviour (I2) | 17 (40%) |
| Intervention based on single theory (I3) | 9 (21%) |
| Theory/predictors used to select recipients for the intervention (I4) | 0 (0%) |
| Theory/predictors used to select/develop intervention techniques (I5) | 16 (38%) |
| Theory/predictors used to tailor intervention techniques to recipients (I6) | 3 (7%) |
| All intervention techniques are explicitly linked to at least one theory‐relevant construct/predictor (I7) | 6 (14%) |
| At least one, but not all, of the intervention techniques are explicitly linked to at least one theory‐relevant construct/predictor (I8) | 11 (26%) |
| Group of techniques are linked to a group of constructs/predictors (I9) | 2 (5%) |
| All theory‐relevant constructs/predictors are explicitly linked to at least one intervention technique (I10) | 7 (17%) |
| At least one, but not all, of the theory‐relevant constructs/predictors are explicitly linked to at least one intervention technique (I11) | 10 (24%) |
| Theory‐relevant constructs are measured: post‐intervention (I12a) | 12 (29%) |
| Theory‐relevant constructs are measured: post‐ and pre‐intervention (I12b) | 10 (24%) |
| Changes in measured theory‐relevant constructs/predictor (I13) | 8 (19%) |
| Mediational analysis of constructs/ predictors: mediator predicts the dependent variable (I14a) | 6 (14%) |
| Mediational analysis of constructs/ predictors: mediator predicts dependent variable, controlling for the independent variable (I14b) | 3 (7%) |
| Mediational analysis of constructs/ predictors: intervention does not predict the dependent variable when controlling the independent variable (I14c) | 4 (10%) |
| Mediational analysis of constructs/ predictors: mediated effect is statistically significant (I14d) | 6 (14%) |
| Results discussed in relation to theory (I15) | 12 (29%) |
| Appropriate support for theory (I16) | 7 (17%) |
| Results used to refine theory: adding/ removing constructs to the theory (I17a) | 0 (0%) |
| Results used to refine theory: specifying that the interrelationships between the theoretical constructs should be changed (I17b) | 0 (0%) |
| Study ID | Theories (n) | Total theory use score | TM | SRT | SCT | SLT | DMT | MIT | SNT | TPB | SIT | SCompT | SImpT | SDT | ICM | HBM | TSI | ET | CBT | PBT |
| 3 | 6 | X | X | X | ||||||||||||||||
| 3 | 6 | X | X | X | ||||||||||||||||
| 1 | 6 | X | ||||||||||||||||||
| 1 | 15 | X | ||||||||||||||||||
| 1 | 7 | X | ||||||||||||||||||
| 1 | 8 | X | ||||||||||||||||||
| 1 | 8 | X | ||||||||||||||||||
| 1 | 1 | X | ||||||||||||||||||
| 3 | 12 | X | X | X | ||||||||||||||||
| 4 | 16 | X | X | X | X | |||||||||||||||
| 3 | 14 | X | X | X | ||||||||||||||||
| 2 | 15 | X | X | |||||||||||||||||
| 1 | 12 | X | ||||||||||||||||||
| 1 | 16 | X | ||||||||||||||||||
| 2 | 4 | X | X | |||||||||||||||||
| 5 | 9 | X | X | X | X | X | ||||||||||||||
| 3 | 6 | X | X | X | ||||||||||||||||
| 3 | 5 | X | X | X | ||||||||||||||||
| 5 | 8 | X | X | X | X | X | ||||||||||||||
| 2 | 7 | X | X | |||||||||||||||||
| 2 | 2 | X | X | |||||||||||||||||
| Number of studies: | 6 | 2 | 2 | 2 | 1 | 7 | 6 | 3 | 2 | 3 | 3 | 1 | 3 | 1 | 2 | 1 | 1 | 1 | ||
| Abbreviations: CBT = cognitive‐behavioural theory; DMT = decision‐making theory; ET = expectancy theory; HBM = health belief model; ICM = I‐change model; MIT = motivational interviewing theory; PBT = problem behaviour theory; SCT = social cognitive theory; SCompT = social comparison theory; SDT = social determination theory; SImpT = social impact theory; SIT = social identity theory; SLT = social learning theory; SNT = social norms theory; SRT = self‐regulation theory; TM = transtheoretical model; TPB = theory of planned behaviour; TSI = theory of social influence | ||||||||||||||||||||
| Theory Coding Scheme Categories (category number) | Items included | Maximum score | Mean (SD) | Number of studies scoring ≥ 1 |
| Reference to underpinning theory (C1) | 1, 2, 3 | 3 | 1.1 (1.23) | 20 |
| Targeting of relevant theoretical constructs (C2) | 2, 5, 6, 7, 8, 9, 10, 11 | 8 | 2.0 (2.43) | 17 |
| Using theory to select recipients or tailor interventions (C3) | 4, 6 | 2 | 0.1 (0.26) | 2 |
| Measurement of constructs (C4) | 12a, 12b | 2 | 0.5 (0.86) | 11 |
| Testing of theory: mediation effects (C5) | 12a, 12b, 13, 14a, 14b, 14c, 14d, 15, 16 | 9 | 1.6 (2.83) | 14 |
| Refining theory (C6) | 17a, 17b | 2 | ‐ | ‐ |
| Total use of theory | All items | 22 | 4.4 (5.43) | 20 |
| Theory Coding Scheme covariates (item/category number) | B (SE) | P | 95% CI | Adj. R² | I² | |
| Lower bound | Upper bound | |||||
| Theory/model of behaviour mentioned (I1) | 9.73 (14.63) | 0.510 | ‐19.84 | 39.31 | ‐4.90% | 78.09% |
| Targeted construct mentioned as predictor of behaviour (I2) | 24.17 (14.09) | 0.094 | ‐4.30 | 52.64 | 2.27% | 78.13% |
| Intervention based on single theory (I3) | 12.92 (17.60) | 0.467 | ‐22.64 | 48.49 | ‐4.44% | 78.08% |
| Theory/predictors used to select recipients | Not present in > 10% of studies | |||||
| Theory/predictors used to select/develop | 18.25 (14.57) | 0.218 | ‐11.20 | 47.69 | ‐3.43% | 78.15% |
| Theory/predictors used to tailor intervention techniques | Not present in > 10% of studies | |||||
| All intervention techniques are explicitly linked to at least | ‐3.73 (19.91) | 0.852 | ‐43.98 | 36.51 | ‐4.86% | 76.50% |
| At least one, but not all, of the intervention techniques are | 26.39 (15.34) | 0.093 | ‐4.60 | 57.39 | 10.54% | 77.49% |
| Group of techniques are linked to a group of | Not present in > 10% of studies | |||||
| All theory‐relevant constructs/predictors are explicitly | 8.53 (19.81) | 0.673 | ‐31.60 | 48.46 | ‐5.82% | 78.14% |
| At least one, but not all, of the theory‐relevant | 18.79 (15.99) | 0.247 | ‐13.54 | 51.11 | ‐3.45% | 78.15% |
| Theory‐relevant constructs are measured: | ‐14.67 (15.81) | 0.359 | ‐46.62 | 17.28 | 1.42% | 76.37% |
| Theory‐relevant constructs are measured: | ‐13.78 (16.88) | 0.419 | ‐47.90 | 20.33 | ‐1.67% | 76.94% |
| Changes in measured theory‐relevant | ‐33.04 (17.48) | 0.066 | ‐68.37 | 2.28 | 16.92% | 74.82% |
| Mediational analysis of constructs/ predictors: | ‐7.77 (20.24) | 0.703 | ‐48.68 | 33.15 | ‐3.13% | 76.43% |
| Mediational analysis of constructs/ predictors: | Not present in > 10% of studies | |||||
| Mediational analysis of constructs/ predictors: | ‐21.88 (24.11) | 0.370 | ‐70.61 | 26.86 | 4.48% | 75.41% |
| Mediational analysis of constructs/ predictors: | ‐7.77 (20.24) | 0.703 | ‐48.68 | 33.14 | ‐3.13% | 76.43% |
| Results discussed in relation to theory (I15) | 1.59 (16.08) | 0.922 | ‐30.91 | 34.08 | ‐6.81% | 77.35% |
| Appropriate support for theory (I16) | ‐8.73 (19.43) | 0.656 | ‐48.01 | 30.55 | ‐2.11% | 76.33% |
| Results used to refine theory: | Not present in > 10% of studies | |||||
| Results used to refine theory: | Not present in > 10% of studies | |||||
| Reference to underpinning theory (C1) | 7.19 (5.89) | 0.230 | ‐4.72 | 19.10 | ‐1.55% | 78.08% |
| Targeting of relevant theoretical constructs (C2) | 3.94 (2.97) | 0.192 | ‐2.06 | 9.93 | ‐4.08% | 78.12% |
| Using theory to select recipients or tailor interventions (C3) | 13.30 (27.27) | 0.628 | ‐41.81 | 68.42 | ‐7.21% | 77.67% |
| Measurement of constructs (C4) | ‐7.58 (8.41) | 0.373 | ‐24.58 | 9.42 | 0.19% | 76.61% |
| Testing of theory: mediation effects (C5) | ‐2.09 (2.53) | 0.413 | ‐7.20 | 3.02 | 2.29% | 75.71% |
| Refining theory (C6) | No score > 0 for any studies | |||||
| Total use of theory | 0.39 (1.37) | 0.778 | ‐2.38 | 3.15 | ‐7.46% | 77.58% |
| Theory Coding Scheme covariates (item number) | B (SE) | P | 95% CI | |
| Lower bound | Upper bound | |||
| Targeted construct mentioned as predictor of behaviour (I2) | 50.82 (21.00) | 0.020 | 8.31 | 93.34 |
| At least one, but not all, of the intervention techniques are | ‐12.19 (20.71) | 0.560 | ‐54.12 | 29.74 |
| Changes in measured theory‐relevant constructs/predictor (I13) | ‐61.41 (19.42) | 0.003 | ‐100.71 | ‐22.10 |
| Outcome or subgroup title | No. of studies | No. of participants | Statistical method | Effect size |
| 1 Quantity of drinking (g/week), based on longest follow‐up Show forest plot | 42 | 19241 | Mean Difference (IV, Random, 95% CI) | ‐22.84 [‐30.31, ‐15.36] |
| 2 Quantity of drinking (g/week), categorised by length of follow‐up Show forest plot | 42 | Mean Difference (IV, Random, 95% CI) | Subtotals only | |
| 2.1 At 1 month | 17 | 7187 | Mean Difference (IV, Random, 95% CI) | ‐20.30 [‐32.60, ‐8.01] |
| 2.2 From > 1 to 2 months | 6 | 2846 | Mean Difference (IV, Random, 95% CI) | ‐23.02 [‐44.95, ‐1.09] |
| 2.3 From > 2 to 3 months | 13 | 3000 | Mean Difference (IV, Random, 95% CI) | ‐43.30 [‐73.19, ‐13.41] |
| 2.4 From > 3 to 6 months | 19 | 12822 | Mean Difference (IV, Random, 95% CI) | ‐11.52 [‐16.31, ‐6.73] |
| 2.5 At 12 months | 7 | 3372 | Mean Difference (IV, Random, 95% CI) | ‐13.40 [‐31.28, 4.49] |
| 3 Quantity of drinking (g/week), based on longest follow‐up and categorised on whether restricted to adolescents or young adults Show forest plot | 42 | 19241 | Mean Difference (IV, Random, 95% CI) | ‐22.84 [‐30.31, ‐15.36] |
| 3.1 Trials of adolescents/young adults | 28 | 13477 | Mean Difference (IV, Random, 95% CI) | ‐13.44 [‐19.27, ‐7.61] |
| 3.2 Trials of adults | 14 | 5764 | Mean Difference (IV, Random, 95% CI) | ‐56.05 [‐82.08, ‐30.02] |
| 4 Quantity of drinking (g/week), categorised by length of follow‐up and restricted to trials of adolescents/young adults Show forest plot | 28 | Mean Difference (IV, Random, 95% CI) | Subtotals only | |
| 4.1 At 1 month | 15 | 6579 | Mean Difference (IV, Random, 95% CI) | ‐19.67 [‐32.96, ‐6.37] |
| 4.2 From > 1 to 2 months | 4 | 2002 | Mean Difference (IV, Random, 95% CI) | ‐7.60 [‐18.98, 3.77] |
| 4.3 From > 2 to 3 months | 8 | 1152 | Mean Difference (IV, Random, 95% CI) | ‐15.42 [‐29.39, ‐1.45] |
| 4.4 From > 3 to 6 months | 13 | 10499 | Mean Difference (IV, Random, 95% CI) | ‐10.36 [‐13.47, ‐7.25] |
| 4.5 At 12 months | 4 | 954 | Mean Difference (IV, Random, 95% CI) | ‐2.35 [‐23.57, 18.88] |
| 5 Quantity of drinking (g/week), based on longest follow‐up and categorised by gender Show forest plot | 5 | 2566 | Mean Difference (IV, Random, 95% CI) | ‐9.58 [‐22.24, 3.07] |
| 5.1 Males | 4 | 1923 | Mean Difference (IV, Random, 95% CI) | ‐8.86 [‐31.99, 14.27] |
| 5.2 Females | 4 | 643 | Mean Difference (IV, Random, 95% CI) | ‐9.81 [‐21.87, 2.24] |
| 6 Quantity of drinking (g/week), based on longest follow‐up and omitting trials at high risk of bias owing to incomplete data Show forest plot | 28 | 13559 | Mean Difference (IV, Random, 95% CI) | ‐16.24 [‐23.43, ‐9.05] |
| 7 Quantity of drinking (g/week), based on longest follow‐up and omitting trials at high risk of performance bias Show forest plot | 11 | 10272 | Mean Difference (IV, Random, 95% CI) | ‐10.53 [‐13.70, ‐7.36] |
| 8 Quantity of drinking (g/week), based on longest follow‐up, with imputation of missing standard deviations or number of participants per arm Show forest plot | 49 | 20351 | Mean Difference (IV, Random, 95% CI) | ‐21.58 [‐28.47, ‐14.69] |
| 9 Quantity of drinking (g/week), categorised by length of follow‐up, with imputation of missing standard deviations or number of participants per arm Show forest plot | 49 | Mean Difference (IV, Random, 95% CI) | Subtotals only | |
| 9.1 At 1 month | 18 | 6870 | Mean Difference (IV, Random, 95% CI) | ‐20.07 [‐31.94, ‐8.20] |
| 9.2 From > 1 to 2 months | 8 | 2946 | Mean Difference (IV, Random, 95% CI) | ‐20.18 [‐40.45, 0.09] |
| 9.3 From > 2 to 3 months | 16 | 3443 | Mean Difference (IV, Random, 95% CI) | ‐33.24 [‐57.32, ‐9.16] |
| 9.4 From > 3 to 6 months | 23 | 13736 | Mean Difference (IV, Random, 95% CI) | ‐11.89 [‐16.48, ‐7.30] |
| 9.5 At 12 months | 9 | 3938 | Mean Difference (IV, Random, 95% CI) | ‐11.62 [‐26.42, 3.17] |
| 9.6 At 18 months | 1 | 327 | Mean Difference (IV, Random, 95% CI) | 22.40 [‐5.56, 50.36] |
| 9.7 At 24 months | 1 | 327 | Mean Difference (IV, Random, 95% CI) | 1.40 [‐20.28, 23.08] |
| 10 Frequency of drinking (no. of days drinking/week), based on longest follow‐up Show forest plot | 16 | 10862 | Mean Difference (IV, Random, 95% CI) | ‐0.16 [‐0.24, ‐0.09] |
| 11 Frequency of binge drinking (no. of binges/week), based on longest follow‐up Show forest plot | 15 | 3587 | Mean Difference (IV, Random, 95% CI) | ‐0.24 [‐0.35, ‐0.13] |
| 12 Intensity of drinking (g/drinking day), based on longest follow‐up Show forest plot | 15 | 9791 | Mean Difference (IV, Random, 95% CI) | ‐4.63 [‐8.02, ‐1.23] |
| 13 Binge drinkers, based on longest period of follow‐up Show forest plot | 9 | 9417 | Risk Ratio (M‐H, Random, 95% CI) | 0.98 [0.97, 1.00] |
| Outcome or subgroup title | No. of studies | No. of participants | Statistical method | Effect size |
| 1 Quantity of drinking (g/week), based on longest follow‐up Show forest plot | 5 | 390 | Mean Difference (IV, Random, 95% CI) | 0.52 [‐24.59, 25.63] |
| 2 Quantity of drinking (g/week), categorised by length of follow‐up Show forest plot | 5 | Mean Difference (IV, Random, 95% CI) | Subtotals only | |
| 2.1 At 1 month | 3 | 206 | Mean Difference (IV, Random, 95% CI) | 4.03 [‐36.90, 44.96] |
| 2.2 From > 1 to 2 months | 0 | 0 | Mean Difference (IV, Random, 95% CI) | 0.0 [0.0, 0.0] |
| 2.3 From > 2 to 3 months | 2 | 188 | Mean Difference (IV, Random, 95% CI) | 17.16 [‐42.07, 76.39] |
| 2.4 From > 3 to 6 months | 1 | 113 | Mean Difference (IV, Random, 95% CI) | 6.70 [‐50.53, 63.93] |
| 2.5 At 12 months | 0 | 0 | Mean Difference (IV, Random, 95% CI) | 0.0 [0.0, 0.0] |
| 3 Frequency of drinking (no. of days drinking/week), based on longest follow‐up Show forest plot | 1 | 58 | Mean Difference (IV, Random, 95% CI) | 0.05 [‐0.33, 0.43] |
| 4 Frequency of binge drinking (no. of binges/week), based on longest follow‐up Show forest plot | 3 | 206 | Mean Difference (IV, Random, 95% CI) | 0.04 [‐0.15, 0.22] |