Diálisis peritoneal para la lesión renal aguda
Información
- DOI:
- https://doi.org/10.1002/14651858.CD011457.pub2Copiar DOI

- Base de datos:
-
- Cochrane Database of Systematic Reviews
- Versión publicada:
-
- 04 diciembre 2017see what's new
- Tipo:
-
- Intervention
- Etapa:
-
- Review
- Grupo Editorial Cochrane:
-
Grupo Cochrane de Riñón y trasplante
- Copyright:
-
- Copyright © 2017 The Cochrane Collaboration. Published by John Wiley & Sons, Ltd.
Cifras del artículo
Altmetric:
Citado por:
Autores
Contributions of authors
-
Draft the protocol: Linfeng Liu, Ling Zhang, Guan J Liu, Ping Fu
-
Study selection: Linfeng Liu, Ling Zhang
-
Extract data from studies: Linfeng Liu, Ling Zhang
-
Enter data into RevMan: Linfeng Liu, Ling Zhang
-
Carry out the analysis: Linfeng Liu, Ling Zhang, Ping Fu
-
Interpret the analysis: Linfeng Liu, Ling Zhang, Guan J Liu
-
Draft the final review: Linfeng Liu, Ling Zhang, Ping Fu
-
Disagreement resolution: Ping Fu, Guan J Liu
-
Update the review: Linfeng Liu, Ling Zhang
Declarations of interest
-
Linfeng Liu: none known
-
Ling Zhang: none known
-
Guan J Liu: none known
-
Ping Fu: none known.
Acknowledgements
The authors would like to thank the referees and Cochrane Kidney and Transplant's editorial team for their comments and feedback during the preparation of this review.
Version history
| Published | Title | Stage | Authors | Version |
| 2017 Dec 04 | Peritoneal dialysis for acute kidney injury | Review | Linfeng Liu, Ling Zhang, Guan J Liu, Ping Fu | |
| 2015 Feb 19 | Peritoneal dialysis for acute kidney injury | Protocol | Linfeng Liu, Ling Zhang, Guan J Liu, Ping Fu | |
Differences between protocol and review
The problem of length of in‐hospital stays or ICU stays, blood pressure during dialysis, and vasopressor support which might influence outcomes in AKI were not reported in most of the four included studies, leading to the lack of further analysis according to design in advance. In addition, the limited studies and patients make it difficult to conduct further subgroup analysis.
Notes
The authors declare that they have no relevant financial interests.
Keywords
MeSH
Medical Subject Headings (MeSH) Keywords
Medical Subject Headings Check Words
Humans;
PICO

Flow chart of the article selection process

Risk of bias graph: review authors' judgements about each risk of bias item presented as percentages across all included studies.
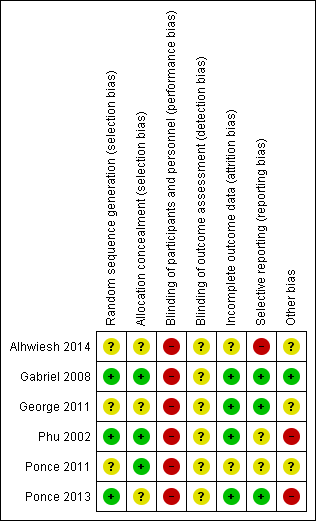
Risk of bias summary: review authors' judgements about each risk of bias item for each included study.
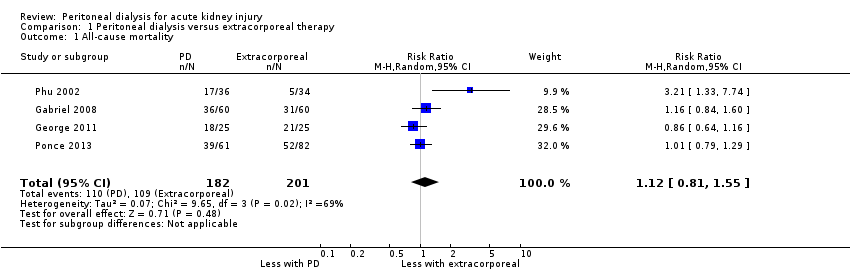
Comparison 1 Peritoneal dialysis versus extracorporeal therapy, Outcome 1 All‐cause mortality.

Comparison 1 Peritoneal dialysis versus extracorporeal therapy, Outcome 2 Recovery of kidney function.
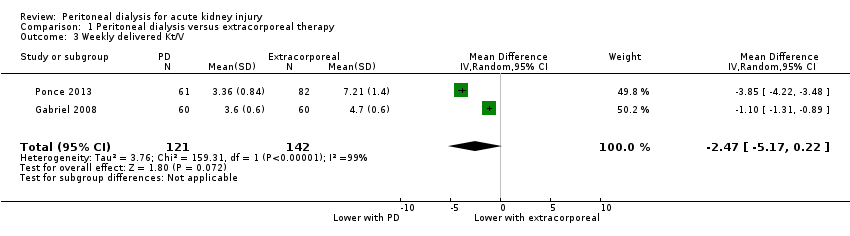
Comparison 1 Peritoneal dialysis versus extracorporeal therapy, Outcome 3 Weekly delivered Kt/V.

Comparison 1 Peritoneal dialysis versus extracorporeal therapy, Outcome 4 Correction of acidosis.

Comparison 1 Peritoneal dialysis versus extracorporeal therapy, Outcome 5 Fluid removal.
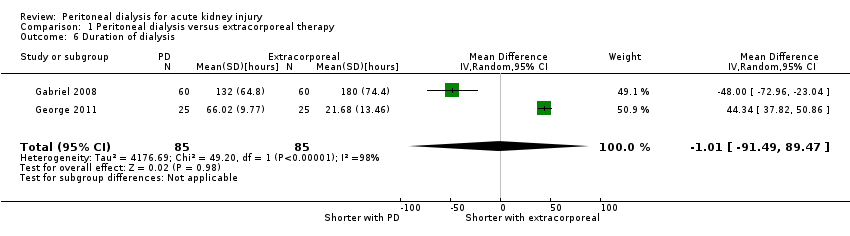
Comparison 1 Peritoneal dialysis versus extracorporeal therapy, Outcome 6 Duration of dialysis.

Comparison 1 Peritoneal dialysis versus extracorporeal therapy, Outcome 7 Infectious complications (catheter infection or peritonitis).
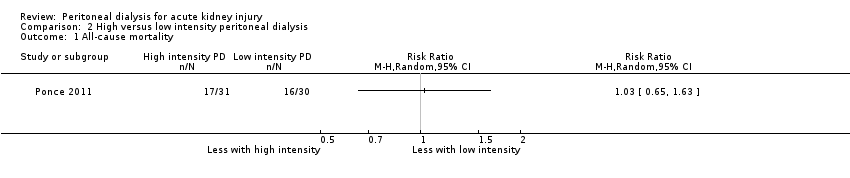
Comparison 2 High versus low intensity peritoneal dialysis, Outcome 1 All‐cause mortality.

Comparison 2 High versus low intensity peritoneal dialysis, Outcome 2 Recovery of kidney function.
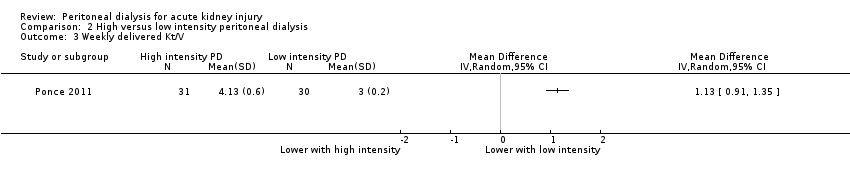
Comparison 2 High versus low intensity peritoneal dialysis, Outcome 3 Weekly delivered Kt/V.
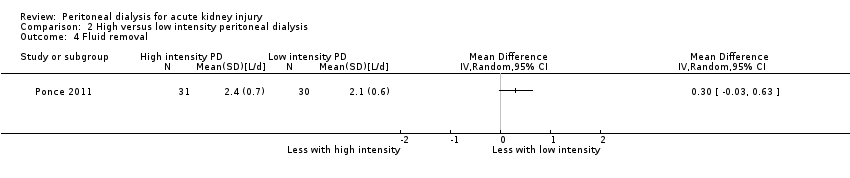
Comparison 2 High versus low intensity peritoneal dialysis, Outcome 4 Fluid removal.

Comparison 2 High versus low intensity peritoneal dialysis, Outcome 5 Infectious complications (catheter infection or peritonitis).
| Peritoneal dialysis versus extracorporeal therapy for acute kidney injury | ||||||
| Patient or population: patients with acute kidney injury Settings: inpatient Intervention: peritoneal dialysis Comparison: extracorporeal therapy | ||||||
| Outcomes | Illustrative comparative risks* (95% CI) | Relative effect | No. of participants | Quality of the evidence | Comments | |
| Assumed risk | Corresponding risk | |||||
| Extracorporeal therapy | Peritoneal dialysis | |||||
| All‐cause mortality | 542 per 1000 | 607 per 1000 (439 to 841) | RR 1.12 (0.81 to 1.55) | 4 (383) | ⊕⊕⊕⊝ | Downgraded for study limitations |
| Recovery of kidney function | 284 per 1000 | 270 per 1000 (193 to 384) | RR 1.42 (0.74 to 2.75) | 3 (333) | ⊕⊕⊕⊝ | Downgraded for study limitations |
| Weekly delivered Kt/V | The mean delivered Kt/V was 2.47 lower (5.17 lower to 0.22 higher) in the peritoneal dialysis group compared to the extracorporeal therapy group | 2 (263) | ⊕⊝⊝⊝ | Downgraded for study limitations, imprecision and insufficient data | ||
| Correction of acidosis | 577 per 1000 | 762 per 1000 (70 to 1,000) | RR 1.32 (0.1 to 13.60) | 2 (120) | ⊕⊝⊝⊝ | Downgraded for study limitations, imprecision and insufficient data |
| Fluid removal (L/d) | The mean fluid removal was 0.59 L/d lower (1.19 lower to 0.01 higher) in the peritoneal dialysis group compared to the extracorporeal therapy group | 3 (313) | ⊕⊕⊝⊝ | Downgraded for study limitations and imprecision | ||
| Duration of dialysis (hours) | The mean duration of dialysis was 1.01 hours less (91.49 lower to 92.54 higher) in the peritoneal dialysis group compared to the extracorporeal therapy group | 2 (170) | ⊕⊝⊝⊝ | Downgraded for study limitations, imprecision and insufficient data | ||
| Infectious complications | 169 per 1000 | 174 per 1000 (101 to 301) | RR 1.03 (0.60 to 1.78) | 2 (263) | ⊕⊕⊝⊝ | Downgraded for study limitations and insufficient data |
| *The basis for the assumed risk (e.g. the median control group risk across studies) is provided in footnotes. The corresponding risk (and its 95% CI) is based on the assumed risk in the comparison group and the relative effect of the intervention (and its 95% CI). | ||||||
| GRADE Working Group grades of evidence | ||||||
| 1Three studies did not report details about random sequence generation or allocation concealment or both 2Small numbers with wide CI 3Few studies (no more than 2) reported the relevant data | ||||||
| Outcome or subgroup title | No. of studies | No. of participants | Statistical method | Effect size |
| 1 All‐cause mortality Show forest plot | 4 | 383 | Risk Ratio (M‐H, Random, 95% CI) | 1.12 [0.81, 1.55] |
| 2 Recovery of kidney function Show forest plot | 3 | 333 | Risk Ratio (M‐H, Random, 95% CI) | 0.95 [0.68, 1.35] |
| 3 Weekly delivered Kt/V Show forest plot | 2 | 263 | Mean Difference (IV, Random, 95% CI) | ‐2.47 [‐5.17, 0.22] |
| 4 Correction of acidosis Show forest plot | 2 | 89 | Risk Ratio (M‐H, Random, 95% CI) | 1.32 [0.13, 13.60] |
| 5 Fluid removal Show forest plot | 3 | 313 | Mean Difference (IV, Random, 95% CI) | ‐0.59 [‐1.19, 0.01] |
| 6 Duration of dialysis Show forest plot | 2 | 170 | Mean Difference (IV, Random, 95% CI) | ‐1.01 [‐91.49, 89.47] |
| 7 Infectious complications (catheter infection or peritonitis) Show forest plot | 2 | 263 | Risk Ratio (M‐H, Random, 95% CI) | 1.03 [0.60, 1.78] |
| Outcome or subgroup title | No. of studies | No. of participants | Statistical method | Effect size |
| 1 All‐cause mortality Show forest plot | 1 | Risk Ratio (M‐H, Random, 95% CI) | Totals not selected | |
| 2 Recovery of kidney function Show forest plot | 1 | Risk Ratio (M‐H, Random, 95% CI) | Totals not selected | |
| 3 Weekly delivered Kt/V Show forest plot | 1 | Mean Difference (IV, Random, 95% CI) | Totals not selected | |
| 4 Fluid removal Show forest plot | 1 | Mean Difference (IV, Random, 95% CI) | Totals not selected | |
| 5 Infectious complications (catheter infection or peritonitis) Show forest plot | 1 | Risk Ratio (M‐H, Random, 95% CI) | Totals not selected | |