Scolaris Content Display Scolaris Content Display

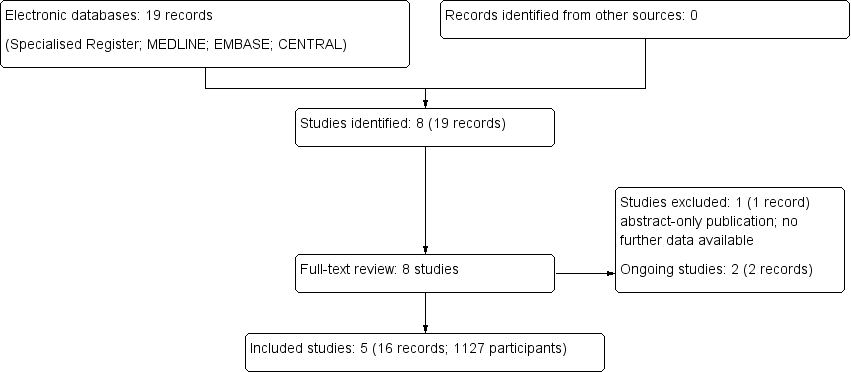
Flow chart of study selection
Figuras y tablas -
Figure 1

Flow chart of study selection

Risk of bias summary: review authors' judgements about each risk of bias item for each included study.
Figuras y tablas -
Figure 2

Risk of bias summary: review authors' judgements about each risk of bias item for each included study.

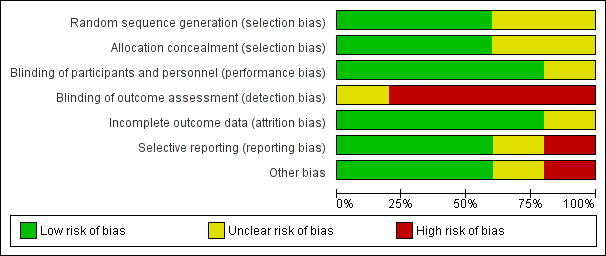
Risk of bias graph: review authors' judgements about each risk of bias item presented as percentages across all included studies.
Figuras y tablas -
Figure 3

Risk of bias graph: review authors' judgements about each risk of bias item presented as percentages across all included studies.

Comparison 1 Major urological complications, Outcome 1 Major urological complications.
Figuras y tablas -
Analysis 1.1

Comparison 1 Major urological complications, Outcome 1 Major urological complications.

Comparison 2 Urinary tract infection, Outcome 1 Urinary tract infection.
Figuras y tablas -
Analysis 2.1

Comparison 2 Urinary tract infection, Outcome 1 Urinary tract infection.

Summary of findings for the main comparison. Early versus late ureteric stent removal after kidney transplantation

Early versus late ureteric stent removal after kidney transplantation

Patient or population: kidney transplant recipients
Intervention: early ureteric stent removal
Comparison: late ureteric stent removal

Outcomes

Anticipated absolute effects* (95% CI)

Relative effect
(95% CI)

No. of participants
(studies)

Quality of the evidence
(GRADE)

Risk with late removal

Risk with early removal

Major urological complications: all stents
follow‐up range: 3 to 12 months

Study population

RR 1.87
(0.61 to 5.71)

1127 (5)

⊕⊕⊕⊕
LOW 1

12 per 1,000

23 per 1,000
(7 to 69)

Major urological complications: bladder indwelling stents
follow‐up range: 3 months to 12 months

Study population

RR 1.67
(0.52 to 5.36)

539 (3)

⊕⊕⊕⊕
LOW 1

15 per 1,000

24 per 1,000
(8 to 79)

Major urological complications: per‐urethral stents
follow‐up range: 3 months to 12 months

Study population

RR 1.51
(0.03 to 74.45)

588 (2)

⊕⊕⊕⊕
LOW 1

10 per 1,000

15 per 1,000
(0 to 732)

Urinary tract infection: all stents

Study population

RR 0.49
(0.30 to 0.81)

1126 (5)

⊕⊕⊕⊝
MODERATE 1 2

185 per 1,000

91 per 1,000
(56 to 150)

Urinary tract infection: bladder indwelling stents

Study population

RR 0.45
(0.29 to 0.70)

539 (3)

⊕⊕⊕⊝
MODERATE 1 2

209 per 1,000

94 per 1,000
(61 to 146)

Urinary tract infection: per‐urethral stents

Study population

RR 0.60
(0.17 to 2.03)

587 (2)

⊕⊕⊝⊝
LOW 1 2

164 per 1,000

98 per 1,000
(28 to 333)

*The risk in the intervention group (and its 95% CI) is based on the assumed risk in the comparison group and the relative effect of the intervention (and its 95% CI).

CI: Confidence interval; RR: Risk ratio

GRADE Working Group grades of evidence
High quality: We are very confident that the true effect lies close to that of the estimate of the effect
Moderate quality: We are moderately confident in the effect estimate: The true effect is likely to be close to the estimate of the effect, but there is a possibility that it is substantially different
Low quality: Our confidence in the effect estimate is limited: The true effect may be substantially different from the estimate of the effect
Very low quality: We have very little confidence in the effect estimate: The true effect is likely to be substantially different from the estimate of effect

1 All studies were unblinded, however, this was unavoidable given the nature of the intervention. The majority of studies provided minimal information on processes of randomisation and allocation

2 Inconsistent definition and variable reporting of urinary tract infection across included studies

Figuras y tablas -
Summary of findings for the main comparison. Early versus late ureteric stent removal after kidney transplantation
Table 1. Reported adverse events

Study ID

Adverse events

Gunawansa 2011

Two patients in the late group required re‐stenting due to ureteric stenosis

Huang 2012

Three patients in the late group had forgotten stents that were subsequently removed at 12 weeks

Indu 2012

Six patients in the early and 5 patients in the late group had acute rejection that required intervention

Parapiboon 2012

No adverse events reported

TrUST 2017

Sixteen patients did not receive their allocated treatment as there were technical difficulties attaching the stent to the catheter.

In the early removal group, 1 patient's stent removal was delayed by 1 day because the urethral catheter balloon needed percutaneous needle puncture due to the stent suture

There were 5 complications in patients who had early stent removal and these were all related to the percutaneous technique used in which the stent was tied to the catheter

Figuras y tablas -
Table 1. Reported adverse events
Comparison 1. Major urological complications

Outcome or subgroup title

No. of studies

No. of participants

Statistical method

Effect size

1 Major urological complications Show forest plot

5

1127

Risk Ratio (M‐H, Random, 95% CI)

1.87 [0.61, 5.71]

1.1 Bladder indwelling stents

3

539

Risk Ratio (M‐H, Random, 95% CI)

1.67 [0.52, 5.36]

1.2 Per‐urethral stents

2

588

Risk Ratio (M‐H, Random, 95% CI)

1.51 [0.03, 74.45]

Figuras y tablas -
Comparison 1. Major urological complications
Comparison 2. Urinary tract infection

Outcome or subgroup title

No. of studies

No. of participants

Statistical method

Effect size

1 Urinary tract infection Show forest plot

5

1126

Risk Ratio (M‐H, Random, 95% CI)

0.49 [0.30, 0.81]

1.1 Bladder indwelling stents

3

539

Risk Ratio (M‐H, Random, 95% CI)

0.45 [0.29, 0.70]

1.2 Per‐urethral stents

2

587

Risk Ratio (M‐H, Random, 95% CI)

0.60 [0.17, 2.03]

Figuras y tablas -
Comparison 2. Urinary tract infection