妊娠女性におけるマラリア予防のためのメフロキン
Referencias
References to studies included in this review
References to studies excluded from this review
References to ongoing studies
Additional references
References to other published versions of this review
Characteristics of studies
Characteristics of included studies [ordered by study ID]
| Methods | Trial design: open‐label, randomized, 2‐arm trial of 2 doses of IPTp Follow‐up: the second IPTp dose was administered from 30 weeks of gestation and at least 1 month after administration of the first dose. Women were visited at home, at delivery, and until 6 weeks after the end of pregnancy. Adverse event (AE) monitoring: AEs were recorded via an open‐labelled questionnaire during visits at home occurring within 1 week after each IPTp intake. | |
| Participants | Numbers of participants randomized: 802 (IPTp‐mefloquine), 799 (IPTp‐sulfadoxine‐pyrimethamine) Inclusion criteria: HIV‐uninfected women of all gravidities at 16 to 28 weeks of gestation who had no history of a neurological or psychiatric disorder and who had not previously used sulfadoxine‐pyrimethamine or mefloquine nor reported having adverse reactions to medications containing sulfa. Exclusion criteria: pregnant women not meeting inclusion criteria. | |
| Interventions |
| |
| Outcomes |
| |
| Notes | Country: Benin Setting: antenatal care clinics from Ouidah,a semi‐rural town Transmission: perennial with seasonal peaks Resistance: in 2005, rates of sulfadoxine‐pyrimethamine and mefloquine resistance in vivo in children < 5 years of age were estimated to be 50% and 2.5% by day 28 of treatment, respectively. Dates: 2005 to 2008 Funding: Fonds de Solidarité Prioritaire (French Ministry of Foreign Affairs; project no. 2006–22); Institut de Recherche pour le Développement; | |
| Risk of bias | ||
| Bias | Authors' judgement | Support for judgement |
| Random sequence generation (selection bias) | High risk | Quote: "Randomization of subjects was stratified according to maternity clinic and gravidity". |
| Allocation concealment (selection bias) | High risk | Allocation was not concealed. |
| Blinding of participants and personnel (performance bias) | High risk | No blinding was reported, and safety outcomes are likely to be influenced by lack of blinding. |
| Blinding of outcome assessment (detection bias) | Low risk | No blinding of outcome assessment was reported, but the review authors judge that the efficacy outcome measurement is not likely to be influenced by lack of blinding. |
| Blinding of outcome assessment (detection bias) | High risk | No blinding of outcome assessment was reported; thus the review authors judge that the safety outcome measurement is likely to be influenced by lack of blinding. |
| Incomplete outcome data (attrition bias) | Low risk | Missing outcome data were balanced in numbers across intervention groups, and similar reasons for missing data were reported across groups. |
| Selective reporting (reporting bias) | Low risk | The study protocol is not available, but it is clear that published reports describe all expected outcomes, including those that were prespecified. |
| Other bias | Low risk | The study appears to be free of other sources of bias. |
| Methods | Trial design: randomized, open‐label trial of 3 doses of IPTp Follow‐up: 3 scheduled IPTp administrations with at least a 1‐month interval between them. IPTp‐mefloquine administration and provision of cotrimoxazole. Clinical and adherence information, complete blood count, CD4 count, malaria screening, and treatment of malaria. At delivery: blood smears from placenta and umbilical cords and evaluation of newborns. Infant evaluation at 6 weeks, 4 months, and 2 months after weaning Adverse event (AE) monitoring: self‐reporting of all AEs. All adverse events were recorded at each visit. In addition, direct observation of early adverse reactions to mefloquine within 30 minutes after supervised intake was noted and later reactions were collected by phone the same day/evening or on the next day. Medical examination was performed 2 weeks after cotrimoxazole initiation to search for cutaneous reactions. An independent data and safety monitoring board reviewed all SAEs. | |
| Participants | Numbers of participants randomized: 146 (cotrimoxazole), 146 (cotrimoxazole+mefloquine) Inclusion criteria: HIV‐infected pregnant women of all gravidities aged > 18 years, living permanently in the study area, between 16 and 28 weeks of gestation; last dosage of IPTp taken 1 month before enrolment; women requiring antimalarial treatment enrolled at least 2 weeks after completion of treatment Exclusion criteria: history of neuropsychiatric disorder; severe kidney or liver disease; serious adverse reaction to mefloquine, sulfa drugs, or quinine | |
| Interventions | IPTp with mefloquine plus cotrimoxazole
Cotrimoxazole
All study participants were given LLITNs and daily supplementation with 100 mg ferrous sulphate and 5 mg folic acid. The first dose was given at ≥ 16 weeks of gestation. All women were observed for 30 minutes following IPTp administration. Women vomiting within the first 30 minutes were given a second full IPTp dose. Asymptomatic women and women with low parasitaemia (< 1000 parasites/µL) were treated by the IPTp‐mefloquine dose in the mefloquine groups. Otherwise, women received artemether‐lumefantrine or oral quinine. Those with severe malaria were treated with intravenous quinine. | |
| Outcomes |
| |
| Notes | Country: Benin Setting: 5 urban hospitals with PMTCT programmes Malaria transmission: intense and perennial transmission, with peaks during rainy seasons Resistance: increasing risk of resistance to sulfa drugs. Parasite resistance to cotrimoxazole Dates: 2009 to 2012 Funding: Sidaction Grant AI19‐3‐01528 | |
| Risk of bias | ||
| Bias | Authors' judgement | Support for judgement |
| Random sequence generation (selection bias) | High risk | Quote: "Randomization was stratified according to the study site and the number of previous pregnancies". |
| Allocation concealment (selection bias) | Low risk | Quote: "The study coordination center retained the master list and assigned treatment by phone". |
| Blinding of participants and personnel (performance bias) | High risk | The trial blinded only the microscopist who evaluated blood smears. |
| Blinding of outcome assessment (detection bias) | Low risk | No blinding of outcome assessment was reported, but the review authors judge that the efficacy outcome measurement is not likely to be influenced by lack of blinding. |
| Blinding of outcome assessment (detection bias) | High risk | No blinding of outcome assessment was reported; thus the review authors judge that the safety outcome measurement is likely to be influenced by lack of blinding. |
| Incomplete outcome data (attrition bias) | Low risk | Missing outcome data were balanced in numbers across groups. |
| Selective reporting (reporting bias) | Low risk | Protocol was not available, but published report describes all expected outcomes including those prespecified. |
| Other bias | Low risk | The study appears to be free of other sources of bias. |
| Methods | Trial design: randomized, open‐label trial of 3 doses of IPTp Follow‐up: 3 scheduled IPTp administrations with at least a 1‐month interval between them. IPTp‐mefloquine administration and provision of cotrimoxazole. Clinical and adherence information, complete blood count, CD4 count, malaria screening, and treatment of malaria. At delivery: blood smears from placenta and umbilical cords and evaluation of newborns. Infant evaluation at 6 weeks, 4 months, and 2 months after weaning Adverse event (AE) monitoring: self‐reporting of all AEs. All adverse events were recorded at each visit. In addition, direct observation of early adverse reactions to mefloquine within 30 minutes after supervised intake was noted and later reactions were collected by phone the same day/evening or on the next day. Medical examination was performed 2 weeks after cotrimoxazole initiation to search for cutaneous reactions. An independent data and safety monitoring board reviewed all SAEs. | |
| Participants | Numbers of participants randomized: 72 (cotrimoxazole), 68 (mefloquine) Inclusion criteria: HIV‐infected pregnant women of all gravidities aged > 18 years, living permanently in the study area, between 16 and 28 weeks of gestation, last dosage of IPTp taken 1 month before enrolment, women requiring antimalarial treatment enrolled at least 2 weeks after completion of treatment Exclusion criteria: history of neuropsychiatric disorder; severe kidney or liver disease; serious adverse reaction to mefloquine, sulfa drugs, or quinine | |
| Interventions | IPTp with mefloquine
Cotrimoxazole
All study participants were given LLITNs and daily supplementation with 100 mg ferrous sulphate and 5 mg folic acid. The first dose was given at ≥ 16 weeks of gestation. All women were observed for 30 minutes following IPTp administration. Women vomiting within the first 30 minutes were given a second full IPTp dose. Asymptomatic women and women with low parasitaemia (< 1000 parasites/µL) in the mefloquine groups were treated by the IPTp‐mefloquine dose. Otherwise, women received artemether‐lumefantrine or oral quinine. Thos with severe malaria were treated with intravenous quinine. | |
| Outcomes |
| |
| Notes | Country: Benin Setting: 5 urban hospitals with PMTCT programmes Malaria transmission: intense and perennial transmission, with peaks during rainy seasons Resistance: increasing risk of resistance to sulfa drugs. Parasite resistance to cotrimoxazole Dates: 2009 to 2012 Funding: Sidaction Grant AI19‐3‐01528 | |
| Risk of bias | ||
| Bias | Authors' judgement | Support for judgement |
| Random sequence generation (selection bias) | High risk | Quote: "Randomization was stratified according to the study site and the number of previous pregnancies". |
| Allocation concealment (selection bias) | Low risk | Quote: "The study coordination center retained the master list and assigned treatment by phone". |
| Blinding of participants and personnel (performance bias) | High risk | The trial blinded only the microscopist who evaluated blood smears. |
| Blinding of outcome assessment (detection bias) | Low risk | No blinding of outcome assessment was reported, but the review authors judge that the efficacy outcome measurement is not likely to be influenced by lack of blinding. |
| Blinding of outcome assessment (detection bias) | High risk | No blinding of outcome assessment was reported; thus the review authors judge that the safety outcome measurement is likely to be influenced by lack of blinding. |
| Incomplete outcome data (attrition bias) | Low risk | Missing outcome data were balanced in numbers across groups. |
| Selective reporting (reporting bias) | Low risk | Protocol was not available, but published report describes all expected outcomes including those prespecified. |
| Other bias | Low risk | The study appears to be free of other sources of bias. |
| Methods | Trial design: open‐label, randomized, 3‐arm trial of 2 doses of IPTp Follow‐up: at each scheduled and unscheduled visit, a standardized symptom questionnaire was completed, as were blood smears for malaria parasites, and haemoglobin if symptoms and/or signs were suggestive of malaria. At delivery, blood samples were collected for haematological and parasitological evaluation. Weighting of newborns and gestational age at birth were recorded. Malaria parasite was determined 6 weeks after the end of pregnancy. Adverse event monitoring: home visits by field workers were done 2 days after IPTp administration to assess drug tolerability. Solicited and unsolicited adverse events (AEs) were assessed. The former were assessed by directed questioning regarding malaria‐related signs and symptoms during unscheduled visits, whereas the latter were assessed through open questioning during scheduled visits. | |
| Participants | Numbers of participants randomized: 1578 (sulfadoxine‐pyrimethamine), 1580 (mefloquine full dose), 1591 (mefloquine split) Inclusion criteria: HIV‐uninfected women of all gravidities attending the antenatal care clinic for the first time, did not receive IPTp during current pregnancy, permanent residence in the study area, gestational age of ≤ 28 weeks Exclusion criteria: HIV‐positive; history of allergy to sulfa drugs or mefloquine; history of severe renal, hepatic, psychiatric, or neurological disease; mefloquine or halofantrine treatment in the preceding 4 weeks; participating in other intervention studies | |
| Interventions | IPTp with sulfadoxine‐pyrimethamine, 3 tablets
IPTp with mefloquine
IPTp with mefloquine (split dose)
All study participants were given LLITNs. The first dose was given at > 13 weeks of gestation. All women were observed for 60 minutes following IPT administration. Women vomiting within the first 30 minutes were given a second full IPT dose, and those vomiting 30 to 60 minutes after drug intake were given a half replacement dose. Uncomplicated malaria episodes were treated with oral quinine (first trimester) or artemether‐lumefantrine (second and third trimesters); severe malaria episodes were treated with parenteral quinine. | |
| Outcomes |
| |
| Notes | Country: Tanzania, Mozambique, Benin, and Gabon Setting: antenatal care clinics Transmission: mesoendemic in Tanzania and Mozambique, hyperendemic in Benin and Gabon Resistance: resistance to sulfadoxine‐pyrimethamine due to long‐term sulfadoxine‐pyrimethamine for IPTp Dates: 2009 to 2013 Funding: this study was funded by the European Developing Countries Clinical Trials Partnership (EDCTP; IP.2007.31080.002), the Malaria in Pregnancy Consortium, and the Instituto de Salud Carlos III (PI08/0564), in Spain. RG and MR were partially supported by grants from the Spanish Ministry of Health (ref. CM07/0015 and CM11/00278, respectively). The CISM receives core funding from the Spanish Agency for International Cooperation (AECID). LLITNs (Permanet) were donated by Vestergaard Frandsen. | |
| Risk of bias | ||
| Bias | Authors' judgement | Support for judgement |
| Random sequence generation (selection bias) | Low risk | Quote: "The allocation of the participants to the study arms was done centrally by randomization stratified by country according to a 1:1:1 scheme. The sponsor’s institution biostatistician produced the computer‐generated randomization list for each recruiting site". |
| Allocation concealment (selection bias) | Low risk | Quote: "Treatment allocation for each participant was concealed in opaque sealed envelopes that were opened only after recruitment. Study participants were assigned a unique study number linked to the allocated treatment group". |
| Blinding of participants and personnel (performance bias) | High risk | Quote: "The study was designed as an open‐label, randomized, three‐arm trial to compare two‐dose mefloquine with two‐dose SP for IPTp". |
| Blinding of outcome assessment (detection bias) | Low risk | No blinding of outcome assessment was reported, but the review authors judge that the efficacy outcome measurement is not likely to be influenced by lack of blinding. |
| Blinding of outcome assessment (detection bias) | High risk | No blinding of outcome assessment was reported; thus the review authors judge that the safety outcome measurement is likely to be influenced by lack of blinding. |
| Incomplete outcome data (attrition bias) | Low risk | All excluded participants, at any stage of the trial, are counted in the flow chart (both ITT and ATP cohorts). Missing outcome data were balanced in numbers across groups. |
| Selective reporting (reporting bias) | Low risk | Not observed. Protocol available |
| Other bias | Low risk | The study appears to be free of other sources of bias. |
| Methods | Trial design: individually randomized, double‐blind, placebo‐controlled trial of 3 doses of IPTp Follow‐up: at each scheduled and unscheduled visit, a standardized symptom questionnaire was completed, as were blood smears for malaria parasites, and haemoglobin if symptoms and/or signs were suggestive of malaria. On a monthly basis, adherence to cotrimoxazole and LLITN was assessed. At delivery, blood samples were collected for haematological and parasitological evaluation with CD4 cell count and HIV viral load. Weighting of newborns and gestational age at birth were recorded. Malaria parasite was determined 6 weeks after the end of pregnancy. Adverse event monitoring: home visits by field workers were done 2 days after IPTp administration to assess drug tolerability. Solicited and unsolicited adverse events (AEs) were assessed. The former were assessed by directed questioning of malaria‐related signs and symptoms during unscheduled visits, whereas the latter were assessed through open questioning during scheduled visits. | |
| Participants | Numbers of participants randomized: 537 (placebo+cotrimoxazole), 534 (mefloquine+cotrimoxazole) Inclusion criteria: HIV‐infected women of all gravidities attending the antenatal care clinic for the first time, did not receive IPTp during current pregnancy, permanent residence in the study area, gestational age of ≤ 28 weeks, HIV positive Exclusion criteria: history of allergy to sulfa drugs or mefloquine; history of severe renal, hepatic, psychiatric, or neurological disease; mefloquine or halofantrine treatment in the preceding 4 weeks; participating in other intervention studies | |
| Interventions | IPTp with mefloquine
IPTp with placebo
All study participants had monthly cotrimoxazole prophylaxis (fixed combination 800 mg of trimethroprim and 160 mg of sulfamethoxazole/tablet). All study participants were given LLITNs. The first dose was given at > 13 weeks of gestation. All women were observed for 60 minutes following IPT administration. Women vomiting within the first 30 minutes were given a second full IPTp dose, and those vomiting 30 to 60 minutes after drug intake were given a half replacement dose. Uncomplicated malaria episodes were treated with oral quinine (first trimester) or artemether‐lumefantrine (second and third trimesters); severe malaria episodes were treated with parenteral quinine. | |
| Outcomes |
| |
| Notes | Countries: Tanzania, Mozambique, and Kenya Setting: antenatal care clinics Transmission: mesoendemic in Tanzania and Mozambique, holoendemic in Kenya Resistance: resistance to sulfadoxine‐pyrimethamine due to long‐term sulfadoxine‐pyrimethamine for IPTp Dates: 2010 to 2013 Funding: this study was funded by the European Developing Countries Clinical Trials Partnership (EDCTP; IP.2007.31080.002), the Malaria in Pregnancy Consortium, and the Instituto de Salud Carlos III (PI08/0564), in Spain. RG and MR were partially supported by grants from the Spanish Ministry of Health (ref. CM07/0015 and CM11/00278, respectively). The CISM receives core funding from the Spanish Agency for international Cooperation (AECID). LLITNs (Permanet) were donated by Vestergaard Frandsen, and cotrimoxazole tablets (Septrin) by UCB Pharma, in Spain. | |
| Risk of bias | ||
| Bias | Authors' judgement | Support for judgement |
| Random sequence generation (selection bias) | Low risk | Quote: "The allocation of the participants to the study arms was done centrally by block randomization (block size of 6) stratified by country". |
| Allocation concealment (selection bias) | Low risk | Quote: "The Pharmacy Department of the Hospital Clinic in Barcelona produced and safeguarded the computer‐generated randomization list for each recruiting site until unblinding, and carried out the masking, labelling, and packaging of all study interventional drugs. Study number allocation for each participant was concealed in opaque sealed envelopes that were sequentially numbered and opened only after recruitment by study health personnel". |
| Blinding of participants and personnel (performance bias) | Low risk | Quote: "Study participants were assigned a unique study Placebo tablets were identical to mefloquine tables in shape and colour. |
| Blinding of outcome assessment (detection bias) | Low risk | Quote: "Investigators, laboratory staff, care providers, and study participants were blinded to intervention throughout the study". |
| Blinding of outcome assessment (detection bias) | Low risk | Quote: "Investigators, laboratory staff, care providers, and study participants were blinded to intervention throughout the study". |
| Incomplete outcome data (attrition bias) | Low risk | All excluded participants, at any stage of the trial, are counted in the flow chart (both ITT and ATP cohorts). Missing outcome data were balanced in numbers across groups. |
| Selective reporting (reporting bias) | Low risk | Not observed. Protocol available |
| Other bias | Low risk | The study appears to be free of other sources of bias. |
| Methods | Trial design: double‐blind, placebo‐controlled trial. Phase 1 and phase 2 Follow‐up: in both phases, weekly visits included assessment of weight, temperature, pulse, blood pressure, fundal height, presence of oedema and anaemia, a symptom questionnaire on gastrointestinal and central nervous system side effects, malaria blood smear, electrocardiogram, and haematology and biochemistry every 2 weeks. Treatment of malaria and anaemia and food supply were provided when needed. At phase 2, expanded questionnaires and Romberg test were used. At delivery, measurement of newborn weight, details of labour, cord and maternal blood samples (malaria and anaemia), and placental biopsy were included. At phase 2, autopsy of death was performed in newborns. Follow‐up consisted of different measurements in children until 2 years of age (weight, height, head and arm circumferences) and determination of age when baby could first crawl, sit, walk, and talk. At phase 2, age at first symptomatic malaria, malaria blood smear, haematocrit, and full clinical examination were performed. Adverse event monitoring: weekly symptom questionnaire focusing on gastrointestinal, neurological, dermatological, and systemic symptoms | |
| Participants | Numbers of participants randomized: 170 (mefloquine ‐ 60 phase 1, 110 phase 2), 169 (placebo ‐ 59 phase 1, 110 phase 2) Inclusion criteria: women of all gravidities and unknown HIV status (not tested) who attended the ANC clinic and were at > 20 weeks of estimated gestation. Exclusion criteria: women not meeting inclusion criteria. | |
| Interventions | IPTp with mefloquine
IPTp with placebo
The first dose was given at > 20 weeks of gestation. Anaemia was treated with ferrous sulphate and folic acid. Uncomplicated Plasmodium falciparum malaria was treated with quinine sulphate, P vivax with chloroquine sulphate, and severe malaria with intravenous quinine dihydrochloride. | |
| Outcomes |
| |
| Notes | Country: Thailand Setting: 3 camps for displaced people: phase 1 antenatal clinics, phase 2 hospital Dates: 1987 to 1990 Transmission: seasonal malaria transmission (mesoendemic) Resistance: resistances to mefloquine, quinine, chloroquine, and antifolates Funding: United Nations Development Programme/World Bank/World Health Organization Special Programme for Research and Training in Tropical Diseases; Wellcome Trust of Great Britain; Prevention Fundation | |
| Risk of bias | ||
| Bias | Authors' judgement | Support for judgement |
| Random sequence generation (selection bias) | Unclear risk | Women were randomized to receive mefloquine or placebo. Not well explained how women were randomized |
| Allocation concealment (selection bias) | Unclear risk | Not explained |
| Blinding of participants and personnel (performance bias) | Low risk | Double‐blind trial Quote: "The investigators were unaware of the randomization". Placebo tablets were identical to mefloquine tablets. |
| Blinding of outcome assessment (detection bias) | Unclear risk | Not explained |
| Blinding of outcome assessment (detection bias) | Unclear risk | Not explained |
| Incomplete outcome data (attrition bias) | Low risk | All excluded participants and those who decided to drop out are correctly reported along with reasons. Missing outcome data were balanced in numbers across groups. |
| Selective reporting (reporting bias) | Unclear risk | Results of cord and maternal blood smears are not shown (published elsewhere?). No protocol is available. Nothing else was observed. |
| Other bias | Low risk | The study appears to be free of other sources of bias. |
Abbreviations: AE: adverse event; AECID: Spanish Agency for International Cooperation; ANC: antenatal care; ATP: adenosine triphosphate; CISM: Centro de Investigação em Saúde da Manhiça; IPTp: intermittent preventive treatment for malaria in pregnancy; IPTp‐mefloquine: intermittent preventive mefloquine treatment in pregnancy; IPTp‐sulfadoxine‐pyrimethamine: intermittent preventive sulfadoxine‐pyrimethamine treatment in pregnancy; ITT: intention‐to‐treat; LLITN: long‐lasting insecticide‐treated net; PCR: polymerase chain reaction; PMTCT: prevention of mother‐to‐child transmission; SAE: serious adverse event.
Characteristics of excluded studies [ordered by study ID]
| Study | Reason for exclusion |
| Letter to editor reporting on the results of pregnancy of 24 women exposed to mefloquine in early pregnancy. The report was excluded because it did not meet the inclusion criteria. | |
| This publication reports the findings of a re‐analysis of previous published data comparing mefloquine with sulphadoxine‐pyrimethamine for IPTp in Benin using a multiple outcome approach, which allowed the joint assessment of efficacy and tolerability. This analysis was not included in the review because the original study (Briand 2009 BEN) was already included and it did not add additional data. | |
| Study comparing mefloquine tolerability as IPTp between HIV‐infected and uninfected women participating in three included trials from Benin (Briand 2009 BEN and Denoeud‐Ndam 2014a and b). This analysis was excluded from the review because it did not provide additional data from already included trials. | |
| The study was designed as a dose‐finding pharmacokinetic study in 20 pregnant women in the third trimester of pregnancy who received mefloquine as prophylaxis. The trial did not compare the safety and efficacy of mefloquine with another antimalarial drug and thus, it did not meet inclusion criteria. | |
| Publication reporting on a data analysis of reported use of mefloquine during the 1st trimester of pregnancy in European travellers. This analysis was excluded from the review because it did not meet inclusion criteria. | |
| This publication presents the analysis of the reports of exposure to mefloquine in pregnancy received by the Roche post‐marketing surveillance system. This analysis was excluded from the review because it did not meet inclusion criteria. | |
| This publication reports a case series of 72 US soldiers who inadvertently took mefloquine during pregnancy for prophylaxis. This publication was excluded from the review because it did not meet inclusion criteria. | |
| We were not convinced that allocation was unbiased. Quote: "The assignment of regimens was based on the clinic day of enrolment. All women making their first antenatal clinic visit on a given day were assigned to the same regimen; the following clinic day, enrolled women were assigned a different regimen". We noted bias in allocation supported by statistically and clinically significant differences between intervention groups (3 groups under different chloroquine regimens versus 1 group under mefloquine regimen). | |
| Study evaluating 1627 reports of mefloquine exposure pregnancy, mainly for chemoprophylaxis received by the Roche Post‐marketing surveillance system between 1986 and 1996.This analysis was excluded from the review because it did not meet inclusion criteria. |
Characteristics of ongoing studies [ordered by study ID]
| Trial name or title | A comparative study of mefloquine and SP as prophylaxis against malaria in pregnant HIV‐infected patients |
| Methods | Allocation: randomized Intervention model: parallel assignment Masking: single‐blind (outcomes assessor) Primary purpose: prevention |
| Participants | Inclusion criteria:
Exclusion criteria:
|
| Interventions |
|
| Outcomes | No information available |
| Starting date | September 2015 |
| Contact information | Oriyomi O Akinyotu, MBBS; Ibadan: +2348035044590; [email protected] |
| Notes | We contacted the study authors, but they could not provide the data to us because the study was part of a thesis not yet defended. |
Data and analyses
| Outcome or subgroup title | No. of studies | No. of participants | Statistical method | Effect size |
| 1 Clinical malaria episodes during pregnancy Show forest plot | 2 | Rate Ratio (Fixed, 95% CI) | 0.83 [0.65, 1.05] | |
| Analysis 1.1  Comparison 1 Mefloquine versus sulfadoxine‐pyrimethamine, Outcome 1 Clinical malaria episodes during pregnancy. | ||||
| 2 Maternal peripheral parasitaemia at delivery Show forest plot | 2 | 5455 | Risk Ratio (M‐H, Fixed, 95% CI) | 0.65 [0.48, 0.86] |
| Analysis 1.2  Comparison 1 Mefloquine versus sulfadoxine‐pyrimethamine, Outcome 2 Maternal peripheral parasitaemia at delivery. | ||||
| 3 Placental malaria Show forest plot | 2 | 4668 | Risk Ratio (M‐H, Random, 95% CI) | 1.04 [0.58, 1.86] |
| Analysis 1.3 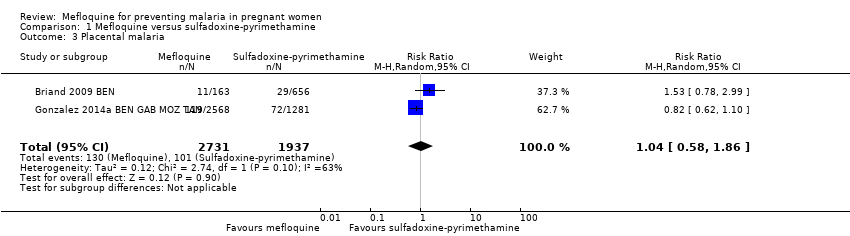 Comparison 1 Mefloquine versus sulfadoxine‐pyrimethamine, Outcome 3 Placental malaria. | ||||
| 4 Mean haemoglobin at delivery Show forest plot | 2 | 5588 | Mean Difference (IV, Fixed, 95% CI) | 0.10 [0.01, 0.19] |
| Analysis 1.4  Comparison 1 Mefloquine versus sulfadoxine‐pyrimethamine, Outcome 4 Mean haemoglobin at delivery. | ||||
| 5 Maternal anaemia at delivery Show forest plot | 2 | 5469 | Risk Ratio (M‐H, Fixed, 95% CI) | 0.84 [0.76, 0.94] |
| Analysis 1.5  Comparison 1 Mefloquine versus sulfadoxine‐pyrimethamine, Outcome 5 Maternal anaemia at delivery. | ||||
| 6 Severe maternal anaemia at delivery Show forest plot | 2 | 5469 | Risk Ratio (M‐H, Random, 95% CI) | 0.93 [0.58, 1.48] |
| Analysis 1.6  Comparison 1 Mefloquine versus sulfadoxine‐pyrimethamine, Outcome 6 Severe maternal anaemia at delivery. | ||||
| 7 Cord blood parasitaemia Show forest plot | 2 | 5309 | Risk Ratio (M‐H, Random, 95% CI) | 0.44 [0.13, 1.46] |
| Analysis 1.7  Comparison 1 Mefloquine versus sulfadoxine‐pyrimethamine, Outcome 7 Cord blood parasitaemia. | ||||
| 8 Cord blood anaemia Show forest plot | 1 | 4006 | Risk Ratio (M‐H, Fixed, 95% CI) | 1.04 [0.87, 1.23] |
| Analysis 1.8  Comparison 1 Mefloquine versus sulfadoxine‐pyrimethamine, Outcome 8 Cord blood anaemia. | ||||
| 9 Mean birth weight Show forest plot | 2 | 5241 | Mean Difference (IV, Fixed, 95% CI) | 2.52 [‐25.66, 30.69] |
| Analysis 1.9  Comparison 1 Mefloquine versus sulfadoxine‐pyrimethamine, Outcome 9 Mean birth weight. | ||||
| 10 Low birth weight Show forest plot | 2 | 5641 | Risk Ratio (M‐H, Random, 95% CI) | 0.95 [0.78, 1.17] |
| Analysis 1.10  Comparison 1 Mefloquine versus sulfadoxine‐pyrimethamine, Outcome 10 Low birth weight. | ||||
| 11 Low birth weight by gravidity Show forest plot | 2 | 5641 | Risk Ratio (M‐H, Fixed, 95% CI) | 0.97 [0.84, 1.13] |
| Analysis 1.11 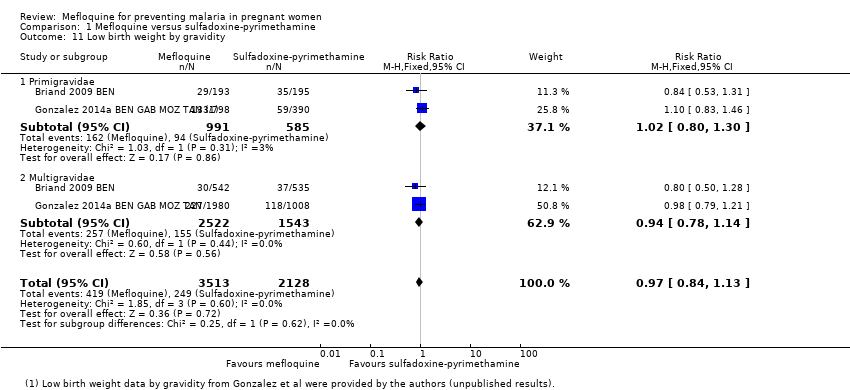 Comparison 1 Mefloquine versus sulfadoxine‐pyrimethamine, Outcome 11 Low birth weight by gravidity. | ||||
| 11.1 Primigravidae | 2 | 1576 | Risk Ratio (M‐H, Fixed, 95% CI) | 1.02 [0.80, 1.30] |
| 11.2 Multigravidae | 2 | 4065 | Risk Ratio (M‐H, Fixed, 95% CI) | 0.94 [0.78, 1.14] |
| 12 Prematurity Show forest plot | 2 | 4640 | Risk Ratio (M‐H, Fixed, 95% CI) | 1.03 [0.76, 1.40] |
| Analysis 1.12 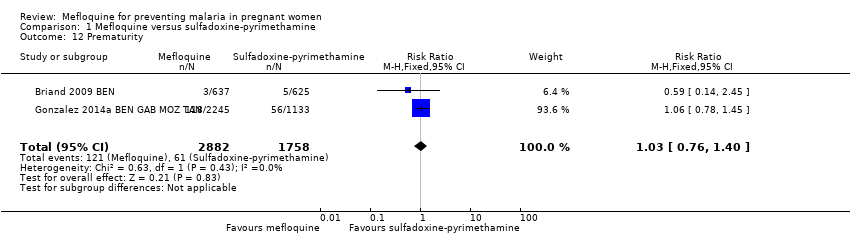 Comparison 1 Mefloquine versus sulfadoxine‐pyrimethamine, Outcome 12 Prematurity. | ||||
| 13 Malaria in first year of life Show forest plot | 1 | Rate Ratio (Fixed, 95% CI) | 0.97 [0.82, 1.15] | |
| Analysis 1.13 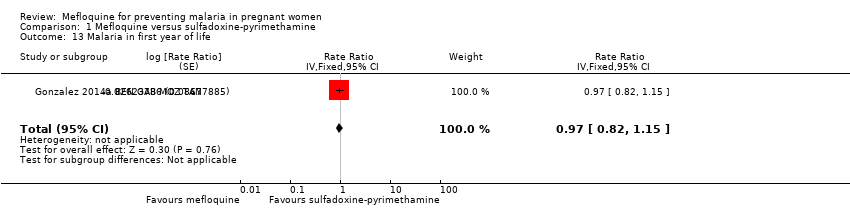 Comparison 1 Mefloquine versus sulfadoxine‐pyrimethamine, Outcome 13 Malaria in first year of life. | ||||
| 14 Hospital admissions in first year of life Show forest plot | 1 | Rate Ratio (Fixed, 95% CI) | 0.93 [0.75, 1.17] | |
| Analysis 1.14  Comparison 1 Mefloquine versus sulfadoxine‐pyrimethamine, Outcome 14 Hospital admissions in first year of life. | ||||
| 15 SAEs during pregnancy Show forest plot | 1 | 4674 | Risk Ratio (M‐H, Fixed, 95% CI) | 0.98 [0.81, 1.20] |
| Analysis 1.15 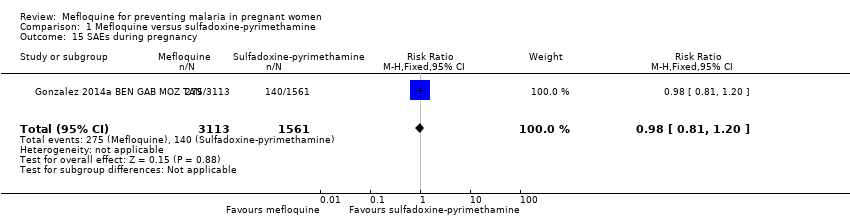 Comparison 1 Mefloquine versus sulfadoxine‐pyrimethamine, Outcome 15 SAEs during pregnancy. | ||||
| 16 Stillbirths and abortions Show forest plot | 2 | 6219 | Risk Ratio (M‐H, Fixed, 95% CI) | 1.20 [0.91, 1.58] |
| Analysis 1.16 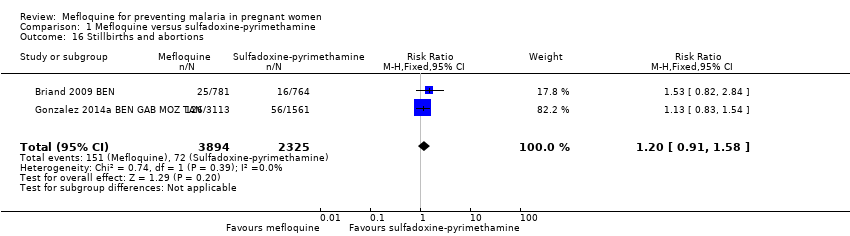 Comparison 1 Mefloquine versus sulfadoxine‐pyrimethamine, Outcome 16 Stillbirths and abortions. | ||||
| 17 Congenital malformations Show forest plot | 2 | 5931 | Risk Ratio (M‐H, Random, 95% CI) | 1.10 [0.51, 2.37] |
| Analysis 1.17  Comparison 1 Mefloquine versus sulfadoxine‐pyrimethamine, Outcome 17 Congenital malformations. | ||||
| 18 Maternal mortality Show forest plot | 2 | 6219 | Risk Ratio (M‐H, Random, 95% CI) | 2.41 [0.27, 21.23] |
| Analysis 1.18  Comparison 1 Mefloquine versus sulfadoxine‐pyrimethamine, Outcome 18 Maternal mortality. | ||||
| 19 Neonatal mortality Show forest plot | 2 | 6134 | Risk Ratio (M‐H, Fixed, 95% CI) | 0.98 [0.67, 1.43] |
| Analysis 1.19  Comparison 1 Mefloquine versus sulfadoxine‐pyrimethamine, Outcome 19 Neonatal mortality. | ||||
| 20 Infant mortality Show forest plot | 1 | Rate Ratio (Fixed, 95% CI) | 1.00 [0.66, 1.52] | |
| Analysis 1.20  Comparison 1 Mefloquine versus sulfadoxine‐pyrimethamine, Outcome 20 Infant mortality. | ||||
| 21 AEs: vomiting Show forest plot | 2 | 6272 | Risk Ratio (M‐H, Fixed, 95% CI) | 4.76 [4.13, 5.49] |
| Analysis 1.21  Comparison 1 Mefloquine versus sulfadoxine‐pyrimethamine, Outcome 21 AEs: vomiting. | ||||
| 22 AEs: fatigue/weakness Show forest plot | 2 | 6272 | Risk Ratio (M‐H, Random, 95% CI) | 4.62 [1.80, 11.85] |
| Analysis 1.22  Comparison 1 Mefloquine versus sulfadoxine‐pyrimethamine, Outcome 22 AEs: fatigue/weakness. | ||||
| 23 AEs: dizziness Show forest plot | 2 | 6272 | Risk Ratio (M‐H, Random, 95% CI) | 4.21 [3.36, 5.27] |
| Analysis 1.23  Comparison 1 Mefloquine versus sulfadoxine‐pyrimethamine, Outcome 23 AEs: dizziness. | ||||
| 24 AEs: headache Show forest plot | 2 | 6272 | Risk Ratio (M‐H, Random, 95% CI) | 0.70 [0.25, 1.94] |
| Analysis 1.24  Comparison 1 Mefloquine versus sulfadoxine‐pyrimethamine, Outcome 24 AEs: headache. | ||||
| Outcome or subgroup title | No. of studies | No. of participants | Statistical method | Effect size |
| 1 Clinical malaria episodes during pregnancy Show forest plot | 1 | Rate Ratio (Fixed, 95% CI) | 0.76 [0.33, 1.76] | |
| Analysis 2.1  Comparison 2 Mefloquine plus cotrimoxazole versus cotrimoxazole, Outcome 1 Clinical malaria episodes during pregnancy. | ||||
| 2 Maternal peripheral parasitaemia at delivery (PCR) Show forest plot | 2 | 989 | Risk Ratio (M‐H, Fixed, 95% CI) | 0.52 [0.30, 0.93] |
| Analysis 2.2  Comparison 2 Mefloquine plus cotrimoxazole versus cotrimoxazole, Outcome 2 Maternal peripheral parasitaemia at delivery (PCR). | ||||
| 3 Placental malaria (blood smear) Show forest plot | 2 | 1144 | Risk Ratio (M‐H, Fixed, 95% CI) | 0.51 [0.29, 0.89] |
| Analysis 2.3  Comparison 2 Mefloquine plus cotrimoxazole versus cotrimoxazole, Outcome 3 Placental malaria (blood smear). | ||||
| 4 Placental malaria (PCR) Show forest plot | 2 | 977 | Risk Ratio (M‐H, Fixed, 95% CI) | 0.28 [0.14, 0.57] |
| Analysis 2.4 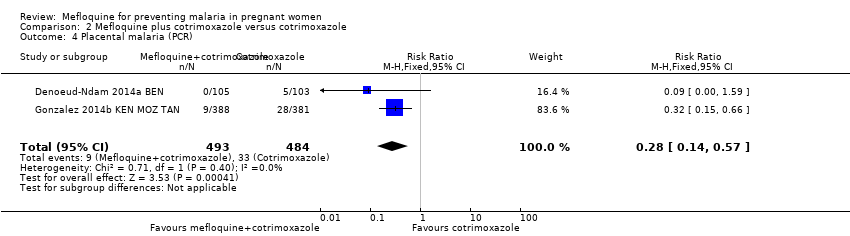 Comparison 2 Mefloquine plus cotrimoxazole versus cotrimoxazole, Outcome 4 Placental malaria (PCR). | ||||
| 5 Mean haemoglobin at delivery Show forest plot | 2 | 1167 | Mean Difference (IV, Random, 95% CI) | 0.07 [‐0.32, 0.46] |
| Analysis 2.5 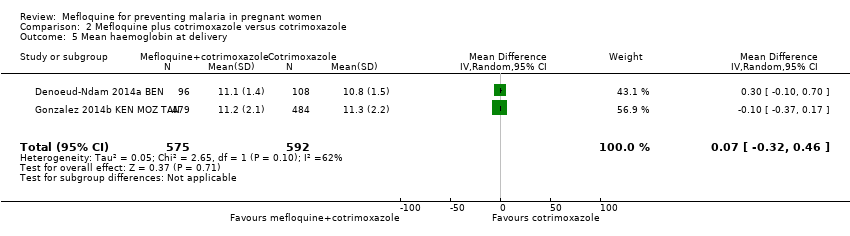 Comparison 2 Mefloquine plus cotrimoxazole versus cotrimoxazole, Outcome 5 Mean haemoglobin at delivery. | ||||
| 6 Maternal anaemia at delivery (< 9.5 g/dL) Show forest plot | 2 | 1197 | Risk Ratio (M‐H, Fixed, 95% CI) | 0.94 [0.73, 1.20] |
| Analysis 2.6 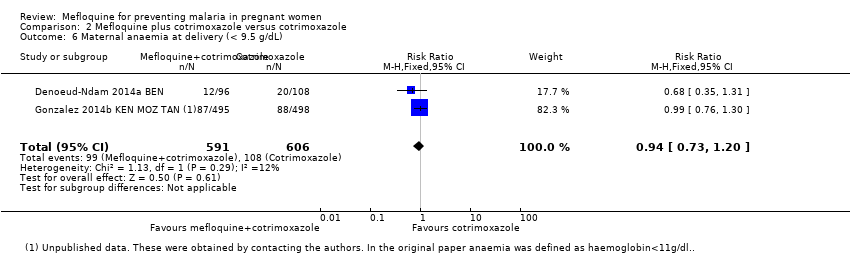 Comparison 2 Mefloquine plus cotrimoxazole versus cotrimoxazole, Outcome 6 Maternal anaemia at delivery (< 9.5 g/dL). | ||||
| 7 Maternal severe anaemia at delivery Show forest plot | 2 | 1167 | Risk Ratio (M‐H, Fixed, 95% CI) | 0.93 [0.41, 2.08] |
| Analysis 2.7 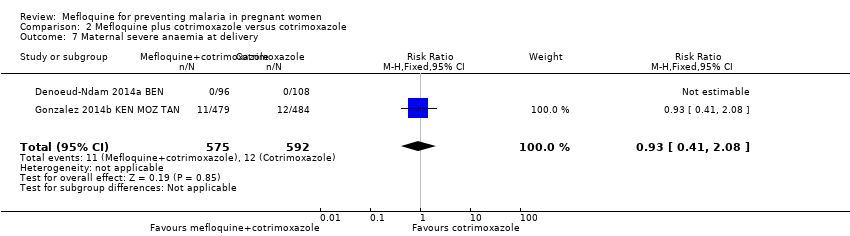 Comparison 2 Mefloquine plus cotrimoxazole versus cotrimoxazole, Outcome 7 Maternal severe anaemia at delivery. | ||||
| 8 Cord blood parasitaemia Show forest plot | 2 | 1166 | Risk Ratio (M‐H, Fixed, 95% CI) | 0.33 [0.03, 3.13] |
| Analysis 2.8 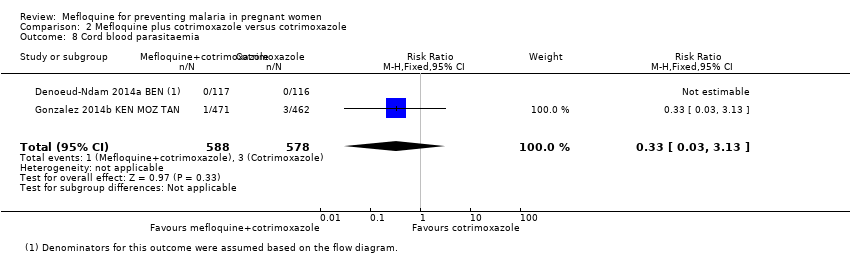 Comparison 2 Mefloquine plus cotrimoxazole versus cotrimoxazole, Outcome 8 Cord blood parasitaemia. | ||||
| 9 Mean birth weight Show forest plot | 2 | 1220 | Mean Difference (IV, Random, 95% CI) | ‐25.75 [‐86.99, 35.49] |
| Analysis 2.9  Comparison 2 Mefloquine plus cotrimoxazole versus cotrimoxazole, Outcome 9 Mean birth weight. | ||||
| 10 Low birth weight Show forest plot | 2 | 1220 | Risk Ratio (M‐H, Fixed, 95% CI) | 1.20 [0.89, 1.60] |
| Analysis 2.10  Comparison 2 Mefloquine plus cotrimoxazole versus cotrimoxazole, Outcome 10 Low birth weight. | ||||
| 11 Prematurity Show forest plot | 2 | 824 | Risk Ratio (M‐H, Random, 95% CI) | 1.07 [0.58, 1.96] |
| Analysis 2.11 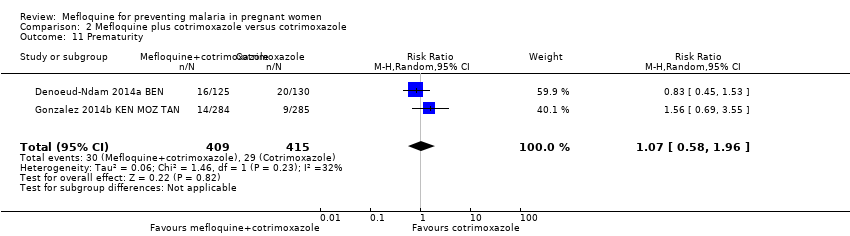 Comparison 2 Mefloquine plus cotrimoxazole versus cotrimoxazole, Outcome 11 Prematurity. | ||||
| 12 SAEs during pregnancy Show forest plot | 2 | 1347 | Risk Ratio (M‐H, Fixed, 95% CI) | 0.69 [0.50, 0.95] |
| Analysis 2.12 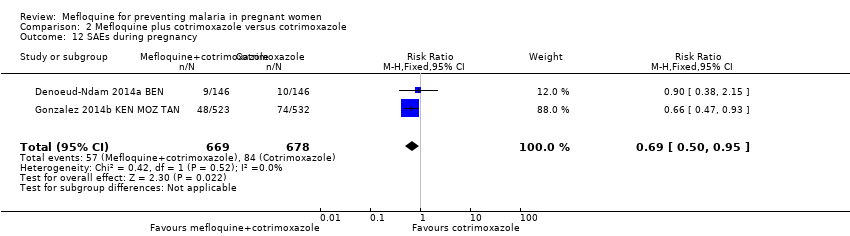 Comparison 2 Mefloquine plus cotrimoxazole versus cotrimoxazole, Outcome 12 SAEs during pregnancy. | ||||
| 13 Spontaneous abortions and stillbirths Show forest plot | 2 | 1347 | Risk Ratio (M‐H, Random, 95% CI) | 1.12 [0.42, 2.98] |
| Analysis 2.13  Comparison 2 Mefloquine plus cotrimoxazole versus cotrimoxazole, Outcome 13 Spontaneous abortions and stillbirths. | ||||
| 14 Congenital malformations Show forest plot | 2 | 1312 | Risk Ratio (M‐H, Fixed, 95% CI) | 0.61 [0.22, 1.67] |
| Analysis 2.14  Comparison 2 Mefloquine plus cotrimoxazole versus cotrimoxazole, Outcome 14 Congenital malformations. | ||||
| 15 Maternal mortality Show forest plot | 2 | 1347 | Risk Ratio (M‐H, Fixed, 95% CI) | 0.51 [0.13, 2.01] |
| Analysis 2.15  Comparison 2 Mefloquine plus cotrimoxazole versus cotrimoxazole, Outcome 15 Maternal mortality. | ||||
| 16 Neonatal mortality Show forest plot | 2 | 1239 | Risk Ratio (M‐H, Fixed, 95% CI) | 1.32 [0.65, 2.69] |
| Analysis 2.16  Comparison 2 Mefloquine plus cotrimoxazole versus cotrimoxazole, Outcome 16 Neonatal mortality. | ||||
| 17 Mother‐to‐child transmission HIV Show forest plot | 2 | 1019 | Risk Ratio (M‐H, Fixed, 95% CI) | 1.92 [1.13, 3.25] |
| Analysis 2.17  Comparison 2 Mefloquine plus cotrimoxazole versus cotrimoxazole, Outcome 17 Mother‐to‐child transmission HIV. | ||||
| 18 AEs: vomiting Show forest plot | 2 | 1347 | Risk Ratio (M‐H, Random, 95% CI) | 20.88 [1.40, 311.66] |
| Analysis 2.18  Comparison 2 Mefloquine plus cotrimoxazole versus cotrimoxazole, Outcome 18 AEs: vomiting. | ||||
| 19 AEs: fatigue/weakness Show forest plot | 2 | 1347 | Risk Ratio (M‐H, Random, 95% CI) | 2.95 [0.26, 32.93] |
| Analysis 2.19  Comparison 2 Mefloquine plus cotrimoxazole versus cotrimoxazole, Outcome 19 AEs: fatigue/weakness. | ||||
| 20 AEs: dizziness Show forest plot | 2 | 1347 | Risk Ratio (M‐H, Random, 95% CI) | 16.34 [0.39, 684.99] |
| Analysis 2.20 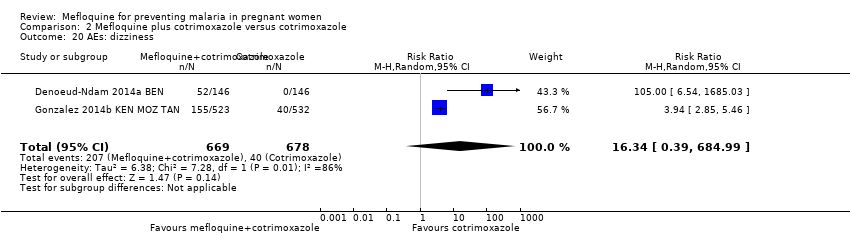 Comparison 2 Mefloquine plus cotrimoxazole versus cotrimoxazole, Outcome 20 AEs: dizziness. | ||||
| 21 AEs: headache Show forest plot | 2 | 1347 | Risk Ratio (M‐H, Random, 95% CI) | 0.76 [0.28, 2.10] |
| Analysis 2.21 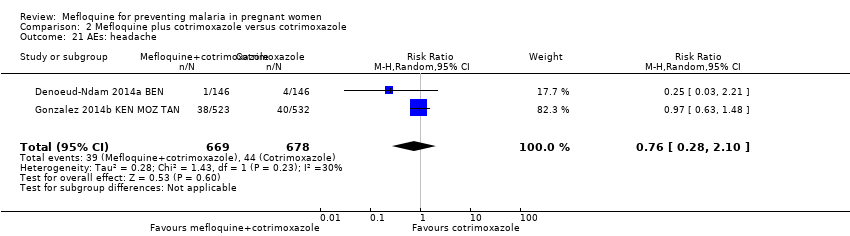 Comparison 2 Mefloquine plus cotrimoxazole versus cotrimoxazole, Outcome 21 AEs: headache. | ||||
| Outcome or subgroup title | No. of studies | No. of participants | Statistical method | Effect size |
| 1 Maternal peripheral parasitaemia at delivery (PCR) Show forest plot | 1 | 98 | Risk Ratio (M‐H, Fixed, 95% CI) | 0.21 [0.03, 1.72] |
| Analysis 3.1  Comparison 3 Mefloquine versus cotrimoxazole, Outcome 1 Maternal peripheral parasitaemia at delivery (PCR). | ||||
| 2 Placental malaria (PCR) Show forest plot | 1 | 94 | Risk Ratio (M‐H, Fixed, 95% CI) | 0.73 [0.13, 4.15] |
| Analysis 3.2 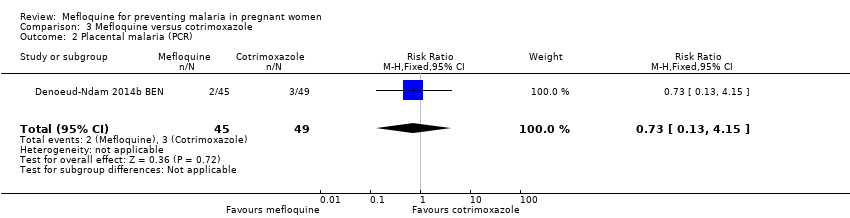 Comparison 3 Mefloquine versus cotrimoxazole, Outcome 2 Placental malaria (PCR). | ||||
| 3 Placental malaria (blood smear) Show forest plot | 1 | 108 | Risk Ratio (M‐H, Fixed, 95% CI) | 0.35 [0.01, 8.30] |
| Analysis 3.3  Comparison 3 Mefloquine versus cotrimoxazole, Outcome 3 Placental malaria (blood smear). | ||||
| 4 Mean haemoglobin at delivery Show forest plot | 1 | 100 | Mean Difference (IV, Fixed, 95% CI) | ‐0.10 [‐0.67, 0.47] |
| Analysis 3.4  Comparison 3 Mefloquine versus cotrimoxazole, Outcome 4 Mean haemoglobin at delivery. | ||||
| 5 Maternal anaemia at delivery (< 9.5 g/dL) Show forest plot | 1 | 100 | Risk Ratio (M‐H, Fixed, 95% CI) | 0.90 [0.26, 3.16] |
| Analysis 3.5  Comparison 3 Mefloquine versus cotrimoxazole, Outcome 5 Maternal anaemia at delivery (< 9.5 g/dL). | ||||
| 6 Mean birth weight Show forest plot | 1 | 120 | Mean Difference (IV, Fixed, 95% CI) | ‐102.0 [‐255.52, 51.52] |
| Analysis 3.6  Comparison 3 Mefloquine versus cotrimoxazole, Outcome 6 Mean birth weight. | ||||
| 7 Low birth weight Show forest plot | 1 | 120 | Risk Ratio (M‐H, Fixed, 95% CI) | 1.52 [0.56, 4.13] |
| Analysis 3.7  Comparison 3 Mefloquine versus cotrimoxazole, Outcome 7 Low birth weight. | ||||
| 8 Prematurity Show forest plot | 1 | 125 | Risk Ratio (M‐H, Fixed, 95% CI) | 1.08 [0.33, 3.56] |
| Analysis 3.8  Comparison 3 Mefloquine versus cotrimoxazole, Outcome 8 Prematurity. | ||||
| 9 SAEs during pregnancy Show forest plot | 1 | 140 | Risk Ratio (M‐H, Fixed, 95% CI) | 1.06 [0.28, 4.07] |
| Analysis 3.9  Comparison 3 Mefloquine versus cotrimoxazole, Outcome 9 SAEs during pregnancy. | ||||
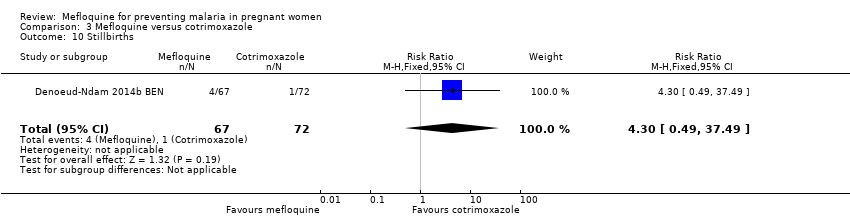
| 10 Stillbirths Show forest plot | 1 | 139 | Risk Ratio (M‐H, Fixed, 95% CI) | 4.30 [0.49, 37.49] |
| Analysis 3.10  Comparison 3 Mefloquine versus cotrimoxazole, Outcome 10 Stillbirths. | ||||
| 11 Spontaneous abortions Show forest plot | 1 | 139 | Risk Ratio (M‐H, Fixed, 95% CI) | 1.07 [0.07, 16.84] |
| Analysis 3.11 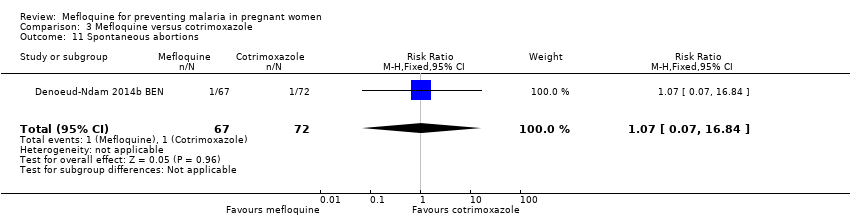 Comparison 3 Mefloquine versus cotrimoxazole, Outcome 11 Spontaneous abortions. | ||||
| 12 Congenital malformations Show forest plot | 1 | 139 | Risk Ratio (M‐H, Fixed, 95% CI) | 1.07 [0.16, 7.41] |
| Analysis 3.12 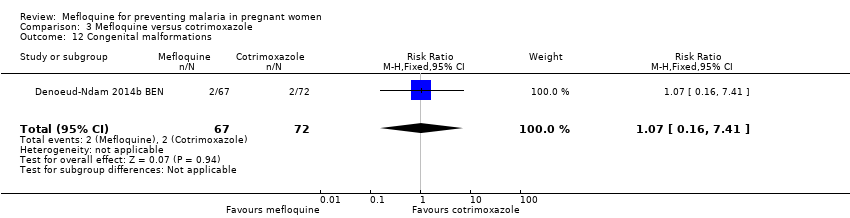 Comparison 3 Mefloquine versus cotrimoxazole, Outcome 12 Congenital malformations. | ||||
| 13 Maternal mortality Show forest plot | 1 | 139 | Risk Ratio (M‐H, Fixed, 95% CI) | 0.0 [0.0, 0.0] |
| Analysis 3.13 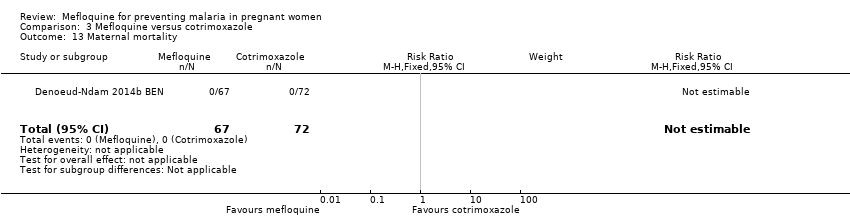 Comparison 3 Mefloquine versus cotrimoxazole, Outcome 13 Maternal mortality. | ||||
| 14 Neonatal mortality Show forest plot | 1 | 129 | Risk Ratio (M‐H, Fixed, 95% CI) | 1.05 [0.07, 16.39] |
| Analysis 3.14  Comparison 3 Mefloquine versus cotrimoxazole, Outcome 14 Neonatal mortality. | ||||
| 15 Infant deaths after 7 days Show forest plot | 1 | 129 | Risk Ratio (M‐H, Fixed, 95% CI) | 2.10 [0.19, 22.54] |
| Analysis 3.15  Comparison 3 Mefloquine versus cotrimoxazole, Outcome 15 Infant deaths after 7 days. | ||||
| 16 AEs: vomiting Show forest plot | 1 | 139 | Risk Ratio (M‐H, Fixed, 95% CI) | 13.43 [3.31, 54.54] |
| Analysis 3.16  Comparison 3 Mefloquine versus cotrimoxazole, Outcome 16 AEs: vomiting. | ||||
| 17 AEs: fatigue/weakness Show forest plot | 1 | 139 | Risk Ratio (M‐H, Fixed, 95% CI) | 6.99 [1.64, 29.81] |
| Analysis 3.17 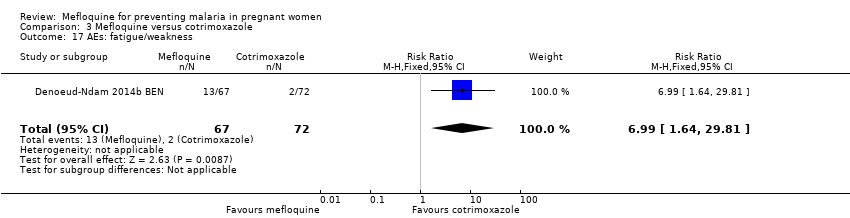 Comparison 3 Mefloquine versus cotrimoxazole, Outcome 17 AEs: fatigue/weakness. | ||||
| 18 AEs: dizziness Show forest plot | 1 | 139 | Risk Ratio (M‐H, Fixed, 95% CI) | 52.60 [3.26, 848.24] |
| Analysis 3.18  Comparison 3 Mefloquine versus cotrimoxazole, Outcome 18 AEs: dizziness. | ||||
| 19 AEs: headache Show forest plot | 1 | 139 | Risk Ratio (M‐H, Fixed, 95% CI) | 0.21 [0.01, 4.39] |
| Analysis 3.19 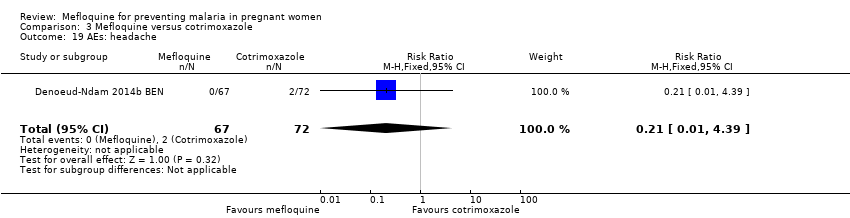 Comparison 3 Mefloquine versus cotrimoxazole, Outcome 19 AEs: headache. | ||||
| Outcome or subgroup title | No. of studies | No. of participants | Statistical method | Effect size |
| 1 Maternal peripheral parasitaemia during pregnancy Show forest plot | 1 | 339 | Risk Ratio (M‐H, Fixed, 95% CI) | 0.13 [0.05, 0.33] |
| Analysis 4.1  Comparison 4 Mefloquine versus placebo, Outcome 1 Maternal peripheral parasitaemia during pregnancy. | ||||
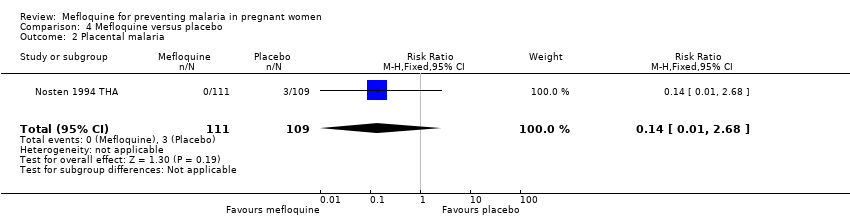
| 2 Placental malaria Show forest plot | 1 | 220 | Risk Ratio (M‐H, Fixed, 95% CI) | 0.14 [0.01, 2.68] |
| Analysis 4.2  Comparison 4 Mefloquine versus placebo, Outcome 2 Placental malaria. | ||||
| 3 Mean birth weight Show forest plot | 1 | 290 | Mean Difference (IV, Fixed, 95% CI) | ‐80.0 [‐184.65, 24.65] |
| Analysis 4.3 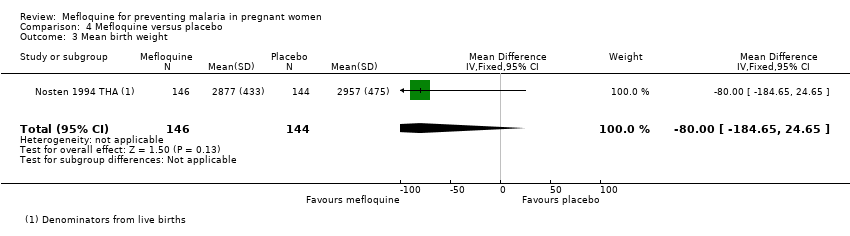 Comparison 4 Mefloquine versus placebo, Outcome 3 Mean birth weight. | ||||
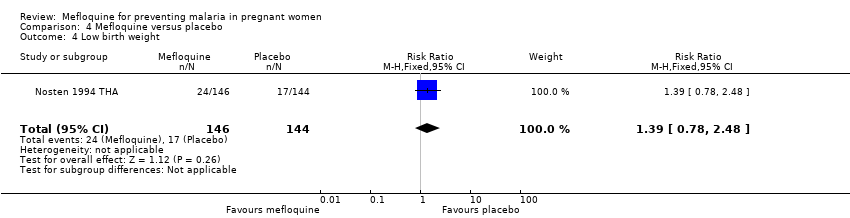
| 4 Low birth weight Show forest plot | 1 | 290 | Risk Ratio (M‐H, Fixed, 95% CI) | 1.39 [0.78, 2.48] |
| Analysis 4.4  Comparison 4 Mefloquine versus placebo, Outcome 4 Low birth weight. | ||||
| 5 Prematurity Show forest plot | 1 | 199 | Risk Ratio (M‐H, Fixed, 95% CI) | 0.48 [0.15, 1.53] |
| Analysis 4.5  Comparison 4 Mefloquine versus placebo, Outcome 5 Prematurity. | ||||
| 6 Stillbirths Show forest plot | 1 | 311 | Risk Ratio (M‐H, Fixed, 95% CI) | 2.63 [0.86, 8.08] |
| Analysis 4.6 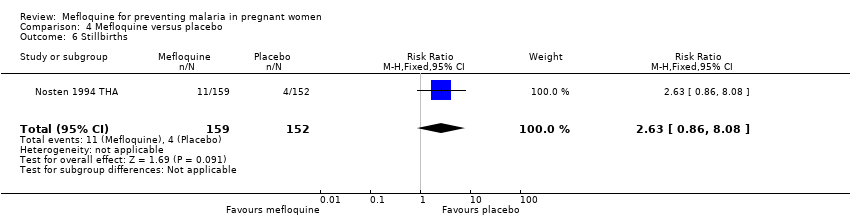 Comparison 4 Mefloquine versus placebo, Outcome 6 Stillbirths. | ||||
| 7 Spontaneous abortions Show forest plot | 1 | 311 | Risk Ratio (M‐H, Fixed, 95% CI) | 0.48 [0.04, 5.22] |
| Analysis 4.7 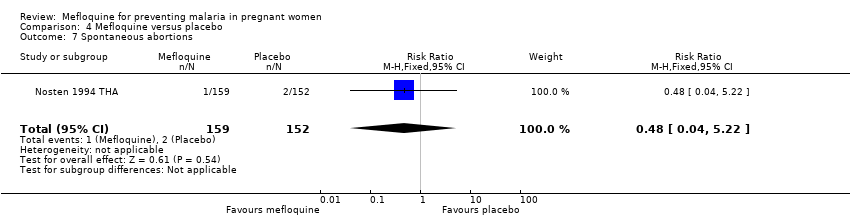 Comparison 4 Mefloquine versus placebo, Outcome 7 Spontaneous abortions. | ||||
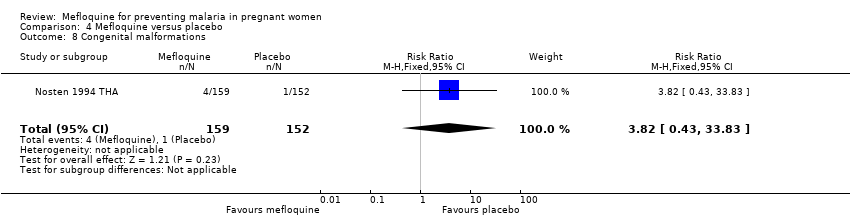
| 8 Congenital malformations Show forest plot | 1 | 311 | Risk Ratio (M‐H, Fixed, 95% CI) | 3.82 [0.43, 33.83] |
| Analysis 4.8  Comparison 4 Mefloquine versus placebo, Outcome 8 Congenital malformations. | ||||
| 9 Maternal mortality Show forest plot | 1 | 339 | Risk Ratio (M‐H, Fixed, 95% CI) | 2.95 [0.12, 71.85] |
| Analysis 4.9  Comparison 4 Mefloquine versus placebo, Outcome 9 Maternal mortality. | ||||
| 10 Infant mortality Show forest plot | 1 | 288 | Risk Ratio (M‐H, Fixed, 95% CI) | 1.04 [0.63, 1.74] |
| Analysis 4.10 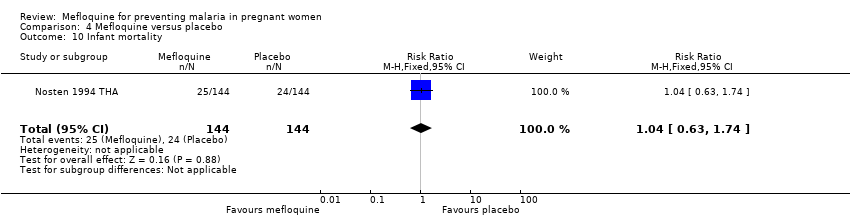 Comparison 4 Mefloquine versus placebo, Outcome 10 Infant mortality. | ||||

Indicators and impact of malaria infection in mothers and infants.
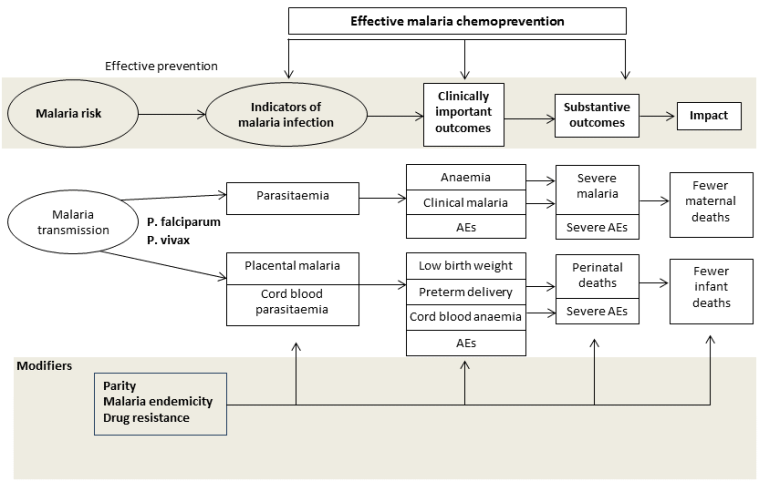
Conceptual framework of malaria chemoprevention. Reproduced under the terms of a Creative Commons Licence from Radeva‐Petrova 2014.

Study flow diagram.

‘Risk of bias' summary: review authors' judgements about each risk of bias item for each included study.

‘Risk of bias' graph: review authors' judgements about each risk of bias item presented as percentages across all included studies.

Comparison 1 Mefloquine versus sulfadoxine‐pyrimethamine, Outcome 1 Clinical malaria episodes during pregnancy.

Comparison 1 Mefloquine versus sulfadoxine‐pyrimethamine, Outcome 2 Maternal peripheral parasitaemia at delivery.

Comparison 1 Mefloquine versus sulfadoxine‐pyrimethamine, Outcome 3 Placental malaria.
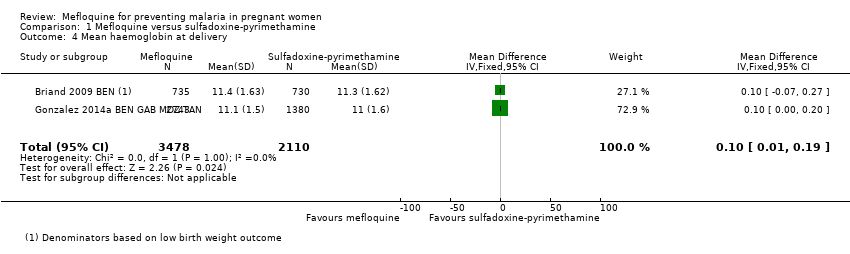
Comparison 1 Mefloquine versus sulfadoxine‐pyrimethamine, Outcome 4 Mean haemoglobin at delivery.

Comparison 1 Mefloquine versus sulfadoxine‐pyrimethamine, Outcome 5 Maternal anaemia at delivery.

Comparison 1 Mefloquine versus sulfadoxine‐pyrimethamine, Outcome 6 Severe maternal anaemia at delivery.

Comparison 1 Mefloquine versus sulfadoxine‐pyrimethamine, Outcome 7 Cord blood parasitaemia.

Comparison 1 Mefloquine versus sulfadoxine‐pyrimethamine, Outcome 8 Cord blood anaemia.

Comparison 1 Mefloquine versus sulfadoxine‐pyrimethamine, Outcome 9 Mean birth weight.

Comparison 1 Mefloquine versus sulfadoxine‐pyrimethamine, Outcome 10 Low birth weight.

Comparison 1 Mefloquine versus sulfadoxine‐pyrimethamine, Outcome 11 Low birth weight by gravidity.

Comparison 1 Mefloquine versus sulfadoxine‐pyrimethamine, Outcome 12 Prematurity.

Comparison 1 Mefloquine versus sulfadoxine‐pyrimethamine, Outcome 13 Malaria in first year of life.

Comparison 1 Mefloquine versus sulfadoxine‐pyrimethamine, Outcome 14 Hospital admissions in first year of life.

Comparison 1 Mefloquine versus sulfadoxine‐pyrimethamine, Outcome 15 SAEs during pregnancy.

Comparison 1 Mefloquine versus sulfadoxine‐pyrimethamine, Outcome 16 Stillbirths and abortions.

Comparison 1 Mefloquine versus sulfadoxine‐pyrimethamine, Outcome 17 Congenital malformations.

Comparison 1 Mefloquine versus sulfadoxine‐pyrimethamine, Outcome 18 Maternal mortality.

Comparison 1 Mefloquine versus sulfadoxine‐pyrimethamine, Outcome 19 Neonatal mortality.

Comparison 1 Mefloquine versus sulfadoxine‐pyrimethamine, Outcome 20 Infant mortality.
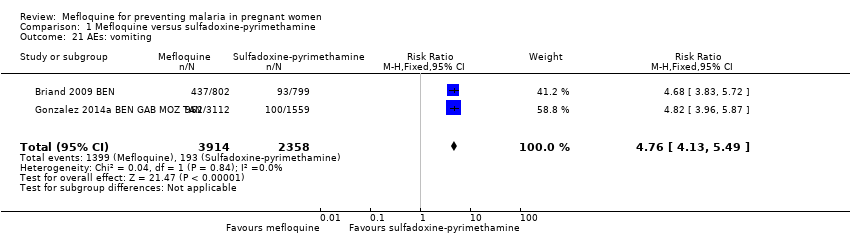
Comparison 1 Mefloquine versus sulfadoxine‐pyrimethamine, Outcome 21 AEs: vomiting.
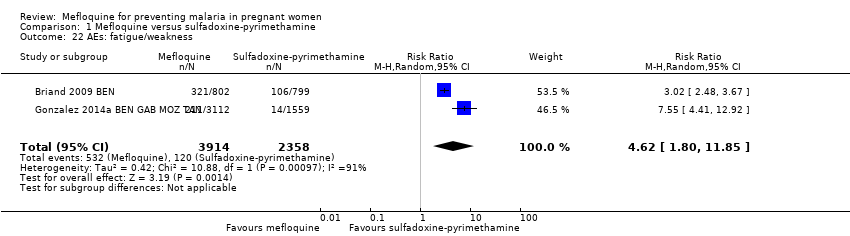
Comparison 1 Mefloquine versus sulfadoxine‐pyrimethamine, Outcome 22 AEs: fatigue/weakness.
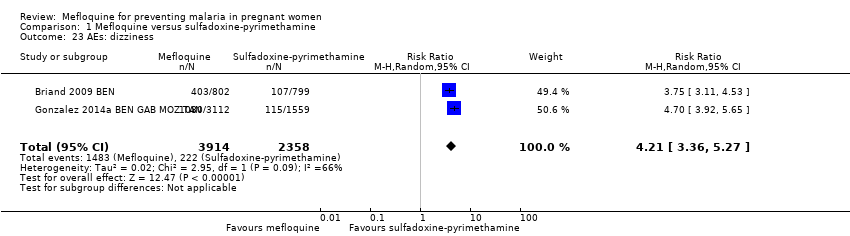
Comparison 1 Mefloquine versus sulfadoxine‐pyrimethamine, Outcome 23 AEs: dizziness.

Comparison 1 Mefloquine versus sulfadoxine‐pyrimethamine, Outcome 24 AEs: headache.

Comparison 2 Mefloquine plus cotrimoxazole versus cotrimoxazole, Outcome 1 Clinical malaria episodes during pregnancy.

Comparison 2 Mefloquine plus cotrimoxazole versus cotrimoxazole, Outcome 2 Maternal peripheral parasitaemia at delivery (PCR).

Comparison 2 Mefloquine plus cotrimoxazole versus cotrimoxazole, Outcome 3 Placental malaria (blood smear).

Comparison 2 Mefloquine plus cotrimoxazole versus cotrimoxazole, Outcome 4 Placental malaria (PCR).

Comparison 2 Mefloquine plus cotrimoxazole versus cotrimoxazole, Outcome 5 Mean haemoglobin at delivery.

Comparison 2 Mefloquine plus cotrimoxazole versus cotrimoxazole, Outcome 6 Maternal anaemia at delivery (< 9.5 g/dL).

Comparison 2 Mefloquine plus cotrimoxazole versus cotrimoxazole, Outcome 7 Maternal severe anaemia at delivery.

Comparison 2 Mefloquine plus cotrimoxazole versus cotrimoxazole, Outcome 8 Cord blood parasitaemia.

Comparison 2 Mefloquine plus cotrimoxazole versus cotrimoxazole, Outcome 9 Mean birth weight.

Comparison 2 Mefloquine plus cotrimoxazole versus cotrimoxazole, Outcome 10 Low birth weight.

Comparison 2 Mefloquine plus cotrimoxazole versus cotrimoxazole, Outcome 11 Prematurity.

Comparison 2 Mefloquine plus cotrimoxazole versus cotrimoxazole, Outcome 12 SAEs during pregnancy.
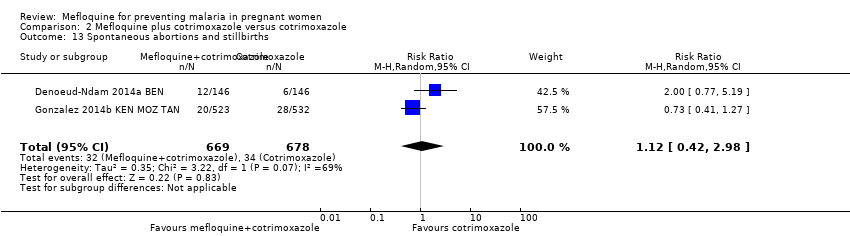
Comparison 2 Mefloquine plus cotrimoxazole versus cotrimoxazole, Outcome 13 Spontaneous abortions and stillbirths.
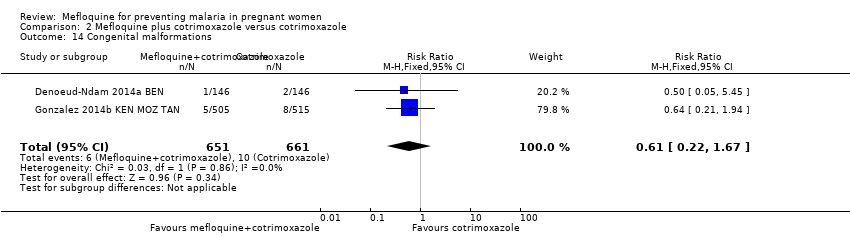
Comparison 2 Mefloquine plus cotrimoxazole versus cotrimoxazole, Outcome 14 Congenital malformations.

Comparison 2 Mefloquine plus cotrimoxazole versus cotrimoxazole, Outcome 15 Maternal mortality.
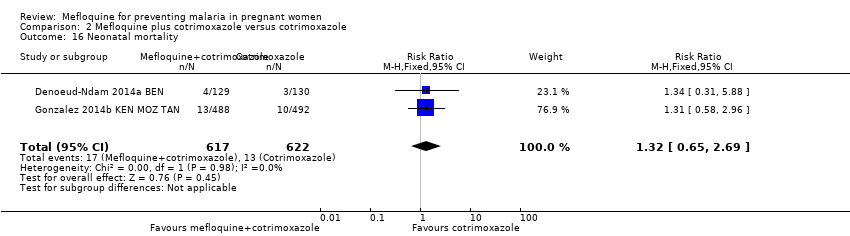
Comparison 2 Mefloquine plus cotrimoxazole versus cotrimoxazole, Outcome 16 Neonatal mortality.
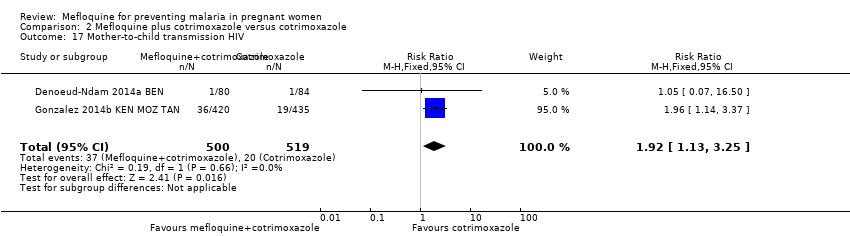
Comparison 2 Mefloquine plus cotrimoxazole versus cotrimoxazole, Outcome 17 Mother‐to‐child transmission HIV.
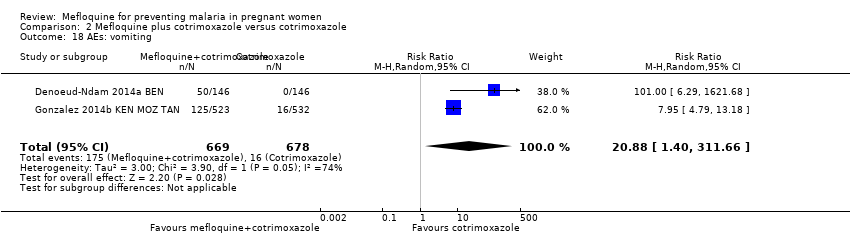
Comparison 2 Mefloquine plus cotrimoxazole versus cotrimoxazole, Outcome 18 AEs: vomiting.

Comparison 2 Mefloquine plus cotrimoxazole versus cotrimoxazole, Outcome 19 AEs: fatigue/weakness.

Comparison 2 Mefloquine plus cotrimoxazole versus cotrimoxazole, Outcome 20 AEs: dizziness.

Comparison 2 Mefloquine plus cotrimoxazole versus cotrimoxazole, Outcome 21 AEs: headache.

Comparison 3 Mefloquine versus cotrimoxazole, Outcome 1 Maternal peripheral parasitaemia at delivery (PCR).

Comparison 3 Mefloquine versus cotrimoxazole, Outcome 2 Placental malaria (PCR).

Comparison 3 Mefloquine versus cotrimoxazole, Outcome 3 Placental malaria (blood smear).
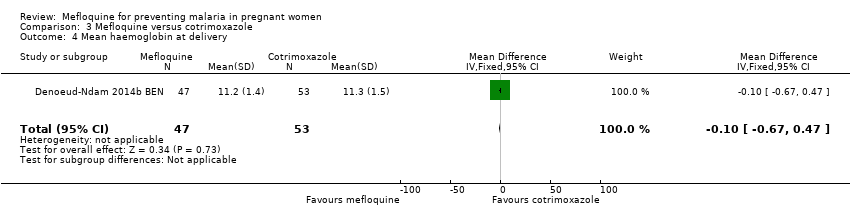
Comparison 3 Mefloquine versus cotrimoxazole, Outcome 4 Mean haemoglobin at delivery.
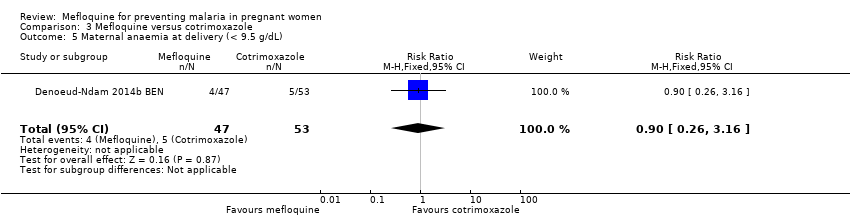
Comparison 3 Mefloquine versus cotrimoxazole, Outcome 5 Maternal anaemia at delivery (< 9.5 g/dL).
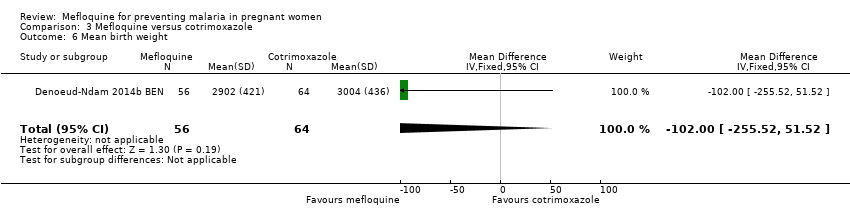
Comparison 3 Mefloquine versus cotrimoxazole, Outcome 6 Mean birth weight.
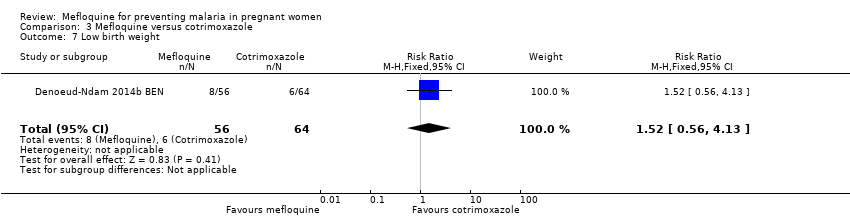
Comparison 3 Mefloquine versus cotrimoxazole, Outcome 7 Low birth weight.
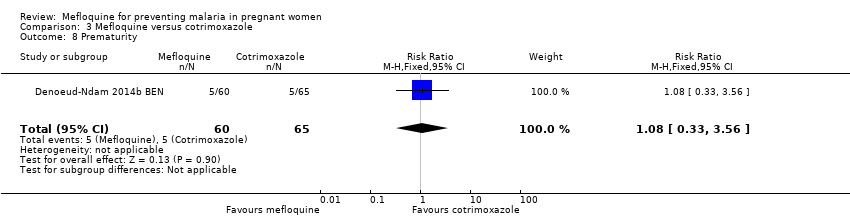
Comparison 3 Mefloquine versus cotrimoxazole, Outcome 8 Prematurity.

Comparison 3 Mefloquine versus cotrimoxazole, Outcome 9 SAEs during pregnancy.
Comparison 3 Mefloquine versus cotrimoxazole, Outcome 10 Stillbirths.

Comparison 3 Mefloquine versus cotrimoxazole, Outcome 11 Spontaneous abortions.

Comparison 3 Mefloquine versus cotrimoxazole, Outcome 12 Congenital malformations.

Comparison 3 Mefloquine versus cotrimoxazole, Outcome 13 Maternal mortality.

Comparison 3 Mefloquine versus cotrimoxazole, Outcome 14 Neonatal mortality.

Comparison 3 Mefloquine versus cotrimoxazole, Outcome 15 Infant deaths after 7 days.

Comparison 3 Mefloquine versus cotrimoxazole, Outcome 16 AEs: vomiting.

Comparison 3 Mefloquine versus cotrimoxazole, Outcome 17 AEs: fatigue/weakness.

Comparison 3 Mefloquine versus cotrimoxazole, Outcome 18 AEs: dizziness.

Comparison 3 Mefloquine versus cotrimoxazole, Outcome 19 AEs: headache.

Comparison 4 Mefloquine versus placebo, Outcome 1 Maternal peripheral parasitaemia during pregnancy.
Comparison 4 Mefloquine versus placebo, Outcome 2 Placental malaria.

Comparison 4 Mefloquine versus placebo, Outcome 3 Mean birth weight.
Comparison 4 Mefloquine versus placebo, Outcome 4 Low birth weight.

Comparison 4 Mefloquine versus placebo, Outcome 5 Prematurity.

Comparison 4 Mefloquine versus placebo, Outcome 6 Stillbirths.

Comparison 4 Mefloquine versus placebo, Outcome 7 Spontaneous abortions.
Comparison 4 Mefloquine versus placebo, Outcome 8 Congenital malformations.
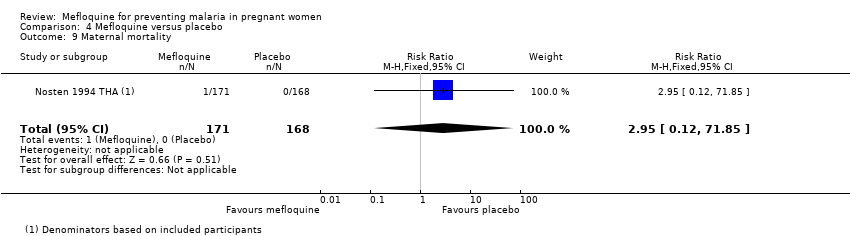
Comparison 4 Mefloquine versus placebo, Outcome 9 Maternal mortality.

Comparison 4 Mefloquine versus placebo, Outcome 10 Infant mortality.
| Mefloquine compared with sulfadoxine‐pyrimethamine for preventing malaria in pregnant women | ||||||
| Patient or population: HIV‐uninfected pregnant women | ||||||
| Outcomes | Anticipated absolute effects* (95% CI) | Relative effect | Number of participants | Certainty of the evidence | Comments (compared with sulfadoxine‐pyrimethamine) | |
| Risk with sulfadoxine‐pyrimethamine | Risk with mefloquine | |||||
| Clinical malaria episodes during pregnancy | ‐ | ‐ | IRR 0.83 | ‐ | ⊕⊕⊕⊝ | Mefloquine results in little or no difference in the incidence of clinical malaria episodes during pregnancy |
| Maternal peripheral parasitaemia at delivery | 43 per 1000 | 28 per 1000 (20 to 37) | RR 0.65 (0.48 to | 5455 (2 RCTs) | ⊕⊕⊕⊝ | Mefloquine results in lower maternal peripheral parasitaemia at delivery |
| Placental malaria | 52 per 1000 | 54 per 1000 | RR 1.04 | 4668 | ⊕⊕⊝⊝ Due to imprecision and heterogeneity | Mefloquine may result in little or no difference in placental parasitaemia |
| Maternal anaemia at delivery | 219 per 1000 | 184 per 1000 | RR 0.84 | 5469 | ⊕⊕⊕⊝ Due to imprecision | Mefloquine probably results in fewer women anaemic at delivery |
| Low birth weight | 117 per 1000 | 111 per 1000 | RR 0.95 | 5641 | ⊕⊕⊕⊝ | Mefloquine results in little or no difference in low birth weight |
| Stillbirths and abortions | 31 per 1000 | 37 per 1000 | RR 1.20 | 6219 | ⊕⊕⊕⊝ | Mefloquine results in little or no difference in stillbirths or abortions |
| AEs: vomiting | 82 per 1000 | 390 per 1000 | RR 4.76 | 6272 | ⊕⊕⊕⊕ | Mefloquine results in a four‐fold increase in vomiting |
| AEs: dizziness | 94 per 1000 | 396 per 1000 | RR 4.21 | 6272 | ⊕⊕⊕⊝ | Mefloquine results in a four‐fold increase in dizziness |
| *The risk in the intervention group (and its 95% CI) is based on the assumed risk in the comparison group and the relative effect of the intervention (and its 95% CI). | ||||||
| GRADE Working Group grades of evidence. | ||||||
| aAlthough one trial has serious risk of bias, the other is of high certainty and exclusion of the smaller trial has little effect on the estimate of effect. | ||||||
| Mefloquine plus cotrimoxazole compared with cotrimoxazole for preventing malaria in pregnant women | ||||||
| Patient or population: HIV‐infected pregnant women | ||||||
| Outcomes | Anticipated absolute effects* (95% CI) | Relative effect | Number of participants | Certainty of the evidence | Comments (compared with cotrimoxazole) | |
| Risk with cotrimoxazole | Risk with mefloquine plus cotrimoxazole | |||||
| Clinical malaria episodes during pregnancy | ‐ | ‐ | IRR 0.76 (0.33 to 1.76) | ‐ (1 RCT) | ⊕⊕⊕⊕ | Mefloquine results in little or no difference in the incidence of clinical malaria episodes during pregnancy |
| Maternal peripheral parasitaemia at delivery (PCR) | 66 per 1000 | 34 per 1000 (20 to 62) | RR 0.52 (0.30 to 0.93) | 989 (2 RCTs) | ⊕⊕⊕⊝ | Mefloquine probably results in lower maternal peripheral parasitaemia at delivery |
| Placental malaria (PCR) | 68 per 1000 | 19 per 1000 | RR 0.28 | 977 | ⊕⊕⊕⊕ | Mefloquine plus cotrimoxazole results in fewer women with placental malaria at delivery |
| Maternal anaemia at delivery | 178 per 1000 | 168 per 1000 | RR 0.94 | 1197 | ⊕⊕⊕⊝ | Mefloquine plus cotrimoxazole probably results in little or no difference in maternal anaemia cases at delivery |
| Low birth weight | 118 per 1000 | 141 per 1000 | RR 1.20 | 1220 | ⊕⊕⊕⊝ | Mefloquine plus cotrimoxazole probably results in little or no difference in low birth weight |
| Spontaneous abortions and stillbirths | 50 per 1000 | 56 per 1000 | RR 1.12 | 1347 | ⊕⊝⊝⊝ | Mefloquine plus cotrimoxazole may result in little or no difference in spontaneous abortions and stillbirths |
| AEs: vomiting | 30 per 1000 | 239 per 1000 (144 to 396) | RR 7.95 (4.79 to 13.18) | 1055 (1 RCT)d | ⊕⊕⊕⊕ | Mefloquine plus cotrimoxazole results in an eight‐fold increase in vomiting |
| AEs: dizziness | 75 per 1000 | 296 per 1000 (214 to 411) | RR 3.94 (2.85 to 5.46) | 1055 (1 RCT)e | ⊕⊕⊕⊕ | Mefloquine plus cotrimoxazole results in a four‐fold increase in dizziness |
| *The risk in the intervention group (and its 95% CI) is based on the assumed risk in the comparison group and the relative effect of the intervention (and its 95% CI). | ||||||
| GRADE Working Group grades of evidence. | ||||||
| aAlthough one trial has serious risk of bias, the other is of high certainty and exclusion of the smaller trial has little effect on the estimate of effect. | ||||||
| Outcome or subgroup title | No. of studies | No. of participants | Statistical method | Effect size |
| 1 Clinical malaria episodes during pregnancy Show forest plot | 2 | Rate Ratio (Fixed, 95% CI) | 0.83 [0.65, 1.05] | |
| 2 Maternal peripheral parasitaemia at delivery Show forest plot | 2 | 5455 | Risk Ratio (M‐H, Fixed, 95% CI) | 0.65 [0.48, 0.86] |
| 3 Placental malaria Show forest plot | 2 | 4668 | Risk Ratio (M‐H, Random, 95% CI) | 1.04 [0.58, 1.86] |
| 4 Mean haemoglobin at delivery Show forest plot | 2 | 5588 | Mean Difference (IV, Fixed, 95% CI) | 0.10 [0.01, 0.19] |
| 5 Maternal anaemia at delivery Show forest plot | 2 | 5469 | Risk Ratio (M‐H, Fixed, 95% CI) | 0.84 [0.76, 0.94] |
| 6 Severe maternal anaemia at delivery Show forest plot | 2 | 5469 | Risk Ratio (M‐H, Random, 95% CI) | 0.93 [0.58, 1.48] |
| 7 Cord blood parasitaemia Show forest plot | 2 | 5309 | Risk Ratio (M‐H, Random, 95% CI) | 0.44 [0.13, 1.46] |
| 8 Cord blood anaemia Show forest plot | 1 | 4006 | Risk Ratio (M‐H, Fixed, 95% CI) | 1.04 [0.87, 1.23] |
| 9 Mean birth weight Show forest plot | 2 | 5241 | Mean Difference (IV, Fixed, 95% CI) | 2.52 [‐25.66, 30.69] |
| 10 Low birth weight Show forest plot | 2 | 5641 | Risk Ratio (M‐H, Random, 95% CI) | 0.95 [0.78, 1.17] |
| 11 Low birth weight by gravidity Show forest plot | 2 | 5641 | Risk Ratio (M‐H, Fixed, 95% CI) | 0.97 [0.84, 1.13] |
| 11.1 Primigravidae | 2 | 1576 | Risk Ratio (M‐H, Fixed, 95% CI) | 1.02 [0.80, 1.30] |
| 11.2 Multigravidae | 2 | 4065 | Risk Ratio (M‐H, Fixed, 95% CI) | 0.94 [0.78, 1.14] |
| 12 Prematurity Show forest plot | 2 | 4640 | Risk Ratio (M‐H, Fixed, 95% CI) | 1.03 [0.76, 1.40] |
| 13 Malaria in first year of life Show forest plot | 1 | Rate Ratio (Fixed, 95% CI) | 0.97 [0.82, 1.15] | |
| 14 Hospital admissions in first year of life Show forest plot | 1 | Rate Ratio (Fixed, 95% CI) | 0.93 [0.75, 1.17] | |
| 15 SAEs during pregnancy Show forest plot | 1 | 4674 | Risk Ratio (M‐H, Fixed, 95% CI) | 0.98 [0.81, 1.20] |
| 16 Stillbirths and abortions Show forest plot | 2 | 6219 | Risk Ratio (M‐H, Fixed, 95% CI) | 1.20 [0.91, 1.58] |
| 17 Congenital malformations Show forest plot | 2 | 5931 | Risk Ratio (M‐H, Random, 95% CI) | 1.10 [0.51, 2.37] |
| 18 Maternal mortality Show forest plot | 2 | 6219 | Risk Ratio (M‐H, Random, 95% CI) | 2.41 [0.27, 21.23] |
| 19 Neonatal mortality Show forest plot | 2 | 6134 | Risk Ratio (M‐H, Fixed, 95% CI) | 0.98 [0.67, 1.43] |
| 20 Infant mortality Show forest plot | 1 | Rate Ratio (Fixed, 95% CI) | 1.00 [0.66, 1.52] | |
| 21 AEs: vomiting Show forest plot | 2 | 6272 | Risk Ratio (M‐H, Fixed, 95% CI) | 4.76 [4.13, 5.49] |
| 22 AEs: fatigue/weakness Show forest plot | 2 | 6272 | Risk Ratio (M‐H, Random, 95% CI) | 4.62 [1.80, 11.85] |
| 23 AEs: dizziness Show forest plot | 2 | 6272 | Risk Ratio (M‐H, Random, 95% CI) | 4.21 [3.36, 5.27] |
| 24 AEs: headache Show forest plot | 2 | 6272 | Risk Ratio (M‐H, Random, 95% CI) | 0.70 [0.25, 1.94] |
| Outcome or subgroup title | No. of studies | No. of participants | Statistical method | Effect size |
| 1 Clinical malaria episodes during pregnancy Show forest plot | 1 | Rate Ratio (Fixed, 95% CI) | 0.76 [0.33, 1.76] | |
| 2 Maternal peripheral parasitaemia at delivery (PCR) Show forest plot | 2 | 989 | Risk Ratio (M‐H, Fixed, 95% CI) | 0.52 [0.30, 0.93] |
| 3 Placental malaria (blood smear) Show forest plot | 2 | 1144 | Risk Ratio (M‐H, Fixed, 95% CI) | 0.51 [0.29, 0.89] |
| 4 Placental malaria (PCR) Show forest plot | 2 | 977 | Risk Ratio (M‐H, Fixed, 95% CI) | 0.28 [0.14, 0.57] |
| 5 Mean haemoglobin at delivery Show forest plot | 2 | 1167 | Mean Difference (IV, Random, 95% CI) | 0.07 [‐0.32, 0.46] |
| 6 Maternal anaemia at delivery (< 9.5 g/dL) Show forest plot | 2 | 1197 | Risk Ratio (M‐H, Fixed, 95% CI) | 0.94 [0.73, 1.20] |
| 7 Maternal severe anaemia at delivery Show forest plot | 2 | 1167 | Risk Ratio (M‐H, Fixed, 95% CI) | 0.93 [0.41, 2.08] |
| 8 Cord blood parasitaemia Show forest plot | 2 | 1166 | Risk Ratio (M‐H, Fixed, 95% CI) | 0.33 [0.03, 3.13] |
| 9 Mean birth weight Show forest plot | 2 | 1220 | Mean Difference (IV, Random, 95% CI) | ‐25.75 [‐86.99, 35.49] |
| 10 Low birth weight Show forest plot | 2 | 1220 | Risk Ratio (M‐H, Fixed, 95% CI) | 1.20 [0.89, 1.60] |
| 11 Prematurity Show forest plot | 2 | 824 | Risk Ratio (M‐H, Random, 95% CI) | 1.07 [0.58, 1.96] |
| 12 SAEs during pregnancy Show forest plot | 2 | 1347 | Risk Ratio (M‐H, Fixed, 95% CI) | 0.69 [0.50, 0.95] |
| 13 Spontaneous abortions and stillbirths Show forest plot | 2 | 1347 | Risk Ratio (M‐H, Random, 95% CI) | 1.12 [0.42, 2.98] |
| 14 Congenital malformations Show forest plot | 2 | 1312 | Risk Ratio (M‐H, Fixed, 95% CI) | 0.61 [0.22, 1.67] |
| 15 Maternal mortality Show forest plot | 2 | 1347 | Risk Ratio (M‐H, Fixed, 95% CI) | 0.51 [0.13, 2.01] |
| 16 Neonatal mortality Show forest plot | 2 | 1239 | Risk Ratio (M‐H, Fixed, 95% CI) | 1.32 [0.65, 2.69] |
| 17 Mother‐to‐child transmission HIV Show forest plot | 2 | 1019 | Risk Ratio (M‐H, Fixed, 95% CI) | 1.92 [1.13, 3.25] |
| 18 AEs: vomiting Show forest plot | 2 | 1347 | Risk Ratio (M‐H, Random, 95% CI) | 20.88 [1.40, 311.66] |
| 19 AEs: fatigue/weakness Show forest plot | 2 | 1347 | Risk Ratio (M‐H, Random, 95% CI) | 2.95 [0.26, 32.93] |
| 20 AEs: dizziness Show forest plot | 2 | 1347 | Risk Ratio (M‐H, Random, 95% CI) | 16.34 [0.39, 684.99] |
| 21 AEs: headache Show forest plot | 2 | 1347 | Risk Ratio (M‐H, Random, 95% CI) | 0.76 [0.28, 2.10] |
| Outcome or subgroup title | No. of studies | No. of participants | Statistical method | Effect size |
| 1 Maternal peripheral parasitaemia at delivery (PCR) Show forest plot | 1 | 98 | Risk Ratio (M‐H, Fixed, 95% CI) | 0.21 [0.03, 1.72] |
| 2 Placental malaria (PCR) Show forest plot | 1 | 94 | Risk Ratio (M‐H, Fixed, 95% CI) | 0.73 [0.13, 4.15] |
| 3 Placental malaria (blood smear) Show forest plot | 1 | 108 | Risk Ratio (M‐H, Fixed, 95% CI) | 0.35 [0.01, 8.30] |
| 4 Mean haemoglobin at delivery Show forest plot | 1 | 100 | Mean Difference (IV, Fixed, 95% CI) | ‐0.10 [‐0.67, 0.47] |
| 5 Maternal anaemia at delivery (< 9.5 g/dL) Show forest plot | 1 | 100 | Risk Ratio (M‐H, Fixed, 95% CI) | 0.90 [0.26, 3.16] |
| 6 Mean birth weight Show forest plot | 1 | 120 | Mean Difference (IV, Fixed, 95% CI) | ‐102.0 [‐255.52, 51.52] |
| 7 Low birth weight Show forest plot | 1 | 120 | Risk Ratio (M‐H, Fixed, 95% CI) | 1.52 [0.56, 4.13] |
| 8 Prematurity Show forest plot | 1 | 125 | Risk Ratio (M‐H, Fixed, 95% CI) | 1.08 [0.33, 3.56] |
| 9 SAEs during pregnancy Show forest plot | 1 | 140 | Risk Ratio (M‐H, Fixed, 95% CI) | 1.06 [0.28, 4.07] |
| 10 Stillbirths Show forest plot | 1 | 139 | Risk Ratio (M‐H, Fixed, 95% CI) | 4.30 [0.49, 37.49] |
| 11 Spontaneous abortions Show forest plot | 1 | 139 | Risk Ratio (M‐H, Fixed, 95% CI) | 1.07 [0.07, 16.84] |
| 12 Congenital malformations Show forest plot | 1 | 139 | Risk Ratio (M‐H, Fixed, 95% CI) | 1.07 [0.16, 7.41] |
| 13 Maternal mortality Show forest plot | 1 | 139 | Risk Ratio (M‐H, Fixed, 95% CI) | 0.0 [0.0, 0.0] |
| 14 Neonatal mortality Show forest plot | 1 | 129 | Risk Ratio (M‐H, Fixed, 95% CI) | 1.05 [0.07, 16.39] |
| 15 Infant deaths after 7 days Show forest plot | 1 | 129 | Risk Ratio (M‐H, Fixed, 95% CI) | 2.10 [0.19, 22.54] |
| 16 AEs: vomiting Show forest plot | 1 | 139 | Risk Ratio (M‐H, Fixed, 95% CI) | 13.43 [3.31, 54.54] |
| 17 AEs: fatigue/weakness Show forest plot | 1 | 139 | Risk Ratio (M‐H, Fixed, 95% CI) | 6.99 [1.64, 29.81] |
| 18 AEs: dizziness Show forest plot | 1 | 139 | Risk Ratio (M‐H, Fixed, 95% CI) | 52.60 [3.26, 848.24] |
| 19 AEs: headache Show forest plot | 1 | 139 | Risk Ratio (M‐H, Fixed, 95% CI) | 0.21 [0.01, 4.39] |
| Outcome or subgroup title | No. of studies | No. of participants | Statistical method | Effect size |
| 1 Maternal peripheral parasitaemia during pregnancy Show forest plot | 1 | 339 | Risk Ratio (M‐H, Fixed, 95% CI) | 0.13 [0.05, 0.33] |
| 2 Placental malaria Show forest plot | 1 | 220 | Risk Ratio (M‐H, Fixed, 95% CI) | 0.14 [0.01, 2.68] |
| 3 Mean birth weight Show forest plot | 1 | 290 | Mean Difference (IV, Fixed, 95% CI) | ‐80.0 [‐184.65, 24.65] |
| 4 Low birth weight Show forest plot | 1 | 290 | Risk Ratio (M‐H, Fixed, 95% CI) | 1.39 [0.78, 2.48] |
| 5 Prematurity Show forest plot | 1 | 199 | Risk Ratio (M‐H, Fixed, 95% CI) | 0.48 [0.15, 1.53] |
| 6 Stillbirths Show forest plot | 1 | 311 | Risk Ratio (M‐H, Fixed, 95% CI) | 2.63 [0.86, 8.08] |
| 7 Spontaneous abortions Show forest plot | 1 | 311 | Risk Ratio (M‐H, Fixed, 95% CI) | 0.48 [0.04, 5.22] |
| 8 Congenital malformations Show forest plot | 1 | 311 | Risk Ratio (M‐H, Fixed, 95% CI) | 3.82 [0.43, 33.83] |
| 9 Maternal mortality Show forest plot | 1 | 339 | Risk Ratio (M‐H, Fixed, 95% CI) | 2.95 [0.12, 71.85] |
| 10 Infant mortality Show forest plot | 1 | 288 | Risk Ratio (M‐H, Fixed, 95% CI) | 1.04 [0.63, 1.74] |