Scolaris Content Display Scolaris Content Display

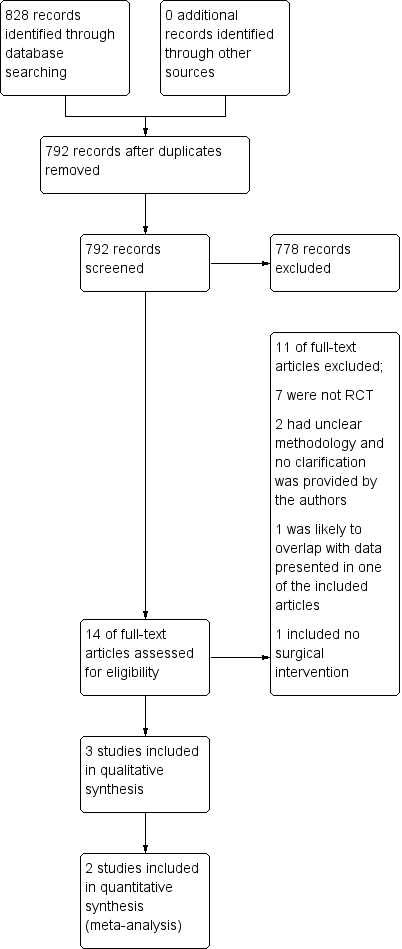
Study flow diagram.
Figuras y tablas -
Figure 1

Study flow diagram.

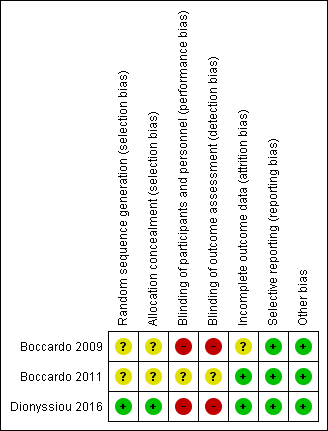
Risk of bias summary: review authors' judgements about each risk of bias item for each included study.
Figuras y tablas -
Figure 2

Risk of bias summary: review authors' judgements about each risk of bias item for each included study.

Forest plot of comparison: 1 Development of LE, outcome: 1.1 Development of LE.
Figuras y tablas -
Figure 3

Forest plot of comparison: 1 Development of LE, outcome: 1.1 Development of LE.

Forest plot of comparison: 2 Reduction of LE, outcome: 2.1 Reduction of LE [%].
Figuras y tablas -
Figure 4

Forest plot of comparison: 2 Reduction of LE, outcome: 2.1 Reduction of LE [%].

Comparison 1 Prevention of LE, Outcome 1 Development of LE.
Figuras y tablas -
Analysis 1.1

Comparison 1 Prevention of LE, Outcome 1 Development of LE.

Comparison 2 Treatment of LE, Outcome 1 Reduction of LE.
Figuras y tablas -
Analysis 2.1

Comparison 2 Treatment of LE, Outcome 1 Reduction of LE.

Comparison 2 Treatment of LE, Outcome 2 Pain score (1‐10 scale).
Figuras y tablas -
Analysis 2.2

Comparison 2 Treatment of LE, Outcome 2 Pain score (1‐10 scale).

Comparison 2 Treatment of LE, Outcome 3 Heaviness sensation score (1‐10 scale).
Figuras y tablas -
Analysis 2.3

Comparison 2 Treatment of LE, Outcome 3 Heaviness sensation score (1‐10 scale).

Comparison 2 Treatment of LE, Outcome 4 Function score (1‐10 scale).
Figuras y tablas -
Analysis 2.4

Comparison 2 Treatment of LE, Outcome 4 Function score (1‐10 scale).

Comparison 2 Treatment of LE, Outcome 5 Number of infections per year.
Figuras y tablas -
Analysis 2.5

Comparison 2 Treatment of LE, Outcome 5 Number of infections per year.

Summary of findings for the main comparison. Lymphaticovenular anastomosis compared to standard care for prevention of lymphoedema development

Lymphaticovenular anastomosis compared to standard care for prevention of lymphoedema development

Patient or population: prevention of lymphoedema development
Setting: hospital
Intervention: lymphaticovenular anastomosis
Comparison: standard care

Outcomes

Anticipated absolute effects* (95% CI)

Relative effect
(95% CI)

№ of participants
(studies)

Certainty of the evidence
(GRADE)

Comments

Risk with standard care

Risk with lymphaticovenular anastomosis

Development of LE

Study population

RR 0.20
(0.06 to 0.63)

95
(2 RCTs)

⊕⊕⊝⊝
LOW 1,2,3,4

319 per 1,000

64 per 1,000
(19 to 201)

*The risk in the intervention group (and its 95% confidence interval) is based on the assumed risk in the comparison group and the relative effect of the intervention (and its 95% CI).

CI: Confidence interval; RR: Risk ratio

GRADE Working Group grades of evidence
High certainty: We are very confident that the true effect lies close to that of the estimate of the effect
Moderate certainty: We are moderately confident in the effect estimate: The true effect is likely to be close to the estimate of the effect, but there is a possibility that it is substantially different
Low certainty: Our confidence in the effect estimate is limited: The true effect may be substantially different from the estimate of the effect
Very low certainty: We have very little confidence in the effect estimate: The true effect is likely to be substantially different from the estimate of effect

1 The surgical intervention groups were small: In Boccardo 2009 the preventive protocol was followed for 25 women of which seven underwent LVA primarily and the number undergoing LVA at a later stage was not reported. In Boccardo 2011, all 23 participants in the intervention group had LVA done at the time of axillary clearance.

2 In Boccardo 2009, the control group received physical therapy and compression garments only after lymphoedema was detected whereas the intervention group received these as a preventive measure already before any lymphoedema was detected. Therefore, the difference detected between the two groups cannot be attributed solely to the LVA done. In Boccardo 2011, neither of the groups received any compression treatments which means that the effect of the intervention was not compared with the standard treatment but no treatment at all.

3 The study group allocation was not concealed and the assessment was not blinded in either of the included studies. Therefore, we downgraded the certainty of the evidence by 1 point for risk of bias

4 Due to the small number of participants in each trial and wide confidence intervals, we downgraded the certainty of evidence by 1 point for imprecision.

Figuras y tablas -
Summary of findings for the main comparison. Lymphaticovenular anastomosis compared to standard care for prevention of lymphoedema development
Summary of findings 2. Vascularised lymph node transfer compared to standard care for treatment of arm lymphoedema

Vascularised lymph node transfer compared to standard care for treatment of arm lymphoedema

Patient or population: treatment of arm lymphoedema
Setting: hospital
Intervention: vascularised lymph node transfer
Comparison: standard care

Outcomes

Relative effects* (95% CI)

№ of participants
(studies)

Certainty of the evidence
(GRADE)

Comments

Vascularised lymph node transfer vs standard care

Reduction of LE (%)

MD 39 lower
(47.37 lower to 30.63 lower) in the intervention group

36
(1 RCT)

⊕⊝⊝⊝
VERY LOW 1,2,3

Number of infections per year

MD 1.22 lower
(2 lower to 0.44 lower) in the intervention group

36
(1 RCT)

⊕⊝⊝⊝
VERY LOW1,2,4

Pain score (1‐10; where 1 = no pain; 10 = extreme pain)

MD 4.16 lower
(5.17 lower to 3.15 lower) in the intervention group

36
(1 RCT)

⊕⊝⊝⊝
VERY LOW 1,2,3

Heaviness score (1‐10; where 1 = no heaviness; 10 = extreme heaviness)

MD 4.27 lower
(5.74 lower to 2.8 lower) in the intervention group

36
(1 RCT)

⊕⊝⊝⊝
VERY LOW 1,2,3

Function score (1‐10; where 1 = good function; 10 = poor function)

MD 3.77 lower
(4.89 lower to 2.65 lower) in the intervention group

36
(1 RCT)

⊕⊝⊝⊝
VERY LOW 1,2,3

*The risk in the intervention group (and its 95% confidence interval) is based on the assumed risk in the comparison group and the relative effect of the intervention (and its 95% CI).

CI: Confidence interval; MD: mean difference

GRADE Working Group grades of evidence
High certainty: We are very confident that the true effect lies close to that of the estimate of the effect
Moderate certainty: We are moderately confident in the effect estimate: The true effect is likely to be close to the estimate of the effect, but there is a possibility that it is substantially different
Low certainty: Our confidence in the effect estimate is limited: The true effect may be substantially different from the estimate of the effect
Very low certainty: We have very little confidence in the effect estimate: The true effect is likely to be substantially different from the estimate of effect

1 The control group in Dionyssiu 2016 study received no physical or compression treatments for the 12 months prior to the final assessment and thus did not receive the current golden standard of nonoperative lymphoedema treatment. Therefore we downgraded the evidence by 1 point for indirectness
2We downgraded the certainty of evidence by one point due to risk of bias because the participants and the personnel were not blinded to the treatment,
3We downgraded the certainty of evidence by two points due to imprecision (small number of participants from one study and wide confidence intervals).

Figuras y tablas -
Summary of findings 2. Vascularised lymph node transfer compared to standard care for treatment of arm lymphoedema
Comparison 1. Prevention of LE

Outcome or subgroup title

No. of studies

No. of participants

Statistical method

Effect size

1 Development of LE Show forest plot

2

95

Risk Ratio (M‐H, Fixed, 95% CI)

0.20 [0.06, 0.63]

Figuras y tablas -
Comparison 1. Prevention of LE
Comparison 2. Treatment of LE

Outcome or subgroup title

No. of studies

No. of participants

Statistical method

Effect size

1 Reduction of LE Show forest plot

1

36

Mean Difference (IV, Fixed, 95% CI)

‐39.0 [‐47.37, ‐30.63]

2 Pain score (1‐10 scale) Show forest plot

1

36

Mean Difference (IV, Fixed, 95% CI)

‐4.16 [‐5.17, ‐3.15]

3 Heaviness sensation score (1‐10 scale) Show forest plot

1

36

Mean Difference (IV, Fixed, 95% CI)

‐4.27 [‐5.74, ‐2.80]

4 Function score (1‐10 scale) Show forest plot

1

36

Mean Difference (IV, Fixed, 95% CI)

‐3.77 [‐4.89, ‐2.65]

5 Number of infections per year Show forest plot

1

36

Mean Difference (IV, Fixed, 95% CI)

‐1.22 [0.00, ‐0.44]

Figuras y tablas -
Comparison 2. Treatment of LE