Pruebas diagnósticas rápidas para diagnosticar el paludismo no complicado no falciparum o por Plasmodium vivax en países endémicos
Resumen
Antecedentes
En los ámbitos en que la infección por Plasmodium vivax y por Plasmodium falciparum causan paludismo, las pruebas diagnósticas rápidas (PDR) deben distinguir qué especie está causando los síntomas del paciente, debido a que se necesitan diferentes tratamientos. Las PDR más antiguas incorporaron dos líneas de pruebas para distinguir el paludismo causado por P. falciparum, del paludismo causado por otra especie de Plasmodium (no falciparum). Dichas PDR se pueden clasificar de acuerdo a qué anticuerpos utilizan: Las PDR tipo 2 utilizan HRP‐2 (para P.falciparum) y aldolasa (todas las especies); las PDR tipo 3 utilizan HRP‐2 (para P.falciparum) y pLDH (todas las especies); las tipo 4 utilizan pLDH (de P. falciparum) y pLDH (todas las especies).
Más recientemente se han desarrollado PDR para distinguir la parasitemia por P. vivax al utilizar un anticuerpo pLDH específico para el P. vivax.
Objetivos
Evaluar la precisión diagnóstica de las PDR para detectar la parasitemia no falciparum o por P. vivax en las personas que viven en zonas endémicas de paludismo y que acuden a centros de atención sanitaria ambulatoria con síntomas que indican paludismo, e identificar qué tipos y marcas de pruebas comerciales detectan mejor el paludismo no falciparum y por P. vivax .
Métodos de búsqueda
Se realizó una búsqueda exhaustiva en las siguientes bases de datos hasta el 31 de diciembre de 2013: Registro especializado del Grupo Cochrane de Enfermedades Infecciosas (Cochrane Infectious Diseases Group); MEDLINE; EMBASE; MEDION; Science Citation Index; Web of Knowledge; African Index Medicus; LILACS; e IndMED.
Criterios de selección
Estudios que compararon las PDR con un estándar de referencia (microscopía o reacción en cadena de la polimerasa) en muestras de sangre de series aleatorizadas o consecutivas de pacientes que asisten de forma ambulatoria a los centros de salud con síntomas indicadores de paludismo en regiones endémicas de no falciparum.
Obtención y análisis de los datos
De cada estudio, dos autores de la revisión extrajeron de forma independiente un conjunto de datos estándar con el uso de un formulario de extracción de datos personalizado. Las comparaciones se agruparon por tipo de PDR (definidas por las combinaciones de anticuerpos utilizadas) y se combinaron en el metanálisis cuando fue apropiado. Los promedios de sensibilidad y especificidad se presentan junto con intervalos de confianza del 95% (IC del 95%).
Resultados principales
Se incluyeron 47 estudios con 22 862 participantes. Las características de los pacientes, los métodos de muestreo y los métodos estándar de referencia se informaron de forma deficiente en la mayoría de los estudios.
PDR para la detección de la parasitemia “no falciparum”
Once estudios evaluaron pruebas tipo 2 en comparación con microscopía, 25 evaluaron pruebas tipo 3 y 11 evaluaron pruebas tipo 4. En los metanálisis, las sensibilidades y especificidades promedio fueron del 78% (IC del 95%: 73% a 82%) y del 99% (IC del 95%: 97% a 99%) para las pruebas tipo 2; del 78% (IC del 95%: 69% a 84%) y del 99% (IC del 95%: 98% a 99%) para las pruebas tipo 3 y del 89% (IC del 95%: 79% a 95%) y del 98% (IC del 95%: 97% a 99%) para las pruebas tipo 4; respectivamente. Las pruebas tipo 4 fueron más sensibles que las pruebas tipo 2 (p = 0,01) y tipo 3 (p = 0,03).
Cinco estudios compararon las pruebas tipo 3 con la PDR; en el metanálisis, la sensibilidad y la especificidad medias fueron del 81% (IC del 95%: 72% a 88%) y del 99% (IC del 95%: 97% a 99%) respectivamente.
PDR para la detección de la parasitemia por P. vivax
Ocho estudios compararon las pruebas pLDH con microscopía; la sensibilidad y la especificidad medias fueron del 95% (IC del 95%: 86% a 99%) y del 99% (IC del 95%: 99% a 100%), respectivamente.
Conclusiones de los autores
Las PDR diseñadas para detectar el P. vivax específicamente, ya sea solo o como parte de una infección mixta, parecen ser más exactas que las pruebas más antiguas diseñadas para distinguir el paludismo por P. falciparum del paludismo no falciparum. En comparación con la microscopía, estas pruebas no logran detectar alrededor del 5% de los casos de P.vivax . Esta revisión Cochrane, en combinación con otra información publicada acerca del rendimiento de las pruebas in vitro y la estabilidad en el campo, puede ayudar a los elaboradores de políticas a elegir entre las PDR disponibles.
Resumen en términos sencillos
Pruebas rápidas para el diagnóstico del paludismo causado por Plasmodium vivax u otros parásitos menos comunes
Esta revisión resume los ensayos que evalúan la exactitud de las pruebas diagnósticas rápidas (PDR) para diagnosticar el paludismo causado por Plasmodium vivax u otras especies no falciparum. Después de buscar estudios relevantes hasta diciembre de 2013, se incluyeron 47 estudios que reclutaron a 22 862 adultos y niños.
¿Qué son las pruebas rápidas y por qué deben poder distinguir el paludismo por Plasmodium vivax?
Las PDR son pruebas en el sitio de atención, fáciles de usar y apropiadas para su uso en ámbitos rurales por parte de los trabajadores de la asistencia sanitaria primaria. Las PDR funcionan mediante el uso de anticuerpos para detectar antígenos del paludismo en la sangre del paciente. Se coloca una gota de sangre en la tira de la prueba en la que los anticuerpos y el antígeno se combinan para crear una línea diferenciada que indica una prueba positiva.
El paludismo puede ser causado por cualquiera de cinco especies del parásito Plasmodium , aunque el P. falciparum y el P. vivax son los más comunes. En algunas áreas, las PDR deben poder distinguir qué especie está causando los síntomas de paludismo debido a que las diferentes especies pueden requerir diferentes tratamientos. A diferencia del P. falciparum, el P. vivax tiene un estadio hepático que puede causar enfermedad repetida cada pocos meses, a menos que sea tratado con primaquina. Los tipos más comunes de PDR para P. vivax utilizan dos líneas de prueba en combinación; una línea específica para P. falciparum, y una línea que puede detectar cualquier especie de Plasmodium. Si la línea del P. falciparum es negativa y la línea de “cualquier especie” es positiva, se supone que la enfermedad es causada por P. vivax (aunque también podría ser causada por P. malariae, o P. ovale). Más recientemente, se han desarrollado PDR para detectar específicamente el P. vivax.
¿Qué dice la investigación?
Las PDR para el paludismo no falciparum fueron muy específicas (rango: 98% a 100%), lo que significa que sólo del 1% al 2% de los pacientes con pruebas positivas en realidad no tendría la enfermedad. Sin embargo, fueron menos sensibles (rango: 78% a 89%), lo que significa que entre el 11% y el 22% de los pacientes con paludismo no falciparum en realidad obtendrían un resultado negativo en la prueba.
Las PDR para detectar específicamente el P. vivax fueron más exactas, con una especificidad del 99% y una sensibilidad del 95%, lo que significa que sólo el 5% de los pacientes con paludismo por P. vivax obtendrían un resultado negativo en la prueba.
Authors' conclusions
Summary of findings
| Patients/populations | People presenting with symptoms suggestive of uncomplicated malaria | |||||
| Prior testing | None | |||||
| Settings | Ambulatory healthcare settings in P. vivax,P. malariae or P. ovale malaria endemic areas in Asia, Africa and South America | |||||
| Index tests | Immunochromatography‐based rapid diagnostic tests (RDTs) for non‐falciparum malaria in the absence of P. falciparum co‐infection, or P. vivax malaria with or without other malaria species | |||||
| Reference standard | Conventional microscopy, polymerase chain reaction (PCR) | |||||
| Importance | Accurate and fast diagnosis allows appropriate and quick treatment for malaria to be provided | |||||
| Studies | 37 unique publications reporting 47 studies (22,862 participants) | |||||
| Quality concerns | Poor reporting of patient characteristics, sampling method and reference standard methods were common concerns | |||||
| Test type | Quantity of evidence Number of evaluations (malaria cases/participants) | Average sensitivity (95% CI) | Average specificity (95% CI) | Prevalence (%) | Consequences in a cohort of 1000 | |
| Missed cases | False positives | |||||
| Target condition (reference standard): non‐falciparum malaria (microscopy) | ||||||
| Type 2 HRP‐2 (P. falciparum specific) and aldolase (pan‐specific) | 11 (958/6879) | 78% (73% to 82%) | 99% (97% to 99%) | 5 | 11 | 10 |
| 15 | 33 | 9 | ||||
| 30 | 66 | 7 | ||||
| Type 3 HRP‐2 (P. falciparum specific) and pLDH (pan‐specific) | 23 (1537/11,234) | 78% (69% to 84%) | 99% (98% to 99%) | 5 | 11 | 10 |
| 15 | 33 | 9 | ||||
| 30 | 66 | 7 | ||||
| Type 4 pLDH (P. falciparum specific) and pLDH (pan‐specific) | 10 (986/3831) | 89% (79% to 95%) | 98% (97% to 99%) | 5 | 6 | 19 |
| 15 | 17 | 17 | ||||
| 30 | 33 | 14 | ||||
| Target condition (reference standard): non‐falciparum malaria (PCR) | ||||||
| Type 3 HRP‐2 (P. falciparum specific) and pLDH (pan‐specific) | 5 (300/1639) | 81% (72% to 88%) | 99% (97% to 99%) | 5 | 10 | 10 |
| 15 | 29 | 9 | ||||
| 30 | 57 | 7 | ||||
| Target condition (reference standard): P.vivax with or without other malaria species (microscopy) | ||||||
| HRP‐2 (P. falciparum specific) and pLDH (P. vivax‐specific) | 8 (580/3682) | 95% (86% to 99%) | 99% (99% to 100%) | 5 | 3 | 10 |
| 15 | 8 | 9 | ||||
| 30 | 15 | 7 | ||||
| Conclusions: The majority of studies evaluated RDTs which are designed to differentiate falciparum malaria from non‐falciparum malaria, but cannot differentiate between different non‐falciparum species or identify non‐falciparum malaria species within a mixed infection. In these types of tests, specificity for non‐falciparum malaria in the absence ofP. falciparum infection was high, but sensitivity was low, tests missing between 11% and 22% of non‐falciparum cases. RDTs which are designed to detect P. vivax specifically, whether alone or part of a mixed infection, were more accurate with tests missing less than 5% of P. vivax cases. This review can help decision‐making about which RDT to use, in combination with other published information about in vitro test performance and stability in the field. | ||||||
Background
Target condition being diagnosed
Malaria is a life‐threatening illness caused by protozoan Plasmodium parasites, which are transmitted by many species of Anopheles mosquitoes. In 2008, there were between 190 and 311 million cases of malaria worldwide (WHO 2009b). The two most common species of parasites that cause malaria are Plasmodium falciparum andPlasmodium vivax. Falciparum malaria is the most common cause of severe malaria and malaria deaths and can also cause other complications, such as anaemia and, in pregnancy, low birthweight babies. Vivax malaria is a relapsing form, which is rarely fatal but can cause serious anaemia in children. Other, less common, Plasmodium species that cause malaria in people include P. malariae and P. ovale. Malaria is a curable disease, and therefore malaria‐related morbidity and mortality can be reduced. Early, prompt and accurate diagnosis followed by appropriate treatment is the key to effective disease management (WHO 2003) and is a basic tenet of current malaria control policy (WHO 2005; Bell 2006).
People who are exposed repeatedly to Plasmodium infection develop a partial and incomplete immunity. This means that in highly endemic areas those most at risk are children under the age of five, who have not yet had the chance to develop immunity. In less endemic areas, or areas of seasonal or epidemic transmission, older children and adults are also at risk due to less developed immunity. Travellers from non‐endemic to endemic countries are at highest risk because they have no immunity at all.
Index test(s)
Rapid diagnostic tests (RDTs) (WHO 2003) detect parasite‐specific antigens in a drop of fresh blood through lateral flow immunochromatography (WHO 2006). The World Health Organization (WHO) currently lists 96 commercially available test kits meeting ISO131485 manufacturing standards (WHO 2009). RDTs do not require a laboratory or any special equipment (WHO 2006), are simple to use and can give results as a simple positive or negative result, at thresholds pre‐set by the manufacturers, within 15 minutes (Talman 2007). Therefore, RDTs are, in general, suitable for remote areas with limited facilities and relatively untrained staff. However, they have a limited shelf life and need to be kept dry and away from temperature extremes. They may also fail to detect malaria where there are low levels of Plasmodium parasites in the blood, for example in young children with low immunity, and false positives are possible due to cross reactions or gametocytaemia (Kakkilaya 2003).
Different types of RDT use different types of antibody or combination of antibodies to detect Plasmodium antigens. Some antibodies aim to detect a particular species while others are pan‐malarial, aiming to detect all types of Plasmodium.Table 1 lists the main types of RDT that were available in 2010. Since this classification was developed, the following test types have also become available:
| Type of test | Antigen combinations | Possible results |
| Type 1 | HRP‐2 (P. falciparum specific) | No Pf; Pf; invalid |
| Type 2 | HRP‐2 (P. falciparum specific) and aldolase (pan‐specific) | No malaria; Pf or mixed; Pv, Pf, or Pm; invalid |
| Type 3 | HRP‐2 (P. falciparum specific) and pLDH (pan‐specific) | No malaria; Pf or mixed; Pv, Pf, or Pm; invalid |
| Type 4 | pLDH (P. falciparum specific) and pLHD (pan‐specific) | No malaria; Pf or mixed; Pv, Pf, or Pm; invalid |
| Type 5 | pLDH (P. falciparum specific) and pLHD (P. vivax‐specific) | No malaria; Pf; Pv; Pf and Pv; invalid |
| Type 6 | HRP‐2 (P. falciparum specific), pLHD (pan‐specific) and pLDH (P. vivax specific) | No malaria; Pf and Pv ± Po and/or Pm; Pf ± Po and/or Pm; Pv ± Po or Pm; Po or Pm; invalid |
| Type 7 | Aldolase (pan‐specific) | No malaria; Pf, Pv, Po,or Pm; invalid |
| Other | HRP‐2 (P. falciparum specific) and pLDH (P. vivax specific) | No malaria; Pf; Pv; Pf and Pv; invalid |
-
Pan pLDH only, with possible results of: no malaria; P. falciparum (Pf), P. vivax (Pv), P. ovale (Po), or P. malariae (Pm); invalid
-
P. vivax specific pLDH only, with possible results of: no malaria; Pv; invalid;
-
P. falciparum specific HRP‐2 and P. vivax specific pLDH, with possible results of: no malaria; Pf, Pv, Pf + Pv; invalid.
HRP‐2 can stay in the blood for 28 days after initiating the antimalarial therapy (Kakkilaya 2003). Because of this 'persistent antigenaemia', it is not possible to use these tests in assessing parasite clearance following treatment, and false positive results may be found in patients who have recently been treated for malaria. In contrast, pLDH is rapidly cleared from the blood following parasite death; in fact it may clear more rapidly than the dead parasites (WHO 2009).
Alternative test(s)
Microscopic examination of Giemsa‐stained thick and thin blood films remains the conventional laboratory method and is still regarded as the 'gold standard'. Microscopic examination provides a good sensitivity and specificity, and it allows species and stage differentiations and quantification of parasites, all of which are important in assessing the disease severity and prescribing appropriate therapy. Intensive examination is more likely to reveal parasitaemia so the test is carried out with a fixed number of fields examined. Infections may be missed if slides are not examined carefully (Wongsrichanalai 2007). Very low parasitaemia may be missed even by good quality microscopy; the limit of detection of thick smear microscopy has been estimated at approximately four to 20 asexual parasites per µL, although under field conditions a threshold of 50 to 100 asexual parasites per µL is more realistic (Wongsrichanalai 2007). False positive results are also possible; if blood slides are not prepared carefully, artefacts may be formed which can be mistaken for Plasmodium parasites (Wongsrichanalai 2007).
The polymerase chain reaction (PCR), which is a molecular method based on DNA amplification, is the most accurate method of detecting parasites in the blood. Compared to microscopy, PCR is less prone to observer error and more sensitive at low levels of parasitaemia (Snounou 1993). For PCR, the limit of detection may be as low as 0.004 asexual parasites per µL (Hänscheid 2002). However, whether this increased ability to detect low level parasitaemia makes it a better diagnostic test is uncertain, as sub‐microscopic parasitaemia are of unknown clinical significance and the prevalence of asymptomatic sub‐microscopic infection is high in some areas (May 1999). PCR is currently not widely available due to logistical constraints and the need for specially trained technicians and a well‐equipped laboratory. It is usually used only for research purposes.
Rationale
A diagnostic test which is simple to perform, rapid and accurate is important in many situations to ensure prompt specific treatment, reduce misdiagnosis of non‐malarial illness as malaria, limit the development of drug resistance (Talman 2007) and reduce drug wastage. The WHO lists some of the situations where RDTs can be particularly useful in remote areas without access to expert microscopy, complex emergencies and severe malaria, where rapid diagnosis is essential to save lives (WHO 2000).
The WHO 2010 guidelines recommend chloroquine for P. vivax malaria in areas in which parasites remain sensitive to this drug, although they are currently considering recommending artemisinin‐based combination therapies (ACTs) for all P. vivax infections as they are effective (Gogtay 2013). Primaquine may be added to immediate treatment of P. vivax (and P. ovale) to effect a radical cure and prevent relapse (WHO 2010). Therefore, in areas where both P. falciparum and P. vivax are endemic, it is often useful to be able to distinguish between the two species.
The relative costs of microscopy and RDTs vary according to context. Where there is a relatively high prevalence of malaria and an established microscopy service, microscopy would usually be less expensive than RDTs because most of the costs associated with microscopy are fixed costs, and microscopy can also be used to diagnose other diseases. In areas where malaria is less prevalent, or very rural areas where access to good quality microscopy services is limited, RDTs may be less expensive than microscopy (WHO 2008). The cost of RDTs also depends on the type of test used, which will depend on the types of malaria parasite endemic in the area; the WHO describes three zones (WHO 2005a) as shown in Table 2.
| Zone | Endemic malaria parasites | Geographic area | Appropriate test type |
| 1 | P. falciparum only or other species almost always as a mixed infection | Most of sub‐Saharan Africa; lowland Papua New Guinea | Tests using HRP‐2 to detect P. falciparum only (Type 1) |
| 2 | Both P. falciparum and P. vivax, most commonly as a single species
| Asia and the Americas; Ethiopian highlands
| Combination RDTs which detect all species and distinguish between P. falciparum and P. vivax (Types 2 to 6) |
| 3 | Non‐falciparum only
| Vivax‐only areas of East Asia and Central Asia; some highland areas elsewhere | Pan‐specific or vivax‐specific RDTs (Type 7; Pan‐pLDH only; vivax‐pLDH only) |
RDTs may be used to confirm diagnosis before commencing treatment in people with symptoms of malaria where confirmation by microscopy is currently unavailable or unused, thereby increasing the specificity of diagnosis, which would otherwise be made on symptoms only. Alternatively, RDTs may replace microscopy for confirmatory diagnosis, where logistical factors and relative costs indicate that this may be beneficial. The usefulness of RDTs in these roles will depend to a large extent on their accuracy. The sensitivity and specificity thresholds that decide whether a test is useful in practice will depend upon the situation; as malaria endemicity varies enormously by geographic area, and positive and negative predictive values will vary considerably with endemicity, relating to the proportion of patients with fever who have malaria. In addition, microscopy is not a perfect reference standard in itself, and the relative accuracy of RDTs and microscopy will depend to a large extent on the performance of the laboratory facilities and personnel available for microscopy.
Previously published systematic reviews have focused on the accuracy of RDTs for diagnosing malaria in travellers returning to non‐endemic countries from endemic countries (Marx 2005). As far as we know this is the first systematic review to assess the accuracy of the full range of RDTs for diagnosing non‐falciparum orP. vivax malaria in people with symptoms in malaria‐endemic areas.
This review is the second of two Cochrane Reviews assessing the accuracy of RDTs for diagnosing symptomatic uncomplicated malaria in endemic countries. It covers two slightly different target conditions; non‐falciparum malaria in the absence of P. falciparum infection and P. vivax malaria, corresponding to the results obtainable with different RDT test types. The first review reported separately on RDTs for diagnosing P. falciparum malaria (Abba 2011). The summaries in this review are to assist decision making, in conjunction with other relevant information about these tests, including in vitro assessment and tests of stability and costs (WHO 2012).
Objectives
To assess the diagnostic accuracy of RDTs for detecting non‐falciparum or P. vivax malaria parasitaemia in people living in malaria‐endemic areas who present to ambulatory healthcare facilities with symptoms suggestive of malaria and to identify which types and brands of commercial test best detect non‐falciparum and P. vivax malaria.
Investigation of sources of heterogeneity
We planned to investigate heterogeneity in relation to age group, continent where the study took place, and adequacy of reference standard.
Methods
Criteria for considering studies for this review
Types of studies
Studies sampling a consecutive series of patients, or a randomly selected series of patients were eligible. Where the report did not explicitly state that sampling was consecutive, but we judged that consecutive sampling was most probable, we included the report. We excluded studies if they did not present sufficient data to allow us to extract absolute numbers of true positives, false positives, false negatives and true negatives. Due to resource constraints, we also excluded studies if the report did not present enough information to allow full assessment of eligibility or if the study was reported only in a non‐English language.
Participants
Studies recruiting people living in P. vivax,P. ovale or P. malariae endemic areas attending ambulatory healthcare settings with symptoms of uncomplicated malaria were eligible.
We excluded studies if participants:
-
were non‐immune people returning from endemic countries or were mainly recent migrant or displaced populations from non‐endemic or very low endemicity areas;
-
had been treated for malaria and the test was performed to assess treatment outcome;
-
had symptoms of severe malaria;
-
did not have symptoms of malaria;
-
were recruited through active case finding (for example, door to door surveys).
In studies where only a subgroup of participants was eligible for inclusion in the review, we included the study provided that we could extract relevant data specific to that subgroup. If studies included some patients with severe malaria, and we could not extract data specific to a subgroup of participants with uncomplicated malaria, we included the study if 90% or more of the participants had uncomplicated malaria.
Index tests
Studies evaluating any immunochromatography‐based RDTs specifically designed to detect non‐falciparum or P. vivax malaria. We included commercial tests that are no longer available because they may use the same antibodies and very similar technology to tests that are currently available or may become available in the future. Older and more recently available versions of the same test, for example, OptiMAL and OptiMAL‐IT were included separately. We also included prototype tests which are not longer available but which correspond to one of the commercial tests.
Comparator tests
We included studies regardless of whether they made comparisons with other RDT tests or not.
Target conditions
Studies aimed to detect non‐falciparum or P. vivax malaria. Where no distinction was made by species, but over 98% of malaria infections were identified by the reference standard as non‐falciparum or P. vivax, the study was eligible for inclusion.
Reference standards
Studies were required to diagnose non‐falciparum or P. vivax malaria using at least one of the following two reference standards:
-
Conventional microscopy of thick blood smears, thin blood smears or both. Presence of asexual parasites of any density was regarded as a positive smear;
-
PCR.
The reference standard was required to be performed using blood samples drawn at the same time as those for the index tests. Where studies used more than one reference standard, we presented data relating to comparisons with each reference standard.
Search methods for identification of studies
We used a single search strategy for both Cochrane Reviews in this series (see Abba 2011).
Electronic searches
To identify all relevant studies, we used the search terms and strategy outlined in Appendix 1 to search the following databases: Cochrane Infectious Diseases Group Specialized Register; MEDLINE; EMBASE; MEDION; Science Citation Index; Web of Knowledge; African Index Medicus; LILACS; and IndMED. We based the search on the following MeSH, full text and keyword terms: Malaria, Plasmodium, reagent kits, diagnosis, diagnostics, RDT, dipstick, MRDD, OptiMal, Binax Now, Parasight, Immumochromatography, antigen detection, antigen test, Combo card. We did not limit the search by language or publication status (although we later excluded non‐English language studies due to resource constraints). We restricted the searches to human studies. We updated the search on 31 December 2013.
Searching other resources
We searched the reference lists of included studies for relevant publications. Due to resource constraints, we did not search any other resources.
Data collection and analysis
Selection of studies
We initially used a single selection procedure to identify studies for inclusion in either of the two Cochrane Reviews in this series. The inclusion criteria differed between the reviews only in the target condition and parasite species. Therefore, of the study characteristics examined, we assessed parasite species last , for example a study listed as excluded due to not presenting sufficient data may also have not been a study of non‐falciparum or P. vivax malaria. One author (KA) initially assessed the titles identified by the search, excluding those obviously irrelevant to the diagnosis of malaria using RDTs. We retained titles where we had any doubt regarding inclusion.
Based on abstract examination, we excluded irrelevant letters, review articles and articles and then excluded other irrelevant notes. Using a pro forma, two review authors (KA and NM) independently assessed the eligibility of the remaining potentially relevant articles based on full text publications. We have listed the excluded studies in the Characteristics of excluded studies table. We resolved any discrepancies by discussion. Where we could not reach agreement, we consulted a third author (PG or PO). Where it remained unclear whether a study was eligible for inclusion because of a lack of detail or poor reporting, we excluded it. Similiarly, we excluded non‐English language reports for logistical reasons.
We named studies according to the surname of the first study author and the year of publication. The study naming used in this review uniquely identifies multiple study cohorts within each study report (for example as 'Bell 2001a' and 'Bell 2001b'), each of which use different reference standards or present data separately for more than one population with different characteristics. More than one RDT may be evaluated in each study cohort, thus the number of test evaluations exceeds the number of study cohorts, which exceeds the number of study reports.
Data extraction and management
Two review authors (KA and NM) independently extracted data and resolved any discrepancies by discussion. In cases of studies where only a subgroup of participants met the review inclusion criteria, we extracted and presented data only for that particular subgroup. Where two versions of one reference standard were used, for example local clinic and expert standard microscopy, or field versus laboratory RDT testing, we only included the one most likely to yield the highest quality results.
For each study, we systematically extracted data on the characteristics of the study, as shown in Appendix 2. We also extracted data relating to the sensitivity of the RDT at different levels of parasitaemia (asexual parasites per µL of blood) as presented by the study authors. For each comparison of index test with reference test, we extracted data on the number of true positives, true negatives, false positives and false negatives in the form of a two by two table. RDT results are dichotomous; microscopy results were deemed positive at any level of asexual parasitaemia; and PCR results used the cut‐off points presented by the study authors. Gametocyte‐only parasitaemia was considered negative; where a study was unclear on how they had classed gametocyte‐only parasitaemia, they were assumed to have used the same classification as ourselves and we included the data in the study.
We extracted data for each study (Smidt 2008), using current manufacturers' instructions in interpreting the RDT results. P. falciparum malaria only was considered as negative for parasitaemia. The target condition was defined slightly differently depending on the type of the test, as follows:
-
Types 2, 3 and 4 ‐ Non‐falciparum malaria in the absence of falciparum malaria
RDT Types 2, 3 and 4 are designed to detect non‐falciparum species (mainly P. vivax in most situations) when they occur without concurrent P. falciparum infection. They have two test lines, one specific for P. falciparum and one pan‐malarial line to detect all malaria species. Non‐falciparum malaria is identified by a positive pan‐malarial line and negative P. falciparum line; mixed infections will produce positive results for both the P. falciparum and pan‐malaria lines and are indistinguishable from P. falciparum alone.
Mixed infections detected by microscopy were considered true negative if RDT indicated P. falciparum; true positive if RDT indicated non‐falciparum in the absence of P. falciparum; and false negative if RDT indicated no malaria. This method corresponded to the method most often described by the authors of the included studies, first described by Tjitra 1999.
-
Tests using Pf HRP2 and Pv pLDH ‐ P. vivax (whether alone or part of mixed infection)
These types of tests are designed to identify P. vivax parasitaemia specifically, as they have a test line specific to P. vivax. Some also include other test lines, specific to other types of malaria parasite. Test results were considered positive for P. vivax whether or not they also indicated the presence of P. falciparum.
Where study authors interpreted test results or presented data differently, we used all the information presented in the paper to extract data consistent with our own methods; if we were unable to do this, we did not include the data in the analyses.
Assessment of methodological quality
Three researchers (KA, NM and SJ) assessed the quality of each individual study using the checklist adapted from the QUADAS tool (Whiting 2003). We answered each question on the checklist with a yes or no response, or noted unclear if study authors reported insufficient information to enable a judgement, and we documented the reasons for the judgement made. We have summarized the criteria we used in Appendix 3.
Statistical analysis and data synthesis
The comparisons made in this review can be considered in a hierarchy. We classified the data on each test type in the primary studies according to commercial brands. In order to provide a coherent description of the studies contributing to each analysis, we structured the results first by grouping studies according to their commercial brand, then grouping brands to form test types. The analytical strategy thus compared the test accuracy of commercial brands within each test type before making comparisons between test types. Comparative analyses first included all studies with relevant data, and were then restricted to studies that made direct comparisons between tests with the same participants, where such studies existed.
For each test type, we plotted estimates of the observed sensitivities and specificities in forest plots and in receiver‐operating characteristic (ROC) space. These plots illustrate variation in accuracy between studies. Where adequate data were available, we performed meta‐analyses using the bivariate model (Reitsma 2005) to produce summary sensitivities and specificities. Using a random‐effects approach, the model jointly synthesises sensitivity and specificity by allowing for correlation between them across studies. We made comparisons between tests by adding a covariate for brand or test type to the bivariate model to investigate association with sensitivity or specificity, or both. Also, we investigated the effect of test type on the variances of the random effects of logit sensitivity and logit specificity and we included separate variance terms where required. We assessed the significance of the difference in test performance by a likelihood ratio test comparing models with and without covariate terms for sensitivity and specificity. Where inadequate studies were available to estimate all parameters, we simplified the bivariate model to two univariate random‐effects logistic regression models by assuming no correlation between sensitivity and specificity. We fitted the models using the xtmelogit command in StataCorp 2011.
Where more than one commercial brand of the same test type was evaluated on the same patients against the same reference standard, we selected one brand at random from the analysis by test type in order to avoid bias due to inclusion of the same participants more than once in the analysis. We included both brands in any analyses comparing commercial brands.
Investigations of heterogeneity
We inspected forest plots and summary ROC plots to visually assess heterogeneity between study specific estimates of sensitivity and specificity. We planned to investigate the effect of age group, continent where the study took place, and adequacy of the reference standard on summary estimates of sensitivity and specificity by adding each factor as a covariate to the bivariate model.
We did not attempt to assess reporting bias because little is known about how this should be done for diagnostic test accuracy (DTA) reviews.
Results
Results of the search
In the initial search we identified 4837 titles, of which we excluded 4325 based on their title or abstract alone. We were unable to obtain one article in full text form. We retrieved full text articles for 511 titles; of which we excluded 474 articles; 316 because they were initially assessed as ineligible; 22 because the reports did not present enough information for us to assess their eligibility; 21 because they were available only in non‐English languages; 21 because we were unable to extract absolute numbers of true positives, false positives, false negatives and true negatives; and 94 because they did not present data on non‐falciparum or P. vivax malaria, although they were eligible for other reviews in this series. See Figure 1 for a flow diagram of search and eligibility results.

Study flow diagram.
We therefore included a total of 37 study publications. One of the included publications described two related studies, and another publication reported data separately for 10 different sites, making a total of 47 study cohorts. Seven of the 47 cohorts evaluated more than one test; one compared four tests, three compared three tests and three compared two tests. There were a total of 67 test evaluations reporting on a total of 32,466 tests in 22,862 participants. We have given a summary of the number of studies by test type and reference standard (microscopy or PCR) in Table 3.
| Type of RDT | Number of study cohorts (test evaluations) by reference standard | |
| Microscopy | PCR | |
| Non‐falciparum species in the absence of P. falciparum | ||
| Type 2 | 11 (11) | 0 (0) |
| Type 3 | 23 (25) | 5 (5) |
| Type 4 | 10 (11) | 1 (1) |
| Other type | 1 (1) | 0 (0) |
| P. vivax | ||
| Pf HRP2 and Pv pLDH | 8 (9) | 2 (3) |
| Type 6 | 0 (0) | 1 (1) |
Methodological quality of included studies
We summarised the overall methodological quality of the included studies in Figure 2. Twenty‐seven study cohorts (57%) clearly included a representative spectrum of patients attending ambulatory healthcare setting with symptoms of malaria; the remaining 20 were unclear, most often because they had not adequately described their sampling methods. Twenty study cohorts (43%) reported an adequate reference standard, 19 (40%) did not provide enough information on the reference standard, and eight (17%) had an inadequate reference standard, in all cases because a second microscopist did not verify the results. Thirty‐five study cohorts (75%) reported blinding of the reference standard results, 11 (23%) did not describe whether the reference standard was blinded and one (2%) did not blind the reference standard. Thirty‐seven (79%) study cohorts blinded the RDT results to the results of the reference tests, nine (19%) were unclear and one (2%) did not blind the RDTs. All 47 cohorts reported avoidance of partial verification, differential verification and incorporation.

Methodological quality graph: review authors' judgements about each methodological quality item presented as percentages across all included studies.
Eleven study cohorts (23%) reported on uninterpretable test results; of these, three excluded uninterpretable results from the analysis, four reported that there were no uninterpretable results, three repeated any uninterpretable tests and one presented the results for uninterpretable tests. The proportion of uninterpretable tests was low in every study that reported this information (maximum 6%). Thirty study cohorts (64%) did not report on uninterpretable results, but appeared to have no uninterpretable results, because they had an exact correlation between the number of participants enrolled and the number presented in the analysis. Six study cohorts (13%) did not report on uninterpretable results and also either did not clearly state the number of participants initially enrolled or showed a discrepancy between the number of participants enrolled and the number presented in the analysis.
Thirty‐seven study cohorts (79%) reported either no withdrawals from the study or recorded the reasons for any withdrawals; eight (17%) were unclear as to whether there were any withdrawals; one (2%) had one participant missing from the analysis, with no explanation, and another (2%) reported that samples with mixed infection or where microscopists disagreed were excluded, while the number of samples excluded, and the original number of participants enrolled, was not presented.
Findings
Target condition: non‐falciparum malaria only
In this section we present the results for RDTs which identify 'non‐falciparum malaria' by the presence of a positive pan‐malaria antibody line in the absence of a positive P. falciparum specific antibody line.
Verified by microscopy
Type 2 tests
There were 11 evaluations of Type 2 RDTs verified with microscopy (Figure 3); eight were undertaken in Asia, two in Africa and one in South America. The median sample size was 372 (range 113 to 2383), the median prevalence of non‐falciparum only malaria was 14% (range 7% to 32%) and the median percentage of malaria that was non‐falciparum was 46% (range 13% to 80%). None of the evaluations were undertaken only in children under the age of five years. Five different test brands were evaluated: ICT Malaria Pf/Pv (seven); ICT Malaria combo cassette (one), Malascan (one), NOW Malaria ICT (one) and VIKIA Malaria Ag Pf/Pan (one). Sensitivities of the tests ranged from 67% to 90%; specificities ranged from 89% to 100%. In meta‐analysis (11 evaluations, 6879 participants) the pooled sensitivity was 78% (95% confidence interval (CI) 73% to 82%) and the specificity was 99% (95% CI 97% to 99%) (Figure 4). Of the false negative RDT results (where microscopy identified non‐falciparum malaria only, but RDT gave a different result) 65% (95% CI 43% to 81%) of RDT results indicated 'no malaria'; the remaining false negative RDT results indicated P. falciparum or mixed infection (Table 4).

Forest plot of commercial brands of Type 2 tests for detection of non‐falciparum species (verified with microscopy). We ordered studies by continent, age group and study identifier.

Summary ROC plot of Type 2 tests for detection of non‐falciparum species (verified with microscopy). The black solid circle corresponds to the summary estimate of sensitivity and specificity, and is shown with a 95% confidence region.
| Study | Test | Number of false negatives | % false negatives indicating 'no malaria' | % false negatives indicating 'P. falciparum' |
| Type 2 tests | ||||
| ICT Combo | 37 | 22 | 78 | |
| ICT Malaria trial 1 | 16 | 13 | 88 | |
| ICT Malaria trial 2 | 6 | 67 | 33 | |
| ICT Malaria Pf/Pv | 29 | 100 | 0 | |
| ICT Malaria Pf/Pv | 3 | 67 | 33 | |
| ICT Malaria Pf/Pv | 13 | 62 | 38 | |
| Malascan | 18 | 67 | 33 | |
| ICT Malaria Pf/Pv | 8 | 75 | 25 | |
| NOW malaria ICT | 72 | 67 | 33 | |
| ICT Malaria Pf/Pv | 9 | 67 | 33 | |
| OptiMAL‐IT | 34 | 74 | 26 | |
| Median (range) | 67 (13 to 100) | 33 (0 to 88) | ||
| Pooled estimate (95% CI)* | 65 (43 to 81) | 35 (19 to 57) | ||
| Type 3 tests | ||||
| Carestart | 37 | 22 | 78 | |
| Parascreen | 43 | 14 | 86 | |
| Parascreen | 19 | 84 | 16 | |
| First response | 7 | 100 | 0 | |
| Diamed OptiMAL | 3 | 100 | 0 | |
| CareStart | 3 | 100 | 0 | |
| Parascreen | 5 | 60 | 40 | |
| SD Bioline | 133 | 89 | 11 | |
| Carestart | 38 | 89 | 11 | |
| SD Malaria Antigen Bioline | 4 | 100 | 0 | |
| Parascreen | 13 | 54 | 46 | |
| First response | 9 | 33 | 67 | |
| ParaHIT Total | 48 | 92 | 8 | |
| SD Malaria Ag Pf/Pan | 18 | 78 | 22 | |
| Pf/Pan Device | 24 | 25 | 75 | |
| Median (range) | 84 (14 to 100) | 16 (0 to 86) | ||
| Pooled estimate (95% CI) | 74 (52 to 88) | 26 (12 to 48) | ||
| Type 4 tests | ||||
| OptiMAL‐IT | 0 | 0 | 0 | |
| OptiMAL | 3 | 100 | 0 | |
| SD Malaria | 2 | 100 | 0 | |
| OptiMAL | 23 | 100 | 0 | |
| OptiMAL‐IT | 30 | 100 | 0 | |
| OptiMAL‐IT | 26 | 65 | 35 | |
| OptiMAL‐IT | 2 | 100 | 0 | |
| Carestart Malaria | 3 | 33 | 67 | |
| OptiMAL (field) | 0 | 0 | 0 | |
| OptiMAL | 3 | 100 | 0 | |
| OptiMAL | 13 | 77 | 23 | |
| Median (range) | 100 (0 to 100) | 0 (0 to 67) | ||
| Pooled estimate (95% CI) | 87 (79 to 92) | 13 (8 to 21) | ||
*The pooled estimates of the percentage of false negatives indicating 'no malaria' and the percentage of false negatives indicating 'P. falciparum' were computed by using a random effects logistic regression model for Type 2 and Type 3. A fixed effects logistic regression model was used for Type 4.
This table shows participants with non‐falciparum malaria monoinfection identified by microscopy who were negative by non‐falciparum monoinfection by RDT, by whether the RDT incorrectly identified the participant as not having malaria, or as having P. falciparum malaria.
Type 3 tests
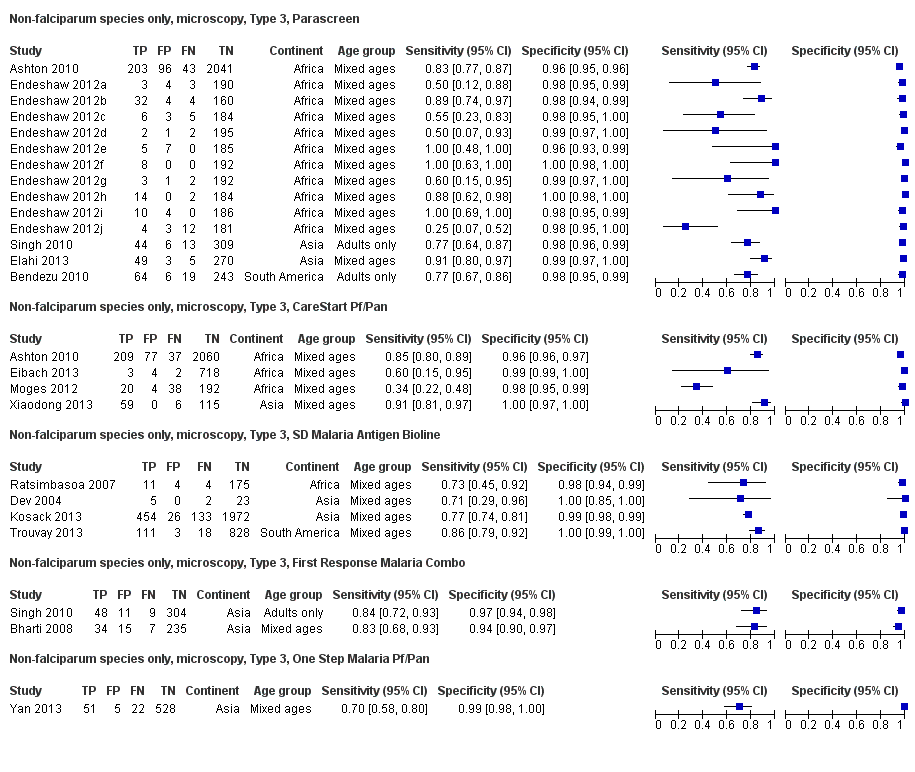
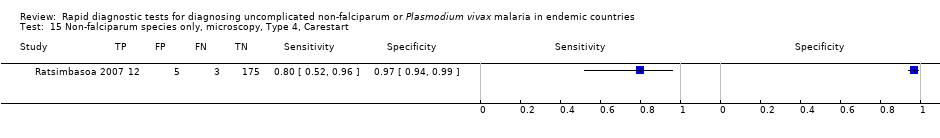
There were 25 evaluations of Type 3 RDTs verified with microscopy (Figure 5); eight were undertaken in Asia, 15 in Africa and two in South America. The median sample size was 200 (range 30 to 2585), the median prevalence of non‐falciparum only malaria was 10% (range 7% to 36%) and the median percentage of malaria that was non‐falciparum was 36% (range 17% to 85%). None of the evaluations were undertaken only in children under the age of five years. Five different test brands were evaluated: Parascreen (14), SD Malaria Antigen Bioline (four), Carestart Pf/Pan (four), First Response Malaria Combo (two) and One Step Malaria Pf/Pan (one). Sensitivities of the tests ranged from 25% to 100%; specificities ranged from 94% to 100%. Two studies evaluated two brands and so one brand was selected at random for inclusion in the meta‐analysis. Therefore, based on 23 evaluations (11,234 participants), the pooled sensitivity was 78% (95% CI 69% to 84%) and the specificity was 99% (95% CI 98% to 99%) (Figure 6). Of the false negative RDT results (where microscopy identified non‐falciparum malaria only, but RDT gave a different result), 74% (52% to 88%) of RDT results indicated 'no malaria'; the remaining false negative RDT results indicated P. falciparum or mixed infection (Table 4).

Forest plot of commercial brands of Type 3 tests for detection of non‐falciparum species (verified with microscopy). We ordered studies by continent, age group and study identifier.
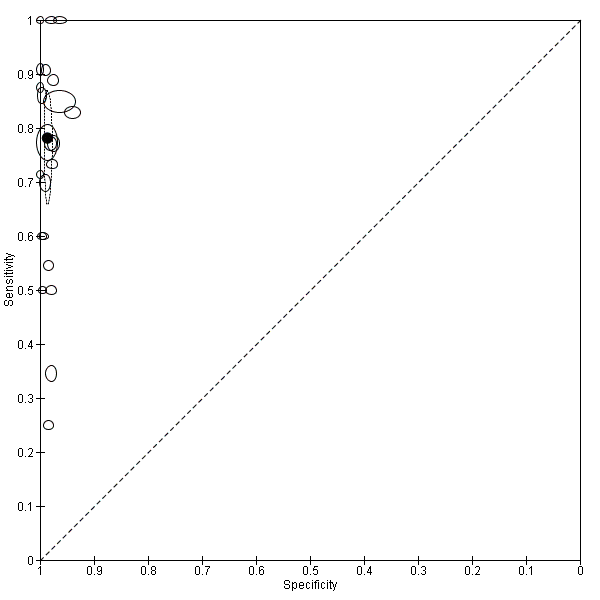
Summary ROC plot of Type 3 tests for detection of non‐falciparum species (verified with microscopy). The black solid circle corresponds to the summary estimate of sensitivity and specificity, and is shown with a 95% confidence region.
Type 4 tests
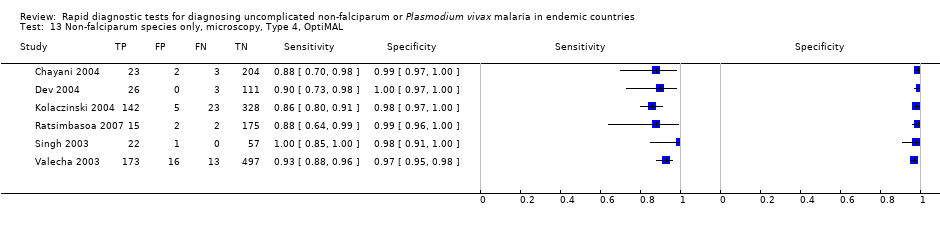
There were 11 evaluations of Type 4 RDTs compared microscopy (Figure 7); six were undertaken in Asia, two in Africa and three in South America. The median sample size was 289 (range 80 to 896), the median prevalence of non‐falciparum only malaria was 27% (range 8% to 33%) and the median percentage of malaria that was non‐falciparum was 51% (range 21% to 100%). None of the evaluations were undertaken only in children under the age of five years. Three different test brands were evaluated: OptiMAL (six), OptiMAL‐IT (four) and Carestart Malaria Pf/Pan (one). Sensitivities of the tests ranged from 63% to 100%; specificities ranged from 94% to 100%. One study evaluated two brands and so one brand was selected at random for inclusion in the meta‐analysis. Based on 10 evaluations (3831 participants), the pooled sensitivity was 89% (95% CI 79% to 95%) and the specificity was 98% (95% CI 97% to 99%) (Figure 8). Of the false negative RDT results (where microscopy identified non‐falciparum malaria only, but RDT gave a different result), 87% (79% to 92%) of RDT results indicated 'no malaria'; the remaining false negative RDT results indicated P. falciparum or mixed infection (Table 4).

Forest plot of commercial brands of Type 4 tests for detection of non‐falciparum species (verified with microscopy). We ordered studies by continent, age group and study identifier.

Summary ROC plot of Type 4 tests for detection of non‐falciparum species (verified with microscopy). The black circle corresponds to the summary estimate of sensitivity and specificity, and is shown with a 95% confidence region.
Other test types
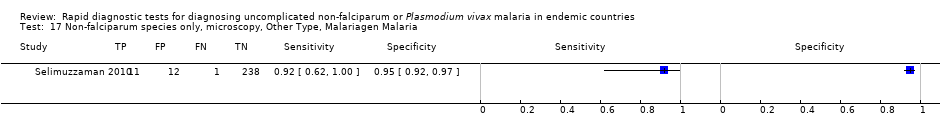
There was one evaluation of Malariagen Malaria, a type of test that does not fit into the classification presented in Table 1. Malariagen Malaria uses antibodies to the HRP‐2 antigen of P. falciparum and unspecified monoclonal antibodies for detection of pan‐malarial antigens. The study (Selimuzzaman 2010) was undertaken on a sample of 262 adults in Asia and the study prevalence of non‐falciparum malaria was 5%. The sensitivity of this test verified against microscopy was 92% (95% CI 62% to 100%) and the specificity was 95% (95% CI 92% to 97%).
Comparisons between RDT types
We summarised the comparison of different RDT types in Figure 9, Figure 10, Table 5 and Table 6. There was a statistically significant (P = 0.008) difference in accuracy between test types (Table 5) with Type 4 tests being significantly more sensitive than Type 2 (P = 0.01) and Type 3 (P = 0.03) (Table 6) based on indirect comparisons using all available data. Specificities were similarly high across the three test types. Few studies directly compared tests and so meta‐analyses restricted to direct comparisons were not possible. The results from the only study (van den Broek 2006) that directly compared a Type 2 test and a Type 4 test were consistent with the meta‐analytic finding and also demonstrated a statistically significant difference (P < 0.001) in sensitivity (Appendix 4).

Forest plot of Type 2, Type 3 and Type 4 tests for detection of non‐falciparum species (verified with microscopy). We ordered studies by continent, age group and study identifier.

Summary ROC plot comparing Type 2, Type 3 and Type 4 tests for detection of non‐falciparum species (verified with microscopy). The solid circles correspond to the summary estimates of sensitivity and specificity for each test type, and are shown with 95% confidence regions (dotted lines) and 95% prediction regions (dashed lines). The summary points for Type 2 and Type 3 and their 95% confidence regions are identical but the 95% prediction regions differ. The 95% prediction regions illustrate the extent of between study heterogeneity.
| RDT Type | Study cohort | Participants | Malaria cases | Pooled sensitivity (95% CI) (%) | Pooled specificity (95% CI) (%) | Test1 |
| Type 2 | 11 | 6879 | 958 | 78 (73 to 82) | 99 (97 to 99) | P = 0.008 |
| Type 3 | 23 | 11,234 | 1537 | 78 (69 to 85) | 99 (98 to 99) | |
| Type 4 | 10 | 3831 | 986 | 90 (79 to 95) | 98 (97 to 99) | |
| Other type | 1 | 262 | 12 | 92 (62 to 100) | 95 (92 to 98) |
1Likelihood ratio test for evidence of a difference in sensitivity or specificity, or both, between Types 2, 3, and 4.
*Only one test brand (randomly selected) from each cohort is included in the analysis of each type.
| Ratio of sensitivity (95% CI), P value for comparison Ratio of specificity (95% CI), P value for comparison |
| Type 2 | Type 3 | |
| Studies (participants) | 11 (6879) | 23 (11,234) | ||
|
| Studies (participants) | Sensitivity (95% CI) Specificity (95% CI) | 78 (73 to 82) 99 (97 to 99) | 78 (69 to 84) 99 (98 to 99) |
| Type 2 | 11 (6879) | 78 (73 to 82) 99 (97 to 99) | ‐ | ‐ |
| Type 3 | 23 (11,234) | 78 (69 to 84) 99 (98 to 99) | 1.00 (0.89 to 1.12), P = 1.00 1.00 (0.99 to 1.01), P = 0.87 | ‐ |
| Type 4 | 10 (3831) | 90 (79 to 95) 98 (97 to 99) | 0.87 (0.78 to 0.96), P = 0.01 1.00 (0.99 to 1.02), P = 0.52 | 0.87 (0.76 to 0.99), P = 0.03 1.01 (1.00 to 1.02), P = 0.29 |
We computed the ratio of sensitivities and specificities by division of the sensitivity and specificity for the column by the sensitivity and specificity for the row. If the ratio of sensitivities is greater than one, the sensitivity of the test for the column is higher than that for the row; if less than one, the sensitivity of the test in the row is higher than in the column. The same applies to the ratio of specificities.
Comparison of brands
We compared the test performance of three Type 3 test brands—Parascreen (14 studies, 547 participants), Carestart Pf/Pan (four studies, 3544 participants) and SD Malaria Antigen Bioline (four studies, 3769 participants). We excluded the other two brands—First Response Malaria Combo (two studies, 663 participants) and One Step Malaria Pf/Pan (one study, 606 participants)—from the analysis due to limited data. There was no evidence (P = 0.88) to suggest that the sensitivity or specificity, or both, of type 3 tests was associated with brand. The summary sensitivity (95% CI) was 79% (67% to 88%) for Parascreen, 74% (45% to 91%) for Carestart Pf/Pan, and 80% (73% to 85%) for SD Malaria Antigen Bioline. The summary specificity (95% CI) was 98% (98% to 99%) for Parascreen, 99% (96% to 100%) for Carestart Pf/Pan, and 99% (98% to 100%) for SD Malaria Antigen Bioline.
For Type 4 tests, we compared the diagnostic accuracy of the OptiMAL (six studies, 1843 participants) and OptiMAL‐IT (four studies, 1987 participants) brands. We excluded a third brand, Carestart Pf/Pan (one study, 195 participants), because of limited data. There was no evidence (P = 0.79) to suggest a difference in the sensitivity or specificity, or both, of the two brands. The summary sensitivity of OptiMAL was 90% (85% to 93%) and that of OptiMAL‐IT was 91% (49% to 99%). The summary specificities were 98% (97% to 99%) and 98% (96% to 99%) for OptiMAL and OptiMAL‐IT respectively.
Investigations of heterogeneity
Due to the limited number of studies available for each test type, we were only able to investigate the effect of continent and adequacy of the reference standard on the sensitivity and specificity of Type 3 tests for detecting non‐falciparum species with microscopy as reference standard. There were three continents—Africa (14 studies, 5551 participants), Asia (eight studies, 4997 participants) and South America (two studies, 704 participants)—but we excluded South America from the analysis due to the limited data available. There was no evidence (P = 0.55) to suggest a difference in sensitivity or specificity, or both, between studies conducted in Africa and those in Asia. The summary sensitivity (95% CI) was 74% (57% to 86%) for Africa and 80% (73% to 85%) for Asia. The summary specificity (95% CI) was 99% (98% to 99%) for Africa and 99% (97% to 99%) for Asia. For adequacy of the reference standard, six studies were scored 'Yes', 12 studies were scored 'No' and five studies were scored 'Unclear'; there was no evidence (P = 0.54) to suggest a difference in sensitivity or specificity, or both. The summary sensitivity and specificity were 77% (67% to 85%) and 99% (98% to 99%) for studies with an acceptable reference standard; 78% (65% to 88%) and 99% (98% to 99%) for studies without an acceptable reference standard; and 86% (78% to 91%) and 98% (97% to 99%) for studies where the assessment was judged to be unclear.
Verified by PCR
Type 2 tests
No study verified a Type 2 test with PCR.
Type 3 tests
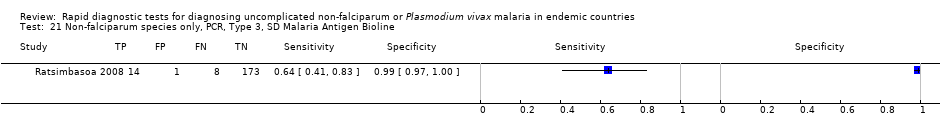
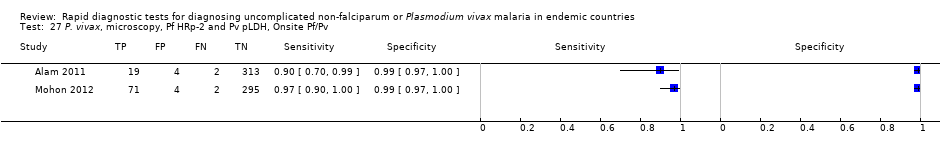
There were five evaluations of a Type 3 test verified with PCR (Figure 11); three were undertaken in Asia and two were undertaken in South America. The median sample size was 327 (range 178 to 606), and the median prevalence of non‐falciparum malaria was 15% (range 7% to 33%). None of the evaluations were undertaken only in children under the age of five years. Four different test brands were evaluated; Parascreen (two studies); SD Malaria Antigen Bioline (one study), CareStart Pf/Pan (one study) and One Step Malaria Pf/Pan (one study). Sensitivities of the tests ranged from 64% to 91% and specificities ranged from 97% to 100%. In meta‐analysis, the pooled sensitivity was 81% (95% CI 72% to 88%) and the pooled specificity was 99% (95% CI 97% to 99%).
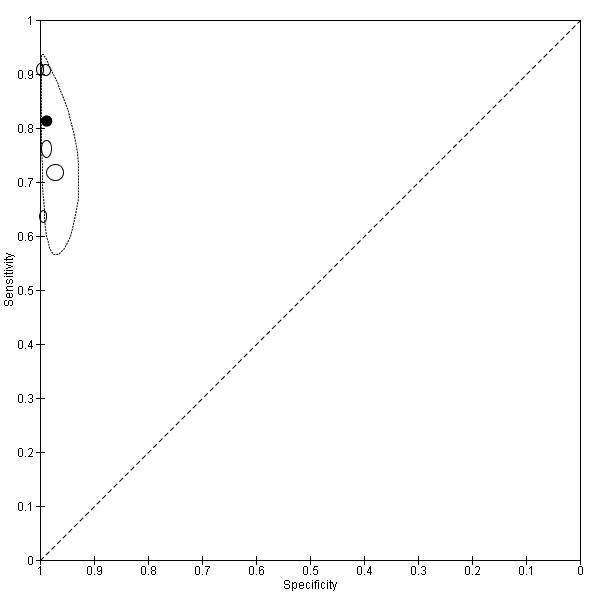
Summary ROC plot of Type 3 tests for detection of non‐falciparum species (verified with PCR). The solid circles correspond to the summary estimate of sensitivity and specificity, and is shown with a 95% confidence region.
Type 4 tests
One study (Rakotonirina 2008) verified a Type 4 test, OptiMAL, against PCR and gave results consistent with the summary results of the six studies that used microscopy as the reference standard (Appendix 5).
Comparison of results verified by microscopy or PCR
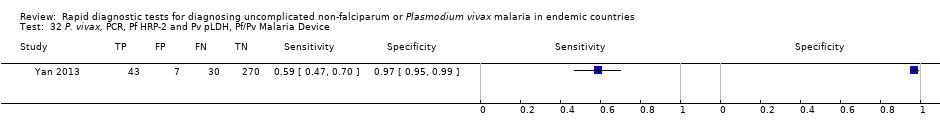
Four studies used both microscopy and PCR as reference standards to verify parasitaemia. Elahi 2013 estimated a sensitivity of 91% and specificity of 99% for both PCR and microscopy; Bendezu 2010 estimated a sensitivity of 76% and specificity of 98% with PCR, and sensitivity of 77% and specificity of 99% with microscopy. The accuracy of CareStart Pf/Pan reported by Xiaodong 2013 was similar for both reference standards with sensitivity of 91% and specificity of 100%. Yan 2013 evaluated One Step Malaria Pf/Pan with an estimated sensitivity of 72% when verified against PCR and 70% against microscopy, and a specificity of 97% with PCR and 99% with microscopy. Ratsimbasoa 2008 verified the Malaria Antigen Bioline test against PCR and gave results within the 95% CI of the pooled results of the two studies that used microscopy as the reference standard (Appendix 5).
Target condition: P. vivax
In this section we present the results for RDTs which identify P. vivax by the presence of a positive P. vivax specific antibody line. The majority of the tests had two test lines, an HRP‐2 line to detect P. falciparum and an pLDH line to detect P. vivax. One study, which verified results using PCR, evaluated a Type 6 tests, with additional test with an additional pan line to detect all species of malaria. In each case, only the Pv PLDH line is considered in the analysis.
Verified by microscopy
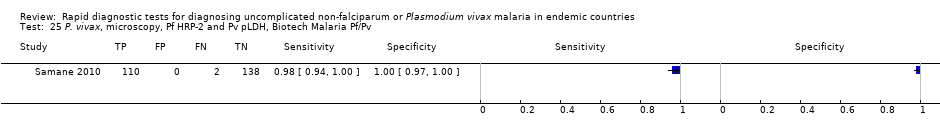
Eight studies evaluated the performance of Pf HRP‐2 and Pv pLDH antibody tests verified with microscopy—four were undertaken in Africa and four in Asia (Figure 12). The median sample size was 361 (range 240 to 1092), with a median prevalence of P. vivax malaria of 19% (range 2% to 45%). Evaluations were conducted in mixed age groups or adults only. Five different test brands were assessed: CareStart Pf/Pv (three), Falcivax (two), Biotech Malaria Pf/Pv (one), OnSite Pf/Pv (one), and Pf/Pv Malaria Device (one). The sensitivities of the tests ranged from 66% to 100%, and specificities ranged from 98% to 100%. In meta‐analysis (eight evaluations, 3682 participants) the summary sensitivity and specificity (95% CI) were 95% (86% to 99%) and 99% (99% to 100%) respectively (Figure 13).

Forest plot of Pf HRP‐2 and Pv pLDH for detection of P. vivax (verified with microscopy). Studies are ordered by continent, age group and study identifier.

Summary ROC plot Pf HRP‐2 and Pv pLDH for detection of P. vivax (verified with microscopy). The black circle corresponds to the summary estimate of sensitivity and specificity, and is shown with a 95% confidence region.
Verified by PCR
Two studies evaluated the performance of three different brands of Pf HRP‐2 and Pv pLDH antibody tests against PCR. One study was undertaken in Bangladesh and the other in China. Sensitivities ranged from 59% (47% to 70%) to 77% (56% to 91%) and specificities ranged from 97% (95% to 99%) to 100% (99% to 100%). One study evaluated a Type 6 RDT and reported a sensitivity of 90% (70% to 99%) and specificity of 100% (99% to 100%).
Additional analyses
Sensitivities of tests at different levels of P. vivax parasitaemia
Type 2 tests
Four studies presented additional data relating to the sensitivity of Type 2 RDTs against microscopy at different levels of parasitaemia (Fernando 2004; Tjitra 1999; van den Broek 2006; Wongsrichanalai 2003). The findings varied; all found very low sensitivities below 100 parasites per µL, rising with level of parasitaemia, but the level at which a high sensitivity (over 90%) was achieved varied between 500 parasites per µL and 5,000 parasites per µL.
Type 3 tests
Four studies presented additional data relating to the sensitivity of a Type 3 RDT against microscopy at different levels of parasitaemia. In Ratsimbasoa 2008 sensitivity was 93% at levels of 501 to 5000 asexual parasites per µL; and 100% at levels above 5000 asexual parasites per µL. In Mohon 2012, sensitivity ranged from 80% at 1 to 100 asexual parasites per µL, to 90% at 101 to 500 asexual parasites per µL to 100% at 501 or more asexual parasites per µL. In Yan 2013, sensitivity was 73.3% at under 500 asexual parasites per µL to 100%, and 69% at over 500 asexual parasites per µL to 100%. In Kosack 2013 sensitivity was 14% at one to nine asexual parasites per 100 fields, 70% at one to 10 asexual parasites in 10 fields, 96% at one to 10 asexual parasites per field, and 98% at more than 10 asexual parasites per field.
Type 4 tests
Three studies presented additional data relating to the sensitivity of Type 4 RDTs against microscopy at different levels of parasitaemia, although two had only small numbers. One study presented useful data (Valecha 2003), reporting a sensitivity of 30% at under 500 asexual parasites per µL; 48% at 500 to 999 asexual parasites per µL; 91% at 1000 to 5000 asexual parasites per µL; and 100% at over 5000 asexual parasites per µL.
Discussion
Summary of main results
Test Types 2, 3 and 4, and other tests that identified non‐falciparum malaria through deduction of a positive result for pan‐malarial antigens along with a negative result for P. falciparum specific antigens, had sensitivities that ranged in pooled analyses from 78% (Type 2) to 89% (Type 4). Further analysis of the false negative results showed that the majority of non‐falciparum only cases that were missed by the RDTs were indicated as 'no malaria' although some were indicated as P. falciparum or mixed infection. Type 4 tests were significantly more sensitive than Type 2 tests. Specificities were consistently high, ranging from 98% (Type 4) to 99% (Type 2 and Type 3). There were no apparent differences between microscopy and PCR as the reference standard.
In studies that verified RDTs with microscopy, tests that used a P. vivax specific antibody line to identify P. vivax had a pooled sensitivity of 95% (95% CI 86% to 99%) and a pooled specificity of 99% (95% CI 99% to 100%). In contrast, the two studies that verified these types of RDTs with PCR demonstrated much lower sensitivity of 59% (47% to 70%) and 77% (56% to 91%).
In summary of findings Table, assuming prevalences of 5%, 15% and 30%, the number of missed non‐falciparum or P. vivax malaria cases and the number of false positives in a hypothetical cohort of 1000 patients are presented by test type. In the case of tests for non‐falciparum only, the performance may in reality be affected by the prevalence of P. falciparum parasitaemia; this effect is not possible to estimate with any accuracy, however it is likely to be small, and has therefore been ignored.
Strengths and weaknesses of the review
Completeness of evidence
It is probable that some studies eligible for inclusion in the review were missed by our search strategy. DTA studies are known to be poorly indexed, and hence liable to be missed, even when searches are designed to be very sensitive (Whiting 2009). However, our search was comprehensive.
Accuracy of the reference standards used
Microscopy is an imperfect diagnostic test in itself, raising the possibility that in some cases of discordant results between microscopy and RDT, the RDT result may in fact have been correct, and the microscopy results incorrect. However, with the exception of P. vivax specific tests, where only two studies verified by PCR were available, results for studies which verified RDT results against PCR gave similar results to those which used microscopy as a reference standard.
In studies reporting on sensitivity by parasitaemia level, RDTs tended to reach high levels of sensitivity (above 90%) at levels of parasitaemia above 500 to 1000 asexual parasites for P. vivax, but were less reliable at lower levels. This finding corresponds closely with a similar analysis within a DTA review of RDTs for travellers with fever returning from malaria endemic to non‐endemic areas(Marx 2005).
Quality of reporting of the included studies
The quality of reporting of the included studies, as assessed by the number of 'unclear' evaluations of study quality was variable. Nineteen study cohorts (40%) did not provide enough information for us to adequately assess the adequacy of the reference standard, which we judged to be the most important quality indicator for this review.
Quality of the included studies
Where sufficient information was provided to assess the quality of included studies, the quality was variable. Twenty (43%) study cohorts reported an adequate reference standard, while 37 (79%) reported that readers of the reference standard were blinded to the results of the RDTs. For Type 3 tests, we were able to investigate the effect of adequacy of the reference standard on test performance. There was no evidence of a difference in test performance between studies with an adequate, inadequate or unclear reference standard.
Completeness and relevance of the review
This review focused specifically on the use of RDTs for diagnosing non‐falciparum malaria in people living in malaria endemic areas and attending ambulatory health care setting with symptoms of malaria; therefore evaluating the tests in the context in which they are intended to be most often used. Previously published reviews have evaluated the accuracy of RDTs under laboratory conditions (WHO 2012) and for use by travellers returning from malaria endemic to non‐endemic areas (Marx 2005). By classifying asexual parasitaemia as positive and gametocytes only as negative we focused on malarial illness requiring curative treatment, in line with current treatment recommendations (WHO 2010). In the future, as malaria comes closer to elimination, it may become important to cure gametocytaemia to prevent transmission, and diagnostic priorities may change.
Applicability of findings to the review question
Qualities of RDTs
RDT types 2, 3 and 4, which aim to identify 'non‐falciparum malaria only' as a proxy for P. vivax may miss between 11% (Type 4) and 22% (Type 2 and Type 3) of cases, with the majority of missed cases being incorrectly identified as free of malaria. In addition, the design of these tests does not allow the identification of non‐falciparum malaria as part of a mixed infection, or the differentiation of P. vivax from P. ovale and P. malariae. These tests therefore do not appear adequately sensitive for the identification of P. vivax, although they may play a role in areas where both P. vivax and P. falciparum occur and are initially treated with the same drugs. In contrast, RDT types using pLDH designed to detect P. vivax specifically, whether alone or part of a mixed infection appear to be both highly sensitive (missing 5% of cases) and highly specific for P. vivax. However, two studies included in this review, which verified the test with PCR, found much lower sensitivities. Consideration also needs to be made for variation in sensitivity by brand (WHO 2012).
Application to clinical decision‐making in practice
The evaluations presented in this review were conducted in patients with symptoms of clinical malaria and inferences about the results relate to this context, and not to mass surveys of well populations. The evaluations should also be read in conjunction with other published information regarding the in vitro performance, stability and costs of the tests, including the WHO FIND report (WHO 2012). Results between this review and the FIND analysis for some RDTs differ slightly. The FIND report tested individual products under laboratory conditions using standardised blood samples at low and high parasite densities (200 and 2000 parasites per µL) and reported the 'panel detection score'; which is defined as the percentage of times that two tests within a batch detected parasites at low density, and percentage of times that one test detected parasites at high density. This measure is slightly different to sensitivity, as it includes an aspect of consistency, whereas the studies in this review were conducted in field conditions with patients, and this is likely to account for variations between the datasets. The results in our review more closely mimic the conditions in which the tests would be used in practice; where parasite density is generally unknown, and may be affected by storage of the test, quality of a specific batch, local parasite densities, local parasite antigen patterns, quality of local microscopy and accuracy of reading the tests. Equally, these factors bring in more variation than tests from a laboratory using standardised samples.
RDTs can only influence clinical practice if the results are believed and acted upon. There may be reluctance on the part of both health providers and patients to believe negative RDT results, leading to unnecessary repeat testing and prescription of antimalarials for negative cases (Tavrow 2000). Various studies have shown that patients with fever and negative malaria test results, whether by microscopy or RDT, often still receive antimalarials (Hamer 2007), thus reducing their potential usefulness and cost‐effectiveness. However, some educational interventions have been shown to be effective in reducing prescriptions for antimalarials in negative cases (Ngasala 2008).

Study flow diagram.

Methodological quality graph: review authors' judgements about each methodological quality item presented as percentages across all included studies.

Forest plot of commercial brands of Type 2 tests for detection of non‐falciparum species (verified with microscopy). We ordered studies by continent, age group and study identifier.

Summary ROC plot of Type 2 tests for detection of non‐falciparum species (verified with microscopy). The black solid circle corresponds to the summary estimate of sensitivity and specificity, and is shown with a 95% confidence region.
Forest plot of commercial brands of Type 3 tests for detection of non‐falciparum species (verified with microscopy). We ordered studies by continent, age group and study identifier.

Summary ROC plot of Type 3 tests for detection of non‐falciparum species (verified with microscopy). The black solid circle corresponds to the summary estimate of sensitivity and specificity, and is shown with a 95% confidence region.

Forest plot of commercial brands of Type 4 tests for detection of non‐falciparum species (verified with microscopy). We ordered studies by continent, age group and study identifier.

Summary ROC plot of Type 4 tests for detection of non‐falciparum species (verified with microscopy). The black circle corresponds to the summary estimate of sensitivity and specificity, and is shown with a 95% confidence region.

Forest plot of Type 2, Type 3 and Type 4 tests for detection of non‐falciparum species (verified with microscopy). We ordered studies by continent, age group and study identifier.

Summary ROC plot comparing Type 2, Type 3 and Type 4 tests for detection of non‐falciparum species (verified with microscopy). The solid circles correspond to the summary estimates of sensitivity and specificity for each test type, and are shown with 95% confidence regions (dotted lines) and 95% prediction regions (dashed lines). The summary points for Type 2 and Type 3 and their 95% confidence regions are identical but the 95% prediction regions differ. The 95% prediction regions illustrate the extent of between study heterogeneity.

Summary ROC plot of Type 3 tests for detection of non‐falciparum species (verified with PCR). The solid circles correspond to the summary estimate of sensitivity and specificity, and is shown with a 95% confidence region.

Forest plot of Pf HRP‐2 and Pv pLDH for detection of P. vivax (verified with microscopy). Studies are ordered by continent, age group and study identifier.

Summary ROC plot Pf HRP‐2 and Pv pLDH for detection of P. vivax (verified with microscopy). The black circle corresponds to the summary estimate of sensitivity and specificity, and is shown with a 95% confidence region.

Non‐falciparum species only, microscopy, Type 2, ICT Combo Cassette.

Non‐falciparum species only, microscopy, Type 2, ICT Malaria Pf/Pv.

Non‐falciparum species only, microscopy, Type 2, NOW Malaria ICT.

Non‐falciparum species only, microscopy, Type 2, Malascan.

Non‐falciparum species only, microscopy, Type 2, VIKIA Ag Pf/Pan.

Non‐falciparum species only, microscopy, Type 2 (All).

Non‐falciparum species only, microscopy, Type 3, Parascreen.

Non‐falciparum species only, microscopy, Type 3, CareStart Pf/Pan.

Non‐falciparum species only, microscopy, Type 3, SD Malaria Antigen Bioline.

Non‐falciparum species only, microscopy, Type 3, First Response Malaria Combo.

Non‐falciparum species only, microscopy, Type 3, One Step Malaria Pf/Pan.

Non‐falciparum species only, microscopy, Type 3 (All).
Non‐falciparum species only, microscopy, Type 4, OptiMAL.

Non‐falciparum species only, microscopy, Type 4, OptiMAL‐IT.
Non‐falciparum species only, microscopy, Type 4, Carestart.

Non‐falciparum species only, microscopy, Type 4 (All).
Non‐falciparum species only, microscopy, Other Type, Malariagen Malaria.

Non‐falciparum species only, PCR, Type 3, CareStart Pf/Pan.

Non‐falciparum species only, PCR, Type 3, Parascreen.

Non‐falciparum species only, PCR, Type 3, One Step Malaria Pf/Pan.
Non‐falciparum species only, PCR, Type 3, SD Malaria Antigen Bioline.

Non‐falciparum species only, PCR, Type 3 (All).

Non‐falciparum species only, PCR, Type 4, OptiMAL (All).

P. vivax, microscopy, Pf HRP‐2 and Pv pLDH, Carestart Pf/Pv (All).
P. vivax, microscopy, Pf HRP‐2 and Pv pLDH, Biotech Malaria Pf/Pv.

P. vivax, microscopy, Pf HRP‐2 and Pv pLDH, Falcivax.
P. vivax, microscopy, Pf HRp‐2 and Pv pLDH, Onsite Pf/Pv.

P. vivax, microscopy, Pf HRP‐2 and Pv pLDH, Pf/Pv Malaria Device.

P. vivax, microscopy, Pf HRP‐2 and Pv pLDH (All).

P. vivax, PCR, Pf HRP‐2 and Pv pLDH, Falcivax.

P. vivax, PCR, Pf HRP‐2 and Pv pLDH, OnSite Pf/Pv.
P. vivax, PCR, Pf HRP‐2 and Pv pLDH, Pf/Pv Malaria Device.

P. vivax, PCR, Pf HRP‐2 and Pv pLDH (All).

P. vivax, PCR, Type 6, PALUTOP (All).
| Patients/populations | People presenting with symptoms suggestive of uncomplicated malaria | |||||
| Prior testing | None | |||||
| Settings | Ambulatory healthcare settings in P. vivax,P. malariae or P. ovale malaria endemic areas in Asia, Africa and South America | |||||
| Index tests | Immunochromatography‐based rapid diagnostic tests (RDTs) for non‐falciparum malaria in the absence of P. falciparum co‐infection, or P. vivax malaria with or without other malaria species | |||||
| Reference standard | Conventional microscopy, polymerase chain reaction (PCR) | |||||
| Importance | Accurate and fast diagnosis allows appropriate and quick treatment for malaria to be provided | |||||
| Studies | 37 unique publications reporting 47 studies (22,862 participants) | |||||
| Quality concerns | Poor reporting of patient characteristics, sampling method and reference standard methods were common concerns | |||||
| Test type | Quantity of evidence Number of evaluations (malaria cases/participants) | Average sensitivity (95% CI) | Average specificity (95% CI) | Prevalence (%) | Consequences in a cohort of 1000 | |
| Missed cases | False positives | |||||
| Target condition (reference standard): non‐falciparum malaria (microscopy) | ||||||
| Type 2 HRP‐2 (P. falciparum specific) and aldolase (pan‐specific) | 11 (958/6879) | 78% (73% to 82%) | 99% (97% to 99%) | 5 | 11 | 10 |
| 15 | 33 | 9 | ||||
| 30 | 66 | 7 | ||||
| Type 3 HRP‐2 (P. falciparum specific) and pLDH (pan‐specific) | 23 (1537/11,234) | 78% (69% to 84%) | 99% (98% to 99%) | 5 | 11 | 10 |
| 15 | 33 | 9 | ||||
| 30 | 66 | 7 | ||||
| Type 4 pLDH (P. falciparum specific) and pLDH (pan‐specific) | 10 (986/3831) | 89% (79% to 95%) | 98% (97% to 99%) | 5 | 6 | 19 |
| 15 | 17 | 17 | ||||
| 30 | 33 | 14 | ||||
| Target condition (reference standard): non‐falciparum malaria (PCR) | ||||||
| Type 3 HRP‐2 (P. falciparum specific) and pLDH (pan‐specific) | 5 (300/1639) | 81% (72% to 88%) | 99% (97% to 99%) | 5 | 10 | 10 |
| 15 | 29 | 9 | ||||
| 30 | 57 | 7 | ||||
| Target condition (reference standard): P.vivax with or without other malaria species (microscopy) | ||||||
| HRP‐2 (P. falciparum specific) and pLDH (P. vivax‐specific) | 8 (580/3682) | 95% (86% to 99%) | 99% (99% to 100%) | 5 | 3 | 10 |
| 15 | 8 | 9 | ||||
| 30 | 15 | 7 | ||||
| Conclusions: The majority of studies evaluated RDTs which are designed to differentiate falciparum malaria from non‐falciparum malaria, but cannot differentiate between different non‐falciparum species or identify non‐falciparum malaria species within a mixed infection. In these types of tests, specificity for non‐falciparum malaria in the absence ofP. falciparum infection was high, but sensitivity was low, tests missing between 11% and 22% of non‐falciparum cases. RDTs which are designed to detect P. vivax specifically, whether alone or part of a mixed infection, were more accurate with tests missing less than 5% of P. vivax cases. This review can help decision‐making about which RDT to use, in combination with other published information about in vitro test performance and stability in the field. | ||||||
| Type of test | Antigen combinations | Possible results |
| Type 1 | HRP‐2 (P. falciparum specific) | No Pf; Pf; invalid |
| Type 2 | HRP‐2 (P. falciparum specific) and aldolase (pan‐specific) | No malaria; Pf or mixed; Pv, Pf, or Pm; invalid |
| Type 3 | HRP‐2 (P. falciparum specific) and pLDH (pan‐specific) | No malaria; Pf or mixed; Pv, Pf, or Pm; invalid |
| Type 4 | pLDH (P. falciparum specific) and pLHD (pan‐specific) | No malaria; Pf or mixed; Pv, Pf, or Pm; invalid |
| Type 5 | pLDH (P. falciparum specific) and pLHD (P. vivax‐specific) | No malaria; Pf; Pv; Pf and Pv; invalid |
| Type 6 | HRP‐2 (P. falciparum specific), pLHD (pan‐specific) and pLDH (P. vivax specific) | No malaria; Pf and Pv ± Po and/or Pm; Pf ± Po and/or Pm; Pv ± Po or Pm; Po or Pm; invalid |
| Type 7 | Aldolase (pan‐specific) | No malaria; Pf, Pv, Po,or Pm; invalid |
| Other | HRP‐2 (P. falciparum specific) and pLDH (P. vivax specific) | No malaria; Pf; Pv; Pf and Pv; invalid |
| Zone | Endemic malaria parasites | Geographic area | Appropriate test type |
| 1 | P. falciparum only or other species almost always as a mixed infection | Most of sub‐Saharan Africa; lowland Papua New Guinea | Tests using HRP‐2 to detect P. falciparum only (Type 1) |
| 2 | Both P. falciparum and P. vivax, most commonly as a single species
| Asia and the Americas; Ethiopian highlands
| Combination RDTs which detect all species and distinguish between P. falciparum and P. vivax (Types 2 to 6) |
| 3 | Non‐falciparum only
| Vivax‐only areas of East Asia and Central Asia; some highland areas elsewhere | Pan‐specific or vivax‐specific RDTs (Type 7; Pan‐pLDH only; vivax‐pLDH only) |
| Type of RDT | Number of study cohorts (test evaluations) by reference standard | |
| Microscopy | PCR | |
| Non‐falciparum species in the absence of P. falciparum | ||
| Type 2 | 11 (11) | 0 (0) |
| Type 3 | 23 (25) | 5 (5) |
| Type 4 | 10 (11) | 1 (1) |
| Other type | 1 (1) | 0 (0) |
| P. vivax | ||
| Pf HRP2 and Pv pLDH | 8 (9) | 2 (3) |
| Type 6 | 0 (0) | 1 (1) |
| Study | Test | Number of false negatives | % false negatives indicating 'no malaria' | % false negatives indicating 'P. falciparum' |
| Type 2 tests | ||||
| ICT Combo | 37 | 22 | 78 | |
| ICT Malaria trial 1 | 16 | 13 | 88 | |
| ICT Malaria trial 2 | 6 | 67 | 33 | |
| ICT Malaria Pf/Pv | 29 | 100 | 0 | |
| ICT Malaria Pf/Pv | 3 | 67 | 33 | |
| ICT Malaria Pf/Pv | 13 | 62 | 38 | |
| Malascan | 18 | 67 | 33 | |
| ICT Malaria Pf/Pv | 8 | 75 | 25 | |
| NOW malaria ICT | 72 | 67 | 33 | |
| ICT Malaria Pf/Pv | 9 | 67 | 33 | |
| OptiMAL‐IT | 34 | 74 | 26 | |
| Median (range) | 67 (13 to 100) | 33 (0 to 88) | ||
| Pooled estimate (95% CI)* | 65 (43 to 81) | 35 (19 to 57) | ||
| Type 3 tests | ||||
| Carestart | 37 | 22 | 78 | |
| Parascreen | 43 | 14 | 86 | |
| Parascreen | 19 | 84 | 16 | |
| First response | 7 | 100 | 0 | |
| Diamed OptiMAL | 3 | 100 | 0 | |
| CareStart | 3 | 100 | 0 | |
| Parascreen | 5 | 60 | 40 | |
| SD Bioline | 133 | 89 | 11 | |
| Carestart | 38 | 89 | 11 | |
| SD Malaria Antigen Bioline | 4 | 100 | 0 | |
| Parascreen | 13 | 54 | 46 | |
| First response | 9 | 33 | 67 | |
| ParaHIT Total | 48 | 92 | 8 | |
| SD Malaria Ag Pf/Pan | 18 | 78 | 22 | |
| Pf/Pan Device | 24 | 25 | 75 | |
| Median (range) | 84 (14 to 100) | 16 (0 to 86) | ||
| Pooled estimate (95% CI) | 74 (52 to 88) | 26 (12 to 48) | ||
| Type 4 tests | ||||
| OptiMAL‐IT | 0 | 0 | 0 | |
| OptiMAL | 3 | 100 | 0 | |
| SD Malaria | 2 | 100 | 0 | |
| OptiMAL | 23 | 100 | 0 | |
| OptiMAL‐IT | 30 | 100 | 0 | |
| OptiMAL‐IT | 26 | 65 | 35 | |
| OptiMAL‐IT | 2 | 100 | 0 | |
| Carestart Malaria | 3 | 33 | 67 | |
| OptiMAL (field) | 0 | 0 | 0 | |
| OptiMAL | 3 | 100 | 0 | |
| OptiMAL | 13 | 77 | 23 | |
| Median (range) | 100 (0 to 100) | 0 (0 to 67) | ||
| Pooled estimate (95% CI) | 87 (79 to 92) | 13 (8 to 21) | ||
| *The pooled estimates of the percentage of false negatives indicating 'no malaria' and the percentage of false negatives indicating 'P. falciparum' were computed by using a random effects logistic regression model for Type 2 and Type 3. A fixed effects logistic regression model was used for Type 4. This table shows participants with non‐falciparum malaria monoinfection identified by microscopy who were negative by non‐falciparum monoinfection by RDT, by whether the RDT incorrectly identified the participant as not having malaria, or as having P. falciparum malaria. | ||||
| RDT Type | Study cohort | Participants | Malaria cases | Pooled sensitivity (95% CI) (%) | Pooled specificity (95% CI) (%) | Test1 |
| Type 2 | 11 | 6879 | 958 | 78 (73 to 82) | 99 (97 to 99) | P = 0.008 |
| Type 3 | 23 | 11,234 | 1537 | 78 (69 to 85) | 99 (98 to 99) | |
| Type 4 | 10 | 3831 | 986 | 90 (79 to 95) | 98 (97 to 99) | |
| Other type | 1 | 262 | 12 | 92 (62 to 100) | 95 (92 to 98) | |
| 1Likelihood ratio test for evidence of a difference in sensitivity or specificity, or both, between Types 2, 3, and 4. *Only one test brand (randomly selected) from each cohort is included in the analysis of each type. | ||||||
| Ratio of sensitivity (95% CI), P value for comparison Ratio of specificity (95% CI), P value for comparison |
| Type 2 | Type 3 | |
| Studies (participants) | 11 (6879) | 23 (11,234) | ||
|
| Studies (participants) | Sensitivity (95% CI) Specificity (95% CI) | 78 (73 to 82) 99 (97 to 99) | 78 (69 to 84) 99 (98 to 99) |
| Type 2 | 11 (6879) | 78 (73 to 82) 99 (97 to 99) | ‐ | ‐ |
| Type 3 | 23 (11,234) | 78 (69 to 84) 99 (98 to 99) | 1.00 (0.89 to 1.12), P = 1.00 1.00 (0.99 to 1.01), P = 0.87 | ‐ |
| Type 4 | 10 (3831) | 90 (79 to 95) 98 (97 to 99) | 0.87 (0.78 to 0.96), P = 0.01 1.00 (0.99 to 1.02), P = 0.52 | 0.87 (0.76 to 0.99), P = 0.03 1.01 (1.00 to 1.02), P = 0.29 |
| We computed the ratio of sensitivities and specificities by division of the sensitivity and specificity for the column by the sensitivity and specificity for the row. If the ratio of sensitivities is greater than one, the sensitivity of the test for the column is higher than that for the row; if less than one, the sensitivity of the test in the row is higher than in the column. The same applies to the ratio of specificities. | ||||
| Test | No. of studies | No. of participants |
| 1 Non‐falciparum species only, microscopy, Type 2, ICT Combo Cassette Show forest plot | 1 | 2383 |
| 2 Non‐falciparum species only, microscopy, Type 2, ICT Malaria Pf/Pv Show forest plot | 7 | 3151 |
| 3 Non‐falciparum species only, microscopy, Type 2, NOW Malaria ICT Show forest plot | 1 | 246 |
| 4 Non‐falciparum species only, microscopy, Type 2, Malascan Show forest plot | 1 | 372 |
| 5 Non‐falciparum species only, microscopy, Type 2, VIKIA Ag Pf/Pan Show forest plot | 1 | 727 |
| 6 Non‐falciparum species only, microscopy, Type 2 (All) Show forest plot | 11 | 6879 |
| 7 Non‐falciparum species only, microscopy, Type 3, Parascreen Show forest plot | 14 | 5407 |
| 8 Non‐falciparum species only, microscopy, Type 3, CareStart Pf/Pan Show forest plot | 4 | 3544 |
| 9 Non‐falciparum species only, microscopy, Type 3, SD Malaria Antigen Bioline Show forest plot | 4 | 3769 |
| 10 Non‐falciparum species only, microscopy, Type 3, First Response Malaria Combo Show forest plot | 2 | 663 |
| 11 Non‐falciparum species only, microscopy, Type 3, One Step Malaria Pf/Pan Show forest plot | 1 | 606 |
| 12 Non‐falciparum species only, microscopy, Type 3 (All) Show forest plot | 23 | 11234 |
| 13 Non‐falciparum species only, microscopy, Type 4, OptiMAL Show forest plot | 6 | 1843 |
| 14 Non‐falciparum species only, microscopy, Type 4, OptiMAL‐IT Show forest plot | 4 | 1987 |
| 15 Non‐falciparum species only, microscopy, Type 4, Carestart Show forest plot | 1 | 195 |
| 16 Non‐falciparum species only, microscopy, Type 4 (All) Show forest plot | 10 | 3831 |
| 17 Non‐falciparum species only, microscopy, Other Type, Malariagen Malaria Show forest plot | 1 | 262 |
| 18 Non‐falciparum species only, PCR, Type 3, CareStart Pf/Pan Show forest plot | 1 | 178 |
| 19 Non‐falciparum species only, PCR, Type 3, Parascreen Show forest plot | 2 | 659 |
| 20 Non‐falciparum species only, PCR, Type 3, One Step Malaria Pf/Pan Show forest plot | 1 | 606 |
| 21 Non‐falciparum species only, PCR, Type 3, SD Malaria Antigen Bioline Show forest plot | 1 | 196 |
| 22 Non‐falciparum species only, PCR, Type 3 (All) Show forest plot | 5 | 1639 |
| 23 Non‐falciparum species only, PCR, Type 4, OptiMAL (All) Show forest plot | 1 | 313 |
| 24 P. vivax, microscopy, Pf HRP‐2 and Pv pLDH, Carestart Pf/Pv (All) Show forest plot | 3 | 2000 |
| 25 P. vivax, microscopy, Pf HRP‐2 and Pv pLDH, Biotech Malaria Pf/Pv Show forest plot | 1 | 250 |
| 26 P. vivax, microscopy, Pf HRP‐2 and Pv pLDH, Falcivax Show forest plot | 2 | 710 |
| 27 P. vivax, microscopy, Pf HRp‐2 and Pv pLDH, Onsite Pf/Pv Show forest plot | 2 | 710 |
| 28 P. vivax, microscopy, Pf HRP‐2 and Pv pLDH, Pf/Pv Malaria Device Show forest plot | 1 | 350 |
| 29 P. vivax, microscopy, Pf HRP‐2 and Pv pLDH (All) Show forest plot | 8 | 3682 |
| 30 P. vivax, PCR, Pf HRP‐2 and Pv pLDH, Falcivax Show forest plot | 1 | 338 |
| 31 P. vivax, PCR, Pf HRP‐2 and Pv pLDH, OnSite Pf/Pv Show forest plot | 1 | 338 |
| 32 P. vivax, PCR, Pf HRP‐2 and Pv pLDH, Pf/Pv Malaria Device Show forest plot | 1 | 350 |
| 33 P. vivax, PCR, Pf HRP‐2 and Pv pLDH (All) Show forest plot | 2 | 688 |
| 34 P. vivax, PCR, Type 6, PALUTOP (All) Show forest plot | 1 | 313 |