استفاده از تستهای تشخیصی سریع به منظور تشخیص مالاریا غیر از فالسیپاروم یا پلاسمودیوم ویواکس بدون عارضه در کشورهای آندمی
Information
- DOI:
- https://doi.org/10.1002/14651858.CD011431Copy DOI

- Database:
-
- Cochrane Database of Systematic Reviews
- Version published:
-
- 18 December 2014see what's new
- Type:
-
- Diagnostic
- Stage:
-
- Review
- Cochrane Editorial Group:
-
Cochrane Infectious Diseases Group
- Classified:
-
- No update planned
Review superseded
This Cochrane Review has been superseded by Choi 2019 https://doi.org/10.1002/14651858.CD013218Assessed: 12 April 2019
- No update planned
- Copyright:
-
- Copyright © 2015 The Authors. Cochrane Database of Systematic Reviews published by John Wiley & Sons, Ltd. on behalf of The Cochrane Collaboration.
- This is an open access article under the terms of the Creative Commons Attribution‐Non‐Commercial Licence, which permits use, distribution and reproduction in any medium, provided the original work is properly cited and is not used for commercial purposes.
Article metrics
Altmetric:
Cited by:
Authors
Contributions of authors
The review authors jointly developed the protocol. Katharine Abba applied inclusion criteria, oversaw the data extractions and entered the data. Yemisi Takwoingi, Sarah Donegan, Amanda Kirkham and Jon Deeks performed statistical analyses. All review authors contributed to the final manuscript.
Sources of support
Internal sources
-
International Medical University, Malaysia.
Research grant ID 134/2007
-
Liverpool School of Tropical Medicine, UK.
External sources
-
Department for International Development, UK.
Research Programme Grant
Declarations of interest
PG is Director of Evidence Building and Synthesis Research Consortium that receives money to increase the number of evidence‐informed decisions by intermediary organizations, including WHO and national decision‐makers that benefit the poor in middle‐ and low‐income countries. PG is the coordinator of a WHO Collaborating Centre for Evidence Synthesis for Infectious and Tropical Diseases; one of the Centre's aims is to help WHO in its role as an infomediary in communicating reliable summaries of research evidence to policy makers, clinicians, teachers, and the public in developing countries.
Acknowledgements
The academic editor for this review was Dr Karen Steingart.
We are grateful to our affiliated institutions and organizations, and to the Department of International Development (DFID), UK for research grants. We acknowledge the referees for their comments. Also, we thank Nicola Mayan and Sally Jackson for helping with data extraction.
The editorial base for the Cochrane Infectious Diseases Group is funded by UKaid from the UK Government for the benefit of developing countries.
Version history
| Published | Title | Stage | Authors | Version |
| 2014 Dec 18 | Rapid diagnostic tests for diagnosing uncomplicated non‐falciparum or <i>Plasmodium vivax</i> malaria in endemic countries | Review | Katharine Abba, Amanda J Kirkham, Piero L Olliaro, Jonathan J Deeks, Sarah Donegan, Paul Garner, Yemisi Takwoingi | |
Differences between protocol and review
In the protocol, we considered RDTs for the detection of P. falciparum and non‐falciparum malaria within one Cochrane Review. However, it became apparent during production of the review that such a publication would be very large. For this reason we decided to split results for the different target conditions into two separate Cochrane Reviews.
In the protocol, we stated that in the search for eligible studies we would contact test manufacturers to identify any unpublished studies, handsearch conference proceedings and contact study authors and other experts for information on ongoing and unpublished studies. However, due to the number of citations returned by our search (over 4000) and the large size of the reviews, we did not have the resources to undertake any of these additional search methods, and the methods stated in the review reflect this.
Since the publication of the protocol, we added three additional exclusion criteria relating to study eligibility. We excluded studies if the study authors used active case detection to recruit participants, as we felt the threshold of symptoms leading to testing may be lower than for a self‐selecting sample attending healthcare facilities and that this may influence the findings. We also excluded studies if they did not present sufficient data to allow us to extract or calculate absolute numbers of true positives, false positives, false negatives and true negatives, as we considered it would be distracting to the reader to present data on studies that did not contribute to the analyses. Due to resource constraints, we excluded studies if they were written in non‐English languages, or if they did not provide enough information to enable a full assessment of their eligibility for the review.
Keywords
MeSH
Medical Subject Headings (MeSH) Keywords
- Antigens, Protozoan [*analysis];
- Cohort Studies;
- Malaria [*diagnosis, immunology, parasitology];
- Malaria, Vivax [*diagnosis, immunology];
- Microscopy;
- Parasitemia [diagnosis];
- Plasmodium [*immunology];
- Plasmodium vivax [immunology];
- Polymerase Chain Reaction;
- Reagent Kits, Diagnostic [*parasitology];
- Sensitivity and Specificity;
- Species Specificity;
Medical Subject Headings Check Words
Humans;


Methodological quality graph: review authors' judgements about each methodological quality item presented as percentages across all included studies.

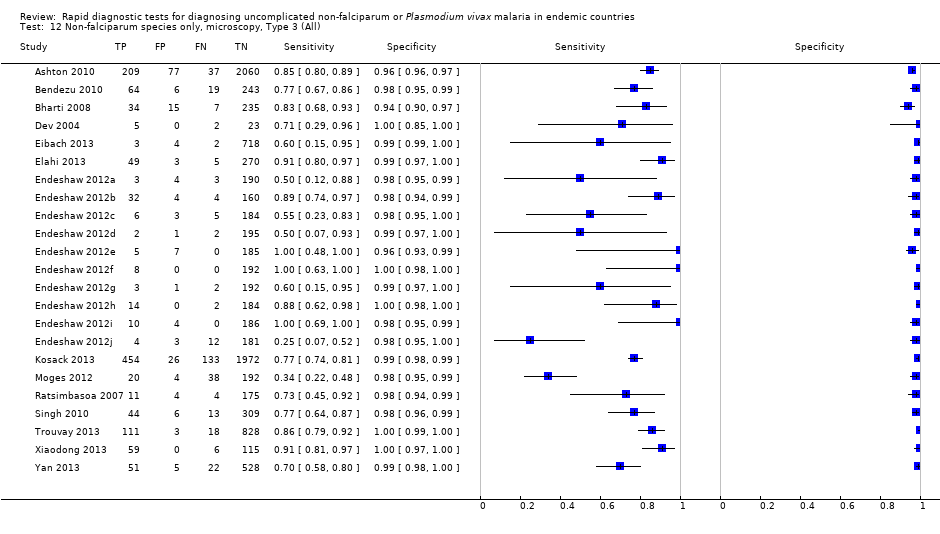
Forest plot of commercial brands of Type 2 tests for detection of non‐falciparum species (verified with microscopy). We ordered studies by continent, age group and study identifier.

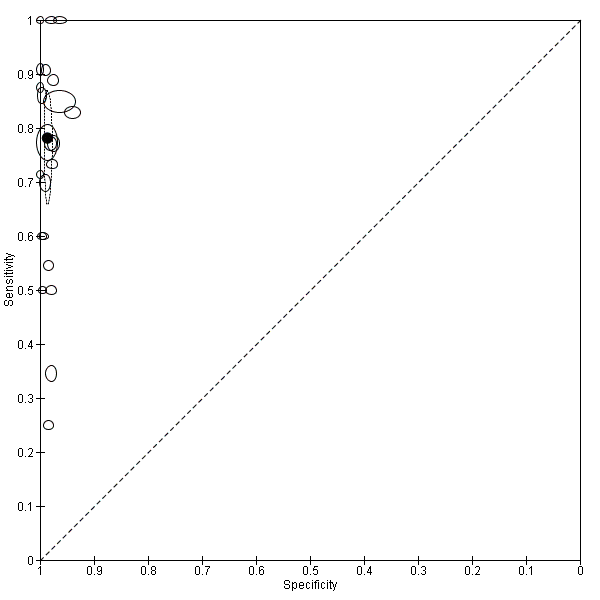
Summary ROC plot of Type 2 tests for detection of non‐falciparum species (verified with microscopy). The black solid circle corresponds to the summary estimate of sensitivity and specificity, and is shown with a 95% confidence region.

Forest plot of commercial brands of Type 3 tests for detection of non‐falciparum species (verified with microscopy). We ordered studies by continent, age group and study identifier.
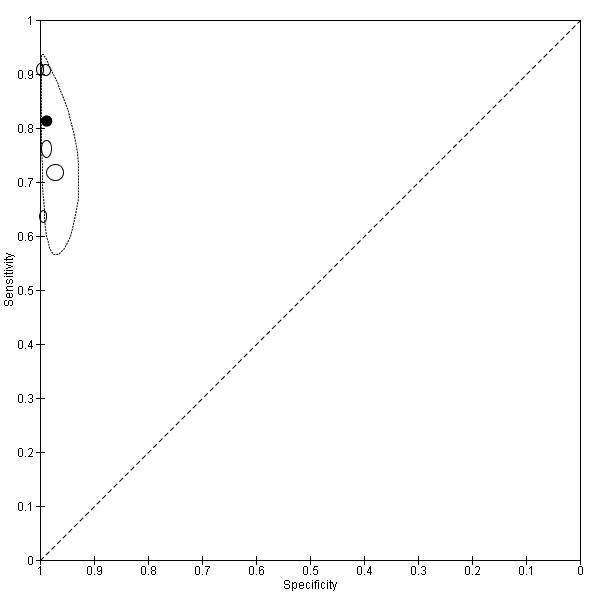
Summary ROC plot of Type 3 tests for detection of non‐falciparum species (verified with microscopy). The black solid circle corresponds to the summary estimate of sensitivity and specificity, and is shown with a 95% confidence region.

Forest plot of commercial brands of Type 4 tests for detection of non‐falciparum species (verified with microscopy). We ordered studies by continent, age group and study identifier.

Summary ROC plot of Type 4 tests for detection of non‐falciparum species (verified with microscopy). The black circle corresponds to the summary estimate of sensitivity and specificity, and is shown with a 95% confidence region.

Forest plot of Type 2, Type 3 and Type 4 tests for detection of non‐falciparum species (verified with microscopy). We ordered studies by continent, age group and study identifier.

Summary ROC plot comparing Type 2, Type 3 and Type 4 tests for detection of non‐falciparum species (verified with microscopy). The solid circles correspond to the summary estimates of sensitivity and specificity for each test type, and are shown with 95% confidence regions (dotted lines) and 95% prediction regions (dashed lines). The summary points for Type 2 and Type 3 and their 95% confidence regions are identical but the 95% prediction regions differ. The 95% prediction regions illustrate the extent of between study heterogeneity.
Summary ROC plot of Type 3 tests for detection of non‐falciparum species (verified with PCR). The solid circles correspond to the summary estimate of sensitivity and specificity, and is shown with a 95% confidence region.

Forest plot of Pf HRP‐2 and Pv pLDH for detection of P. vivax (verified with microscopy). Studies are ordered by continent, age group and study identifier.

Summary ROC plot Pf HRP‐2 and Pv pLDH for detection of P. vivax (verified with microscopy). The black circle corresponds to the summary estimate of sensitivity and specificity, and is shown with a 95% confidence region.
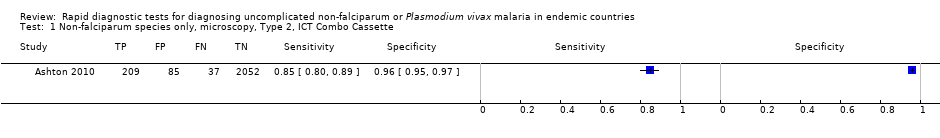
Non‐falciparum species only, microscopy, Type 2, ICT Combo Cassette.

Non‐falciparum species only, microscopy, Type 2, ICT Malaria Pf/Pv.

Non‐falciparum species only, microscopy, Type 2, NOW Malaria ICT.

Non‐falciparum species only, microscopy, Type 2, Malascan.

Non‐falciparum species only, microscopy, Type 2, VIKIA Ag Pf/Pan.

Non‐falciparum species only, microscopy, Type 2 (All).

Non‐falciparum species only, microscopy, Type 3, Parascreen.

Non‐falciparum species only, microscopy, Type 3, CareStart Pf/Pan.

Non‐falciparum species only, microscopy, Type 3, SD Malaria Antigen Bioline.

Non‐falciparum species only, microscopy, Type 3, First Response Malaria Combo.

Non‐falciparum species only, microscopy, Type 3, One Step Malaria Pf/Pan.
Non‐falciparum species only, microscopy, Type 3 (All).

Non‐falciparum species only, microscopy, Type 4, OptiMAL.

Non‐falciparum species only, microscopy, Type 4, OptiMAL‐IT.

Non‐falciparum species only, microscopy, Type 4, Carestart.

Non‐falciparum species only, microscopy, Type 4 (All).

Non‐falciparum species only, microscopy, Other Type, Malariagen Malaria.

Non‐falciparum species only, PCR, Type 3, CareStart Pf/Pan.

Non‐falciparum species only, PCR, Type 3, Parascreen.

Non‐falciparum species only, PCR, Type 3, One Step Malaria Pf/Pan.

Non‐falciparum species only, PCR, Type 3, SD Malaria Antigen Bioline.

Non‐falciparum species only, PCR, Type 3 (All).

Non‐falciparum species only, PCR, Type 4, OptiMAL (All).
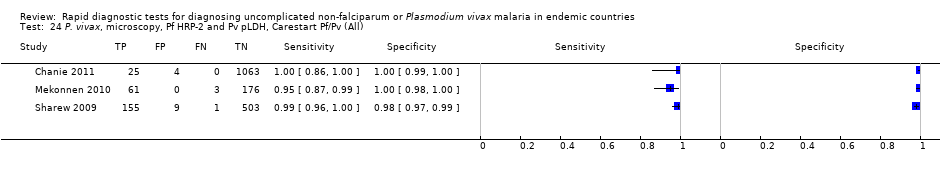
P. vivax, microscopy, Pf HRP‐2 and Pv pLDH, Carestart Pf/Pv (All).
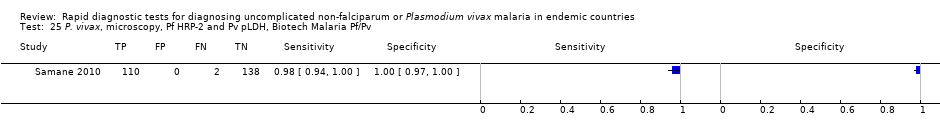
P. vivax, microscopy, Pf HRP‐2 and Pv pLDH, Biotech Malaria Pf/Pv.
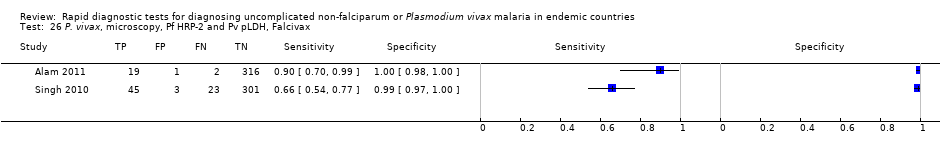
P. vivax, microscopy, Pf HRP‐2 and Pv pLDH, Falcivax.

P. vivax, microscopy, Pf HRp‐2 and Pv pLDH, Onsite Pf/Pv.

P. vivax, microscopy, Pf HRP‐2 and Pv pLDH, Pf/Pv Malaria Device.

P. vivax, microscopy, Pf HRP‐2 and Pv pLDH (All).
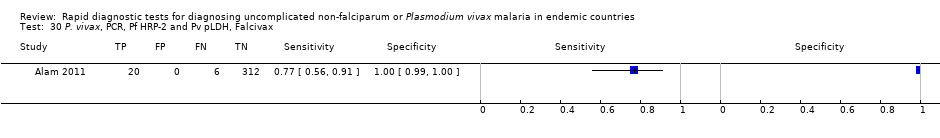
P. vivax, PCR, Pf HRP‐2 and Pv pLDH, Falcivax.

P. vivax, PCR, Pf HRP‐2 and Pv pLDH, OnSite Pf/Pv.
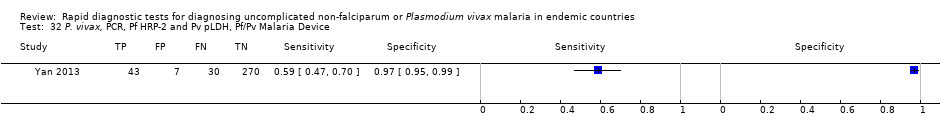
P. vivax, PCR, Pf HRP‐2 and Pv pLDH, Pf/Pv Malaria Device.

P. vivax, PCR, Pf HRP‐2 and Pv pLDH (All).

P. vivax, PCR, Type 6, PALUTOP (All).
| Patients/populations | People presenting with symptoms suggestive of uncomplicated malaria | |||||
| Prior testing | None | |||||
| Settings | Ambulatory healthcare settings in P. vivax,P. malariae or P. ovale malaria endemic areas in Asia, Africa and South America | |||||
| Index tests | Immunochromatography‐based rapid diagnostic tests (RDTs) for non‐falciparum malaria in the absence of P. falciparum co‐infection, or P. vivax malaria with or without other malaria species | |||||
| Reference standard | Conventional microscopy, polymerase chain reaction (PCR) | |||||
| Importance | Accurate and fast diagnosis allows appropriate and quick treatment for malaria to be provided | |||||
| Studies | 37 unique publications reporting 47 studies (22,862 participants) | |||||
| Quality concerns | Poor reporting of patient characteristics, sampling method and reference standard methods were common concerns | |||||
| Test type | Quantity of evidence Number of evaluations (malaria cases/participants) | Average sensitivity (95% CI) | Average specificity (95% CI) | Prevalence (%) | Consequences in a cohort of 1000 | |
| Missed cases | False positives | |||||
| Target condition (reference standard): non‐falciparum malaria (microscopy) | ||||||
| Type 2 HRP‐2 (P. falciparum specific) and aldolase (pan‐specific) | 11 (958/6879) | 78% (73% to 82%) | 99% (97% to 99%) | 5 | 11 | 10 |
| 15 | 33 | 9 | ||||
| 30 | 66 | 7 | ||||
| Type 3 HRP‐2 (P. falciparum specific) and pLDH (pan‐specific) | 23 (1537/11,234) | 78% (69% to 84%) | 99% (98% to 99%) | 5 | 11 | 10 |
| 15 | 33 | 9 | ||||
| 30 | 66 | 7 | ||||
| Type 4 pLDH (P. falciparum specific) and pLDH (pan‐specific) | 10 (986/3831) | 89% (79% to 95%) | 98% (97% to 99%) | 5 | 6 | 19 |
| 15 | 17 | 17 | ||||
| 30 | 33 | 14 | ||||
| Target condition (reference standard): non‐falciparum malaria (PCR) | ||||||
| Type 3 HRP‐2 (P. falciparum specific) and pLDH (pan‐specific) | 5 (300/1639) | 81% (72% to 88%) | 99% (97% to 99%) | 5 | 10 | 10 |
| 15 | 29 | 9 | ||||
| 30 | 57 | 7 | ||||
| Target condition (reference standard): P.vivax with or without other malaria species (microscopy) | ||||||
| HRP‐2 (P. falciparum specific) and pLDH (P. vivax‐specific) | 8 (580/3682) | 95% (86% to 99%) | 99% (99% to 100%) | 5 | 3 | 10 |
| 15 | 8 | 9 | ||||
| 30 | 15 | 7 | ||||
| Conclusions: The majority of studies evaluated RDTs which are designed to differentiate falciparum malaria from non‐falciparum malaria, but cannot differentiate between different non‐falciparum species or identify non‐falciparum malaria species within a mixed infection. In these types of tests, specificity for non‐falciparum malaria in the absence ofP. falciparum infection was high, but sensitivity was low, tests missing between 11% and 22% of non‐falciparum cases. RDTs which are designed to detect P. vivax specifically, whether alone or part of a mixed infection, were more accurate with tests missing less than 5% of P. vivax cases. This review can help decision‐making about which RDT to use, in combination with other published information about in vitro test performance and stability in the field. | ||||||
| Type of test | Antigen combinations | Possible results |
| Type 1 | HRP‐2 (P. falciparum specific) | No Pf; Pf; invalid |
| Type 2 | HRP‐2 (P. falciparum specific) and aldolase (pan‐specific) | No malaria; Pf or mixed; Pv, Pf, or Pm; invalid |
| Type 3 | HRP‐2 (P. falciparum specific) and pLDH (pan‐specific) | No malaria; Pf or mixed; Pv, Pf, or Pm; invalid |
| Type 4 | pLDH (P. falciparum specific) and pLHD (pan‐specific) | No malaria; Pf or mixed; Pv, Pf, or Pm; invalid |
| Type 5 | pLDH (P. falciparum specific) and pLHD (P. vivax‐specific) | No malaria; Pf; Pv; Pf and Pv; invalid |
| Type 6 | HRP‐2 (P. falciparum specific), pLHD (pan‐specific) and pLDH (P. vivax specific) | No malaria; Pf and Pv ± Po and/or Pm; Pf ± Po and/or Pm; Pv ± Po or Pm; Po or Pm; invalid |
| Type 7 | Aldolase (pan‐specific) | No malaria; Pf, Pv, Po,or Pm; invalid |
| Other | HRP‐2 (P. falciparum specific) and pLDH (P. vivax specific) | No malaria; Pf; Pv; Pf and Pv; invalid |
| Zone | Endemic malaria parasites | Geographic area | Appropriate test type |
| 1 | P. falciparum only or other species almost always as a mixed infection | Most of sub‐Saharan Africa; lowland Papua New Guinea | Tests using HRP‐2 to detect P. falciparum only (Type 1) |
| 2 | Both P. falciparum and P. vivax, most commonly as a single species
| Asia and the Americas; Ethiopian highlands
| Combination RDTs which detect all species and distinguish between P. falciparum and P. vivax (Types 2 to 6) |
| 3 | Non‐falciparum only
| Vivax‐only areas of East Asia and Central Asia; some highland areas elsewhere | Pan‐specific or vivax‐specific RDTs (Type 7; Pan‐pLDH only; vivax‐pLDH only) |
| Type of RDT | Number of study cohorts (test evaluations) by reference standard | |
| Microscopy | PCR | |
| Non‐falciparum species in the absence of P. falciparum | ||
| Type 2 | 11 (11) | 0 (0) |
| Type 3 | 23 (25) | 5 (5) |
| Type 4 | 10 (11) | 1 (1) |
| Other type | 1 (1) | 0 (0) |
| P. vivax | ||
| Pf HRP2 and Pv pLDH | 8 (9) | 2 (3) |
| Type 6 | 0 (0) | 1 (1) |
| Study | Test | Number of false negatives | % false negatives indicating 'no malaria' | % false negatives indicating 'P. falciparum' |
| Type 2 tests | ||||
| ICT Combo | 37 | 22 | 78 | |
| ICT Malaria trial 1 | 16 | 13 | 88 | |
| ICT Malaria trial 2 | 6 | 67 | 33 | |
| ICT Malaria Pf/Pv | 29 | 100 | 0 | |
| ICT Malaria Pf/Pv | 3 | 67 | 33 | |
| ICT Malaria Pf/Pv | 13 | 62 | 38 | |
| Malascan | 18 | 67 | 33 | |
| ICT Malaria Pf/Pv | 8 | 75 | 25 | |
| NOW malaria ICT | 72 | 67 | 33 | |
| ICT Malaria Pf/Pv | 9 | 67 | 33 | |
| OptiMAL‐IT | 34 | 74 | 26 | |
| Median (range) | 67 (13 to 100) | 33 (0 to 88) | ||
| Pooled estimate (95% CI)* | 65 (43 to 81) | 35 (19 to 57) | ||
| Type 3 tests | ||||
| Carestart | 37 | 22 | 78 | |
| Parascreen | 43 | 14 | 86 | |
| Parascreen | 19 | 84 | 16 | |
| First response | 7 | 100 | 0 | |
| Diamed OptiMAL | 3 | 100 | 0 | |
| CareStart | 3 | 100 | 0 | |
| Parascreen | 5 | 60 | 40 | |
| SD Bioline | 133 | 89 | 11 | |
| Carestart | 38 | 89 | 11 | |
| SD Malaria Antigen Bioline | 4 | 100 | 0 | |
| Parascreen | 13 | 54 | 46 | |
| First response | 9 | 33 | 67 | |
| ParaHIT Total | 48 | 92 | 8 | |
| SD Malaria Ag Pf/Pan | 18 | 78 | 22 | |
| Pf/Pan Device | 24 | 25 | 75 | |
| Median (range) | 84 (14 to 100) | 16 (0 to 86) | ||
| Pooled estimate (95% CI) | 74 (52 to 88) | 26 (12 to 48) | ||
| Type 4 tests | ||||
| OptiMAL‐IT | 0 | 0 | 0 | |
| OptiMAL | 3 | 100 | 0 | |
| SD Malaria | 2 | 100 | 0 | |
| OptiMAL | 23 | 100 | 0 | |
| OptiMAL‐IT | 30 | 100 | 0 | |
| OptiMAL‐IT | 26 | 65 | 35 | |
| OptiMAL‐IT | 2 | 100 | 0 | |
| Carestart Malaria | 3 | 33 | 67 | |
| OptiMAL (field) | 0 | 0 | 0 | |
| OptiMAL | 3 | 100 | 0 | |
| OptiMAL | 13 | 77 | 23 | |
| Median (range) | 100 (0 to 100) | 0 (0 to 67) | ||
| Pooled estimate (95% CI) | 87 (79 to 92) | 13 (8 to 21) | ||
| *The pooled estimates of the percentage of false negatives indicating 'no malaria' and the percentage of false negatives indicating 'P. falciparum' were computed by using a random effects logistic regression model for Type 2 and Type 3. A fixed effects logistic regression model was used for Type 4. This table shows participants with non‐falciparum malaria monoinfection identified by microscopy who were negative by non‐falciparum monoinfection by RDT, by whether the RDT incorrectly identified the participant as not having malaria, or as having P. falciparum malaria. | ||||
| RDT Type | Study cohort | Participants | Malaria cases | Pooled sensitivity (95% CI) (%) | Pooled specificity (95% CI) (%) | Test1 |
| Type 2 | 11 | 6879 | 958 | 78 (73 to 82) | 99 (97 to 99) | P = 0.008 |
| Type 3 | 23 | 11,234 | 1537 | 78 (69 to 85) | 99 (98 to 99) | |
| Type 4 | 10 | 3831 | 986 | 90 (79 to 95) | 98 (97 to 99) | |
| Other type | 1 | 262 | 12 | 92 (62 to 100) | 95 (92 to 98) | |
| 1Likelihood ratio test for evidence of a difference in sensitivity or specificity, or both, between Types 2, 3, and 4. *Only one test brand (randomly selected) from each cohort is included in the analysis of each type. | ||||||
| Ratio of sensitivity (95% CI), P value for comparison Ratio of specificity (95% CI), P value for comparison |
| Type 2 | Type 3 | |
| Studies (participants) | 11 (6879) | 23 (11,234) | ||
|
| Studies (participants) | Sensitivity (95% CI) Specificity (95% CI) | 78 (73 to 82) 99 (97 to 99) | 78 (69 to 84) 99 (98 to 99) |
| Type 2 | 11 (6879) | 78 (73 to 82) 99 (97 to 99) | ‐ | ‐ |
| Type 3 | 23 (11,234) | 78 (69 to 84) 99 (98 to 99) | 1.00 (0.89 to 1.12), P = 1.00 1.00 (0.99 to 1.01), P = 0.87 | ‐ |
| Type 4 | 10 (3831) | 90 (79 to 95) 98 (97 to 99) | 0.87 (0.78 to 0.96), P = 0.01 1.00 (0.99 to 1.02), P = 0.52 | 0.87 (0.76 to 0.99), P = 0.03 1.01 (1.00 to 1.02), P = 0.29 |
| We computed the ratio of sensitivities and specificities by division of the sensitivity and specificity for the column by the sensitivity and specificity for the row. If the ratio of sensitivities is greater than one, the sensitivity of the test for the column is higher than that for the row; if less than one, the sensitivity of the test in the row is higher than in the column. The same applies to the ratio of specificities. | ||||
| Test | No. of studies | No. of participants |
| 1 Non‐falciparum species only, microscopy, Type 2, ICT Combo Cassette Show forest plot | 1 | 2383 |
| 2 Non‐falciparum species only, microscopy, Type 2, ICT Malaria Pf/Pv Show forest plot | 7 | 3151 |
| 3 Non‐falciparum species only, microscopy, Type 2, NOW Malaria ICT Show forest plot | 1 | 246 |
| 4 Non‐falciparum species only, microscopy, Type 2, Malascan Show forest plot | 1 | 372 |
| 5 Non‐falciparum species only, microscopy, Type 2, VIKIA Ag Pf/Pan Show forest plot | 1 | 727 |
| 6 Non‐falciparum species only, microscopy, Type 2 (All) Show forest plot | 11 | 6879 |
| 7 Non‐falciparum species only, microscopy, Type 3, Parascreen Show forest plot | 14 | 5407 |
| 8 Non‐falciparum species only, microscopy, Type 3, CareStart Pf/Pan Show forest plot | 4 | 3544 |
| 9 Non‐falciparum species only, microscopy, Type 3, SD Malaria Antigen Bioline Show forest plot | 4 | 3769 |
| 10 Non‐falciparum species only, microscopy, Type 3, First Response Malaria Combo Show forest plot | 2 | 663 |
| 11 Non‐falciparum species only, microscopy, Type 3, One Step Malaria Pf/Pan Show forest plot | 1 | 606 |
| 12 Non‐falciparum species only, microscopy, Type 3 (All) Show forest plot | 23 | 11234 |
| 13 Non‐falciparum species only, microscopy, Type 4, OptiMAL Show forest plot | 6 | 1843 |
| 14 Non‐falciparum species only, microscopy, Type 4, OptiMAL‐IT Show forest plot | 4 | 1987 |
| 15 Non‐falciparum species only, microscopy, Type 4, Carestart Show forest plot | 1 | 195 |
| 16 Non‐falciparum species only, microscopy, Type 4 (All) Show forest plot | 10 | 3831 |
| 17 Non‐falciparum species only, microscopy, Other Type, Malariagen Malaria Show forest plot | 1 | 262 |
| 18 Non‐falciparum species only, PCR, Type 3, CareStart Pf/Pan Show forest plot | 1 | 178 |
| 19 Non‐falciparum species only, PCR, Type 3, Parascreen Show forest plot | 2 | 659 |
| 20 Non‐falciparum species only, PCR, Type 3, One Step Malaria Pf/Pan Show forest plot | 1 | 606 |
| 21 Non‐falciparum species only, PCR, Type 3, SD Malaria Antigen Bioline Show forest plot | 1 | 196 |
| 22 Non‐falciparum species only, PCR, Type 3 (All) Show forest plot | 5 | 1639 |
| 23 Non‐falciparum species only, PCR, Type 4, OptiMAL (All) Show forest plot | 1 | 313 |
| 24 P. vivax, microscopy, Pf HRP‐2 and Pv pLDH, Carestart Pf/Pv (All) Show forest plot | 3 | 2000 |
| 25 P. vivax, microscopy, Pf HRP‐2 and Pv pLDH, Biotech Malaria Pf/Pv Show forest plot | 1 | 250 |
| 26 P. vivax, microscopy, Pf HRP‐2 and Pv pLDH, Falcivax Show forest plot | 2 | 710 |
| 27 P. vivax, microscopy, Pf HRp‐2 and Pv pLDH, Onsite Pf/Pv Show forest plot | 2 | 710 |
| 28 P. vivax, microscopy, Pf HRP‐2 and Pv pLDH, Pf/Pv Malaria Device Show forest plot | 1 | 350 |
| 29 P. vivax, microscopy, Pf HRP‐2 and Pv pLDH (All) Show forest plot | 8 | 3682 |
| 30 P. vivax, PCR, Pf HRP‐2 and Pv pLDH, Falcivax Show forest plot | 1 | 338 |
| 31 P. vivax, PCR, Pf HRP‐2 and Pv pLDH, OnSite Pf/Pv Show forest plot | 1 | 338 |
| 32 P. vivax, PCR, Pf HRP‐2 and Pv pLDH, Pf/Pv Malaria Device Show forest plot | 1 | 350 |
| 33 P. vivax, PCR, Pf HRP‐2 and Pv pLDH (All) Show forest plot | 2 | 688 |
| 34 P. vivax, PCR, Type 6, PALUTOP (All) Show forest plot | 1 | 313 |