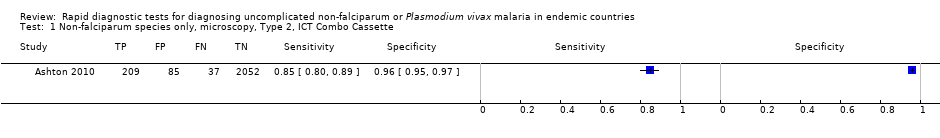
| 1 Non‐falciparum species only, microscopy, Type 2, ICT Combo Cassette Show forest plot | 1 | 2383 |
|
| 2 Non‐falciparum species only, microscopy, Type 2, ICT Malaria Pf/Pv Show forest plot | 7 | 3151 |
|
| 3 Non‐falciparum species only, microscopy, Type 2, NOW Malaria ICT Show forest plot | 1 | 246 |
|
| 4 Non‐falciparum species only, microscopy, Type 2, Malascan Show forest plot | 1 | 372 |
|
| 5 Non‐falciparum species only, microscopy, Type 2, VIKIA Ag Pf/Pan Show forest plot | 1 | 727 |
|
| 6 Non‐falciparum species only, microscopy, Type 2 (All) Show forest plot | 11 | 6879 |
|
| 7 Non‐falciparum species only, microscopy, Type 3, Parascreen Show forest plot | 14 | 5407 |
|
| 8 Non‐falciparum species only, microscopy, Type 3, CareStart Pf/Pan Show forest plot | 4 | 3544 |
|
| 9 Non‐falciparum species only, microscopy, Type 3, SD Malaria Antigen Bioline Show forest plot | 4 | 3769 |
|
| 10 Non‐falciparum species only, microscopy, Type 3, First Response Malaria Combo Show forest plot | 2 | 663 |
|
| 11 Non‐falciparum species only, microscopy, Type 3, One Step Malaria Pf/Pan Show forest plot | 1 | 606 |
|
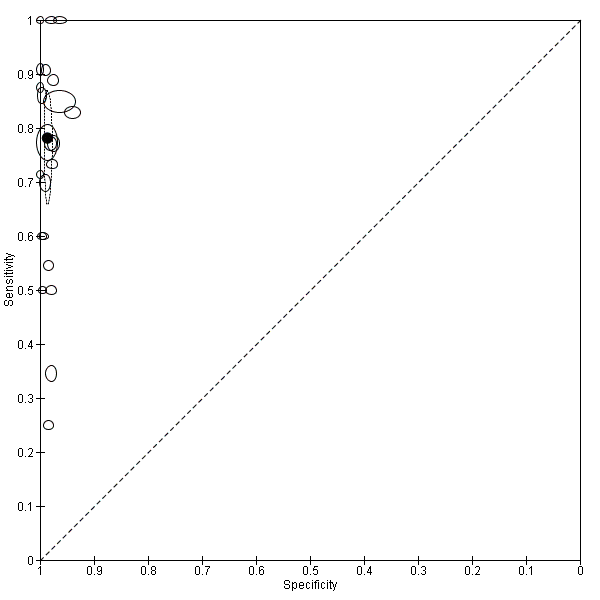
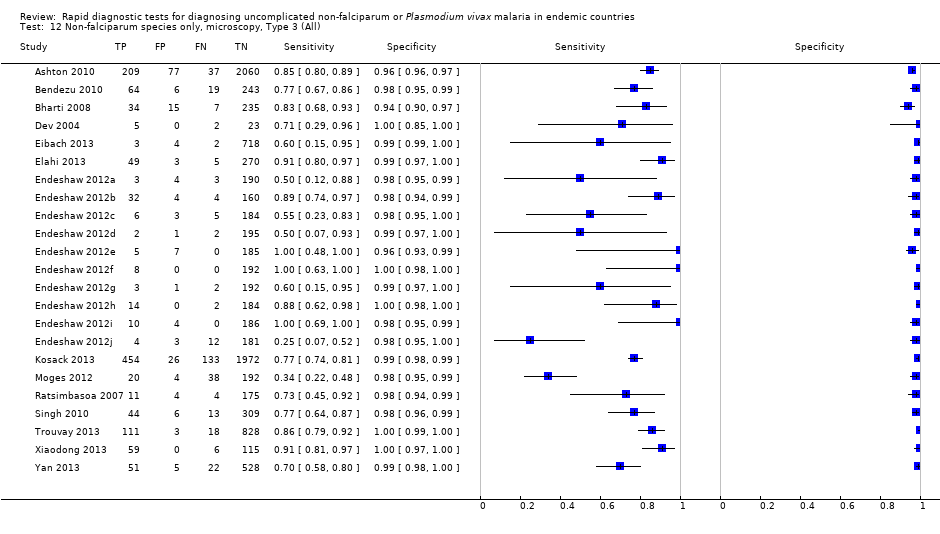
| 12 Non‐falciparum species only, microscopy, Type 3 (All) Show forest plot | 23 | 11234 |
|
| 13 Non‐falciparum species only, microscopy, Type 4, OptiMAL Show forest plot | 6 | 1843 |
|
| 14 Non‐falciparum species only, microscopy, Type 4, OptiMAL‐IT Show forest plot | 4 | 1987 |
|
| 15 Non‐falciparum species only, microscopy, Type 4, Carestart Show forest plot | 1 | 195 |
|
| 16 Non‐falciparum species only, microscopy, Type 4 (All) Show forest plot | 10 | 3831 |
|
| 17 Non‐falciparum species only, microscopy, Other Type, Malariagen Malaria Show forest plot | 1 | 262 |
|
| 18 Non‐falciparum species only, PCR, Type 3, CareStart Pf/Pan Show forest plot | 1 | 178 |
|
| 19 Non‐falciparum species only, PCR, Type 3, Parascreen Show forest plot | 2 | 659 |
|
| 20 Non‐falciparum species only, PCR, Type 3, One Step Malaria Pf/Pan Show forest plot | 1 | 606 |
|
| 21 Non‐falciparum species only, PCR, Type 3, SD Malaria Antigen Bioline Show forest plot | 1 | 196 |
|
| 22 Non‐falciparum species only, PCR, Type 3 (All) Show forest plot | 5 | 1639 |
|
| 23 Non‐falciparum species only, PCR, Type 4, OptiMAL (All) Show forest plot | 1 | 313 |
|
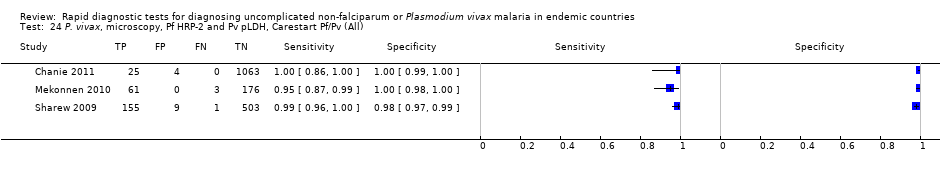
| 24 P. vivax, microscopy, Pf HRP‐2 and Pv pLDH, Carestart Pf/Pv (All) Show forest plot | 3 | 2000 |
|
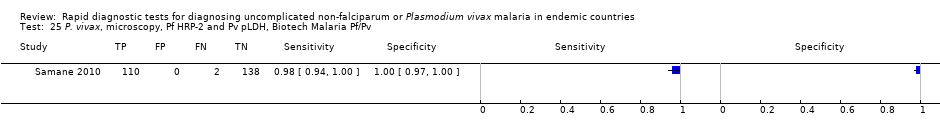
| 25 P. vivax, microscopy, Pf HRP‐2 and Pv pLDH, Biotech Malaria Pf/Pv Show forest plot | 1 | 250 |
|
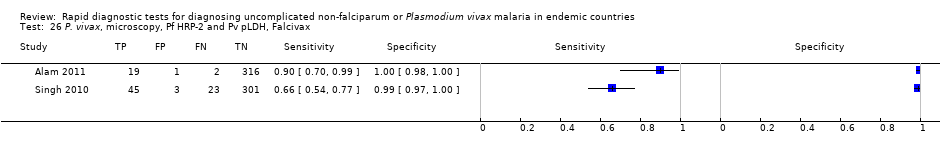
| 26 P. vivax, microscopy, Pf HRP‐2 and Pv pLDH, Falcivax Show forest plot | 2 | 710 |
|
| 27 P. vivax, microscopy, Pf HRp‐2 and Pv pLDH, Onsite Pf/Pv Show forest plot | 2 | 710 |
|
| 28 P. vivax, microscopy, Pf HRP‐2 and Pv pLDH, Pf/Pv Malaria Device Show forest plot | 1 | 350 |
|
| 29 P. vivax, microscopy, Pf HRP‐2 and Pv pLDH (All) Show forest plot | 8 | 3682 |
|
| 30 P. vivax, PCR, Pf HRP‐2 and Pv pLDH, Falcivax Show forest plot | 1 | 338 |
|
| 31 P. vivax, PCR, Pf HRP‐2 and Pv pLDH, OnSite Pf/Pv Show forest plot | 1 | 338 |
|
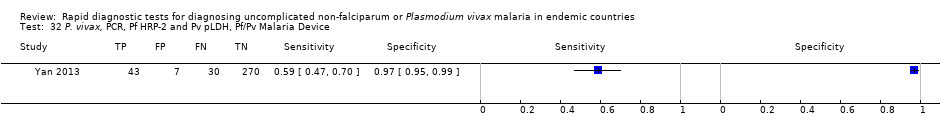
| 32 P. vivax, PCR, Pf HRP‐2 and Pv pLDH, Pf/Pv Malaria Device Show forest plot | 1 | 350 |
|
| 33 P. vivax, PCR, Pf HRP‐2 and Pv pLDH (All) Show forest plot | 2 | 688 |
|
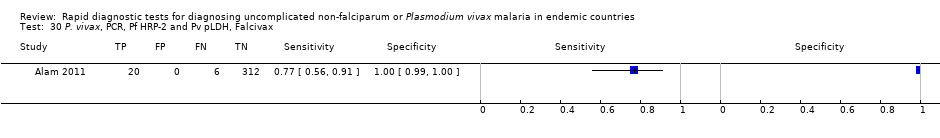
| 34 P. vivax, PCR, Type 6, PALUTOP (All) Show forest plot | 1 | 313 |
|