慢性阻塞性肺病自我管理的计算机和移动技术干预
摘要
研究背景
慢性阻塞性肺疾病(chronic obstructive pulmonary disease, COPD)的特征是由于肺部对有害颗粒或气体(例如香烟烟雾)的异常炎症反应而造成的气流阻塞。中度至极重度COPD患者的护理模式通常包括定期长时间住院,这将导致高额的医疗费用,并对患者生活质量产生不良影响。过去十年的研究重点集中在开发能够提升患者自我管理能力的辅助技术的创新方法。
研究目的
评价由计算机和移动技术提供的干预措施与面对面或打印件/数字文件提供的干预措施,或两者,在促进、支持和维持COPD患者自我管理方面的有效性。
检索策略
在2016年11月,我们检索了Cochrane呼吸道组专业注册库(Cochrane Airways Group Specialised Register, CAGR)。该注册库包括通过系统检索书目数据库确定的试验报告,包括Cochrane对照试验中心注册库(Cochrane Central Register of Controlled Trials, CENTRAL)、MEDLINE、Embase、CINAHL、AMED和PsycINFO,我们还手工检索了呼吸系统相关期刊和会议摘要。
纳入排除标准
我们纳入了随机对照试验,这些试验评价了远程干预措施和基于Web2.0的干预措施对COPD患者自我管理行为改变的影响,这些干预措施被定义为包括个人计算机(personal computers, PC)和移动技术应用程序(applications, app)在内的技术,比如iPad、Android平板电脑、智能手机和Skype。比较组的干预措施包括面对面和/或打印/数字文件教育/自我管理支持。
资料收集与分析
共两名系统综述作者(CMcC和MMcC)独立筛选了标题、摘要和全文研究报告以供纳入。两名系统综述作者(CMcC和AMB)独立评价研究质量并提取了资料。对于使用不同结局测量量表的研究,我们用均差(mean differences, MD)和标准均差(standardised mean differences, SMD)表示连续性数据。
主要结果
我们在本系统综述中纳入了三项研究(Moy 2015; Tabak 2013; Voncken‐Brewster 2015)共涉及1580名随机对照试验受试者。在Voncken‐Brewster 2015研究中,我们纳入了被确诊为COPD的个体亚组(涉及284名受试者),并排除了有患COPD风险但未被确诊的人(涉及1023名受试者)。结果,可供分析的总人数包括557名受试者;其中319名受试者接受了支持自我管理的智能技术干预,238名受试者接受了关于自我管理的面对面口头/书面或数字信息和教育的干预措施。受试者平均年龄为64岁。我们所纳入的男性比女性多,因为其中一项研究的样本是由退伍军人组成的,其中大多数为男性。这些研究评价了我们定义的九项结局中的五个。没有一项研究纳入了以下结局,比如自我效能、成本效益、功能容量、肺功能或焦虑和抑郁。
所有三项研究都包括了我们的主要结局 ‐ 通过临床COPD问卷(Clinical COPD Questionnaire, CCQ)或圣乔治呼吸问卷(St George's Respiratory Questionnaire, SGRQ)测量的健康相关生活质量(health‐related quality of life, HRQoL)。一项研究报告了其他主要结局‐ 患者住院情况和急性恶化情况。两项研究纳入了次要结局,即通过每日步数测量出的身体活动情况。一项研究通过提供描述性分析来解决吸烟问题。只有一项研究报告了不良事件并指出了组间的明显差异,干预组报告了43起事件,对照组报告了八起事件(P=0.001)。测量了第四周、第四个月和第六个月结局的研究,在症状和健康状况方面,表明智能技术干预对自我管理和后续HRQoL的影响明显优于接受面对面/数字和/或书面支持的COPD自我管理干预措施的受试者(SMD=‐0.22, 95%置信区间CI [‐0.40, ‐0.03]; P=0.02)。报告了12个月HRQoL情况的单项研究在组间没有发现显著差异(MD=1.1, 95%CI [‐2.2, 4.5]; P=0.50)。此外,在12个月时报告了住院(逻辑回归优势比OR=1.6, 95%CI [0.8, 3.2]; P=0.19)和恶化情况(逻辑回归优势比OR=1.4, 95%CI [0.7, 2.8]; P=0.33)的单项研究发现组间并无差异。接受智能技术干预的COPD患者在第四周、第四个月和第六个月的活动水平明显高于接受面对面/数字和/或书面支持干预措施的患者。(MD=864.06 组间每日步数,95%CI [369.66, 1358.46]; P=0.0006)。唯一一项评价了受试者在12个月时的活动水平的研究报告组间没有明显差异(均差=‐108, 95%CI [‐720, 505]; P=0.73)。本研究的受试者在4至12个月内没有持续参与。唯一一项纳入了戒烟情况的研究没有发现显著的治疗效果。(OR=1.06, 95%CI [0.43, 2.66]; P=0.895)。Meta分析显示在各研究之间没有显著的异质性(分别为Chi²=0.39, P=0.82; I²=0%和Chi²=0.01; P=0.91; I²=0%)。
作者结论
尽管我们的系统综述表明,与通过面对面/数字和/或书面支持提供的干预相比,旨在促进、支持和维持COPD患者自我管理的干预措施,以及通过智能技术提供的干预措施,使患者的HRQoL和活动水平在长达六个月的时间内具有明显改善,但也无法得出确切的结论。这种改善可能不会持续很长时间。唯一一项对长达12个月的结局进行了评价、且已被纳入的研究强调,随着时间的推移,有必要确保能够持续使用该技术。有限的证据表明,使用计算机和移动技术对COPD患者进行自我管理没有害处,甚至可能对某些人比对其他人更有益,比如那些对使用这些技术感兴趣的人,可能会获得更多益处。
三项存在高偏倚风险的研究所提供的证据质量较差,不足以向医疗保健专业人员、服务提供者和患有COPD的公众提供关于使用智能技术作为支持、鼓励和维持自我管理有效手段的健康益处的建议。未来仍需进行关注与COPD不同阶段相关的结局的研究。研究人员应当提供关于如何评价自我管理的明确信息,并应包括允许对行为改变进行评论的纵向措施。
PICO
简语概要
关于COPD患者自我管理的智能技术
系统综述背景
慢性阻塞性肺病(chronic obstructive pulmonary disease, COPD)是一种长期的呼吸系统疾病,通常由吸烟引起。智能手机、平板电脑和PC可能对居家的COPD患者很有帮助,因为这些设备能够提供有关病情的信息、教育和指导。这些信息可以针对每个人进行个性化设置,比如,它可以推荐合适的锻炼计划或者提供关于如何戒烟的建议。
研究特征
在本系统综述中,我们纳入了来自三项研究的557名受试者;其中319名接受支持自我管理的智能技术干预,238名接受有关自我管理的面对面口头/书面或数字信息和教育形式的干预措施。受试者平均年龄为64岁。我们的系统综述所纳入的男性比女性多,因为其中一项研究的样本是由退伍军人组成的,其中大多数是男性。在第一项研究中,受试者使用该技术仅四周,在第二项研究中使用六个月,在第三项研究中使用四个月,该研究还报告了12个月时的数据。这些研究中使用的技术包括智能手机或PC。
主要研究结果
在四周到六个月的时间里,与接受面对面/数字和/或书面支持的干预措施的受试者相比,接受智能技术干预的受试者在自我管理、生活质量方面表现出更大的改善,且增加了体育锻炼。此外,在接受智能技术干预和未接受此干预的受试者间,其住院情况和COPD恶化情况没有差异。只有一项研究提供了有关戒烟者的信息,并报告各组之间没有差异。
证据质量
我们发现只有三项研究存在高偏倚风险——我们可以将这些研究纳入本系统综述,并且我们只能对结局中的两项(生活质量和所增加的体育锻炼)进行分析。因此,我们认为目前的信息并未明确表明智能技术是否对COPD患者有帮助。我们建议进一步展开高质量的研究,重点关注与COPD不同阶段相关的结局。研究人员应当清楚如何评价自我管理,应当报告标准的试验结局,尤其是成本方面,并且应当包括为期至少一年的随访,以便他们可以提供关于行为改变和治疗影响的评论。
Authors' conclusions
Summary of findings
| Smart technology compared with face‐to‐face/digital and/or written support for self‐management in chronic obstructive pulmonary disease | ||||||
| Participant or population: adults with a clinical diagnosis of COPD | ||||||
| Outcomes | Anticipated absolute effects* (95% CI) | Relative effect | Number of participants | Quality of the evidence | Comments | |
| Risk with face‐to‐face/digital and/or written support | Risk with smart technology | |||||
| Hospital admission | ‐ | ‐ | ‐ | 239 (1 RCT; Moy 2015 at 12 months) | ⊕⊕ Lowa | Hospital admission not reported at 4 months. At 12 months. smart technology did not significantly impact the number of hospital admissions |
| Acute exacerbations requiring general practitioner (GP) visit and/or additional treatment | ‐ | ‐ | ‐ | 239 (1 RCT; Moy 2015 at 12 months) | ⊕⊕ Lowa | Acute exacerbations were not reported at 4 months. At 12 months, smart technology did not significantly impact the number of acute exacerbations |
| Health‐related quality of life (HRQoL) | Mean HRQoL ranged across control groups from 0.08 to 1.686 | SMD in HRQoL in the intervention group was 0.22 lower (0.44 to 0.03 lower) | ‐ | 472 (3 RCTs) | ⊕⊕ Lowa | Lower scores on both SGRQ and CCQ indicate better HRQoL. The SGRQ scale ranges from 0 to 100, and a change in score of 4 units is regarded as the minimum clinically important difference (MCID). The SMD in the lower score indicates better HRQoL with smart technology |
| Daily step count | Mean daily step count was 3200 to 4617 steps | Mean daily step count in the intervention group improved by 864 steps (369.66 to 1358.46 higher) | ‐ | 230 (2 RCTs; Moy 2015 at 4 months and Tabak 2013 at 4 weeks) | ⊕⊕ Lowa | The follow‐up period differed between studies, from 4 weeks to 4 months. Smart technology significantly improved physical activity as seen in daily step counts |
| Self‐efficacy | ‐ | ‐ | 0 | ‐ | This outcome was not measured in any of the included studies | |
| Behaviour change: smoking cessation | ‐ | ‐ | 284 (1 RCT) | ⊕⊕⊕ | Results showed no significant effect on smoking cessation | |
| Functional capacity (6‐minute walking test or similar) | ‐ | ‐ | 0 | ‐ | None of the included studies measured this outcome | |
| Anxiety and depression | ‐ | ‐ | 0 | ‐ | None of the included studies measured this outcome | |
| *The risk in the intervention group (and its 95% confidence interval) is based on assumed risk in the comparison group and the relative effect of the intervention (and its 95% CI) | ||||||
| GRADE Working Group grades of evidence | ||||||
| aCI is wide owing to the small number of studies and the small sample sizes, which may impact precision of estimates bCI is wide owing to the single study and the small sample size, which may impact precision of estimates | ||||||
Background
Description of the condition
Chronic obstructive pulmonary disease (COPD) is characterised by airflow obstruction due to an abnormal inflammatory response of the lungs to noxious particles or gases, for example, cigarette smoke. The obstruction is not fully reversible and is generally progressive (GOLD 2016). Globally, it is estimated that approximately 210 million people have COPD. Evidence from a systematic review of 29 countries suggests that prevalence is higher among tobacco smokers and those exposed to tobacco smoke and among people over 40 years of age. Evidence suggests that COPD affects men and women almost equally (GOLD 2016). Symptoms include increasing breathlessness, wheezing, weight loss, fatigue, and prolonged forced expiration of air (Corroon 2014). A clinical diagnosis of COPD is based on spirometry, details of which are outlined in the Types of participants section. The pattern of care for people with moderate to very severe COPD often involves regular lengthy hospital admissions, which result in high healthcare costs and an undesirable effect on quality of life (Oostenbrink 2004; Seemungal 2000).
Smart technology is proving valuable for supporting, encouraging, and sustaining self‐management among people with COPD and other chronic illnesses. Research over the past decade has focused on innovative methods for developing enabling and assistive technologies that facilitate patient self‐management. Self‐management refers to strategies and lifestyle changes that people make to control their disease, ensure good quality of life, and avoid exacerbations and hospitalisations (Audulv 2013; Schulman‐Green 2012). It is based on the premise that individuals with many chronic conditions encounter similar health and social issues and can serve as partners in managing their disease. However, to self‐manage effectively, patients need skills, knowledge, and confidence, and they must be self‐motivated (Audulv 2013; Lorig 2003).
Description of the intervention
Studies evaluating the use of remote technology in home‐based healthcare settings have demonstrated the potential of information and communication technology (ICT) to facilitate and support behaviour change and self‐management of chronic conditions (Nguyen 2013; Noar 2007). Use of ICT is increasing in the management of many chronic illnesses, such as asthma (Marcano 2013), cardiac disease (Inglis 2010), and COPD (Zwerink 2014). ICT facilitates and supports behavioural change by providing motivational educational programmes and other online resource materials that are accessible at all times and are generally available at low cost. As a method of permitting sustainable behaviour change and self‐management, ICT may minimise hospital re‐admissions and provide better quality of life for patients (Annandale 2011; Evers 2006). ICT that is remote and Web 2.0 based (second stage of Internet development, characterised by dynamic or user‐generated content and the growth of social media) generally incorporates video content and multimedia, primarily via use of the Internet and mobile technology, for example, smart phones and tablet computers. Patients commonly access ICT educational self‐management programmes by using application software (apps).
Self‐management educational programmes generally provide patient‐directed content, such as motivational and educational information related to smoking cessation, exercise, diet, and symptom management. These programmes may offer peer learning and social activity/connection aspects as well. Support programmes usually have a minimum duration of three months (Smit 2012; Wempe 2004). Most studies have reported improvements during the intervention period and up to three to six months afterward; however, some studies have concluded that regardless of whether programmes are delivered via ICT or face‐to‐face contact, improvements are not maintained (Krebs 2010; Nguyen 2013; Smeets 2008; Smit 2012).
How the intervention might work
Self‐management interventions vary, but the most prominent patient‐directed applications of ICT in the home are delivered through personal computers and applications for mobile technology, such as iPad, Android tablets, smart phones, and Skype (Lindberg 2013). These self‐management interventions provide information and instruction while facilitating goal setting and self‐monitoring. They may rely on one or more approaches, such as video, audio, digital images, and hard or digital copies, to deliver educational and motivational content related to issues such as smoking cessation, exercise, diet, and symptom management.
Why it is important to do this review
COPD is the fourth‐leading cause of death worldwide, with more than three million people dying each year from the disease (GOLD 2016). These figures are conservative owing to under‐recognition and under‐diagnosis, particularly in developing countries (GOLD 2016; WHO 2013). In the United Kingdom, the Health Survey for England (2010) estimated that around 6% of adults have COPD, which is equivalent to around 3 million cases currently (Mindell 2011). Six percent of the total health budget of the European Union targets respiratory health; 56% of this is devoted solely to COPD. In the United States, direct costs for COPD are estimated at USD29.5 billion and indirect costs at USD20.4 billion. In Australia in 2008, the economic burden of COPD was estimated to be AUD98.2 billion, of which AUD8.8 billion was attributed to financial costs and AUD89.4 billion to loss of well‐being (Lung Foundation Australia 2014). The cost to the National Health Service (NHS) for COPD treatment currently stands at an unsustainable annual figure of €774 million (Lewis 2016). In Ireland, approximately 440,000 people are thought to have COPD, with each requiring up to six hospital admissions per year as the result of exacerbations, at an average cost of EUR6000 per admission (Ryan 2010).
A systematic review that included 29 studies on self‐management for people with COPD (23 studies on 3189 participants compared self‐management vs usual care; six studies on 499 participants compared different components of self‐management on a head‐to‐head basis) concluded that self‐management interventions improve health‐related quality of life (HRQoL), reduce respiration‐related hospital admissions, and improve dyspnoea (Zwerink 2014). Each intervention comprised two or more interaction episodes between participants and healthcare providers. Researchers provided information verbally, via written material, or through audiovisual media. This review did not include studies of ICT‐based self‐management interventions. Similarly, a systematic review on the efficacy of telephone support and/or telemonitoring showed that these methods can reduce hospital admissions and mortality rates among people with chronic illness (Inglis 2010).
Remote and Web 2.0‐based interventions provide patients with relevant, individualised, motivational, and educational material that encourages, supports, and facilitates self‐management and may reduce hospital re‐admissions, acute exacerbations, and costs (McCabe 2014). A systematic review (two randomised controlled trials (RCTs), 408 participants) on the effectiveness, cost‐effectiveness, and feasibility of smart phone and tablet self‐management apps for asthma presented a narrative synthesis but was inconclusive owing to insufficient evidence (Marcano 2013).
Uptake of mobile broadband due to increasing use of smart phones, tablets, and apps is an important reason for conducting this review, as this technology has made information easily accessible to the general population. The number of mobile‐connected devices now exceeds the number of people on earth, and by 2018, nearly 1.4 mobile devices per capita will be in use (Cisco 2014). This indicates that continued development and growth of remote and Web 2.0‐based interventions for self‐management of many chronic illnesses may provide a realistic and feasible healthcare strategy.
Our review evaluated the effects of remote and Web 2.0‐based interventions provided through computer and mobile technology versus face‐to‐face or hard copy/digital documentary interventions in facilitating, supporting, and sustaining self‐management among people living at home with COPD. Available evidence may inform future research and technology related to self‐management of COPD.
Objectives
To evaluate the effectiveness of interventions delivered by computer and by mobile technology versus face‐to‐face or hard copy/digital documentary‐delivered interventions, or both, in facilitating, supporting, and sustaining self‐management among people with COPD.
Methods
Criteria for considering studies for this review
Types of studies
We included randomised controlled trials (RCTs) and planned to include cluster‐randomised trials. We included studies reported as full text and planned to include those published as abstract only, as well as unpublished data. We used published study results and those provided by trialists on request.
Types of participants
We included adult participants over the age of 18 with a clinical diagnosis of COPD according to Global Initiative for Chronic Obstructive Lung Disease criteria (GOLD 2016) and at any stage of illness, that is, people with irreversible airflow obstruction (post‐bronchodilator forced expiratory volume in one second (FEV1) to forced vital capacity (FVC) ratio < 0.7) and chronic respiratory symptoms such as coughing, dyspnoea, and sputum (GOLD 2016). We determined the stage of disease progression by using FEV1 percentage of predicted normal, intensity of symptoms, and frequency of exacerbations.
We included participants who live at home or in a non‐healthcare residential setting (sheltered housing) and who use, or have access to, technology, for example, personal computer, tablet, or smart phone, to help them manage their illness. We planned to include studies that recruited people from different care settings, but only if the study report identified separately results of participants who were living at home.
We included mixed‐participant studies that included, for example, COPD, emphysema, asthma, lung cancer, or other conditions that affect breathing, only if participants with COPD were identified separately in the study report.
Types of interventions
We included remote and Web 2.0‐based interventions delivered via technologies that give patients access to ehealth information to change behaviours towards self‐management of COPD. These technologies include personal computers (PCs) and applications (apps) for mobile technology such as iPad, Android tablets, smart phones, and Skype.
Comparison group interventions included face‐to‐face and/or hard copy/digital documentary educational/self‐management support. We based comparisons on educational programmes of similar content, structure, and duration provided for both intervention (computer/mobile technology) and comparison groups.
We excluded studies that focus on monitoring devices such as telemonitoring/telehealth or assistive technologies, because these studies involve the participation of more than one user, for example, the patient and the healthcare professional. We focused this review on individual self‐management and behavioural change. We also excluded studies that did not include an ICT arm.
Types of outcome measures
We planned to include the following outcome measures.
Primary outcomes
-
Hospital admissions
-
Acute exacerbations requiring general practitioner (GP) visit or additional treatment, or both
-
Health‐related quality of life (HRQoL) (as measured by St George's Respiratory Questionnaire (SGRQ), Clinical COPD Questionnaire (CCQ), Short Form (SF)‐36, or any validated instrument)
Secondary outcomes
-
Self‐efficacy (as measured by the COPD Self‐Efficacy Scale or any validated instrument)
-
Cost‐effectiveness (cost of the intervention and time lost from work)
-
Functional capacity (six‐minute walking test or similar tests)
-
Lung function (forced expiratory volume in one second (FEV1) and FEV1 %predicted)
-
Anxiety and depression (Hospital Anxiety and Depression Scale, Center for Epidemiological Studies Depression Scale (CES‐D))
-
Sustained behaviour change (smoking cessation and increased physical activity)
Reporting in the trial one or more of the outcomes listed here was not an inclusion criterion for the review. Time points of measurement are six months or less and after six months.
Search methods for identification of studies
Electronic searches
We identified trials from the Cochrane Airways Group Specialised Register (CAGR), which is maintained by the Information Specialist for the Group. We searched all records in the CAGR using the search strategy provided in Appendix 1. The CAGR contains trial reports identified through systematic searches of bibliographic databases including the Cochrane Central Register of Controlled Trials (CENTRAL), MEDLINE, Embase, the Cumulative Index to Nursing and Allied Health Literature (CINAHL), the Allied and Complementary Medicine Database (AMED), and PsycINFO, and via handsearching of respiratory journals and meeting abstracts (please see Appendix 2 for further details).
We also conducted a search of ClinicalTrials.gov (www.ClinicalTrials.gov) and the World Health Organization trials portal (www.who.int/ictrp/en/). We searched all databases from their inception to November 2016, and we imposed no restrictions on language of publication.
Searching other resources
We checked the reference lists of all primary studies and review articles for additional references. We also searched relevant manufacturers' websites for trial information.
We searched for errata or retractions from included studies published in full text on PubMed (www.ncbi.nlm.nih.gov/pubmed) and reported in the review the date this was done, when relevant.
Data collection and analysis
Selection of studies
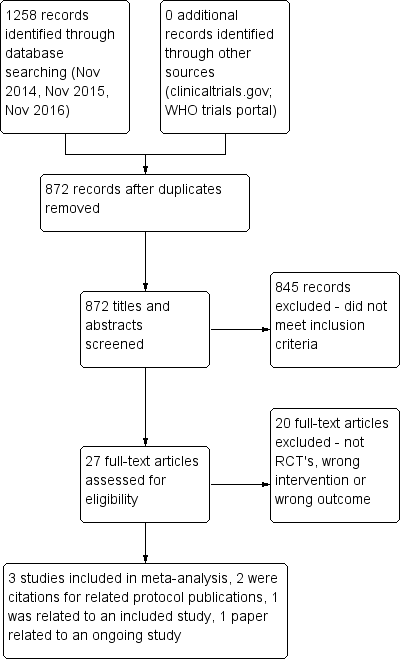
Two review authors (CMcC and MMcC) independently screened titles and abstracts for inclusion of all potential studies identified as a result of the search and coded them as 'retrieve' (eligible or potentially eligible/unclear) or 'do not retrieve'. We retrieved full‐text study reports/publications and two review authors (CMcC and MMcC) independently screened the full text, identified studies for inclusion, and identified and recorded reasons for exclusion of ineligible studies. We resolved disagreements through discussion without the need for third‐person consultation. We identified and excluded duplicates and collated multiple reports of the same study, so that each study, rather than each report, was the unit of interest in the review. We recorded the selection process in sufficient detail to complete a PRISMA (Preferred Reporting Items for Systematic Reviews and Meta‐Analyses) flow diagram (Figure 1) and a Characteristics of excluded studies table.

PRISMA flow diagram.
Data extraction and management
We used a data collection form that was piloted on at least one study in the review to record study characteristics and outcome data. Two review authors (CMcC and AMB) extracted the following study characteristics from included studies.
-
Methods: study design, total duration of study, details of any 'run‐in' period, number of study centres and locations, study setting, withdrawals, and date of study.
-
Participants: N, mean age, age range, gender, severity of condition, diagnostic criteria, baseline lung function, smoking history, inclusion criteria, and exclusion criteria.
-
Interventions: intervention, comparison, concomitant medications, and duration of intervention.
-
Outcomes: primary and secondary outcomes specified and collected, and time points reported.
-
Notes: funding for trial and notable conflicts of interest of trial authors.
We noted in the Characteristics of included studies table if outcome data were not reported in a useable way. One review author (CMcC) transferred data into the Review Manager (Review Manager 2012) file. A second review author (MMcC) spot‐checked study characteristics presented in the systematic review for accuracy against the trial report.
When the study had been published in a language other than English, we sought assistance with content from a native speaker/translator.
Assessment of risk of bias in included studies
Two members of the review team (CMcC and AMB) applied criteria provided in the Cochrane Handbook for Systematic Reviews of Interventions (Higgins 2011) to independently assess risk of bias in relation to the following issues.
-
Generation of sequence allocation.
-
Concealment.
-
Blinding related to intervention and outcome assessment.
-
Incomplete outcome data.
-
Selective reporting.
Additional assessment criteria for cluster trials related to study design include the following.
-
Recruitment bias.
-
Unbalanced groups.
-
Analysis appropriate for cluster trials.
-
Loss to follow‐up.
We identified the presence/degree of bias as having low, high, or unclear risk. Members of the review team were not blinded to authorship nor to journal of publication. We intended to use kappa statistics to calculate the percentage of agreement between team members and to discuss/explain reasons for disagreement.
Assessment of bias in conducting the systematic review
We conducted the review according to the published protocol and reported deviations from it in the Differences between protocol and review section of the systematic review.
Measures of treatment effect
We used RevMan 5 software to analyse data. We planned to present results from each RCT as odds ratios, with 95% confidence intervals for dichotomous data. We used mean differences (MDs) for continuous data and standardised mean differences (SMDs) for studies using different outcome measurement scales. We summarised sufficiently homogenous (clinically and statistically) data in a meta‐analysis and converted combined estimates of MDs and SMDs into measures that were relevant to practice if the outcome of the meta‐analysis was statistically significant.
Unit of analysis issues
For cluster RCTs providing dichotomous data, we planned to divide numbers of participants and intervention groups by the same design effect, and when only continuous data were provided, we planned to reduce sample sizes, while using the same means and standard deviations. In parallel RCTs for both continuous and dichotomous outcomes, we planned to calculate effect size (OR, MD, SMD) using the number of participants included in the analysis at a given time point or at baseline.
Dealing with missing data
If necessary, members of the review team (CMcC and AMB) contacted researchers to request missing numerical outcome data related to individual participants. When this was not possible, and when missing data were thought to introduce serious bias, we planned to explore the impact of including such studies in the overall assessment of results by performing a sensitivity analysis. If necessary, we planned to assume that missing values indicated a poor outcome.
Assessment of heterogeneity
We assessed statistical variation using the Chi2 (Q) test and I2 statistical tests. A P value less than 0.10 or an I2 greater than 50% suggests substantial heterogeneity. We planned in such cases to explore data further to provide additional explanation.
Assessment of reporting biases
We identified reporting bias by determining if the protocol was published before the study commenced. We ascertained the presence of selective reporting of outcomes for each study. We planned that if we identified sufficient trials, we would attempt to assess publication bias by using funnel plots and by screening all online clinical trial registers (Sterne 2011).
Data synthesis
We used GRADEprofiler (GRADEpro) software to prepare summary of findings Table for the main comparison (Higgins 2011). We judged HRQoL as measured by SGRQ and CCQ to be of low quality, and daily step count measured with a pedometer to be of moderate quality. We combined findings from clinically and statistically homogeneous studies using the random‐effects model.
'Summary of findings' table
We planned to create a 'Summary of findings' table using the following outcomes.
-
Hospital admissions.
-
Acute exacerbations.
-
Health‐related quality of life (HRQoL).
-
Self‐efficacy.
-
Cost‐effectiveness.
-
Functional capacity.
-
Lung function.
-
Anxiety and depression.
-
Sustained behaviour change (smoking cessation and increased physical activity).
We used the five GRADE considerations (study limitations, consistency of effect, imprecision, indirectness, and publication bias) to assess the quality of a body of evidence as related to studies that contributed data to the meta‐analyses for prespecified outcomes (Higgins 2011). We employed methods and recommendations described in Section 8.5 and Chapter 12 of the Cochrane Handbook for Systematic Reviews of Interventions using GRADEpro software (Higgins 2011). We justified all decisions to downgrade or upgrade the quality of studies by using footnotes, and we made comments to aid readers' understanding of the review when necessary.
Subgroup analysis and investigation of heterogeneity
We planned to assess heterogeneity among studies through subgroup analysis, for example, by assessing the control group for usual treatment, which may consist of written information provided in leaflets/booklets or attendance at a rehabilitation or other disease management programme. We planned to further assess the intervention group in terms of technology, content, purpose, duration, and cost. We intended to undertake subgroup analysis to determine the influence of the digital divide by using age and educational level, as these factors may influence uptake and use of technology. We aimed to carry out the following subgroup analyses when appropriate.
-
Severity of COPD.
-
Duration of follow‐up (≤ 6 months vs > 6 months).
-
Age ≥ 60 versus < 60.
-
Educational level (primary, secondary, or tertiary level).
We planned on using the formal test for subgroup interactions provided in Review Manager (Review Manager 2012).
Sensitivity analysis
We planned to conduct sensitivity analysis to investigate differences in effect size and in strength of conclusions.
We planned to conduct sensitivity analysis on the basis of risk of bias and methods of analysis for primary outcomes only.
Results
Description of studies
We have provided details of included and excluded studies in the Characteristics of included studies and Characteristics of excluded studies tables.
Results of the search
Our initial search in November 2014 and additional searches in November 2015 and November 2016 yielded 1258 citations from the CAGR database. A search of clinicaltrials.gov and of the World Health Organization (WHO) trials portal yielded no relevant citations. After 386 duplicates had been removed, 872 citations remained (Figure 1). During the initial screening of titles and abstracts, we excluded 845 studies and assessed 27 studies on the basis of inclusion and exclusion criteria. Of these, we excluded 20 studies because they were not RCTs, the intervention did not involve smart technology, or smart technology was used but for monitoring purposes ‐ not for self‐management.
The remaining seven papers comprised the three studies included in this review (Moy 2015; Tabak 2013; Voncken‐Brewster 2015) and two other papers, both of which are protocols linked to two of the included studies. We have listed both protocols as sub‐references to the relevant studies (Moy 2015; Voncken‐Brewster 2015). The sixth paper (Moy 2016a), which is linked to Moy 2015, presents findings from the final data collection point at 12 months. We did not include findings of this paper in the meta‐analysis, as the 12‐month time point was significantly different from that reported in the other papers ‐ four weeks (Tabak 2013), four months (Moy 2015), and six months (Voncken‐Brewster 2015). In addition, investigators described the trial period from four months to 12 months as an "eight month maintenance phase", and the intervention did not replicate the earlier "intensive four month intervention period", as researchers did not provide new educational and motivational content for participants during this phase. The seventh paper is a protocol that we have included under Ongoing studies (Talboom‐Kamp 2016).
Included studies
We included three studies in our review (Moy 2015; Tabak 2013; Voncken‐Brewster 2015) and provided descriptions of these studies in the Characteristics of included studies table. These studies included a total of 1580 randomised participants with a mean age of 64 years; 307 (64.9%) were men. From Voncken‐Brewster 2015, we included only the subgroup with a diagnosis of COPD (284 participants) and excluded those who were at risk of COPD but had not received a diagnosis (1023 participants). This left a total of 557 participants, who were randomised across the three studies. Of those randomised, 319 received smart technology to support self‐management, and 238 received face‐to‐face verbal/written or digital information and education about self‐management. Two studies took place in the Netherlands (Tabak 2013; Voncken‐Brewster 2015) and the third in California, in the United States. These three studies confirmed the diagnosis of COPD using GOLD criteria but provided no details on severity of disease. The three studies reported no significant differences in baseline characteristics among study groups. All studies reported age and gender, and two studies (Tabak 2013; Voncken‐Brewster 2015) also reported educational level, employment, and lung function. We focused on our defined outcomes as listed above, but included studies measured only five of these: HRQoL as measured by CCQ (Tabak 2013; Voncken‐Brewster 2015) or SGRQ (Moy 2015), and physical activity as measured by daily step counts (Moy 2015; Tabak 2013). Voncken‐Brewster 2015 measured physical activity using the International Physical Activity Questionnaire Short Form (IPAQ‐SF), which is based on self‐reported general physical activity and therefore was not included in the meta‐analysis of daily step counts. One study (Moy 2015) reported the number of participants who required admission and/or had an acute exacerbation of COPD. Participants used the technology for four weeks in one study and for six months in the second; the third study reported four‐month and 12‐month data. The technology used in the interventions was broadly similar across the three studies and included use of mobile technology in the forms of apps for smart phones and the Internet, which provided individualised education, support, and guidance towards goal achievement, such as achieving increases in daily step count. None of the studies described usual care in detail, but general statements indicate that it included face‐to‐face attendance at a rehabilitation programme or a chronic disease self‐management programme.
The intervention in all three studies was based on online technology, and two studies (Moy 2015; Tabak 2013) included wearable technology. In Tabak 2013 (30 participants), the intervention was an app that comprised two modules: an activity coach, which consisted of a wearable pedometer and a smart phone for activity registration and real‐time feedback from the app; and a Web portal, which was used to record symptoms and activity levels. Before trial commencement, participants received nurse‐led training on correct use of the Web portal. Both groups received usual care, which is described as regular exercise training sessions and pulmonary rehabilitation programmes. The intervention was provided for four weeks, and data collection points included baseline, end of week one, and follow‐up at the end of weeks two, three, and four.
The intervention in Moy 2015 (239 participants) also consisted of a pedometer worn daily, but unlike Tabak 2013, in which activity was recorded automatically, participants were instructed to upload step‐count data regularly. In Moy 2015, each participant had a weekly goal that was based on the average of step counts for the most recent seven days + an additional 600 steps; and the previous goal + 600 steps; or 10,000 steps per day. Participants had Web access to step‐count feedback, allowing self‐monitoring, weekly goal setting, access to educational/motivational content, and participation in an online community forum. Updated educational/motivational content was available during the four‐month intensive phase of the trial; during the eight‐month maintenance period, this content was still available but was not updated. Study authors did not mention whether participants received usual care. Participants in the control group were instructed to wear the pedometer every day and to upload step‐count data regularly, but they received no instructions on exercise and were not given assigned goals; the Web page for this group showed only total weekly step count.
In Voncken‐Brewster 2015 (1325 participants), the intervention was an app called "MasterYourBreath", which was designed to change health behaviour by providing computer‐generated individualised feedback. This app included two behaviour change modules ‐ smoking cessation and physical activity ‐ with six intervention components: health risk appraisal, motivational beliefs, social influence, goal setting and action plans, self‐efficacy, and maintenance. Participants accessed the app through a personalised account and used it ad libitum for six months. Investigators measured primary outcomes of smoking cessation through assessment of the prevalence of abstinence at the seven‐day point; and physical activity via the IPAQ‐SF. Secondary outcomes included health status measured by the CCQ, intention‐to‐change behaviour measured by 'behavior‐change score', and smoking cessation measures such as number of quit attempts in the past six months, 24‐hour point prevalence of abstinence, tobacco consumption, and continued and prolonged abstinence. Outcomes relevant to the review included smoking cessation, physical activity, and health status measured by the CCQ. The duration of the intervention was six months, and data were collected at baseline and at six months. Both intervention and control groups received usual treatment, which was based on a disease management approach whereby a practice nurse coached patients face‐to‐face on how to improve their self‐management skills.
Excluded studies
After our initial screening of titles and abstracts, we excluded 845 papers because they did not meet our inclusion criteria. We reviewed 27 full‐text articles and excluded 20 of these because they were not RCTs, the intervention was not smart technology, or the intervention involved smart technology used for monitoring purposes but not for self‐management.
Risk of bias in included studies
We have provided in the risk of bias summary (Figure 2) an overview of the risk of bias for each of the included studies.
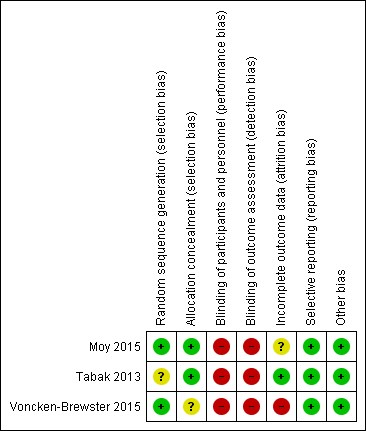
Risk of bias summary: review authors' judgements about each risk of bias item for each included study.
Allocation
Random sequence generation was adequate in two studies (Moy 2015; Voncken‐Brewster 2015) and unclear in Tabak 2013. Two studies used a computer‐generated block random number list. Voncken‐Brewster 2015 revealed allocation online, and for a small number of participants recruited through the general practice, through a researcher not involved in data collection or analysis, who conducted randomisation using computer software. Moy 2015 did not state specifically how allocation was concealed. However, review authors consider the risk of selection bias for this study to be low because all study activity was conducted online. Tabak 2013 stated that participants were allocated in order of inclusion according to the randomisation list but does not state how allocation was concealed. We considered risk of selection bias as low because different individuals handled recruitment, randomisation, and allocation of participants Overall, we concluded that the three studies had unclear to low risk of selection bias.
Blinding
Blinding of participants
Owing to the nature of the intervention, blinding was not possible in all three studies (Moy 2015; Tabak 2013; Voncken‐Brewster 2015). Review authors concluded that risk of performance and detection bias was high for all three studies for HRQoL because participants were not blind to the intervention and provided self‐assessment; therefore, their subjective judgement of quality of life may have been influenced by prior beliefs about whether the intervention was beneficial. The review authors judged that risk of bias for daily step count was high for Moy 2015, as participants self‐reported, but not for Tabak 2013, in which participants automatically uploaded data using a wireless bluetooth connection.
Blinding of investigators
In two studies (Tabak 2013; Voncken‐Brewster 2015), the researcher was not involved in data collection; this was not stated in Moy 2015.
Blinding of outcome assessors
In Moy 2015 and Voncken‐Brewster 2015, assessment and analysis were not blinded and outcome measures were self‐administered online. Tabak 2013 stated that the data collector was not blind to group allocation. Review authors judged that risk of detection bias was high for all outcomes in all three studies, as the intervention and the assessment were self‐administered and may have been influenced by participants' beliefs about possible effects of the intervention and by their perceived need to give 'correct' answers when completing the questionnaires.
Incomplete outcome data
All three studies reported incomplete outcome data. Voncken‐Brewster 2015 reported that the attrition rate for the subgroup of participants with a diagnosis of COPD as included in the analysis was 25% (n = 37) for the intervention group and 17% (n = 24) for the control group, and that the main reason for attrition in both groups was failure to complete follow‐up measurements. At four months, the attrition rate for Moy 2015 was 6% (n = 10) for the intervention group and 3.5% (n = 3) for the control group. At 12 months, the attrition rate for Moy 2015 was 15% (n = 23) for the intervention group and 13% (n = 11) for the control group. Reasons included failure to complete four‐month and 12‐month surveys, death, and exclusion from analysis, with reason not given. Tabak 2013 reported an attrition rate of 22% (n = 4) for the intervention group and 0% for the control group. The main reasons for attrition were participation burden and technical failure.
Voncken‐Brewster 2015 reported that analysis was based on intention‐to‐treat. Moy 2015 stated that investigators used the intention‐to‐treat approach only in the final analysis at 12 months ‐ not at four months. Tabak 2013 did not state intention‐to‐treat but reported that one participant was lost to follow‐up at the final data collection point but was included in the analysis, as data show only one missed time point, suggesting an intention‐to‐treat approach.
Completeness of follow‐up ranged from 75% to 86%. Completeness of follow‐up for the individual studies (Moy 2015; Tabak 2013; Voncken‐Brewster 2015) was 86%, 80%, and 75%, respectively.
Selective reporting
All three studies presented and discussed outcome data; therefore, review authors judged that risk of reporting bias was low. Moy 2015 was a year‐long study with data collection points reported as four months and 12 months. Voncken‐Brewster 2015 and Moy 2015 published trial protocols indicating no deviations between the trial and the protocol. Only one study ‐ Moy 2015‐ reported adverse events including 43 events in the intervention group and eight in the control group, many of which involved musculoskeletal issues due to increased activity that were anticipated and disclosed during the informed consent process. Investigators reported pulmonary, cardiac, and COPD‐related adverse events, none of which required hospitalisation. The protocol for Voncken‐Brewster 2015 did not document any intention to report adverse events. Tabak 2013 did not report adverse events; this was a small pilot study with no published protocol.
Other potential sources of bias
We found no other sources of bias in the three included studies.
Effects of interventions
summary of findings Table for the main comparison provides additional details on comparisons between the effect of smart technology and face‐to‐face or hard copy/digital self‐management material on HRQoL and activity levels (daily step count).
The meta‐analysis included only two outcomes: HRQoL as measured by CCQ (Tabak 2013; Voncken‐Brewster 2015) or SGRQ (Moy 2015), and physical activity as measured by daily steps (Moy 2015; Tabak 2013). One study (Moy 2015) reported hospitalisation and acute exacerbations; similarly, only Voncken‐Brewster 2015 measured smoking cessation. Therefore, a meta‐analysis was not feasible for these outcomes, and we have provided a narrative analysis. Although it was not originally a prespecified outcome of interest for this review, it is interesting to note that only one study reported significant differences in adverse events between groups, with 43 events in the intervention group and eight events in the control group (P = 0.001).
Primary outcomes
Health‐related quality of life
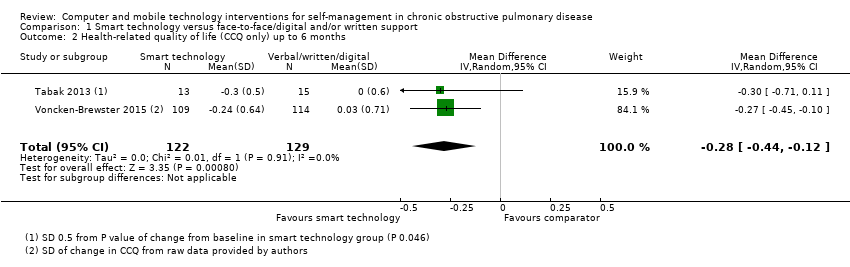
All three studies measured health‐related quality of life of people with COPD using the Clinical COPD Questionnaire (CCQ; Tabak 2013; Voncken‐Brewster 2015) and St George's Respiratory Questionnaire (SGRQ) (Moy 2015). Both are well recognised as valid and reliable tools for assessment of HRQoL in people with COPD. We conducted a meta‐analysis of data reported by all three studies at four weeks, at four months, and at six months using the standardised mean difference (SMD), as investigators used different assessment tools. At these time points, the effect of smart technology on self‐management and subsequent quality of life was significantly better when compared with face‐to‐face/digital and/or written support for self‐management of COPD (Figure 3; Analysis 1.1; three studies; 472 participants: SMD ‐0.22, 95% CI ‐0.40 to ‐0.03; P = 0.02). This reflects improvement in symptoms and impact as measured by the SGRQ which measures symptoms, activity and impacts and the CCQ, which measure symptoms, functional state, and mental state. Results showed no heterogeneity between studies (Chi² = 0.39, P = 0.82; I² = 0%). This significant improvement in HRQoL was also evident in a subgroup analysis of the two studies (Tabak 2013; Voncken‐Brewster 2015) that used the CCQ scale (Figure 4; Analysis 1.2; 251 participants: MD ‐0.28, 95% CI ‐0.44 to ‐0.12; P = 0.0008). Heterogeneity between studies was not evident (Chi² = 0.01, P = 0.91; I² = 0%). The only study (Moy 2015) that reported HRQoL at 12 months reported no significant between‐group differences (MD 1.1, 95% CI ‐2.2 to 4.5; P= 0.50), similar to findings at four months in this study (adjusted MD ‐2.3, 95% CI ‐5.3 to 0.8; P = 0.142).

Forest plot of comparison: 1 Smart technology versus face‐to‐face/digital and/or written support, outcome: 1.1 Health related quality of life (CCQ and SGRQ) up to six months.
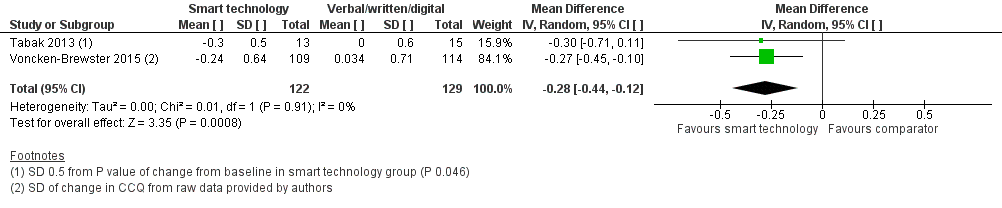
Forest plot of comparison: 1 Smart technology versus face‐to‐face/digital and/or written support, outcome: 1.2 Health related quality of life (CCQ only) up to six months
Hospitalisation and acute exacerbation
Only one study (Moy 2015) reported hospitalisation and acute exacerbation at 12 months; data indicate that slightly more people in the intervention group were hospitalised (logistic regression OR 1.6, 95% CI 0.8 to 3.2; P = 0.19) and experienced acute exacerbations (logistic regression OR 1.4, 95% CI 0.7 to 2.8; P = 0.33), but results on both outcomes are imprecise, precluding any conclusions.
Secondary outcomes
The following outcomes were not reported.
-
Self‐efficacy (as measured by the COPD Self‐Efficacy Scale or any validated instrument)
-
Cost‐effectiveness (cost of the intervention and time lost from work)
-
Functional capacity (six‐minute walking test or similar tests)
-
Lung function (forced expiratory volume in one second (FEV1) and FEV1 %predicted)
-
Anxiety and depression (Hospital Anxiety and Depression Scale, Center for Epidemiological Studies Depression Scale (CES‐D))
Sustained behaviour change
Increased physical activity as measured by number of daily steps
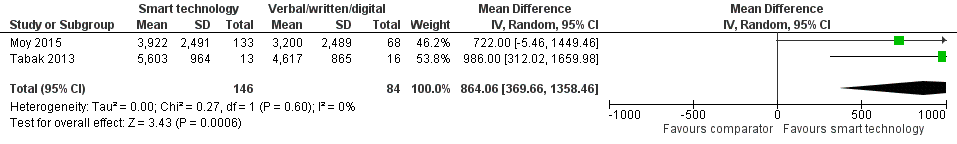
Two studies (Moy 2015; Tabak 2013) measured daily step count using pedometers worn by participants. Moy 2015 reported daily step count at four months and at 12 months. Tabak 2013 reported changes at weekly time points but did not report changes from baseline. Upon comparing intervention and control groups at the final time points (four weeks and four months), we found that the activity levels of people with COPD were significantly better when they used smart technology than when they received face‐to‐face/digital and/or written support (Figure 5; Analysis 1.3; two studies; 230 participants: MD 864.06, 95% CI 369.66 to 1358.46; P = 0.0006).

Forest plot of comparison: 1 Smart technology versus face‐to‐face/digital and/or written support, outcome: 1.3 Daily step count up to four months.
Tabak 2013 (29 participants) measured daily step count at four weeks, and Moy 2015 at four months and 12 months (201 participants at four months and 238 at 12 months). Given the differences in time points for each study, we presented the data for individual studies (Figure 6; Analysis 1.4). We found a mean difference of 986.00 steps (one study; 29 participants: 95% CI 312.02 to 1659.98; P =0.004) in Tabak 2013 as compared with 722.00 daily steps (one study; 201 participants: 95% CI ‐5.46 to 1449.46; P =0.05) at four months and 107 steps at 12 months (one study; 238 participants; 95% CI ‐498.42 to 712.42) in Moy 2015. In both studies, daily steps were significantly better at four weeks and at four months among participants with COPD using smart technology than among those using face‐to‐face/digital and/or written support, but the effect was attenuated and was no longer significant at 12 months.

Forest plot of comparison: 1 Smart technology versus face‐to‐face/digital and/or written support, outcome: 1.5 Daily step count sub group 2 (at 4 weeks).
Voncken‐Brewster 2015 measured increased physical activity using IPAQ‐SF and found no significant treatment effects (Estimated mean difference = ‐84.33, 95% CI ‐476.39 to 307.74; P = 0.673).
Smoking cessation
Voncken‐Brewster 2015 was the only study that measured smoking cessation using a one‐item questionnaire administered at the six‐month follow‐up to assess whether the participant smoked during the previous seven days. Among 1325 total participants in the study, 447 were smokers, and 341 of these individuals completed the follow‐up questionnaire. Logistic regressional analyses revealed that corrected analysis included only intention to quit smoking and showed no significant treatment effect (OR 1.06, 95% CI 0.43 to 2.66; P = 0.895).
Subgroup analysis
Moy 2015 reported on predictors associated with HRQoL and daily step changes at four months. HRQoL was not predicted by any of the baseline predictors. Investigators reported that age was the only baseline predictor that affected daily step count in the intervention group. Moy 2015 also reported that each one‐year increase in age was associated with a 33‐point decrease in daily step count (P = 0.03).
Voncken‐Brewster 2015 conducted a subgroup analysis of smoking and physical activity that was based on age, sex, intention to change behaviour, educational level, dyspnoea, and COPD status and found no significant results for either outcome.
None of the included studies provided numerical data that would have allowed us to undertake subgroup analysis as planned.
Discussion
Summary of main results
The aim of this review was to evaluate the effectiveness of interventions delivered by computer and by mobile technology versus face‐to‐face or hard copy/digital documentary‐delivered interventions, or both, in facilitating, supporting, and sustaining self‐management among people with chronic obstructive pulmonary disease (COPD). Primary outcomes of this review included the number of hospital admissions; the number of acute exacerbations requiring a visit to the doctor and/or additional treatment; and health‐related quality of life (HRQoL) as measured by St George's Respiratory Questionnaire (SGRQ), the Clinical COPD Questionnaire (CCQ), Short Form (SF)‐36, or any validated instrument. Secondary outcomes were self‐efficacy (as measured by the COPD Self‐Efficacy Scale or any validated instrument), cost‐effectiveness (i.e. cost of the intervention and time lost from work), functional capacity (six‐minute walking test or similar), lung function (forced expiratory volume in one second (FEV1) and FEV1 % predicted), and anxiety and depression (Hospital Anxiety and Depression Scale (HADS), Center for Epidemiological Studies Depression Scale (CES‐D)), 'Sustained Behaviour change' (as measured by smoking cessation and daily step count). GRADE ratings, which are illustrated in summary of findings Table for the main comparison, indicate overall low quality of included studies.
Three studies, randomising 557 participants, met our inclusion criteria. We assessed all three studies to be of low methodological quality. All three studies measured the primary outcomes of hospitalisation and acute exacerbation. One study measured our primary outcomes of hospital admissions and acute exacerbations at 12 months; therefore, we provided a narrative analysis. Investigators addressed the secondary outcome of sustained behaviour change that include increased activity level (two studies) and smoking (one study). As only one study included smoking as an outcome, we provided a narrative analysis.
Health‐related quality of life
Using smart technology to support self‐management in people with COPD proved more effective for improving quality of life when compared with face‐to‐face/digital/written educational and supportive materials at four weeks, four months, and six months, but not at 12 months (three studies; Moy 2015; Tabak 2013; Voncken‐Brewster 2015; 472 participants).
Hospitalisation and acute exacerbation
One study (Moy 2015) reported hospitalisations and acute exacerbations at 12 months, but results were imprecise, precluding the possibility of a conclusion.
Sustained behaviour change
Use of smart technology versus face‐to‐face/digital/written educational and supportive materials significantly increased the number of daily steps at four weeks and at four months but not at 12 months (two studies; 230 participants; Moy 2015; Tabak 2013). One study reported that smart technology had no significant effect on smoking cessation (Voncken‐Brewster 2015; 341 participants).
Subgroup analyses
We intended to conduct subgroup analysis on severity of COPD, duration of follow‐up, age, and education level, and were particularly interested in the latter two subgroups of age and education level when assessing the influence of the digital divide on uptake and use of technology. However, two studies (Tabak 2013; Voncken‐Brewster 2015) reported non‐significant results of subgroup analysis for the main outcomes, and Moy 2015 reported that at four months age was the only predictor associated with changes in daily step count, with each one‐year increase in age associated with a decrease in daily step count (P = 0.03). Moy 2015 did not report predictors at 12 months. No studies provided details of subgroup analysis; therefore, it was not possible for the review authors to conduct such an analysis. Data reported by Moy 2015 at four months suggest that age may be a significant factor in the potential success of ehealth interventions, and this should be considered by those developing new technologies for promoting self‐management. It is not clear if this is the result of decreased physical ability due to impaired health, or if consumers use technology in different ways as they age. Given the age profile of the participants in all three studies ‐ mean age 67 years (Moy 2015), 58 years (Voncken‐Brewster 2015), and 66 years (Tabak 2013) ‐ subgroup analysis may have provided significant information, and further research on this topic is required.
None of the studies considered duration of follow‐up for subgroup analysis. Wootton 2012 identified as problematic the mainly short‐term duration of randomised controlled trials (RCTs) testing the effects of telemedicine on self‐management in people with chronic disease and suggested that longer‐term studies are required to identify true effects for people with chronic illness. We found only one study that had a duration of 12 months (four‐month intervention phase followed by an eight‐month maintenance phase), and its findings suggest that effects of the intervention may be attenuated over time (Moy 2015).
Overall completeness and applicability of evidence
Evidence from our review suggests that smart technology (personal computers (PCs) and applications (apps) for mobile technology such as the iPad, Android tablets, smart phones, and Skype) is more effective when compared with face‐to‐face/digital/written educational and supportive materials for improving quality of life among people with COPD up to six months. The same effect was seen in relation to increasing physical activity among people with COPD up to four months; however, these effects were not evident at 12 months. A possible explanation for this is that during the eight‐month maintenance phase, Moy 2015 did not provide updates for educational and motivational content, which remained the same throughout this period. As we judged the evidence provided by the three studies in this review to be of low quality, the limited number of RCTs available and variability in trial outcomes and follow‐up periods led us to conclude that the quality of studies is insufficient to permit firm conclusions or definitive statements based on these data. However, it is encouraging to see that the interventions used in the three studies did not vary greatly. Of note, through our search of the literature, we identified studies that mainly used smart technology supported by healthcare monitoring, but few studies focused on the sole use of smart technology in promoting self‐management for people with COPD, suggesting that this idea is still very much in its infancy and a great deal of additional research is required for definitive confirmation of its true effects. Another issue related to telemedicine and smart technology with monitoring by a healthcare professional and indeed without such monitoring is cost. None of the included studies addressed cost, but both McLean 2012 and Wootton 2012 highlighted the importance of demonstrating cost‐effectiveness of these interventions, and both stated that this has not yet been achieved. It could be argued that smart technology without monitoring by healthcare professionals is more cost‐effective, but it would appear that evidence is insufficient to support its treatment effect or economic benefits.
Quality of the evidence
In accordance with the GRADE system, review authors judged the overall quality of evidence in relation to reported outcomes as low, with the exception of smoking, for which quality is reported as moderate. Review authors identified wide confidence intervals for these outcomes, which may be related to the small number of included studies and the small sample sizes.
Potential biases in the review process
We believe that the potential for bias in this review was high. Review authors followed the protocol meticulously and conducted a broad search that was updated immediately before analysis. When necessary, we had articles translated and contacted study authors to request relevant information for the use of review authors.
Agreements and disagreements with other studies or reviews
Most of the excluded studies provided telemedicine or smart technology interventions that included monitoring by a healthcare professional. Our inclusion criteria required smart technology without a monitoring aspect for self‐management to occur. The Wootton 2012 systematic review of 141 RCTs on the effect of telemedicine on chronic illness management concluded that the evidence base for the value of telemedicine in managing chronic disease is generally weak and contradictory, and evidence suggests significant publication bias. A Cochrane Review by McLean 2012 on telehealthcare for COPD concluded that it did not improve quality of life but did prevent admission to the emergency department and hospitalisation, although it did not affect the number of deaths. Both Wootton 2012 and McLean 2012 reported that the duration of studies is too short to demonstrate an effect. However, even with increased research on telemedicine or smart technology interventions that included monitoring by a healthcare professional, evidence suggests that studies are of poor quality and/or that this type of intervention is ineffective.
Belisario 2013 conducted a systematic review to assess the effectiveness, cost‐effectiveness, and feasibility of using smart phone and tablet apps to facilitate self‐management of individuals with asthma. Only two studies met review inclusion criteria, and, similar to the outcome of this review, these review authors concluded that evidence was insufficient to permit definitive conclusions to advise clinical practitioners, policy‐makers, and the general public regarding the benefits of smart technology for self‐management.
McKinstry 2013 reported on three recent systematic reviews examining remote monitoring technologies for managing COPD. These reviews suggested beneficial effects in terms of reduced hospital admission rates of between 20% and 40%, reduced emergency department visits of 20% to 50%, and, to a lesser extent, reduced effects on quality of life with little effect on mortality. All three studies concluded that evidence is insufficient for review authors to advise on whether these interventions are effective or cost‐effective, and evidence is weakened further by heterogeneity of the technological interventions. Similar to McLean 2012, McKinstry 2013 recommends that future researchers should identify the types of patients most likely to benefit from this technology and ways to develop more sensitive algorithms and physiological methods for detecting exacerbations, while determining the most appropriate outcomes for measurement.
A systematic review by Brenner 2015 on effects of health information technology (IT) on patient outcomes included 69 studies conducted between 2001 and 2012. Thirty‐six percent of these studies reported benefit of health IT, and 62% reported non‐significant or mixed findings. These review authors report that over this 11‐year period, the number of RCTs conducted showed little change, and investigators mainly conducted inpatient, single‐centre, cohort or observational trials. They recommend that larger, higher‐quality studies are needed. Mantoani 2016 conducted a systematic review of interventions to modify physical activity in participants with COPD; review authors included 60 studies and concluded that the quality of evidence was very low. Similarly, Richards 2013 conducted a systematic review of face‐to‐face versus remote and Web 2.0 interventions for promoting physical activity in the general population. Only one study met the criteria of these review authors of reporting a minimum of 12 months' follow‐up from the start of the intervention to final results. Review authors concluded that evidence is insufficient to allow assessment of whether face‐to‐face interventions or remote and Web 2.0 approaches are more effective in promoting physical activity.
Kew 2016a conducted a Cochrane Review on the efficacy of remote versus face‐to‐face check‐ups for asthma. Review authors included in this review parallel RCTs of adults or children with asthma that compared remote check‐ups conducted by using any form of technology versus standard face‐to‐face consultations and excluded studies that used automated telehealth interventions that did not include personalised contact with a health professional. They pooled four studies with a total of 792 people in the main efficacy analyses. They concluded that current evidence does not demonstrate any important differences between face‐to‐face and remote asthma check‐ups in terms of exacerbations, asthma control, or quality of life. Also, owing to insufficient evidence, they were unable to rule out differences in efficacy, or to say whether remote asthma check‐ups are a safe alternative to face‐to‐face contact. Kew 2016b also conducted a Cochrane Review to assess the efficacy and safety of home telemonitoring with healthcare professional feedback between clinic visits, compared with usual care. They included parallel RCTs of adults or children with asthma in whom any form of technology was used to measure and share asthma monitoring data with a healthcare provider between clinic visits, compared with other monitoring or usual care. They excluded trials in which technologies were used for monitoring with no input from a doctor or nurse. These review authors concluded that current evidence does not support the use of telemonitoring with healthcare provider feedback between asthma clinic visits, as the evidence has not proven that additional telemonitoring strategies lead to better symptom control or reduced need for oral steroids over usual asthma care, nor have they ruled out unintended harms.
A Cochrane Review of 25 trials involving telephone support (16 studies, 5613 participants), telemonitoring devices (11 studies, 2710 participants), or both (two studies), concluded that telemonitoring programmes for patients living with chronic illness can reduce the risk of all‐cause mortality by 12% and can reduce all‐cause hospitalisation by 8% to 9%. Additional findings reveal significant improvement in quality of life scores and in overall cost reduction due to a decrease in hospitalisation rates (Inglis 2010). Cost savings ranged from 14% to 86%. However, telemonitoring devices, similar to telephone support, may require clinical support on a regular basis, and available evidence suggests that further clarity on the economic benefits derived is required (Inglis 2010). Telephone support and telemonitoring devices are costly and therefore are not readily available. Although they are technology based, telephone support and telemonitoring devices are conceptually different in terms of purpose and functionality from ICT‐based self‐management interventions that aim to effect sustained behavioural change. Evidence from a qualitative meta‐synthesis of seven studies on the contradictions of telehealth user experience in COPD (Brunton 2015) concluded that patients found this technology helpful in terms of legitimising contact with healthcare providers and providing support for self‐management, and they felt empowered. It is interesting to note that this review presented less positive views of healthcare professionals who felt that telemedicine increased their work burden and undermined their professional identity.
Important issues emerging from our review and others include the following: lack of high‐quality studies; small number of studies conducted on this topic; lack of consistency in terms of outcomes measured; and insufficient duration for longitudinal measurement of effect. Consequently, available high‐quality evidence is insufficient to permit conclusions about the benefits of smart technology or monitoring technology for self‐management of chronic illness, including COPD, or even for health outcomes such as physical activity in the general population.
It is worth considering why the number of studies being conducted is not higher. Davis 2014 conducted a systematic review of clinician and staff views on the acceptability of incorporating remote monitoring technology into primary care. Similar to the findings of Brunton 2015, these review authors concluded that they found significant concerns among healthcare staff regarding the relevance, changing clinical roles, and patterns of care related to the use of remote technology. This will ultimately affect how successful implementation of remote technology is for improving health outcomes in patients with chronic conditions such as COPD. These findings may also provide some explanation as to why high‐quality research is not being conducted to a sufficient standard or rate to yield substantial evidence to inform practitioners of the benefits of technology in health care.
PRISMA flow diagram.

Risk of bias summary: review authors' judgements about each risk of bias item for each included study.

Forest plot of comparison: 1 Smart technology versus face‐to‐face/digital and/or written support, outcome: 1.1 Health related quality of life (CCQ and SGRQ) up to six months.

Forest plot of comparison: 1 Smart technology versus face‐to‐face/digital and/or written support, outcome: 1.2 Health related quality of life (CCQ only) up to six months
Forest plot of comparison: 1 Smart technology versus face‐to‐face/digital and/or written support, outcome: 1.3 Daily step count up to four months.

Forest plot of comparison: 1 Smart technology versus face‐to‐face/digital and/or written support, outcome: 1.5 Daily step count sub group 2 (at 4 weeks).

Comparison 1 Smart technology versus face‐to‐face/digital and/or written support, Outcome 1 Health‐related quality of life (CCQ and SGRQ) up to 6 months.
Comparison 1 Smart technology versus face‐to‐face/digital and/or written support, Outcome 2 Health‐related quality of life (CCQ only) up to 6 months.

Comparison 1 Smart technology versus face‐to‐face/digital and/or written support, Outcome 3 Daily step count up to 4 months.

Comparison 1 Smart technology versus face‐to‐face/digital and/or written support, Outcome 4 Daily step count (all time points).
| Smart technology compared with face‐to‐face/digital and/or written support for self‐management in chronic obstructive pulmonary disease | ||||||
| Participant or population: adults with a clinical diagnosis of COPD | ||||||
| Outcomes | Anticipated absolute effects* (95% CI) | Relative effect | Number of participants | Quality of the evidence | Comments | |
| Risk with face‐to‐face/digital and/or written support | Risk with smart technology | |||||
| Hospital admission | ‐ | ‐ | ‐ | 239 (1 RCT; Moy 2015 at 12 months) | ⊕⊕ Lowa | Hospital admission not reported at 4 months. At 12 months. smart technology did not significantly impact the number of hospital admissions |
| Acute exacerbations requiring general practitioner (GP) visit and/or additional treatment | ‐ | ‐ | ‐ | 239 (1 RCT; Moy 2015 at 12 months) | ⊕⊕ Lowa | Acute exacerbations were not reported at 4 months. At 12 months, smart technology did not significantly impact the number of acute exacerbations |
| Health‐related quality of life (HRQoL) | Mean HRQoL ranged across control groups from 0.08 to 1.686 | SMD in HRQoL in the intervention group was 0.22 lower (0.44 to 0.03 lower) | ‐ | 472 (3 RCTs) | ⊕⊕ Lowa | Lower scores on both SGRQ and CCQ indicate better HRQoL. The SGRQ scale ranges from 0 to 100, and a change in score of 4 units is regarded as the minimum clinically important difference (MCID). The SMD in the lower score indicates better HRQoL with smart technology |
| Daily step count | Mean daily step count was 3200 to 4617 steps | Mean daily step count in the intervention group improved by 864 steps (369.66 to 1358.46 higher) | ‐ | 230 (2 RCTs; Moy 2015 at 4 months and Tabak 2013 at 4 weeks) | ⊕⊕ Lowa | The follow‐up period differed between studies, from 4 weeks to 4 months. Smart technology significantly improved physical activity as seen in daily step counts |
| Self‐efficacy | ‐ | ‐ | 0 | ‐ | This outcome was not measured in any of the included studies | |
| Behaviour change: smoking cessation | ‐ | ‐ | 284 (1 RCT) | ⊕⊕⊕ | Results showed no significant effect on smoking cessation | |
| Functional capacity (6‐minute walking test or similar) | ‐ | ‐ | 0 | ‐ | None of the included studies measured this outcome | |
| Anxiety and depression | ‐ | ‐ | 0 | ‐ | None of the included studies measured this outcome | |
| *The risk in the intervention group (and its 95% confidence interval) is based on assumed risk in the comparison group and the relative effect of the intervention (and its 95% CI) | ||||||
| GRADE Working Group grades of evidence | ||||||
| aCI is wide owing to the small number of studies and the small sample sizes, which may impact precision of estimates bCI is wide owing to the single study and the small sample size, which may impact precision of estimates | ||||||
| Outcome or subgroup title | No. of studies | No. of participants | Statistical method | Effect size |
| 1 Health‐related quality of life (CCQ and SGRQ) up to 6 months Show forest plot | 3 | 472 | Std. Mean Difference (IV, Random, 95% CI) | ‐0.22 [‐0.40, ‐0.03] |
| 2 Health‐related quality of life (CCQ only) up to 6 months Show forest plot | 2 | 251 | Mean Difference (IV, Random, 95% CI) | ‐0.28 [‐0.44, ‐0.12] |
| 3 Daily step count up to 4 months Show forest plot | 2 | 230 | Mean Difference (IV, Random, 95% CI) | 864.06 [369.66, 1358.46] |
| 4 Daily step count (all time points) Show forest plot | 2 | Mean Difference (IV, Random, 95% CI) | Totals not selected | |
| 4.1 Daily step count at 4 weeks | 1 | Mean Difference (IV, Random, 95% CI) | 0.0 [0.0, 0.0] | |
| 4.2 Daily step count at 4 months | 1 | Mean Difference (IV, Random, 95% CI) | 0.0 [0.0, 0.0] | |
| 4.3 Daily step count at 12 months (after 8‐month 'maintenance' phase) | 1 | Mean Difference (IV, Random, 95% CI) | 0.0 [0.0, 0.0] | |