Robot‐assisted surgery in gynaecology
Abstract
Background
This is an updated merged review of two originally separate Cochrane reviews: one on robot‐assisted surgery (RAS) for benign gynaecological disease, the other on RAS for gynaecological cancer. RAS is a relatively new innovation in laparoscopic surgery that enables the surgeon to conduct the operation from a computer console, situated away from the surgical table. RAS is already widely used in the United States for hysterectomy and has been shown to be feasible for other gynaecological procedures. However, the clinical effectiveness and safety of RAS compared with conventional laparoscopic surgery (CLS) have not been clearly established and require independent review.
Objectives
To assess the effectiveness and safety of RAS in the treatment of women with benign and malignant gynaecological disease.
Search methods
For this update, we searched the Cochrane Central Register of Controlled Trials (CENTRAL) (2014, Issue 5) and the Cochrane Gynaecological Cancer Review Group Trials Register. We also searched MEDLINE and EMBASE databases, to complement the searches of the original malignant and benign disease reviews (conducted up to July 2010 and November 2011, respectively), from July 2010 to June 2014.
Selection criteria
Randomised controlled trials (RCTs) of RAS compared with CLS or open surgery in women requiring surgery for gynaecological disease.
Data collection and analysis
Two review authors independently assessed the studies for inclusion and risk of bias, and extracted study data and entered them into an Excel spreadsheet. We subgrouped data according to type of procedure and pooled data using random‐effects methods in RevMan 5.3. We performed sensitivity analyses by excluding studies at high risk of bias.
Main results
We included six RCTs involving 517 women. Most were at low to moderate overall risk of bias; one was at high risk of bias. Four studies evaluated RAS for hysterectomy (371 women), and two studies evaluated RAS for sacrocolpopexy (146 women). All studies compared RAS with CLS, except for one study, which compared RAS with CLS or a vaginal surgical approach for hysterectomy. Confidence intervals for the risk of intraoperative and postoperative complications included benefits with either approach when they were analysed together (risk ratio (RR) 0.95, 95% confidence interval (CI) 0.46 to 1.99; participants = 513; studies = 6; I2 = 74%) and separately (low‐quality evidence). Moderate‐quality evidence was found for the effects of RAS on intraoperative injury when compared with CLS (RR 1.23, 95% CI 0.44 to 3.46; participants = 415; studies = 5; I2 = 0%), along with low‐quality evidence for bleeding and infection complications.
Mean total operating time was consistent across procedures and on average was about 42 minutes longer in the RAS arm compared with the CLS arm (95% CI 17 to 66 minutes; participants = 294; studies = 4; I2 = 82%; moderate‐quality evidence). Mean hospital stay for hysterectomy procedures was on average about seven hours shorter in the RAS arm than in the CLS arm (mean difference (MD) ‐0.30 days, 95% CI ‐0.54 to ‐0.06; participants = 217; studies = 2; I2 = 0%; low‐quality evidence). The estimated effect of conversion with RAS compared with CLS was imprecise (RR 1.28, 95% CI 0.40 to 4.12; participants = 337; studies = 4; I2 = 0%; moderate‐quality evidence). Limited data from two studies suggest that RAS for sacrocolpopexy may be associated with increased postoperative pain compared with CLS; this needs further investigation. We identified five ongoing trials—four of cancer surgery.
Authors' conclusions
We are uncertain as to whether RAS or CLS has lower intraoperative and postoperative complication rates because of the imprecision of the effect and inconsistency among studies when they are used for hysterectomy and sacrocolpopexy. Moderate‐quality evidence suggests that these procedures take longer with RAS but may be associated with a shorter hospital stay following hysterectomy. We found limited evidence on the effectiveness and safety of RAS compared with CLS or open surgery for surgical procedures performed for gynaecological cancer; therefore its use should be limited to clinical trials. Ongoing trials are likely to have an important impact on evidence related to the use of RAS in gynaecology.
PICO
Plain language summary
Use of computer or robotic technology to assist surgeons in performing gynaecological surgery
This is an updated review originally covered by two separate Cochrane reviews on robot‐assisted surgery for benign and malignant gynaecological disease.
The question
Laparoscopic surgery is widely used in gynaecology. Robot‐assisted surgery (RAS) is a relatively new type of laparoscopic surgery, which allows the surgeon to conduct the operation from a computer console situated away from the patient via remote‐controlled mechanical arms attached to the surgical table. RAS is already in use in several countries for gynaecological surgery, particularly for hysterectomy (removal of the uterus/womb), and has been reported to be useful for myomectomy (removal of uterine fibroids), tubal reanastomosis (joining two ends of one fallopian tube to restore fertility), sacrocolpopexy (designed to repair vaginal vault prolapse, when the uppermost part of the vagina slips downwards) and other procedures for benign (non‐cancerous) disease. It has also been used for treatment of women with gynaecological cancers, especially endometrial (lining of the womb) and cervical cancers. However, the benefits and risks of RAS versus standard surgical approaches have not been clearly established.
How we conducted the review
We identified studies by searching databases and writing to researchers of registered trials. Two review authors independently assessed studies and collected the data from each study. We included only randomised controlled trials. We pooled data from similar individual studies in the analyses, grouping them by the type of operation performed (hysterectomy or sacrocolpopexy).
Findings
We included six studies involving 517 women with benign gynaecological disease (not cancer). One study was determined to be at high risk of bias. We are uncertain as to whether RAS or conventional laparoscopic surgery (CLS) has lower overall complication rates because the evidence gathered was of low quality. We combined data from four studies showing that RAS procedures took about 42 minutes longer on average, but results varied across the studies, although on average women who underwent hysterectomy had a shorter hospital stay of about seven hours; the quality of the evidence was low. We identified five ongoing trials—four of cancer surgery.
Conclusions
Low‐quality evidence applicable to hysterectomy and sacrocolpopexy operations suggests that complication rates for RAS may not be different from those for CLS. Moderate‐quality evidence suggests that these procedures take longer with RAS but may be associated with a shorter stay in hospital. Evidence on RAS for cancer surgery is lacking. Additional research is needed.
Authors' conclusions
Summary of findings
| Robot‐assisted surgery (RAS) compared with conventional laparoscopic surgery (CLS) for gynaecological disease | ||||||
| Patient or population: women with benign gynaecological disease requiring surgery Settings: hospital Intervention: RAS Comparison: CLS | ||||||
| Outcomes | Illustrative comparative risksa (95% CI) | Relative effect | Number of participants | Quality of the evidence | Comments | |
| Assumed risk | Corresponding risk | |||||
| CLS | RAS | |||||
| Intraoperative and postoperative complications | All procedures (subgroups were similar) | RR 0.95 (0.46 to 1.99) | 513 (6) | ⊕⊕⊝⊝ | Downgraded because of inconsistency (I2 = 74%) and imprecision. Early studies favoured CLS, whereas later studies favoured RAS but had other limitations | |
| 19 per 100 | 18 per 100 (9 to 38) | |||||
| Intraoperative complications only | All procedures (subgroups were similar) | RR 1.71 (0.83 to 3.52) | 337 (4) | ⊕⊕⊝⊝ | Downgraded because of imprecision and study limitations (2 early studies contributed 16/17 adverse events in the RAS arm). Sensitivity analyses suggest that effect estimate is likely to change | |
| 6 per 100 | 10 per 100 | |||||
| Postoperative complications only | Hysterectomy | RR 0.62 (0.30 to 1.29) RR 3.54 (1.31 to 9.56) | 315 (3) 68 (1) | ⊕⊕⊝⊝ ⊕⊝⊝⊝ | Downgraded because of imprecision and study limitations. Early studies tend to favour CLS, whereas later studies favour RAS but had other limitations Only 1 small, early study reported data, which included urinary tract infections | |
| 16 per 100 | 10 per 100 | |||||
| Sacrocolpopexy | ||||||
| 12 per 100 | 42 per 100 | |||||
| Intraoperative injury | All procedures (subgroups were similar) | RR 1.23 (0.44 to 3.46) | 415 (5) | ⊕⊕⊕⊝ | Downgraded because of imprecision | |
| 3 per 100 | 4 per 100 (1 to 10) | |||||
| Total operating time (minutes) | Mean total operating time ranged across control groups from | Mean total operating time in the intervention groups ranged from | MD 41.71 (17.08 to 66.33) | 294 (4) | ⊕⊕⊕⊝ | Downgraded because of inconsistency (I2 = 82%). 2 studies that could not be included in the meta‐analysis reported no significant differences in median operating times |
| Overall hospital stay (days) | Hysterectomy | MD ‐0.30 (‐0.54 to ‐0.06) | 217 | ⊕⊕⊝⊝ | Downgraded because of risk of bias concerns and imprecision (effect estimate ranged from 1 to 13 hours shorter hospital stay in RAS group) | |
| Mean hospital stay ranged across control groups from 1.4 to 3.6 days | Mean hospital stay in the intervention groups was | |||||
| Sacrocolpopexy | MD 0.37 (‐0.16 to 0.90) | 68 (1) | ⊕⊕⊝⊝ | Downgraded because of study limitations and sparse data | ||
| Mean hospital stay in the control group was 1.42 days | Mean hospital stay in the intervention group was 1.79 days | |||||
| Conversion to another approach | All procedures (subgroups were similar) | RR 1.29 (0.40 to 4.16) | 338 | ⊕⊕⊕⊝ | Downgraded because of imprecision | |
| 3 per 100 | 4 per 100 | |||||
| aThe basis for the assumed risk for dichotomous data is the mean control group risk across studies. The corresponding risk (and its 95% confidence interval) is based on the assumed risk in the comparison group and the relative effect of the intervention (and its 95% CI). | ||||||
| GRADE Working Group grades of evidence. | ||||||
Background
This is an updated review of two originally separate Cochrane reviews concerning the use of robot‐assisted surgery for benign gynaecological disease (Liu 2012) and for gynaecological cancer (Lu 2012).
Description of the condition
Common benign gynaecological conditions include uterine fibroids, endometriosis (endometrial tissue found outside of the uterus), benign ovarian tumours, pelvic organ prolapse and vesicovaginal fistula (a passage between the bladder and the vagina), among others. Surgery for such conditions may involve removal of the affected part or structure (e.g. hysterectomy (removal of the uterus), myomectomy (removal of fibroids), ovarian cystectomy (removal of ovarian cysts)), endometriosis surgery or surgical repair (e.g. sacrocolpopexy (designed to repair vaginal prolapse, where the uppermost part of the vagina slips downwards), fistula repair, tubal reanastomosis (joining two ends of one fallopian tube to restore fertility)). Hysterectomy is the most commonly performed major gynaecological operation; one in five women in the United Kingdom and one in three women in the USA are likely to undergo the procedure during their lifetime (Hyst 2013). Hysterectomies and most other surgical procedures for benign gynaecological conditions can be performed effectively via a laparoscopic approach.
Malignant gynaecological conditions may affect the uterus, ovaries, fallopian tubes, cervix, vagina and vulva and account for 10% to 15% of cancers in women, with differing incidence and prognosis depending on geographical location (Jemal 2011). Worldwide, cervical, endometrial and ovarian cancers are the fourth, fifth and eighth most common cancers, respectively, affecting women up to the age of 65 years (Jemal 2011). However, in developed countries, endometrial cancer is the most common gynaecological cancer, followed by ovarian cancer, whereas cervical cancer is the most common gynaecological cancer in developing countries (Jemal 2011). A high proportion of endometrial and cervical cancers are detected at an early stage in developed countries, where the primary approach to management of these conditions is surgical. For early endometrial cancer, surgery involves hysterectomy and bilateral salpingo‐oophorectomy (BSO) with or without lymphadenectomy; surgery for early cervical cancer involves a radical hysterectomy (removal of the uterus, cervix, upper vagina, parametria and pelvic lymph nodes). Ovarian cancer frequently is detected only at an advanced stage and typically requires more extensive surgery, including hysterectomy, BSO, pelvic and para‐aortic lymphadenectomy, omentectomy, appendectomy and abdominal exploration. Staging procedures are usually conducted via laparotomy; however, minimally invasive approaches are increasingly being used, particularly for early‐stage endometrial and cervical cancers. A 2012 Cochrane review of laparoscopy for endometrial cancer found that laparoscopy was associated with reduced operative morbidity and hospital stay, and with survival similar to that of laparotomy (Galaal 2012). However, the role of laparoscopy in early cervical and ovarian cancer surgery has not been established (Kucukmetin 2013; Lawrie 2013).
Description of the intervention
Robot‐assisted surgery (RAS), also known as robotic surgery, robot‐assisted laparoscopic surgery or computer‐assisted surgery, is a recent innovation in the field of minimally invasive surgery. Although not yet widely available in most countries, in the past decade the use of robotic surgical systems for all kinds of gynaecological and non‐gynaecological surgery has increased. One of the first applications of RAS was AESOP (Automated Endoscopic System for Optical Positioning; Computer Motion, Goleta, CA, USA), a voice‐activated endoscope (Mettler 1998). Another predecessor of the current system was the ZEUS Robotic Surgical System (ZRSS) (Computer Motion). ZEUS consisted of three remote‐controlled robotic arms attached to the surgical table, along with a robotic console, which housed the instrument controls. This differed from earlier models in that it allowed the surgeon to step away from the operating table. Early studies reported successful application of ZEUS for tubal reanastomosis (Falcone 2000). In 2003, Computer Motion merged with its rival company Intuitive Surgical, and these earlier systems were discontinued. The merged company instead developed the da Vinci ® Surgical System, which became commercially available for gynaecological surgery in 2005.
The da Vinci® Surgical System (Intuitive Surgical, Sunnyvale, CA, USA) consists of three components: a surgeon‐operated console with stereoscopic viewer and hand and foot controls, three‐dimensional (3‐D) stereoscopic imaging through an endoscope and a patient‐side cart with three or four robotic arms with swivelling instruments, which are reported to be more dexterous than the human hand (Holloway 2009a). This system is currently the only commercially available robotic surgical platform that has received US Food and Drug Administration (FDA) approval for performing gynaecological procedures. According to the manufacturer's website (www.intuitivesurgical.com), more than 1.5 million operations have been performed and more than 2000 da Vinci ® units have been sold worldwide (da Vinci 2014). In addition, the company's USA market share for hysterectomies performed for benign conditions was apparently 27% in 2011 (da Vinci 2014).
How the intervention might work
Minimally invasive surgery is a surgical approach that minimises surgical incisions to reduce trauma to the body. Laparoscopic surgery is a type of minimally invasive surgery whereby the surgeon makes small incisions in the abdominal wall, through which fine instruments are then inserted. Such instruments include a laparoscope (a camera with magnification), which allows structures within the abdomen and the pelvis to be visualised. In conventional laparoscopic surgery (CLS), the laparoscope and other instruments are held and physically directed by the surgeon or a surgical assistant; this requires a high degree of dexterous skill and training (Ramsey 2012). The main disadvantage of any laparoscopic system compared with laparotomy is the lack of tactile perception (haptic feedback), although the importance of tactile perception in most gynaecological procedures is currently unknown (Moy 2010). Laparoscopic surgery is increasingly preferred to laparotomy (open abdominal surgery) for several gynaecological procedures. For benign ovarian tumours, laparoscopic surgery is associated with fewer perioperative complications, less postoperative pain and a shorter hospital stay compared with laparotomy (Medeiros 2009). A review of laparoscopic surgery for early endometrial cancer reported similar advantages, with no differences in survival (Galaal 2012).
Robot‐assisted surgery (RAS) is a technological advance in CLS in that the laparoscope and the surgical instruments are part of a mechanical system that the surgeon operates from a separate console. Advocates of RAS claim that the system is more comfortable for the surgeon and offers additional technical advantages compared with CLS, including 3‐D vision, minimisation of the effects of hand tremors, greater freedom of motion, greater precision in dissection, easier suturing and knot tying and a shorter learning process (Cho 2009). Compared with CLS, these advantages have the potential to translate into reduced perioperative complications, blood loss, postoperative pain and hospital stay, and increased survival in malignant disease. However, several disadvantages are known, including the high cost of the equipment and disposable instruments, complete lack of haptic feedback and the need to train both surgeons and nurses. Furthermore, some aspects of RAS, for example, the number of port incisions required, might increase risks associated with the procedure compared with the conventional approach.
Role of RAS in benign gynaecological disease
Since the late 1990s, RAS has been used in gynaecological surgery, and a proliferation of reports have described its applications. For benign disease, the most commonly performed robot‐assisted gynaecological operation is hysterectomy. Various aspects of robot‐assisted laparoscopic hysterectomy are reported to be performed more easily than with CLS, such as securing the uterine vessels and cardinal ligaments, performing an accurate colpotomy and oversewing the vaginal cuff (Dimitri 2010; Lenihan 2008; Nezhat 2006; Reynolds 2006). Other reports of robot‐assisted procedures include myomectomy (Advincula 2004; Advincula 2007; Cela 2013; Gocmen 2013; Nezhat 2009), tubal reanastomosis to restore fertility (Degueldre 2000; Dharia 2008; Rodgers 2007), sacrocolpopexy, repair of vesicovaginal fistulas (Hemal 2008; Melamud 2005; Schimpf 2007; Sundaram 2006) and complex endometriosis surgery (Cadiere 2001; Nezhat 2006; Sener 2006). Preliminary studies of RAS for these procedures have indicated that they can feasibly be performed with RAS.
Role of RAS in gynaecological cancers
Surgical staging operations for gynaecological malignancies are lengthy procedures, which can lead to surgeon fatigue and muscular complaints that may limit the surgeon's performance (Verheijen 2012). For endometrial cancer, an increasing number of non‐randomised studies describe excellent results with RAS, including good lymph node yield, low blood loss, comparable operative time, low complication and conversion rates and short hospital stays (Bell 2008; Cardenas‐Goicoechea 2010; Coronado 2012; DeNardis 2008; Field 2007; Gehrig 2008; Holloway 2009b; Lambaudie 2008; Reynisson 2013; Reynolds 2005; Seamon 2009a; Shafer 2008; Veljovich 2008). Few studies have evaluated survival following RAS staging; however, a retrospective review of 499 women who underwent RAS endometrial cancer staging suggests that recurrence‐free and overall survival rates are not adversely affected (Kilgore 2013).
For cervical cancer, studies of robot‐assisted laparoscopic radical hysterectomy have reported favourable results compared with CLS, including reduced blood loss, shorter hospital stay and lesser analgesia requirements (Boggess 2008a; Fanning 2008; Kim 2008; Lowe 2009; Maggioni 2009; Magrina 2008; Nezhat 2008; Persson 2009; Soliman 2013). Furthermore, case reports suggest that robot‐assisted trachelectomy may provide a good option for women seeking to preserve fertility, because it allows excellent visualisation of the vasculature and parametrial tissues (connective tissue and fat adjacent to the uterus), which must be isolated during the procedure (Diaz 2008; Geisler 2008; Persson 2008; Plante 2008).
Reports of RAS for ovarian cancer are uncommon because of the difficulty involved in extensive exploration of the abdomen with RAS (and CLS). However, limited evidence suggests that selected early cases may be suitable (Finger 2014; Madhuri 2012; Verheijen 2012). Vergote 2008 reported on a series of five patients undergoing retroperitoneal node assessment using RAS with excellent results, including brief hospital stays and minimal blood loss. All procedures were completed with less than one hour console time, and the study authors concluded that robotic retroperitoneal para‐aortic sampling is a feasible procedure that warrants further evaluation.
Why it is important to do this review
Robot‐assisted surgery (RAS) is a new technology that may confer advantages (or disadvantages) compared with the conventional surgical approaches used in gynaecology. As with any new healthcare technology, RAS requires rigorous evaluation. RAS is controversial because of the significant commercial interests involved, and, because the technology is expensive, reports tend to be generated by proponents of the approach. In the USA, according to Schiavone 2012, marketing of RAS by hospitals for gynaecology is widespread, with potential limitations and costs rarely presented to women and with most websites claiming reduced pain, shorter recovery time and less blood loss with RAS. Yet individual studies and reviews to date have provided insufficient evidence of the clinical effectiveness of RAS compared with CLS. In addition, considerable risk of bias has been noted in a review of mainly non‐randomised studies of RAS versus other approaches for hysterectomy (O'Neill 2013).
The high cost of robotic systems may be mitigated if significant clinical benefits over CLS can be independently proven. It has been suggested that costs may also be mitigated by indirect benefits for the surgeon (ergonomics, healthcare costs) (Nieboer 2014).
Our original reviews of RAS in benign and malignant gynaecological disease (Liu 2012; Lu 2012) yielded few high‐quality studies and little evidence to support claims of equivalence and/or superiority over conventional, less expensive approaches. Only two small RCTs (both for benign disease) contributed data, and no robust conclusions could be drawn. Over the past two years, the results of several RCTs have been published, potentially providing evidence of the clinical effectiveness of RAS compared with CLS. We have updated this review to aid decision making by women, clinicians and other stakeholders.
Objectives
To assess the effectiveness and safety of RAS in the treatment of women with benign and malignant gynaecological disease.
Methods
Criteria for considering studies for this review
Types of studies
We included randomised controlled trials (RCTs) only.
Types of participants
Women requiring surgery for benign or malignant gynaecological disease at any age.
Types of interventions
-
Robot‐assisted surgery (RAS) versus conventional laparoscopic surgery (CLS).
-
RAS versus open surgery.
-
Comparison of different types of robot assistants.
Types of outcome measures
Primary outcomes
-
Intraoperative complications including injury to the bladder, ureters, bowel, blood vessels and nerves.
-
Postoperative complications including vascular (e.g. haemorrhage, deep vein thrombosis), wound (e.g. infection, dehiscence (wound breakdown)), gastrointestinal (e.g. bowel obstruction due to fibrous adhesions, paralytic ileus due to paralysis of intestinal muscles, incisional hernia (a swelling caused by tissue poking through a surgical wound)), neurological, respiratory (e.g. pneumonia, embolism (blood clot in a lung blood vessel)) and urinary complications (e.g. acute urinary retention).
Secondary outcomes
For all procedures.
-
Early and late mortality (early mortality defined as death within 30 days; late mortality defined as death within three months).
-
Total operating time (from skin incision to closure).
-
Instrument setup time.
-
Overall and postoperative duration of hospital stay.
-
Estimated blood loss.
-
Blood transfusion.
-
Rate of conversion to open surgery (for RAS versus CLS).
-
Quality of life (QoL) as assessed using validated scales (e.g. Quality of Life Questionnaire‐Core 30 (QLQ‐C30)—developed to assess the quality of life of people with cancer, Functional Assessment of Cancer Therapy‐Ovarian (FACT‐O)).
-
Postoperative pain as assessed using visual analogue or other validated scales.
-
Total cost (including equipment costs, theatre costs and hospital stay).
-
Surgeon's performance and workload as assessed by investigators (e.g. using NASA Task Load Index (NASA‐TLX)).
Additionally, for cancer surgery.
-
Disease‐free survival.
-
Overall survival.
-
Numbers of lymph nodes harvested: total, pelvic and para‐aortic lymph nodes.
Search methods for identification of studies
Electronic searches
For this merged and updated review, a combined search strategy was developed and the following databases searched (30 June 2014).
-
Cochrane Gynaecological Cancer Review Group Trials Register.
-
Cochrane Central Register of Controlled Trials (CENTRAL) (2014, Issue 5).
-
MEDLINE (July 2010 to June week 3 2014).
-
EMBASE (July 2010 to week 26 2014).
Search strategies can be found in Appendix 1, Appendix 2 and Appendix 3. All potentially eligible articles were identified on PubMed, and searches for related articles were performed using the 'Related articles' feature.
Original searches
The original searches (14 July 2010) for the review of 'Robotics and malignant disease' (Lu 2012) were conducted as follows.
-
Cochrane Gynaecological Cancer Review Group Trials Register.
-
CENTRAL (2010, Issue 3).
-
MEDLINE (from 1950 to June week 5 2010).
-
EMBASE (from 1974 to week 27 2010).
Similarly, the original searches from inception to 21 November 2011 were performed for the review of 'Robotics and benign disease.' In addition, the Cochrane Menstrual Disorders and Subfertility Group (MDSG) Trials Register, the Chinese Biomedical Literature Database (CBM) and Chinese Medical Current Contents (CMCC) were searched. Search strategies for the original reviews can be found as appendices to the respective original reviews (Liu 2012; Lu 2012).
Searching other resources
Grey literature
We searched metaRegister, Physicians Data Query, www.controlled‐trials.com/rct, www.clinicaltrials.gov and www.cancer.gov/clinicaltrials for ongoing trials. The main investigators of identified ongoing trials were contacted for further information.
Handsearching
We handsearched the reference lists of all relevant trials obtained by the search to look for further trials.
Correspondence
We contacted the authors of relevant trials to ask if they knew of further published and unpublished data.
Language restrictions
We sought papers in all languages and carried out translations if necessary.
Data collection and analysis
Selection of studies
For the update, all titles and abstracts retrieved by electronic searching were downloaded to the reference management database Endnote. After deduplication, two review authors (DongHao Lu (DL) and Theresa Lawrie (TL)) independently examined the remaining references. We excluded studies that clearly did not meet the inclusion criteria and obtained copies of the full text of potentially relevant references. These were assessed independently for eligibility by two review authors (DL,TL), who resolved disagreements by discussion and if necessary involved a third review author (Hongqian Liu (HL)). We documented reasons for exclusion.
Data extraction and management
We designed a data extraction form for the combined review and piloted it using two of the eligible studies (Paraiso 2013; Sarlos 2010). Thereafter, two review authors (DL, TL) independently extracted data from eligible studies. When studies had multiple publications, we used the main trial report as the reference and supplemented these data by referring to the secondary papers. When previously included data had been included from unpublished studies (e.g. conference abstracts) that had been subsequently published, we reextracted data from the published full texts for this updated review. When necessary, we sought additional information on methodology and data from trial investigators. We resolved differences of opinion by reaching consensus or by obtaining the assistance of a third review author (HL).
When possible, we extracted the following data from each study.
-
Study details: design; setting; country; accrual dates; sample size; inclusion and exclusion criteria; funding source.
-
Participants: diagnosis/indication for procedure (e.g. benign conditions, including fibroids, abnormal bleeding, endometriosis, fertility surgery, vaginal prolapse; malignant disease, including endometrial, cervical and ovarian cancers); mean age; mean body mass index (BMI); previous abdominal surgery; performance status. Additionally, for cancer studies: disease stage/grade.
-
Interventions: types of interventions compared; numbers randomly assigned and numbers analysed in each group; surgeon experience.
-
Outcomes: for all studies: deaths within 30 days and three months; postoperative complications; intraoperative complications; types of complications (including bleeding, infection, intraoperative injury, bowel obstruction, other); late complications (including urinary and faecal incontinence, dyspareunia, hernia, other); reintervention; readmission; total operating time (skin‐to‐skin); operating room time; length of hospital stay; estimated blood loss; blood transfusions; QoL score at four to six weeks and six months postoperatively; activity score at six weeks postoperatively; pain scores (at two weeks or as defined by investigators); total estimated cost (including equipment costs, theatre costs and hospital stay). For cancer studies: overall survival; disease‐free survival; lymph node yield; duration of response.
Assessment of risk of bias in included studies
We assessed risk of bias in included RCTs using the 'Risk of bias' tool of The Cochrane Collaboration and the criteria specified in Chapter 8 of the Cochrane Handbook for Systematic Reviews of Interventions (Higgins 2011). We assessed the following.
-
Sequence generation (low risk if true random sequence generation was described).
-
Allocation concealment (low risk if sealed, opaque, numbered envelopes or central allocation after registration).
-
Blinding (restricted to blinding of outcome assessors).
-
Incomplete outcome data (considered low risk if > 80% of those randomly assigned were assessed).
-
Selective reporting of outcomes (low risk if prespecified outcomes were reported).
-
Trial funding (low risk if funding was obtained from non‐profit organisations (e.g. government body)).
-
Other possible sources of bias (e.g. a potential source of bias related to the specific study design used, trial stopped early because of some data‐dependent process, extreme baseline imbalance).
Two review authors (DL, TL) applied the 'Risk of bias' tool independently and resolved differences by discussion. We present the results in 'Risk of bias' tables along with the characteristics of each study, and in a 'Risk of bias' summary graph. We interpreted results of meta‐analyses in the light of findings with respect to risk of bias.
Measures of treatment effect
For dichotomous outcomes (e.g. complications), we extracted the number of women in each group who experienced the outcome of interest (e.g. women who developed the complication) and the number of women assessed at endpoint to estimate a risk ratio (RR) with 95% confidence interval (CI).
For continuous outcomes (e.g. QoL measures), we extracted the final value and the standard deviation of the outcome of interest and the number of women assessed at endpoint in each treatment arm, at the end of follow‐up, to estimate the mean difference (MD) with 95% CI. In the case of outcomes with continuous data from different scales, we used standardised mean difference (SMD) with 95% CI.
Time‐to‐event data were not available for this review. For time‐to‐event outcomes (e.g. disease‐free survival), we would have extracted hazard ratios (HRs) and 95% CIs. If these were not presented, we would have attempted to extract the data required to estimate them using Parmar's methods (Parmar 1998) (e.g. number of events in each arm with log‐rank P value comparing relevant outcomes in each arm, relevant data from Kaplan‐Meier survival curves). If it was not possible to estimate the HR, we would have extracted the number of participants in each treatment arm who experienced the outcome of interest and the number of participants assessed to estimate an RR (i.e. dichotomous data).
When possible, we extracted data according to intention‐to‐treat analysis, by which participants were analysed in the groups to which they were assigned.
Unit of analysis issues
The unit of analysis was per woman randomly assigned. No cross‐over trials or cluster‐randomised trials were included.
Dealing with missing data
For included studies, we noted levels of attrition. We did not impute data for any outcomes. If necessary, we contacted the investigators of the primary studies to request missing data, including missing participants due to dropouts and missing statistics. The denominator for each outcome in each trial was the number randomly assigned minus the number of participants whose outcomes were known to be missing. If the numbers randomly assigned and the numbers analysed were inconsistent, the percentage loss to follow‐up was calculated and reported in Characteristics of included studies.
Assessment of heterogeneity
We checked included studies to determine whether participants, interventions and outcomes were similar enough to be pooled in a meta‐analysis. We carried out tests for heterogeneity using the Chi² test, with significance set at P value less than 0.1. We explored statistical heterogeneity by visual inspection of forest plots. We used the I² statistic to estimate the total variation across studies that was due to heterogeneity: less than 25% was considered as mild, 25% to 50% as moderate and greater than 50% as substantial heterogeneity (Higgins 2011). If the primary outcome measures had substantial heterogeneity (I² > 50%), we explored possible sources of heterogeneity using the sensitivity and subgroup analyses described below.
Assessment of reporting biases
We assessed within‐study reporting bias by seeking published protocols and comparing outcomes between the protocol and the final published study. This was not possible for all studies. We planned funnel plots corresponding to meta‐analysis of the primary outcomes to assess the potential for small‐study effects and publication bias if 10 or more studies were included in an analysis. We also planned to assess funnel plot asymmetry visually, and if asymmetry was suggested by visual assessment, we would perform exploratory analyses to investigate this. However, studies were insufficient for evaluation of this type of bias.
Data synthesis
We combined data from included studies using random‐effects (RE) methods with inverse variance weighting for all meta‐analyses (DerSimonian 1986). We chose RE methods because of the clinical heterogeneity of the participants and the different procedures performed (sacrocolpopexy and hysterectomy). We used the Mantel Haenszel method to pool dichotomous data and the inverse variance method for continuous outcomes. For trials with multiple treatment groups, we planned to divide the 'shared' comparison group by the number of treatment groups and comparisons between treatment groups, and to treat the split comparison groups as independent comparisons.
We created 'Summary of findings’ tables in RevMan 5.3 (RevMan 2014) using the GRADE (Grades of Recommendation, Assessment, Development and Evaluation) approach (GRADE 2008). For assessments of the overall quality of evidence for each outcome that included pooled data from RCTs only, we downgraded the evidence from 'high quality' by one level for serious (or by two for very serious) study limitations (risk of bias), indirectness of evidence, serious inconsistency, imprecision of effect estimates or potential publication bias. We included the following outcomes in the 'Summary of findings' table.
-
Intraoperative and postoperative complications (combined and separate).
-
Total operating time.
-
Length of hospital stay.
-
Conversion to another approach.
Subgroup analysis and investigation of heterogeneity
We performed subgroup analyses according to type of surgical procedure (e.g. hysterectomy, sacrocolpopexy) for all outcomes. In addition, we explored potential sources of heterogeneity according to surgeons' experience (30 or fewer robotic procedures or more than 30 robotic procedures performed). We assessed subgroup differences by performing interaction tests available within RevMan (RevMan 2014). We reported the results of subgroup analyses by quoting the Chi² statistic and the P value, as well as the interaction test I² value.
Sensitivity analysis
We conducted sensitivity analyses for the primary outcomes to determine whether the conclusions were robust to arbitrary decisions made regarding eligibility of trials and analysis. These analyses included consideration of whether conclusions would have differed if:
-
eligibility was restricted to studies without high risk of bias for the outcome concerned; or
-
a fixed‐effect model had been adopted.
Results
Description of studies
Results of the search
Searches conducted for the two original reviews contributed the following studies to this combined review:
-
Liu 2012 (benign gynaecological disease) included Sarlos 2010 (conference abstract only) and Paraiso 2011, and excluded three studies (not RCTs). These previously included studies comprised six citations (five conference abstracts and one full published report).
-
Lu 2012 (malignant gynaecological disease) included no studies and excluded 27 studies (not RCTs).
For further details of these searches, please consult the original reviews (Liu 2012; Lu 2012). For this updated review, the combined updated searches yielded 2221 deduplicated study records. After sifting through the titles and abstracts of these records, we identified 15 records for classification (nine full articles and six conference abstracts) pertaining to 10 studies in total (Anger 2014; Campos 2013; Desille‐Gbaguidi 2013; Gocmen 2013; Green 2013; Martinez‐Maestro 2014; McNanley 2012; Palmer 2013; Paraiso 2013; Sarlos 2010). In addition, we identified one newly published paper (Lonnerfors 2014) by writing to the investigators of a trial identified by searching online trial registers. Of these 11 potentially eligible studies in total, we excluded six studies (Campos 2013; Desille‐Gbaguidi 2013; Gocmen 2013; Martinez‐Maestro 2014; McNanley 2012; Palmer 2013) and included four studies (Anger 2014; Green 2013; Lonnerfors 2014; Paraiso 2013) (Figure 1). The remaining paper was a new publication (full report) of a previously included study, which had been previously included as a conference abstract alone (Sarlos 2010).
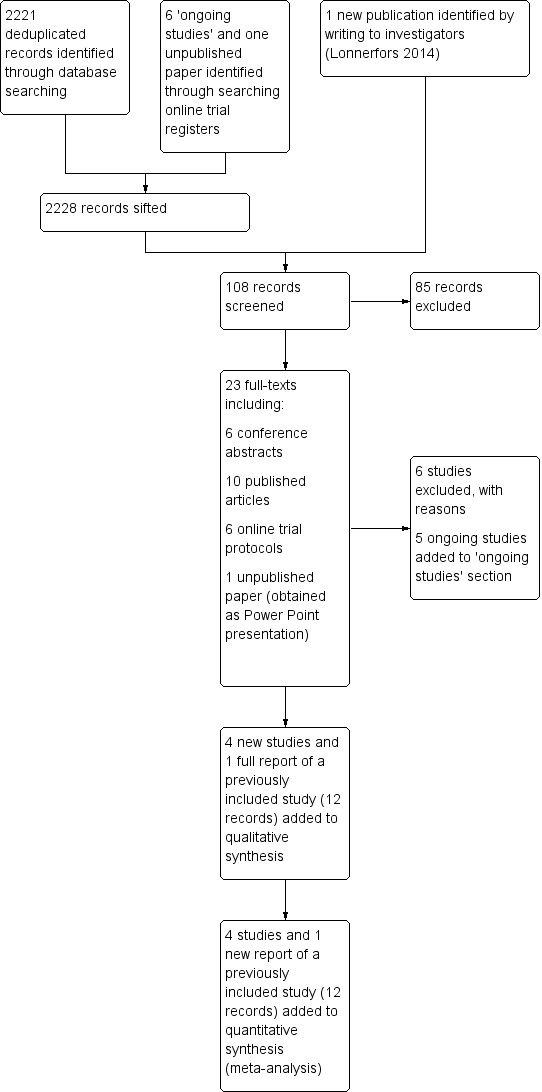
Study flow diagram for updated searches (30 June 2014).
One included study (Green 2013) was a conference abstract of a study initially identified as an 'ongoing study' (see protocol citation linked to Green 2013). We requested unpublished data from these investigators and received limited data in the form of a Microsoft PowerPoint presentation. We were informed by the investigators that they had had difficulty getting the paper published because of 'too many cross‐overs in the stats'; however, we understand that they plan to make further attempts to get the study published. (See Green 2013 in Characteristics of included studies for additional details.)
We identified five ongoing RCTs (Kjolhede 2012; LAROSE 2012; Narducci 2010; Obermair 2008; RASHEC 2013) and contacted these trial investigators for up‐to‐date details about accrual and completion dates. This information is summarised in Table 1.
| Study ID | Malignant (M)/Benign (B) disease | Participants (N) | Number enrolled by June 2014a | Comparison | Procedure | Main outcomes | Primary completion datea |
| Harkins 2013b NCT01581905 | B: menorrhagia, dysfunctional uterine bleeding, fibroids, endometriosis | 400 (closed at 113) | Completed | RAS versus CLS | Hysterectomy | Operating time, EBL, complications, LOS | March 2013 |
| NCT01556204 | B: endometriosis | 74 | ‐ | RAS versus CLS | Surgery for endometriosis | Operating time, pain | December 2013 |
| NCT01247779 | M: cervical, uterine and ovarian cancers | 374 | 320 | RAS versus CLS | Surgical staging procedures | Complications, lymph node yield, surgeons' ergonomy, QoL | June 2015 |
| NCT01526655 | M: endometrial cancer | 50 | 30 | RAS versus open surgery | Hysterectomy, BSO and lavage | QoL, biomarkers, adverse events | December 2015 |
| NCT01847703 | M: endometrial cancer | 100 | 45 | RAS versus open surgery | Hysterectomy, BSO and LA | Lymph node yield, complications | April 2016 |
| NCT00614211 | M: cervical cancer | 740 | 340 | RAS or CLS versus open surgery | Radical hysterectomy | DFS, complications, QoL, OS | July 2018 |
For further details, see Characteristics of ongoing studies.
aUpdated according to contact investigator correspondence when possible.
bSame as Green 2013. This study has been completed but not yet reported in full. Data on 98 women were presented in 2013 and have been included in this review.
Abbreviations: CLS = conventional laparoscopic surgery; DFS = disease‐free survival; EBL = estimated blood loss; LOS = length of stay; OS = overall survival; QoL = quality of life; RAS = robot‐assisted surgery.
Included studies
This update includes six studies (four new and two previously included studies) (Anger 2014; Green 2013; Lonnerfors 2014; Paraiso 2011; Paraiso 2013; Sarlos 2010). All included studies were conducted from 2007 onwards and evaluated RAS in benign gynaecological disease. We identified no RCTs of RAS for malignant gynaecological disease.
Study design
All included studies were RCTs. Most were single‐centre studies; two were conducted at two centres each (Anger 2014; Paraiso 2013). Studies were conducted in the USA (Anger 2014; Green 2013; Paraiso 2011; Paraiso 2013), Switzerland (Sarlos 2010) and Sweden (Lonnerfors 2014).
Participants
Included studies contributed a total of 517 participants as follows: Anger 2014 (66 women); Green 2013 (98 women); Lonnerfors 2014 (122 women); Paraiso 2011 (78 women); Paraiso 2013 (53 women); Sarlos 2010 (100 women). Women participating in studies of RAS for hysterectomy (Green 2013; Lonnerfors 2014; Paraiso 2013; Sarlos 2010) were on average in their mid‐40s, whereas in studies of RAS for sacrocolpopexy (Anger 2014; Paraiso 2011), women were on average about 60 years old. Participant BMIs were not significantly different between study arms for any of these studies, and reported means and medians ranged between 24 and 32 kg/m².
Indications for hysterectomy were stated as benign gynaecological conditions (mainly uterine fibroids or abnormal bleeding) requiring hysterectomy in most studies. Two studies (Green 2013; Sarlos 2010) stated that they excluded women in whom a vaginal hysterectomy was indicated. In the two studies of RAS for sacrocolpopexy, the indication for surgery was symptomatic pelvic organ prolapse. Ninety per cent of women in Paraiso 2011 and 42% of women in Anger 2014 had previously undergone a hysterectomy. No significant baseline differences between study arms were described in any of the studies reporting previous abdominal surgery (Lonnerfors 2014; Paraiso 2013; Sarlos 2010) or caesarean section (Green 2013; Lonnerfors 2014).
Interventions
No included studies compared RAS versus open surgery. All included trials compared RAS versus CLS, except for Lonnerfors 2014, which compared RAS versus other minimally invasive surgery to include CLS or vaginal hysterectomy. Procedures performed were hysterectomy (Green 2013; Lonnerfors 2014; Paraiso 2013; Sarlos 2010) or sacrocolpopexy (Anger 2014; Paraiso 2011). In Anger 2014, 58% of women underwent a concomitant hysterectomy; no statistically significant differences were noted between study arms in the numbers of women undergoing these additional procedures. In Paraiso 2013, concomitant procedures, including culdoplasty, adhesiolysis and excision of endometriosis, were performed with similar frequency between study arms, with four and three women in the RAS and CLS arms, respectively, undergoing more than one concomitant procedure.
In two studies, surgeons had performed a minimum of 10 relevant RAS procedures (Anger 2014; Paraiso 2011), and in three studies, surgeons had performed 20 or more relevant RAS procedures (Lonnerfors 2014; Paraiso 2013; Sarlos 2010). One study (Green 2013) did not describe the experience of the surgeons.
Outcomes
The most common primary outcomes among these studies were cost (Anger 2014; Lonnerfors 2014) and operating time (Green 2013; Paraiso 2011; Paraiso 2013; Sarlos 2010). Most studies included complications and length of hospital stay as secondary outcomes (Green 2013; Lonnerfors 2014; Paraiso 2011; Sarlos 2010). Other stated secondary outcomes included blood loss (Anger 2014; Green 2013; Lonnerfors 2014; Sarlos 2010), QoL (Anger 2014; Paraiso 2011; Paraiso 2013; Sarlos 2010), postoperative pain (Anger 2014; Green 2013; Paraiso 2011; Paraiso 2013), conversion rates (Lonnerfors 2014; Paraiso 2011; Paraiso 2013; Sarlos 2010) and reintervention (Anger 2014; Lonnerfors 2014; Sarlos 2010).
Excluded studies
Thirty non‐randomised studies were excluded from the original reviews. For the updated review, we excluded six additional studies for the following reasons.
-
Quasi‐RCT (Martinez‐Maestro 2014).
-
Not an RCT (Desille‐Gbaguidi 2013; Gocmen 2013).
-
Inappropriate interventions compared (Campos 2013; McNanley 2012; Palmer 2013).
Risk of bias in included studies
Overall, we considered one study to be at high risk of bias (Green 2013) and the other studies to be at low to moderate risk of bias. Risks of bias are summarised in Figure 2 and are detailed below.
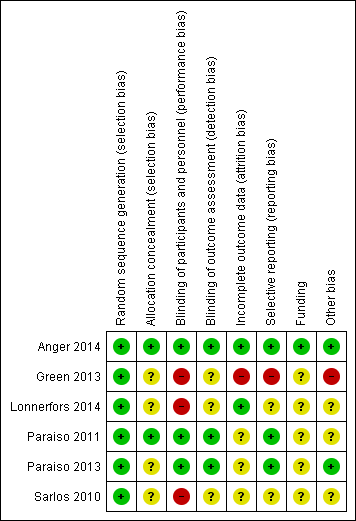
Risk of bias summary: review authors' judgements about each risk of bias item for each included study.
Allocation
All studies were RCTs, and the method of randomisation was adequately described in all of them. We therefore considered these studies to be at low risk of selection bias, except for two RCTs that did not describe allocation concealment (Green 2013; Sarlos 2010). We considered these two studies to be at unclear risk of bias for this item.
Blinding
Three studies (Anger 2014; Paraiso 2011; Paraiso 2013) described blinding participants and assessors to group allocation; we considered these studies to be at low risk of performance and detection bias. The other three studies (Green 2013; Lonnerfors 2014; Sarlos 2010) were open‐label studies; we considered these to be at high risk of performance bias. Additionally, these studies did not report efforts to blind outcome assessment; we therefore considered them to be at unclear risk of detection bias. However, it was not clear in any of the included studies who had assessed outcomes such as extent of blood loss and length of hospital stay, which normally are determined by the surgeon who performed the procedure and therefore are at potentially high risk of bias.
Incomplete outcome data
Two studies reported no or minimal loss to follow‐up (Anger 2014; Lonnerfors 2014) (low risk of bias). In Paraiso 2011, five women were withdrawn from each study arm after randomisation (unclear risk of bias). In Paraiso 2013, nine women withdrew after randomisation (five in the CLS group and four in the RAS group), one woman allocated for CLS underwent RAS in error (protocol deviation) and one woman in the CLS group was withdrawn as the result of missing data (unclear risk of bias). Quality of life outcomes in Paraiso 2013 and Sarlos 2010 were subject to attrition of greater than 20%, so data for this outcome were considered to be at high risk of bias.
In Green 2013, of 113 women initially randomly assigned, 10 women were withdrawn because procedures were cancelled for medical or personal reasons (eight in the CLS group and two in the RAS group), and five women who had undergone alternative procedures were excluded (three in the CLS group and two in the RAS group). This left 98 participants (48 in the CLS group and 50 in the RAS group), representing attrition of 13% of the sample. In addition, 11 protocol deviations were reported. We considered this study to be at high risk of attrition bias.
Selective reporting
Most included studies reported expected and/or prespecified outcomes. We considered Green 2013 to be at high risk of reporting bias because of high attrition and protocol deviations with subsequent reporting of data per protocol. In Paraiso 2013, most expected outcomes were reported; however, no details of complications were provided despite the fact that three women required blood transfusions (unclear risk). In Lonnerfors 2014, outcomes were reported for RAS versus minimally invasive surgery (CLS and vaginal hysterectomy) together and separately. However, as separate baseline data were not reported, it was not possible to determine whether there were differences in the baseline characteristics of control women undergoing CLS or vaginal hysterectomy (unclear risk).
Other potential sources of bias
Two studies (Paraiso 2011; Sarlos 2010) were early adopters of RAS. Enrolment for these two studies occurred between 2007 and 2011, and, arguably, data from these studies may have been subject to bias caused by the learning curve, although surgeons in the latter study had performed a minimum of 30 RAS procedures before commencing the trial. Nevertheless, to assess this possibility and to avoid potential bias from early studies in the review findings, we performed sensitivity analyses for most outcomes by excluding these early studies.
In the Paraiso 2011 study report, it was unclear whether participants experienced more than one intraoperative and/or postoperative complication, and it was not possible to determine the direction of any bias as a result. This study also included relatively minor complications (e.g. urinary tract infections), unlike the other studies; this might have contributed heterogeneity to the 'complications' analyses, but not bias necessarily. Although we included these data in the analyses, we performed sensitivity analysis by excluding this study.
In Lonnerfors 2014, RAS was compared with CLS or vaginal hysterectomy, and the comparison intervention was based on the surgeon's choice. As participants were not randomly assigned to CLS and vaginal hysterectomy separately, these separate reported data were potentially subject to significant bias (e.g. a higher percentage of women who underwent CLS had a concomitant procedure (75% CLS, 59% RAS and 19% vaginal hysterectomy procedures) that would have influenced procedure time, complication rates, length of hospital stay (LOS) and costs of the separate CLS data. Therefore, we extracted combined data, not separate data, from this study. The direction and magnitude of bias resulting from inclusion of these data in this review are unclear. We performed sensitivity analyses to evaluate the impact of this study on review results.
Authors of all studies reported no potential conflicts of interest. Although most study reports declared the main study sponsor as the institution at which the study was undertaken, it was unclear whether study institutions had received financial support from the system manufacturers, directly or indirectly. Therefore, from a funding perspective, we considered most studies to be at potentially high risk of bias.
As a result of the the small number of included studies, we were unable to meaningfully evaluate publication bias as planned; however, one included study (Green 2013) with significant protocol deviations remains unpublished.
Effects of interventions
See: Summary of findings for the main comparison
Intraoperative and postoperative complications
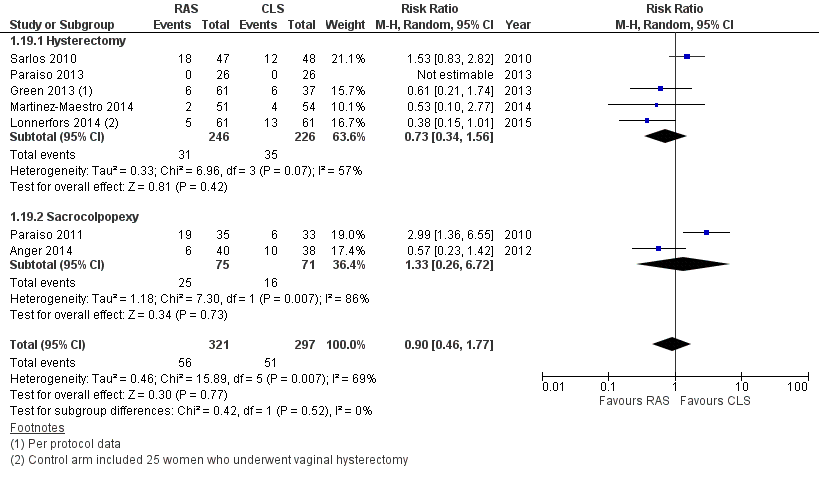
No statistically significant differences in complication rates were reported between RAS and CLS arms (risk ratio (RR) 0.95, 95% confidence interval (CI) 0.46 to 1.99; participants = 513; studies = 6; I2 = 74%) for hysterectomy or sacrocolpopexy procedures (test for subgroup differences: Chi² = 0.34; df = 1 (P value 0.56); I² = 0%). We downgraded this evidence to 'low' because of inconsistency and imprecision. When we excluded Paraiso 2011 data, overall complication rates were not significantly different for RAS and CLS (RR 0.72, 95% CI 0.37 to 1.43). Early studies tended to favour CLS. whereas later studies favoured RAS (but were at risk of other bias). When we performed various sensitivity analyses, it became clear that the effect estimate was not robust and is likely to change with further research.
Intraoperative complications only
No statistically significant differences in intraoperative complication rates were noted between RAS and CLS arms overall (RR 1.71, 95% CI 0.83 to 3.52; participants = 337; studies = 4; I2 = 0%; Analysis 1.2) or between arms for women undergoing hysterectomy (RR 1.67, 95% CI 0.75 to 3.73; participants = 269; studies = 3; I2 = 0%). Only one study (Paraiso 2011) was conducted in women undergoing sacrocolpopexy (RR 1.89, 95% CI 0.37 to 9.62; participants = 68; studies = 1). Tests for subgroup differences showed no significant differences between hysterectomy and sacrocolpopexy results (Chi² = 0.02; df = 1 (P value 0.90); I² = 0%). Sensitivity analysis using a fixed‐effect (FE) model while excluding studies with limitations yielded similar results. However, most of the events in both arms of these meta‐analyses occurred in two early studies; exclusion of these studies left insufficient data for meta‐analysis. We downgraded this evidence to 'low' as the result of imprecision and study limitations (risk of bias concerns).
Intraoperative injury
For the specific complication 'intraoperative injury,' no significant differences between review arms were noted (RR 1.23, 95% CI 0.44 to 3.46; participants = 415; studies = 5; I2 = 0%; 8/209 events in RAS arm versus 6/206 events in CLS arm; Analysis 1.4). Findings were similar when early studies were excluded; however, reported events were few (moderate‐quality evidence).
Postoperative complications only
With regard to postoperative complications, results of tests for subgroup differences were significant (Chi² = 7.65; df = 1 (P value 0.006); I² = 86.9%); therefore we did not pool subgroup data. For hysterectomy procedures, no statistically significant difference was noted between RAS and CLS arms (RR 0.62, 95% CI 0.30 to 1.29; participants = 315; studies = 3; I2 = 27%; Analysis 1.5). Sensitivity analysis using a fixed‐effect (FE) model yielded a point estimate of 0.62 with a non‐significantly narrower CI. Early studies tended to favour CLS, whereas later studies favoured RAS but had other study limitations. Sensitivity analysis conducted by sequentially excluding studies with risk of bias concerns produced an RR point estimate of 0.63 when only Green 2013 was excluded (95% 0.18 to 2.28; participants = studies = 2; Analysis 1.6), and when both Green 2013 and Lonnerfors 2014 were excluded, only one early study (Sarlos 2010) was left, with an RR of 1.23 (95% CI 0.40 to 3.74). We downgraded this evidence to 'low' as the result of imprecision and study limitations.
For sacrocolpopexy procedures, only one small, early study contributed data (Paraiso 2011). This study found RAS to be associated with a significantly greater number of postoperative complications compared with CLS for this procedure (RR 3.54, 95% CI 1.31 to 9.56; participants = 68); however, it was unclear from the study report whether individual participants might have experienced more than one complication.
Bleeding complications
For the specific outcome 'bleeding complications' (e.g. vaginal haematoma), no statistically significant difference between study arms was noted; however, the point estimated favoured the the RAS arm (RR 0.41, 95% CI 0.10 to 1.66; participants = 367; studies = 4; I2 = 17%; Analysis 1.7). These results were heavily influenced by one study (Lonnerfors 2014), in which 2/61 women in the RAS arm developed vaginal haematoma compared with 11/61 women in the comparison arm. As the latter finding was inconsistent with other data, we performed sensitivity analysis by excluding this study from the analysis. Findings from three studies showed no statistically significant differences, but data were sparse (RR 1.31, 95% CI 0.16 to 10.46; participants = 245; studies = 4; I2 = 0%). The quality of this evidence is low (inconsistency and imprecision).
Infection complications
Overall, no significant differences were noted between RAS and CLS arms with regard to average wound infection rates (RR 1.18, 95% CI 0.42 to 3.36; participants = 435; studies = 5; I2 = 13%; Analysis 1.8). No statistically significant differences remained between the review arms when early studies and those with other limitations were excluded.
Early and late mortality
No deaths were reported in any of the included studies.
Operating time
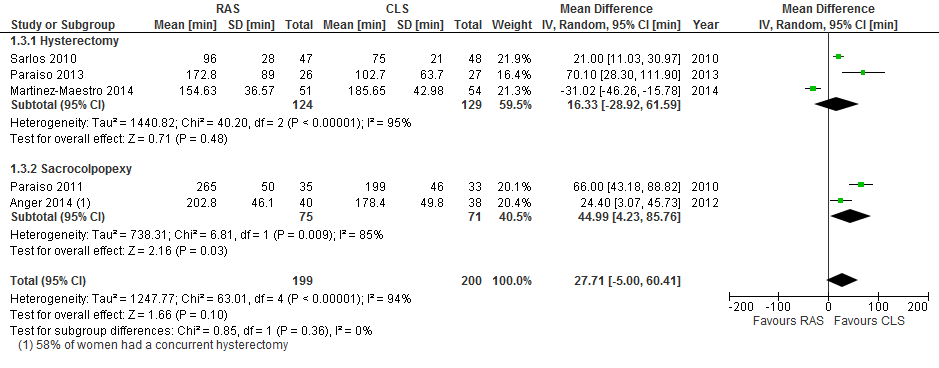
Mean total operating time was significantly longer on average in the RAS arm than in the CLS arm overall (mean difference (MD) 41.71 minutes, 95% CI 17.08 to 66.33; P value 0.0009; participants = 294; studies = 4; I2 = 82%; Analysis 1.9). Tests for subgroup differences showed no significant differences in effect between hysterectomy and sacrocolpopexy subgroups (Chi² = 0.01; df = 1 (P value 0.90); I² = 0%), and all studies included in this analysis were at low risk of bias for this outcome. When early studies were excluded from sensitivity analyses, the point estimate was similar, at an average 43 minutes longer operating time in the RAS arm.
Two studies reported this outcome as median (range). Median total operating times reported for the RAS arm versus minimally invasive arms in Lonnerfors 2014 were 76 minutes (43 to 210) versus 86 minutes (29 to 223), respectively (P value 0.54). Likewise, for Green 2013, median total operating times were 90 minutes (74 to 104) and 88 minutes ([75 to 105), respectively (P value 0.69). These individual study data, which shed a favourable light on RAS, were at high risk of bias for the reasons previously mentioned (see Risk of bias in included studies).
Results for mean operating room time were similar to those for mean total operating time (MD 42.51, 95% CI 20.96 to 64.06; participants = 294; studies = 4; I2 = 70%; P value 0.0001; Analysis 1.10).
Length of hospital stay
Mean length of hospital stay in days differed significantly between hysterectomy and sacrocolpopexy procedures (tests for subgroup differences: Chi² = 5.06; df = 1 (P value 0.02); I² = 80.2%; Analysis 1.11); therefore we did not pool these subgroups.
For hysterectomy procedures, RAS resulted in significantly shorter hospital stays on average compared with CLS (MD ‐0.30 days (approximately 7.2 hours), 95% CI ‐0.54 to ‐0.06; participants = 217; studies = 2; I2 = 0%). Data from one study (Lonnerfors 2014) with limitations in the context of this review had a significant impact on this evidence, which we downgraded to low quality.
For sacrocolpopexy procedures, only one small, early study contributed data on mean length of hospital stay (Paraiso 2011; MD 0.37 days, 95% CI ‐0.16 to 0.90; participants = 68; very low‐quality evidence). These data reported as median (range) were 36 hours (19 to 240) in the RAS arm compared with 29 hours (15 to 65) in the CLS arm (non‐significant).
Conversion to another approach
No significant differences between RAS and CLS approaches were observed with regard to rate of conversion (RR 1.28, 95% CI 0.40 to 4.12; participants = 337; studies = 4; I2 = 0%; 6/169 versus 5/168; Analysis 1.12; moderate‐quality evidence). In the RAS arm, three conversions were required as the result of 'robot malfunction,' and one was due to an inability to ventilate the study participant. These incidents occurred in the two earlier studies (Paraiso 2011; Sarlos 2010).
Blood transfusions and blood loss
Three studies reported blood transfusions. No statistically significant difference between RAS and CLS arms was reported (RR 1.23, 95% CI 0.24 to 6.21; participants = 272; I2 = 0%; Analysis 1.13). Similarly, mean estimated blood loss (millilitres) was not statistically significantly different between comparator arms (MD 3.54, 95% CI ‐20.12 to 27.21; participants = 173; studies = 2; I2 = 0%; Analysis 1.14), although only two studies contributed data (tests for subgroup differences: Chi² = 0.59; df = 1 (P value 0.44); I² = 0%).
Pain
Postoperative pain was reported in four studies at different time points within the first two weeks (Anger 2014; Green 2013; Paraiso 2011; Paraiso 2013). However, only two studies provided usable data (means) for meta‐analysis: one in the hysterectomy subgroup (Paraiso 2013) and one in the sacrocolpopexy subgroup (Paraiso 2011).
With regard to the hysterectomy subgroup: Paraiso 2013 reported pain scores during normal activities at two weeks post hysterectomy with no significant differences between study arms (P value 0.79; Analysis 1.15). Green 2013 (a high risk of bias study) reported median postoperative pain scores and found no significant differences between RAS and CLS arms following hysterectomy (P value 0.73).
For the sacrocolpopexy subgroup: Anger 2014 reported mean pain scores at one week postoperatively. Differences in pain scores favoured the CLS arm but were not statistically significant (standardised mean difference (SMD) 0.41, 95% CI ‐0.03 to 0.86; participants = 78; P value 0.07; I2 = 0%; Analysis 1.15). Although it did not contribute data to the meta‐analysis, the other sacrocolpopexy study (Paraiso 2011) reported that the RAS group had significantly greater pain at rest and with activity during weeks 3 to 5 and required longer use of non‐steroidal anti‐inflammatory drugs (NSAIDs) (median 20 days versus 11 days; P value < .005). This low‐quality evidence suggests that, when performed for sacrocolpopexy, RAS may be associated with greater postoperative pain than is noted with CLS.
QoL
Quality of life was reported at four to six weeks in two studies (Anger 2014; Sarlos 2010) and at six months in two studies (Paraiso 2011; Paraiso 2013). Paraiso 2011 also measured QoL at 12 months. However, data were insufficient for meta‐analysis. No significant differences in QoL were found in any of the studies reporting these data, except for Sarlos 2010. The latter study initially found a greater change in QoL at six weeks compared with before the operation in the RAS group, but this self‐reported outcome was subject to significant bias, and results did not remain significant when sensitivity analysis was conducted by the investigators. This evidence was of low quality.
Reintervention/readmission
No significant difference between RAS and CLS was noted with regard to the number of cases requiring reintervention (RR 0.35, 95% CI 0.08 to 1.54; participants = 295; studies = 3; I2 = 0%; Analysis 1.18) or readmission (hysterectomy subgroup only: RR 0.46, 95% CI 0.14 to 1.48; participants = 220; studies = 2; I2 = 0%; Analysis 1.19). These data were sparse, were at risk of bias and were considered to be of low quality.
Cost
Three studies (Anger 2014; Lonnerfors 2014; Paraiso 2011) reported overall costs (including equipment setup and maintenance and theatre and hospital admission costs). We did not pool these data because heterogeneity was substantial (I2 > 90%); however, RAS was consistently associated with increased cost, with MDs ranging from 1936 USD to 8728 USD across the three studies (Analysis 1.20).
Discussion
Summary of main results
All six included studies (Anger 2014; Green 2013; Lonnerfors 2014; Paraiso 2011; Paraiso 2013; Sarlos 2010) assessed the use of RAS compared with CLS (or other minimally invasive surgery in one study) in women requiring surgery for benign gynaecological disease (hysterectomy four studies; sacrocolpopexy two studies). These studies involved a total of 517 women. No statistically significant differences in complication rates were noted with RAS compared with CLS; however, individual study findings were inconsistent, with some favouring RAS and others favouring CLS. For the combined outcome 'intraoperative and postoperative complications,' the 95% CI for this effect estimate suggests that RAS may be associated with as little as half, or as much as double, the risk of complications when compared with CLS. As a result of this inconsistency and imprecision, we downgraded this evidence to low quality (summary of findings Table for the main comparison) using the the Grading of Recommendations Assessment, Development and Evaluation (GRADE) approach. Similarly, low‐quality evidence suggests no differences in the rates of specific complications, including intraoperative injury, infection and bleeding. Data on quality of life were sparse, and meta‐analysis could not be performed. However, weak evidence suggesting that postoperative pain following sacrocolpopexy may be worse with RAS requires further investigation.
Mean total operating time was on average approximately 42 minutes longer in the RAS arm than in the CLS arm for both procedures. This evidence was robust to sensitivity analysis, which included only four small heterogeneous studies; therefore we downgraded it to moderate quality. On the basis of limited data from two studies, RAS for hysterectomy procedures was associated with an average hospital stay of eight hours shorter than was reported for CLS (low‐quality evidence).
Four studies reported no statistically significant differences in rate of conversion from RAS to an alternative approach compared with CLS. Findings were consistent across included studies; however, we downgraded the evidence to moderate quality because of the imprecision of the estimate (RAS was less than half as likely or up to four times more likely to be converted to another approach). Low‐quality evidence suggests no differences in readmission or reintervention rates with RAS compared with CLS.
Comprehensive economic analysis was beyond the scope of this review; however the estimated overall cost of RAS versus CLS was substantially higher in each of the three studies reporting this outcome. This aspect of RAS requires further independent evaluation.
Overall completeness and applicability of evidence
Evidence related to benign gynaecological disease is incomplete and is applicable only to hysterectomy and sacrocolpopexy procedures. In addition, it is unclear whether the review findings apply to obese women, as none of the included studies evaluated the effect of this variable on outcomes. Limited pooled data from six small studies were not robust when sensitivity analyses were performed for one indication or another (e.g. for data originating from early RAS adopters (Paraiso 2011; Sarlos 2010); potentially limited surgeon experience (Anger 2014; Paraiso 2011); protocol deviations (Green 2013); per‐protocol data only (Green 2013); and mixed‐intervention control arms (Lonnerfors 2014)). We found no evidence on the effectiveness and safety of RAS compared with CLS or open surgery for gynaecological cancers, which generally involve more extensive surgery and surgical experience. We also found no evidence of the effect of RAS compared with CLS on surgeons' performance and workload outcomes. Increased postoperative pain with RAS for sacrocolpopexy procedures observed in Paraiso 2011 and Anger 2014, which may have been due to the extra port (RAS required five ports), the larger size or different locations of trocars, longer operating time or robotic rather than manual manipulation of trocars throughout a longer procedure, requires further investigation.
Quality of the evidence
There remains much uncertainty regarding the estimate of several important effects of RAS versus CLS, and the quality of review findings most commonly is graded as low. The main reasons for downgrading the quality of evidence for these outcomes were inconsistency and imprecision of results across the small number of included studies, which, in general, could not be attributed to differences in the types of procedures undertaken. With only six small studies included, the average effect of one study could have a large potential effect on the size and direction of the overall effect estimate. We therefore expect that further research will have an important impact on the review findings and is likely to change the estimate of effects for intraoperative and postoperative complications, among others.
Potential biases in the review process
We conducted a rigorous process to identify all relevant studies and therefore consider this review to be comprehensive in identifying all eligible studies. After a thorough discussion of the merits and implications for risk of bias, we excluded one quasi‐RCT conducted in women requiring hysterectomy (Martinez‐Maestro 2014). Women in this study were allocated to RAS or CLS "according to the position on the hospital waiting list and the availability of the robot on the day of surgery," and investigators reported that "neither the researchers nor the surgeons had the possibility to interfere with the allocation." Slight imbalances in age (slightly older in the CLS group) and uterine weight (slightly smaller in the RAS group) might have been due to chance. Sensitivity analyses including data from this study suggest that our findings would not have been substantially different with respect to complications had we included them (Figure 3). However, mean total operating time data from Martinez‐Maestro 2014 significantly favoured the RAS group and would have reduced the overall mean difference in our meta‐analysis for this outcome (Figure 4). Operating time in the CLS arm of this study was longer than usual; this was attributed to the relative inexperience of the surgeons with regard to conventional laparoscopy, which in itself is a significant source of bias in this study.
The original reviews included only two studies between them: Sarlos 2010 and Paraiso 2011. It has been suggested that studies conducted by early robot adopters may be subject to bias (Lonnerfors 2014); therefore we performed sensitivity analyses to explore whether data from these studies differed from those of later studies. Surgeons in the two early studies had performed a minimum of 10 and 30 RAS procedures, respectively. Sarlos 2010 reported the need to undock the robot in six women to cut the uterus into piecemeal sizes for removal. This procedure was not described in the other included studies, and it is not clear how, if at all, similar problems were overcome by others. We did not prespecify technical issues as an outcome; however, presumably these would have an impact on procedure time.
Extracted data for intraoperative and postoperative complications were investigator‐defined. We used these data as reported, without censoring for minor complications (e.g. urinary tract infections). This may have accounted for some of the heterogeneity observed among the included studies. In addition, we decided to include complications data from Paraiso 2011 when performing sensitivity analyses, rather than excluding them. Early studies tended to favour CLS, whereas later studies tended to favour RAS (but were frequently at risk of biasing the review findings (e.g. by providing per‐protocol data (Green 2013) or by including a mixed‐intervention (CLS and vaginal hysterectomy) control arm (Lonnerfors 2014)). We included the latter in the comparison RAS versus CLS, even though the comparison arm of this study included 25 women (41%) who underwent vaginal hysterectomy. (We were unable to use the separate CLS intervention data only, as these studies were non‐randomised and consequently were at high risk of selection bias.) We performed sensitivity analyses to determine the impact of including this study on review findings. Similarly, we performed sensitivity analyses while excluding the Green 2013 data. We considered the impact of these potential biases on the overall interpretation and grading of findings and downgraded the quality of evidence when appropriate.
Agreements and disagreements with other studies or reviews
The learning curve for RAS in gynaecology has been addressed in several studies and may vary according to the type of procedure involved. Learning curve analyses for benign disease suggest that competency (for which operating time is frequently a surrogate marker) is gained upon completion of approximately 20 procedures (Bell 2009), whereas for radical hysterectomy in women with cervical cancer, proficiency can be achieved after 28 procedures have been performed (Yim 2013).
Several studies have suggested that the learning curve for RAS is shorter than that for CLS, and therefore gynaecological surgeons who are inexperienced at CLS should consider RAS (Green 2013). Findings of a shorter operating time with RAS compared with CLS in a quasi‐RCT with surgeons relatively inexperienced in both approaches (Martinez‐Maestro 2014) might support this suggestion. However, a report from a setting in the USA where RAS accounted for almost 23% of all hysterectomies in 2011 stated that resident doctor involvement in RAS was less with the robotic approach than with any other route (Jeppson 2014). Thus the impact of this technology on surgical training of young doctors appears considerably uncertain.
A comprehensive economic evaluation of RAS in gynaecology was beyond the scope of this review. However, a recent economic evaluation of RAS for hysterectomy concluded that without longer‐term or functional outcome data, the additional expense of RAS may not be justified in a budget‐constrained health system (Teljeur 2014). In the light of our findings, current evidence related to clinical effectiveness of RAS across a range of gynaecological procedures remains of low quality or unproven. Once effectiveness is proven, additional indirect factors such as the surgeon's well‐being, particularly with respect to physically demanding laparoscopic and open surgery for gynaecological cancers, may become important cost considerations. However, without more robust evidence on clinical effectiveness and safety, it will remain difficult to assess the cost‐effectiveness of RAS in gynaecology.

Study flow diagram for updated searches (30 June 2014).

Risk of bias summary: review authors' judgements about each risk of bias item for each included study.

Intraoperative and postoperative complications, with Martinez‐Maestro 2014 included.


Comparison 1 Robot‐assisted surgery versus conventional laparoscopic surgery, Outcome 1 Intraoperative and postoperative complications.

Comparison 1 Robot‐assisted surgery versus conventional laparoscopic surgery, Outcome 2 Intraoperative complications.

Comparison 1 Robot‐assisted surgery versus conventional laparoscopic surgery, Outcome 3 Sensitivity analysis: intraoperative complications.

Comparison 1 Robot‐assisted surgery versus conventional laparoscopic surgery, Outcome 4 Complications: intraoperative injury.

Comparison 1 Robot‐assisted surgery versus conventional laparoscopic surgery, Outcome 5 Postoperative complications.

Comparison 1 Robot‐assisted surgery versus conventional laparoscopic surgery, Outcome 6 Sensitivity analysis: postoperative complications.

Comparison 1 Robot‐assisted surgery versus conventional laparoscopic surgery, Outcome 7 Complications: bleeding.

Comparison 1 Robot‐assisted surgery versus conventional laparoscopic surgery, Outcome 8 Complications: infection.

Comparison 1 Robot‐assisted surgery versus conventional laparoscopic surgery, Outcome 9 Total operating time.
![Comparison 1 Robot‐assisted surgery versus conventional laparoscopic surgery, Outcome 10 Operating room time [min].](/es/cdsr/doi/10.1002/14651858.CD011422/media/CDSR/CD011422/rel0001/CD011422/image_n/nCD011422-CMP-001-10.png)
Comparison 1 Robot‐assisted surgery versus conventional laparoscopic surgery, Outcome 10 Operating room time [min].

Comparison 1 Robot‐assisted surgery versus conventional laparoscopic surgery, Outcome 11 Overall hospital stay.
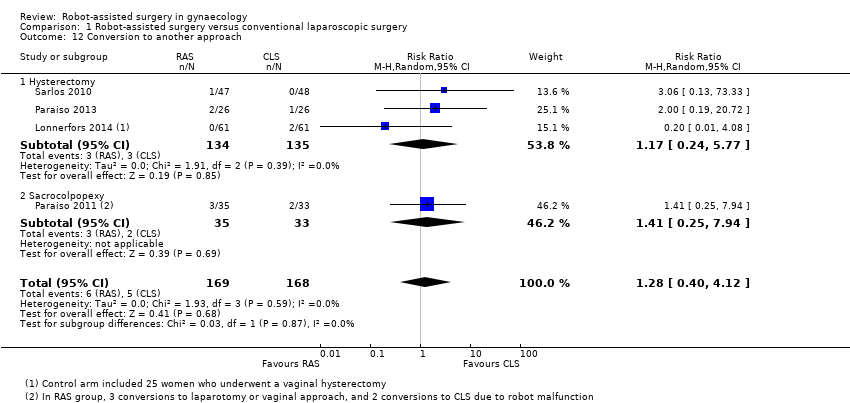
Comparison 1 Robot‐assisted surgery versus conventional laparoscopic surgery, Outcome 12 Conversion to another approach.

Comparison 1 Robot‐assisted surgery versus conventional laparoscopic surgery, Outcome 13 Blood transfusions.

Comparison 1 Robot‐assisted surgery versus conventional laparoscopic surgery, Outcome 14 Estimated blood loss.

Comparison 1 Robot‐assisted surgery versus conventional laparoscopic surgery, Outcome 15 Pain at 1 to 2 weeks.

Comparison 1 Robot‐assisted surgery versus conventional laparoscopic surgery, Outcome 16 Quality of life (6 weeks).

Comparison 1 Robot‐assisted surgery versus conventional laparoscopic surgery, Outcome 17 Quality of life (6 months).

Comparison 1 Robot‐assisted surgery versus conventional laparoscopic surgery, Outcome 18 Reintervention.

Comparison 1 Robot‐assisted surgery versus conventional laparoscopic surgery, Outcome 19 Readmission.

Comparison 1 Robot‐assisted surgery versus conventional laparoscopic surgery, Outcome 20 Overall cost.
| Robot‐assisted surgery (RAS) compared with conventional laparoscopic surgery (CLS) for gynaecological disease | ||||||
| Patient or population: women with benign gynaecological disease requiring surgery Settings: hospital Intervention: RAS Comparison: CLS | ||||||
| Outcomes | Illustrative comparative risksa (95% CI) | Relative effect | Number of participants | Quality of the evidence | Comments | |
| Assumed risk | Corresponding risk | |||||
| CLS | RAS | |||||
| Intraoperative and postoperative complications | All procedures (subgroups were similar) | RR 0.95 (0.46 to 1.99) | 513 (6) | ⊕⊕⊝⊝ | Downgraded because of inconsistency (I2 = 74%) and imprecision. Early studies favoured CLS, whereas later studies favoured RAS but had other limitations | |
| 19 per 100 | 18 per 100 (9 to 38) | |||||
| Intraoperative complications only | All procedures (subgroups were similar) | RR 1.71 (0.83 to 3.52) | 337 (4) | ⊕⊕⊝⊝ | Downgraded because of imprecision and study limitations (2 early studies contributed 16/17 adverse events in the RAS arm). Sensitivity analyses suggest that effect estimate is likely to change | |
| 6 per 100 | 10 per 100 | |||||
| Postoperative complications only | Hysterectomy | RR 0.62 (0.30 to 1.29) RR 3.54 (1.31 to 9.56) | 315 (3) 68 (1) | ⊕⊕⊝⊝ ⊕⊝⊝⊝ | Downgraded because of imprecision and study limitations. Early studies tend to favour CLS, whereas later studies favour RAS but had other limitations Only 1 small, early study reported data, which included urinary tract infections | |
| 16 per 100 | 10 per 100 | |||||
| Sacrocolpopexy | ||||||
| 12 per 100 | 42 per 100 | |||||
| Intraoperative injury | All procedures (subgroups were similar) | RR 1.23 (0.44 to 3.46) | 415 (5) | ⊕⊕⊕⊝ | Downgraded because of imprecision | |
| 3 per 100 | 4 per 100 (1 to 10) | |||||
| Total operating time (minutes) | Mean total operating time ranged across control groups from | Mean total operating time in the intervention groups ranged from | MD 41.71 (17.08 to 66.33) | 294 (4) | ⊕⊕⊕⊝ | Downgraded because of inconsistency (I2 = 82%). 2 studies that could not be included in the meta‐analysis reported no significant differences in median operating times |
| Overall hospital stay (days) | Hysterectomy | MD ‐0.30 (‐0.54 to ‐0.06) | 217 | ⊕⊕⊝⊝ | Downgraded because of risk of bias concerns and imprecision (effect estimate ranged from 1 to 13 hours shorter hospital stay in RAS group) | |
| Mean hospital stay ranged across control groups from 1.4 to 3.6 days | Mean hospital stay in the intervention groups was | |||||
| Sacrocolpopexy | MD 0.37 (‐0.16 to 0.90) | 68 (1) | ⊕⊕⊝⊝ | Downgraded because of study limitations and sparse data | ||
| Mean hospital stay in the control group was 1.42 days | Mean hospital stay in the intervention group was 1.79 days | |||||
| Conversion to another approach | All procedures (subgroups were similar) | RR 1.29 (0.40 to 4.16) | 338 | ⊕⊕⊕⊝ | Downgraded because of imprecision | |
| 3 per 100 | 4 per 100 | |||||
| aThe basis for the assumed risk for dichotomous data is the mean control group risk across studies. The corresponding risk (and its 95% confidence interval) is based on the assumed risk in the comparison group and the relative effect of the intervention (and its 95% CI). | ||||||
| GRADE Working Group grades of evidence. | ||||||
| Study ID | Malignant (M)/Benign (B) disease | Participants (N) | Number enrolled by June 2014a | Comparison | Procedure | Main outcomes | Primary completion datea |
| Harkins 2013b NCT01581905 | B: menorrhagia, dysfunctional uterine bleeding, fibroids, endometriosis | 400 (closed at 113) | Completed | RAS versus CLS | Hysterectomy | Operating time, EBL, complications, LOS | March 2013 |
| NCT01556204 | B: endometriosis | 74 | ‐ | RAS versus CLS | Surgery for endometriosis | Operating time, pain | December 2013 |
| NCT01247779 | M: cervical, uterine and ovarian cancers | 374 | 320 | RAS versus CLS | Surgical staging procedures | Complications, lymph node yield, surgeons' ergonomy, QoL | June 2015 |
| NCT01526655 | M: endometrial cancer | 50 | 30 | RAS versus open surgery | Hysterectomy, BSO and lavage | QoL, biomarkers, adverse events | December 2015 |
| NCT01847703 | M: endometrial cancer | 100 | 45 | RAS versus open surgery | Hysterectomy, BSO and LA | Lymph node yield, complications | April 2016 |
| NCT00614211 | M: cervical cancer | 740 | 340 | RAS or CLS versus open surgery | Radical hysterectomy | DFS, complications, QoL, OS | July 2018 |
| For further details, see Characteristics of ongoing studies. aUpdated according to contact investigator correspondence when possible. bSame as Green 2013. This study has been completed but not yet reported in full. Data on 98 women were presented in 2013 and have been included in this review. Abbreviations: CLS = conventional laparoscopic surgery; DFS = disease‐free survival; EBL = estimated blood loss; LOS = length of stay; OS = overall survival; QoL = quality of life; RAS = robot‐assisted surgery. | |||||||
| Outcome or subgroup title | No. of studies | No. of participants | Statistical method | Effect size |
| 1 Intraoperative and postoperative complications Show forest plot | 6 | 513 | Risk Ratio (M‐H, Random, 95% CI) | 0.95 [0.46, 1.99] |
| 1.1 Hysterectomy | 4 | 367 | Risk Ratio (M‐H, Random, 95% CI) | 0.76 [0.31, 1.88] |
| 1.2 Sacrocolpopexy | 2 | 146 | Risk Ratio (M‐H, Random, 95% CI) | 1.33 [0.26, 6.72] |
| 2 Intraoperative complications Show forest plot | 4 | 337 | Risk Ratio (M‐H, Random, 95% CI) | 1.71 [0.83, 3.52] |
| 2.1 Hysterectomy | 3 | 269 | Risk Ratio (M‐H, Random, 95% CI) | 1.67 [0.75, 3.73] |
| 2.2 Sacrocolpopexy | 1 | 68 | Risk Ratio (M‐H, Random, 95% CI) | 1.89 [0.37, 9.62] |
| 3 Sensitivity analysis: intraoperative complications Show forest plot | 3 | 215 | Risk Ratio (M‐H, Random, 95% CI) | 1.78 [0.84, 3.75] |
| 3.1 Hysterectomy | 2 | 147 | Risk Ratio (M‐H, Random, 95% CI) | 1.75 [0.76, 4.06] |
| 3.2 Sacrocolpopexy | 1 | 68 | Risk Ratio (M‐H, Random, 95% CI) | 1.89 [0.37, 9.62] |
| 4 Complications: intraoperative injury Show forest plot | 5 | 415 | Risk Ratio (M‐H, Random, 95% CI) | 1.23 [0.44, 3.46] |
| 4.1 Hysterectomy | 3 | 269 | Risk Ratio (M‐H, Random, 95% CI) | 1.62 [0.20, 12.91] |
| 4.2 Sacrocolpopexy | 2 | 146 | Risk Ratio (M‐H, Random, 95% CI) | 1.13 [0.34, 3.70] |
| 5 Postoperative complications Show forest plot | 4 | Risk Ratio (M‐H, Random, 95% CI) | Subtotals only | |
| 5.1 Hysterectomy | 3 | 315 | Risk Ratio (M‐H, Random, 95% CI) | 0.62 [0.30, 1.29] |
| 5.2 Sacrocolpopexy | 1 | 68 | Risk Ratio (M‐H, Random, 95% CI) | 3.54 [1.31, 9.56] |
| 6 Sensitivity analysis: postoperative complications Show forest plot | 3 | Risk Ratio (M‐H, Random, 95% CI) | Subtotals only | |
| 6.1 Hysterectomy | 2 | 217 | Risk Ratio (M‐H, Random, 95% CI) | 0.63 [0.18, 2.28] |
| 6.2 Sacrocolpopexy | 1 | 68 | Risk Ratio (M‐H, Random, 95% CI) | 3.54 [1.31, 9.56] |
| 7 Complications: bleeding Show forest plot | 4 | Risk Ratio (M‐H, Random, 95% CI) | Subtotals only | |
| 7.1 Hysterectomy | 4 | 367 | Risk Ratio (M‐H, Random, 95% CI) | 0.41 [0.10, 1.66] |
| 8 Complications: infection Show forest plot | 5 | 435 | Risk Ratio (M‐H, Random, 95% CI) | 1.18 [0.42, 3.36] |
| 8.1 Hysterectomy | 4 | 367 | Risk Ratio (M‐H, Random, 95% CI) | 0.62 [0.13, 2.88] |
| 8.2 Sacrocolpopexy | 1 | 68 | Risk Ratio (M‐H, Random, 95% CI) | 1.89 [0.63, 5.68] |
| 9 Total operating time Show forest plot | 4 | 294 | Mean Difference (IV, Random, 95% CI) | 41.71 [17.08, 66.33] |
| 9.1 Hysterectomy | 2 | 148 | Mean Difference (IV, Random, 95% CI) | 41.18 [‐6.17, 88.53] |
| 9.2 Sacrocolpopexy | 2 | 146 | Mean Difference (IV, Random, 95% CI) | 44.99 [4.23, 85.76] |
| 10 Operating room time [min] Show forest plot | 4 | 294 | Mean Difference (IV, Random, 95% CI) | 42.51 [20.96, 64.06] |
| 10.1 Hysterectomy | 2 | 148 | Mean Difference (IV, Random, 95% CI) | 44.35 [5.22, 83.47] |
| 10.2 Sacrocolpopexy | 2 | 146 | Mean Difference (IV, Random, 95% CI) | 43.24 [0.12, 86.35] |
| 11 Overall hospital stay Show forest plot | 3 | Mean Difference (IV, Random, 95% CI) | Subtotals only | |
| 11.1 Hysterectomy | 2 | 217 | Mean Difference (IV, Random, 95% CI) | ‐0.30 [‐0.54, ‐0.06] |
| 11.2 Sacrocolpopexy | 1 | 68 | Mean Difference (IV, Random, 95% CI) | 0.37 [‐0.16, 0.90] |
| 12 Conversion to another approach Show forest plot | 4 | 337 | Risk Ratio (M‐H, Random, 95% CI) | 1.28 [0.40, 4.12] |
| 12.1 Hysterectomy | 3 | 269 | Risk Ratio (M‐H, Random, 95% CI) | 1.17 [0.24, 5.77] |
| 12.2 Sacrocolpopexy | 1 | 68 | Risk Ratio (M‐H, Random, 95% CI) | 1.41 [0.25, 7.94] |
| 13 Blood transfusions Show forest plot | 3 | Risk Ratio (M‐H, Random, 95% CI) | Subtotals only | |
| 13.1 Hysterectomy | 3 | 272 | Risk Ratio (M‐H, Random, 95% CI) | 1.23 [0.24, 6.21] |
| 14 Estimated blood loss Show forest plot | 2 | 173 | Mean Difference (IV, Random, 95% CI) | 3.54 [‐20.12, 27.21] |
| 14.1 Hysterectomy | 1 | 95 | Mean Difference (IV, Random, 95% CI) | 7.0 [‐18.26, 32.26] |
| 14.2 Sacrocolpopexy | 1 | 78 | Mean Difference (IV, Random, 95% CI) | ‐21.30 [‐89.02, 46.42] |
| 15 Pain at 1 to 2 weeks Show forest plot | 2 | 114 | Std. Mean Difference (IV, Random, 95% CI) | 0.22 [‐0.26, 0.70] |
| 15.1 Hysterectomy | 1 | 36 | Std. Mean Difference (IV, Random, 95% CI) | ‐0.09 [‐0.74, 0.56] |
| 15.2 Sacrocolpopexy | 1 | 78 | Std. Mean Difference (IV, Random, 95% CI) | 0.41 [‐0.03, 0.86] |
| 16 Quality of life (6 weeks) Show forest plot | 1 | Mean Difference (IV, Random, 95% CI) | Totals not selected | |
| 16.1 Sacrocolpopexy | 1 | Mean Difference (IV, Random, 95% CI) | 0.0 [0.0, 0.0] | |
| 17 Quality of life (6 months) Show forest plot | 1 | Mean Difference (IV, Random, 95% CI) | Totals not selected | |
| 17.1 Hysterectomy | 1 | Mean Difference (IV, Random, 95% CI) | 0.0 [0.0, 0.0] | |
| 18 Reintervention Show forest plot | 3 | 295 | Risk Ratio (M‐H, Random, 95% CI) | 0.35 [0.08, 1.54] |
| 18.1 Hysterectomy | 1 | 122 | Risk Ratio (M‐H, Random, 95% CI) | 0.25 [0.03, 2.17] |
| 18.2 Sacrocolpopexy | 2 | 173 | Risk Ratio (M‐H, Random, 95% CI) | 0.47 [0.06, 3.59] |
| 19 Readmission Show forest plot | 2 | Risk Ratio (M‐H, Random, 95% CI) | Subtotals only | |
| 19.1 Hysterectomy | 2 | 220 | Risk Ratio (M‐H, Random, 95% CI) | 0.46 [0.14, 1.48] |
| 20 Overall cost Show forest plot | 3 | Mean Difference (IV, Random, 95% CI) | Totals not selected | |
| 20.1 Hysterectomy | 1 | Mean Difference (IV, Random, 95% CI) | 0.0 [0.0, 0.0] | |
| 20.2 Sacrocolpopexy | 2 | Mean Difference (IV, Random, 95% CI) | 0.0 [0.0, 0.0] | |