Scolaris Content Display Scolaris Content Display

Study flow diagram
Figuras y tablas -
Figure 1

Study flow diagram

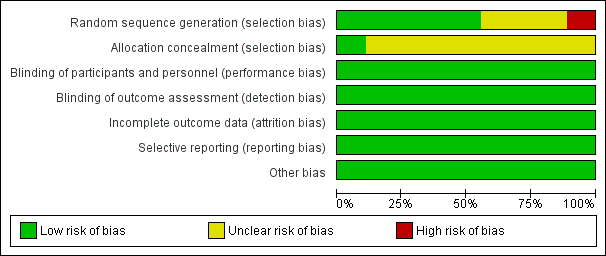
Risk of bias graph: review authors' judgements about each risk of bias item presented as percentages across all included studies. Nine studies are included in this review.
Figuras y tablas -
Figure 2

Risk of bias graph: review authors' judgements about each risk of bias item presented as percentages across all included studies. Nine studies are included in this review.

Risk of bias summary: review authors' judgements about each risk of bias item for each included study.
Figuras y tablas -
Figure 3

Risk of bias summary: review authors' judgements about each risk of bias item for each included study.

Comparison 1 Comparison of drains versus no drains, Outcome 1 Recurrence.
Figuras y tablas -
Analysis 1.1

Comparison 1 Comparison of drains versus no drains, Outcome 1 Recurrence.

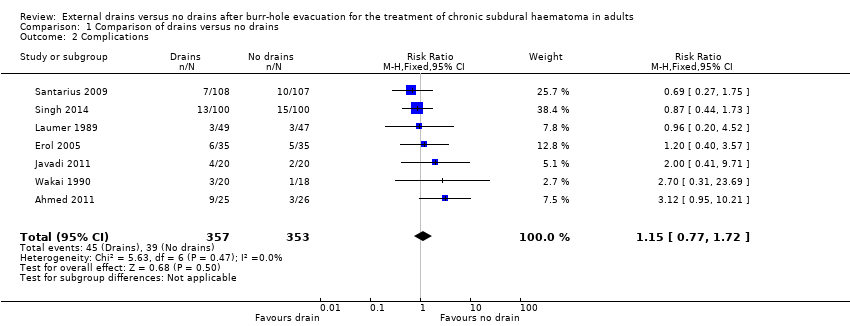
Comparison 1 Comparison of drains versus no drains, Outcome 2 Complications.
Figuras y tablas -
Analysis 1.2

Comparison 1 Comparison of drains versus no drains, Outcome 2 Complications.

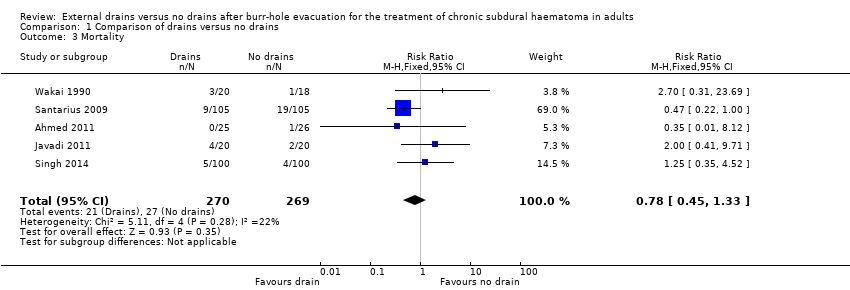
Comparison 1 Comparison of drains versus no drains, Outcome 3 Mortality.
Figuras y tablas -
Analysis 1.3

Comparison 1 Comparison of drains versus no drains, Outcome 3 Mortality.

Comparison 1 Comparison of drains versus no drains, Outcome 4 Poor functional outcome.
Figuras y tablas -
Analysis 1.4

Comparison 1 Comparison of drains versus no drains, Outcome 4 Poor functional outcome.

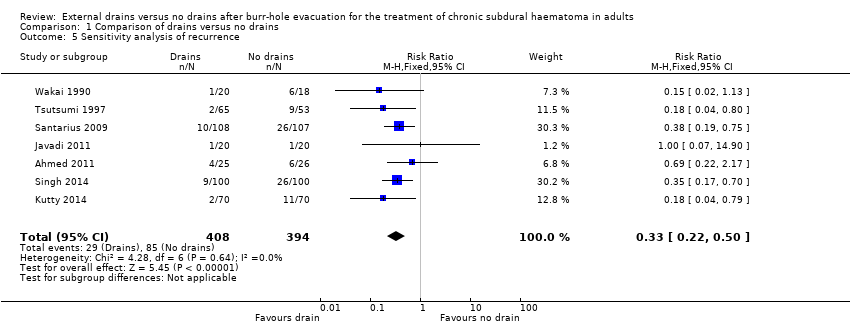
Comparison 1 Comparison of drains versus no drains, Outcome 5 Sensitivity analysis of recurrence.
Figuras y tablas -
Analysis 1.5

Comparison 1 Comparison of drains versus no drains, Outcome 5 Sensitivity analysis of recurrence.

Summary of findings for the main comparison. Drains compared to no drains for burr‐hole evacuation of CSDH in adults

Drains compared to no drains for burr‐hole evacuation of CSDH in adults

Patient or population: adults with burr‐hole evacuation of CSDH

Settings: hospital settings in India,Turkey, Iran, Germany, UK and Japan
Intervention: one or more drains
Comparison: no drains

Outcomes

Illustrative comparative risks* (95% CI)

Relative effect
(95% CI)

No of Participants
(studies)

Quality of the evidence
(GRADE)

Comments

Assumed risk

Corresponding risk

No drain

Drain

Overall recurrence
Follow‐up: 3 weeks‐6 months

Study population

RR 0.45
(0.32 to 0.61)

968
(9 studies)

⊕⊕⊕⊝
moderate1

216 per 1000

97 per 1000
(69 to 132)

Moderate

231 per 1000

104 per 1000
(74 to 141)

Recurrence with 2 burr holes (subgroup)
Follow‐up: 6 months

Study population

RR 0.46
(0.26 to 0.8)

306
(3 studies)

⊕⊕⊝⊝
low1,2

216 per 1000

99 per 1000
(56 to 173)

Moderate

231 per 1000

106 per 1000
(60 to 185)

Recurrence with 1 burr hole (subgroup)
Follow‐up: 6 months

Study population

RR 0.17
(0.05 to 0.56)

156
(2 studies)

⊕⊕⊝⊝
low1,2

211 per 1000

36 per 1000
(11 to 118)

Moderate

213 per 1000

36 per 1000
(11 to 119)

Recurrence with 1 or 2 burr holes (subgroup)
Follow‐up: 3 weeks‐6 months

Study population

RR 0.52
(0.34 to 0.79)

506
(4 studies)

⊕⊕⊕⊝
moderate1

218 per 1000

113 per 1000
(74 to 172)

Moderate

213 per 1000

111 per 1000
(72 to 168)

Complications
Follow‐up: 3 weeks‐6 months

Study population

RR 1.15
(0.77 to 1.72)

710
(7 studies)

⊕⊕⊝⊝
low1,2

110 per 1000

127 per 1000
(85 to 190)

Moderate

100 per 1000

115 per 1000
(77 to 172)

Mortality
Follow‐up: 6 months

Study population

RR 0.78
(0.45 to 1.33)

539
(5 studies)

⊕⊕⊝⊝
low1,2

100 per 1000

78 per 1000
(45 to 133)

Moderate

56 per 1000

44 per 1000
(25 to 74)

Poor functional outcome (includes death)
Follow‐up: 6 months

Study population

RR 0.68
(0.44 to 1.05)

490
(5 studies)

⊕⊕⊝⊝
low1,2

169 per 1000

115 per 1000
(74 to 177)

Moderate

131 per 1000

89 per 1000
(58 to 138)

*The basis for the assumed risk (e.g. the median control group risk across studies) is provided in footnotes. The corresponding risk (and its 95% confidence interval) is based on the assumed risk in the comparison group and the relative effect of the intervention (and its 95% CI).
CI: confidence interval; RR: risk ratio

GRADE Working Group grades of evidence
High quality: Further research is very unlikely to change our confidence in the estimate of effect.
Moderate quality: Further research is likely to have an important impact on our confidence in the estimate of effect and may change the estimate.
Low quality: Further research is very likely to have an important impact on our confidence in the estimate of effect and is likely to change the estimate.
Very low quality: We are very uncertain about the estimate.

1 Only one trial used adequate allocation concealment, and one trial used alternation as a randomisation method (Wakai 1990).
2 Downgraded one level for imprecision: estimate based on few events and wide CIs.

Figuras y tablas -
Summary of findings for the main comparison. Drains compared to no drains for burr‐hole evacuation of CSDH in adults
Comparison 1. Comparison of drains versus no drains

Outcome or subgroup title

No. of studies

No. of participants

Statistical method

Effect size

1 Recurrence Show forest plot

9

968

Risk Ratio (M‐H, Fixed, 95% CI)

0.45 [0.32, 0.61]

1.1 Two holes

3

306

Risk Ratio (M‐H, Fixed, 95% CI)

0.46 [0.26, 0.80]

1.2 One hole

2

156

Risk Ratio (M‐H, Fixed, 95% CI)

0.17 [0.05, 0.56]

1.3 One or two holes

4

506

Risk Ratio (M‐H, Fixed, 95% CI)

0.52 [0.34, 0.79]

2 Complications Show forest plot

7

710

Risk Ratio (M‐H, Fixed, 95% CI)

1.15 [0.77, 1.72]

3 Mortality Show forest plot

5

539

Risk Ratio (M‐H, Fixed, 95% CI)

0.78 [0.45, 1.33]

4 Poor functional outcome Show forest plot

5

490

Risk Ratio (M‐H, Fixed, 95% CI)

0.68 [0.44, 1.05]

5 Sensitivity analysis of recurrence Show forest plot

7

802

Risk Ratio (M‐H, Fixed, 95% CI)

0.33 [0.22, 0.50]

Figuras y tablas -
Comparison 1. Comparison of drains versus no drains