Gastrectomía laparoscópica versus abierta para el cáncer gástrico
Información
- DOI:
- https://doi.org/10.1002/14651858.CD011389.pub2Copiar DOI

- Base de datos:
-
- Cochrane Database of Systematic Reviews
- Versión publicada:
-
- 31 marzo 2016see what's new
- Tipo:
-
- Intervention
- Etapa:
-
- Review
- Grupo Editorial Cochrane:
-
Grupo Cochrane de Salud digestiva
- Copyright:
-
- Copyright © 2016 The Cochrane Collaboration. Published by John Wiley & Sons, Ltd.
Cifras del artículo
Altmetric:
Citado por:
Autores
Contributions of authors
Conceiving the review: KG.
Designing the review: KG, MM.
Co‐ordinating the review: KG.
Designing search strategies: KG.
Writing the review: LB, KG.
Providing general advice on the review: MM.
Securing funding for the review: KG.
Performing previous work that was the foundation of the current study: KG.
Sources of support
Internal sources
-
University College London, UK.
External sources
-
National Institute for Health Research, UK.
This report is independent research, funded by the National Institute for Health Research (NIHR Cochrane Programme Grants, 13/89/03 ‐ Evidence‐based diagnosis and management of upper digestive, hepato‐biliary, and pancreatic disorders). The views expressed in this publication are those of the author(s) and not necessarily those of the National Health Service (NHS), the National Institute for Health Research, or the Department of Health.
Declarations of interest
This report is independent research, funded by the National Institute for Health Research (NIHR Cochrane Programme Grants, 13/89/03 ‐ Evidence‐based diagnosis and management of upper digestive, hepato‐biliary, and pancreatic disorders). The views expressed in this publication are those of the author(s) and not necessarily those of the National Health Service (NHS), the National Institute for Health Research, or the Department of Health.
LMJB: none known.
MM: none known.
KSG: none known.
Acknowledgements
We thank the authors of the trials who provided additional information for this review.
We thank Karin Dearness, Managing Editor, Cochrane Upper Gastrointestinal and Pancreatic Diseases (UGPD) Group for providing administrative and logistical support for the conduct of the current review, and Racquel Simpson, Trials Search Co‐ordinator, Cochrane UGPD Group for developing and executing the search strategies.
We thank the peer reviewers, copy editors and Cochrane Editorial Unit for their comments.
Version history
| Published | Title | Stage | Authors | Version |
| 2016 Mar 31 | Laparoscopic versus open gastrectomy for gastric cancer | Review | Lawrence MJ Best, Muntzer Mughal, Kurinchi Selvan Gurusamy | |
| 2014 Nov 17 | Laparoscopic versus open gastrectomy for gastric cancer | Protocol | Kurinchi Selvan Gurusamy | |
Differences between protocol and review
The search strategy was revised after the protocol was published as it was not sufficiently sensitive to identify known trials.
Keywords
MeSH
Medical Subject Headings (MeSH) Keywords
Medical Subject Headings Check Words
Humans;
PICO
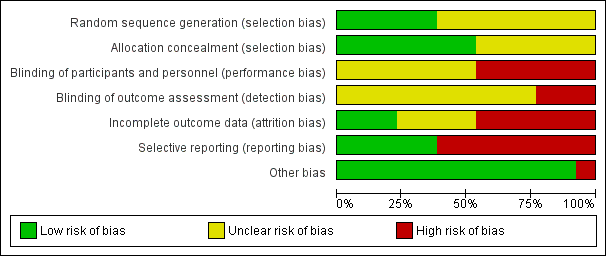
Risk of bias graph: review authors' judgements about each risk of bias item presented as percentages across all included studies.

Risk of bias summary: review authors' judgements about each risk of bias item for each included study.

Study flow diagram.

Comparison 1 Laparoscopic versus open gastrectomy, Outcome 1 Short‐term mortality.
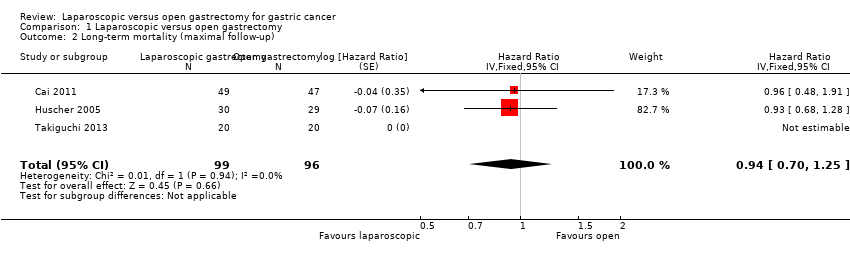
Comparison 1 Laparoscopic versus open gastrectomy, Outcome 2 Long‐term mortality (maximal follow‐up).

Comparison 1 Laparoscopic versus open gastrectomy, Outcome 3 Proportion with a serious adverse event (< 3 months).
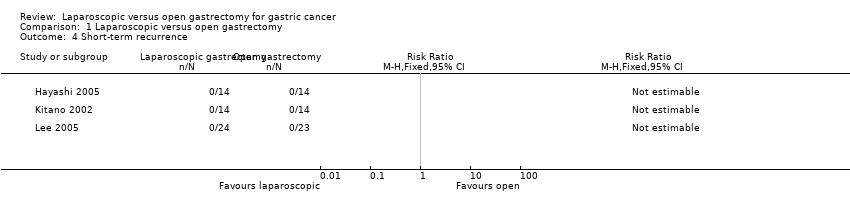
Comparison 1 Laparoscopic versus open gastrectomy, Outcome 4 Short‐term recurrence.

Comparison 1 Laparoscopic versus open gastrectomy, Outcome 5 Long‐term recurrence (maximal follow‐up).
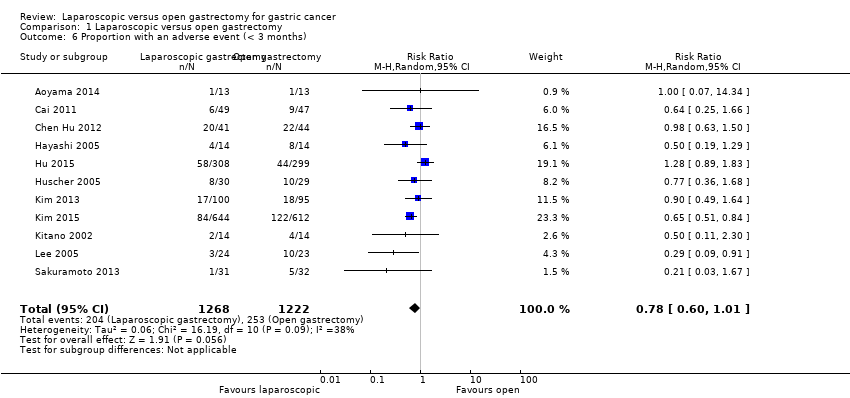
Comparison 1 Laparoscopic versus open gastrectomy, Outcome 6 Proportion with an adverse event (< 3 months).

Comparison 1 Laparoscopic versus open gastrectomy, Outcome 7 Proportion requiring blood transfusion during or within a week of surgery.
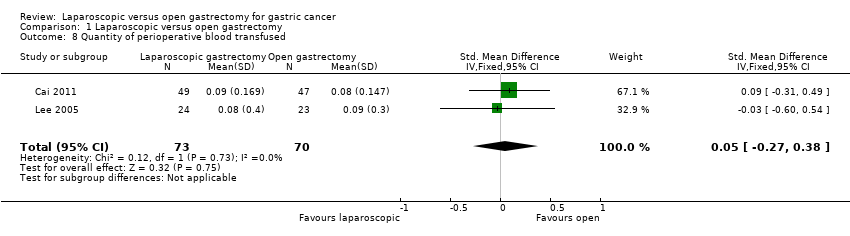
Comparison 1 Laparoscopic versus open gastrectomy, Outcome 8 Quantity of perioperative blood transfused.

Comparison 1 Laparoscopic versus open gastrectomy, Outcome 9 Length of hospital stay.
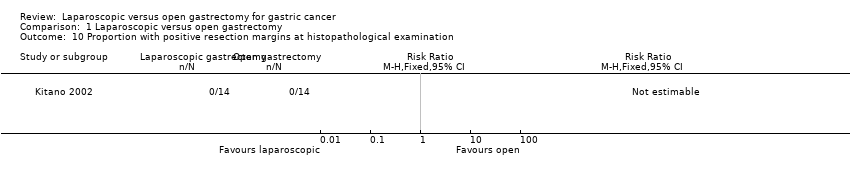
Comparison 1 Laparoscopic versus open gastrectomy, Outcome 10 Proportion with positive resection margins at histopathological examination.

Comparison 1 Laparoscopic versus open gastrectomy, Outcome 11 Number of lymph nodes harvested.

Comparison 2 Laparoscopic versus open gastrectomy (subgroup analysis), Outcome 1 Short‐term mortality (stratified by early versus advanced cancer).
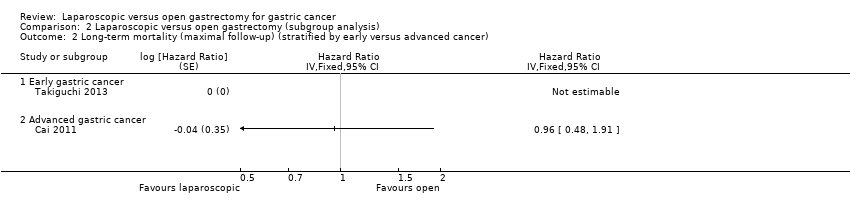
Comparison 2 Laparoscopic versus open gastrectomy (subgroup analysis), Outcome 2 Long‐term mortality (maximal follow‐up) (stratified by early versus advanced cancer).

Comparison 2 Laparoscopic versus open gastrectomy (subgroup analysis), Outcome 3 Proportion with a serious adverse event (< 3 months) (stratified by early versus advanced cancer).

Comparison 2 Laparoscopic versus open gastrectomy (subgroup analysis), Outcome 4 Short‐term mortality (stratified by type of gastrectomy).

Comparison 2 Laparoscopic versus open gastrectomy (subgroup analysis), Outcome 5 Long‐term mortality (maximal follow‐up) (stratified by type of gastrectomy).

Comparison 2 Laparoscopic versus open gastrectomy (subgroup analysis), Outcome 6 Proportion with a serious adverse event (< 3 months) (stratified by type of gastrectomy).
| Laparoscopic gastrectomy compared to open gastrectomy for gastric cancer (primary outcomes) | |||||
| Patient or population: patients with gastric cancer | |||||
| Outcomes | Illustrative comparative risks* (95% CI) | Relative effect | No of Participants | Quality of the evidence | |
| Assumed risk | Corresponding risk | ||||
| Open gastrectomy | Laparoscopic gastrectomy | ||||
| Short‐term mortality | 3 per 1000 | 6 per 1000 | RR 1.60 | 2335 | ⊕⊕⊝⊝ |
| Long‐term mortality (maximal follow‐up) | 448 per 1000 | 428 per 1000 | HR 0.94 | 195 | ⊕⊝⊝⊝ |
| Proportion with a serious adverse event (< 3 months) | 60 per 1000 | 36 per 1000 | RR 0.60 | 432 | ⊕⊝⊝⊝ |
| Health‐related quality of life during short‐term (four weeks to three months) or medium‐term (more than three months to one year) was not reported. | |||||
| *The basis for the assumed risk was the mean control group proportion. The corresponding risk (and its 95% confidence interval) is based on the assumed risk in the comparison group and the relative effect of the intervention (and its 95% CI). | |||||
| GRADE Working Group grades of evidence | |||||
| 1 There was unclear or high risk bias within the trials (downgraded by two levels). | |||||
| Laparoscopic gastrectomy compared to open gastrectomy for gastric cancer (secondary outcomes) | ||||||
| Patient or population: patients with gastric cancer | ||||||
| Outcomes | Illustrative comparative risks* (95% CI) | Relative effect | No of Participants | Quality of the evidence | Comments | |
| Assumed risk | Corresponding risk | |||||
| Open gastrectomy | Laparoscopic gastrectomy | |||||
| Long‐term recurrence (maximal follow‐up) | 450 per 1000 | 433 per 1000 | HR 0.95 | 162 | ⊕⊝⊝⊝ | |
| Proportion with an adverse event (< 3 months) | 207 per 1000 | 161 per 1000 | RR 0.78 | 2490 | ⊕⊝⊝⊝ | |
| Quantity of perioperative blood transfused | The mean quantity of perioperative blood transfused in the control groups was | The mean quantity of perioperative blood transfused in the intervention groups was | 143 | ⊕⊝⊝⊝ | SMD 0.05 (‐0.27 to 0.38) | |
| Length of hospital stay | The mean length of hospital stay in the intervention groups was | 319 | ⊕⊝⊝⊝ | |||
| Number of lymph nodes harvested | The mean number of lymph nodes harvested in the control groups was | The mean number of lymph nodes harvested in the intervention groups was | 472 | ⊕⊝⊝⊝ | ||
| There were no events in either group for short‐term recurrence (103 participants (3 studies)), proportion requiring blood transfusion (66 participants (2 studies)), proportion with positive resection margin (incomplete cancer resection) (14 participants (1 study)). | ||||||
| None of the trials reported on measures of earlier postoperative recovery such as time to return to normal activity or time to return to work. | ||||||
| *The basis for the assumed risk was the mean control group proportion. The corresponding risk (and its 95% confidence interval) is based on the assumed risk in the comparison group and the relative effect of the intervention (and its 95% CI). | ||||||
| GRADE Working Group grades of evidence | ||||||
| 1 There was unclear or high risk of bias within the trials (downgraded by two levels). Please see Figure 1 and Figure 2 which show this. | ||||||
| Outcome or subgroup title | No. of studies | No. of participants | Statistical method | Effect size |
| 1 Short‐term mortality Show forest plot | 11 | 2335 | Risk Ratio (M‐H, Fixed, 95% CI) | 1.60 [0.50, 5.10] |
| 2 Long‐term mortality (maximal follow‐up) Show forest plot | 3 | 195 | Hazard Ratio (Fixed, 95% CI) | 0.94 [0.70, 1.25] |
| 3 Proportion with a serious adverse event (< 3 months) Show forest plot | 8 | 432 | Risk Ratio (M‐H, Fixed, 95% CI) | 0.60 [0.27, 1.34] |
| 4 Short‐term recurrence Show forest plot | 3 | Risk Ratio (M‐H, Fixed, 95% CI) | Totals not selected | |
| 5 Long‐term recurrence (maximal follow‐up) Show forest plot | 4 | Hazard Ratio (Fixed, 95% CI) | Totals not selected | |
| 6 Proportion with an adverse event (< 3 months) Show forest plot | 11 | 2490 | Risk Ratio (M‐H, Random, 95% CI) | 0.78 [0.60, 1.01] |
| 7 Proportion requiring blood transfusion during or within a week of surgery Show forest plot | 2 | Risk Ratio (M‐H, Fixed, 95% CI) | Totals not selected | |
| 8 Quantity of perioperative blood transfused Show forest plot | 2 | 143 | Std. Mean Difference (IV, Fixed, 95% CI) | 0.05 [‐0.27, 0.38] |
| 9 Length of hospital stay Show forest plot | 8 | 444 | Mean Difference (IV, Random, 95% CI) | ‐1.38 [‐2.57, ‐0.19] |
| 10 Proportion with positive resection margins at histopathological examination Show forest plot | 1 | Risk Ratio (M‐H, Fixed, 95% CI) | Totals not selected | |
| 11 Number of lymph nodes harvested Show forest plot | 9 | 472 | Mean Difference (IV, Fixed, 95% CI) | ‐0.63 [‐1.51, 0.25] |
| Outcome or subgroup title | No. of studies | No. of participants | Statistical method | Effect size |
| 1 Short‐term mortality (stratified by early versus advanced cancer) Show forest plot | 7 | Risk Ratio (M‐H, Fixed, 95% CI) | Totals not selected | |
| 1.1 Early gastric cancer | 5 | Risk Ratio (M‐H, Fixed, 95% CI) | 0.0 [0.0, 0.0] | |
| 1.2 Advanced gastric cancer | 2 | Risk Ratio (M‐H, Fixed, 95% CI) | 0.0 [0.0, 0.0] | |
| 2 Long‐term mortality (maximal follow‐up) (stratified by early versus advanced cancer) Show forest plot | 2 | Hazard Ratio (Fixed, 95% CI) | Totals not selected | |
| 2.1 Early gastric cancer | 1 | Hazard Ratio (Fixed, 95% CI) | 0.0 [0.0, 0.0] | |
| 2.2 Advanced gastric cancer | 1 | Hazard Ratio (Fixed, 95% CI) | 0.0 [0.0, 0.0] | |
| 3 Proportion with a serious adverse event (< 3 months) (stratified by early versus advanced cancer) Show forest plot | 5 | 262 | Risk Ratio (M‐H, Fixed, 95% CI) | 0.58 [0.21, 1.60] |
| 3.1 Early gastric cancer | 4 | 166 | Risk Ratio (M‐H, Fixed, 95% CI) | 0.44 [0.14, 1.39] |
| 3.2 Advanced gastric cancer | 1 | 96 | Risk Ratio (M‐H, Fixed, 95% CI) | 2.88 [0.12, 68.98] |
| 4 Short‐term mortality (stratified by type of gastrectomy) Show forest plot | 10 | Risk Ratio (M‐H, Fixed, 95% CI) | Subtotals only | |
| 4.1 Subtotal gastrectomy | 10 | 2239 | Risk Ratio (M‐H, Fixed, 95% CI) | 1.60 [0.50, 5.10] |
| 5 Long‐term mortality (maximal follow‐up) (stratified by type of gastrectomy) Show forest plot | 2 | Hazard Ratio (Fixed, 95% CI) | Totals not selected | |
| 5.1 Subtotal gastrectomy | 2 | Hazard Ratio (Fixed, 95% CI) | 0.0 [0.0, 0.0] | |
| 6 Proportion with a serious adverse event (< 3 months) (stratified by type of gastrectomy) Show forest plot | 7 | Risk Ratio (M‐H, Fixed, 95% CI) | Subtotals only | |
| 6.1 Subtotal gastrectomy | 7 | 336 | Risk Ratio (M‐H, Fixed, 95% CI) | 0.52 [0.22, 1.22] |