Фармакологические вмешательства при остром панкреатите
Appendices
Appendix 1. Glossary of terms
Acute: sudden.
Analogues: a substance that is similar to another substance.
Antioxidants: substances that inhibit oxidation.
Autodigestion: Breakdown of the same organ that secretes the substance.
Bacterial colonisation: growth and multiplication of bacteria.
Cholangiopancreatography: fully known as endoscopic retrograde cholangiopancreatography (ERCP); a procedure carried out on the pancreatic and bile ducts using an endoscope and x‐rays.
Colonisation: presence of bacteria without causing illness (in this context).
Endoscopic sphincterotomy: endoscopic operation to cut the muscle surrounding the common bile duct and the pancreatic duct.
Endoscopic: with the help of an endoscope, a tube inserted into body (in this context, through the mouth and into the stomach and upper part of the small intestine).
Enzyme: substances that enable and speed up chemical reactions that are necessary for the normal functioning of the body.
Epigastric: upper central abdomen.
Epigastric pain: upper central abdominal pain.
Heterogeneity: variability.
Insulin: substance which helps regulate blood sugar.
Interstitial: space in between.
Morbidity: illness (in this context, it means complications).
Mortality: death.
Necrosectomy: removal of dead tissue.
Necrosis: death and decomposition of living tissue usually caused by lack of blood supply but can be caused by other pathological insult.
Necrotising : causing necrosis.
Oedematous: excessive accumulation of serous fluid in the intercellular spaces of tissues.
Pancreatic pseudocysts: fluid collections in the pancreas or the tissues surrounding the pancreas, surrounded by a well defined wall and contain only fluid with little or no solid material.
Pancreatitis: inflammation of the pancreas.
Pathologic insult: substance or mechanism that causes the condition.
Percutaneous: through the skin.
Peripancreatic tissues: tissues surrounding the pancreas.
Pharmacological: medicinal drugs.
Platelet activating factor: substance that causes platelets (cells responsible for clotting of blood) to clump together and is an intermediary substance in the inflammatory pathway.
Probiotics: microorganisms that are believed to provide health benefits when consumed.
Prognostic: to predict the likely outcome.
Protease inhibitors: substances that inhibit proteases.
Protease: an enzyme that digests protein.
Pseudocyst: a fluid‐filled cavity that resembles a cyst but lacks a wall or lining.
Radiology guided percutaneous treatments: treatments carried out by insertion of needle from the external surface of the body which are guided by a scan (usually an ultrasound or CT (computed tomography) scan).
Randomisation: using chance methods to assign people to treatments.
Retrograde: moving backwards.
Sepsis: life‐threatening illness due to blood infection with bacteria, fungus, or virus.
Serum: clear fluid that separates out when blood clots.
Sphincterotomy: a surgical procedure of the internal anal sphincter muscle.
Transabdominal: through the abdomen.
Transient: temporary.
Tumour necrosis factor‐alpha antibody: antibody to tumour necrosis factor‐alpha, an intermediary substance in the inflammatory pathway.
Appendix 2. CENTRAL search strategy
#1 MeSH descriptor: [Pancreatitis, Acute Necrotizing] this term only
#2 MeSH descriptor: [Pancreatitis] this term only and with qualifier(s): [Etiology ‐ ET]
#3 MeSH descriptor: [Pancreas] this term only and with qualifier(s): [Abnormalities ‐ AB, Pathology ‐ PA, Physiopathology ‐ PP]
#4 (acute near/3 pancrea*)
#5 (necro* near/3 pancrea*)
#6 (inflam* near/3 pancrea*)
#7 ((interstitial or edema* or oedema*) near/2 pancrea*)
#8 #1 or #2 or #3 or #4 or #5 or #6 or #7
Appendix 3. MEDLINE search strategy
1. Pancreatitis, Acute Necrotizing/
2. Pancreatitis/et
3. Pancreas/ab, pa, pp
4. (acute adj3 pancrea*).mp.
5. (necro* adj3 pancrea*).mp.
6. (inflam* adj3 pancrea$).mp.
7. ((interstitial or edema* or oedema*) adj2 pancrea*).mp.
8. 1 or 2 or 3 or 4 or 5 or 6 or 7
9. randomized controlled trial.pt.
10. controlled clinical trial.pt.
11. randomized.ab.
12. placebo.ab.
13. drug therapy.fs.
14. randomly.ab.
15. trial.ab.
16. groups.ab.
17. 9 or 10 or 11 or 12 or 13 or 14 or 15 or 16
18. exp animals/ not humans.sh.
19. 17 not 18
20. 8 and 19
Appendix 4. Embase search strategy
1. acute hemorrhagic pancreatitis/
2. Pancreatitis/et
3. acute pancreatitis/
4. (acute adj3 pancrea*).mp.
5. (necro* adj3 pancrea*).mp.
6. (inflam* adj3 pancrea*).mp.
7. ((interstitial or edema* or oedema*) adj2 pancrea*).mp.
8. 1 or 2 or 3 or 4 or 5 or 6 or 7
9. Clinical trial/
10. Randomized controlled trial/
11. Randomization/
12. Single‐Blind Method/
13. Double‐Blind Method/
14. Cross‐Over Studies/
15. Random Allocation/
16. Placebo/
17. Randomi?ed controlled trial*.tw.
18. Rct.tw.
19. Random allocation.tw.
20. Randomly allocated.tw.
21. Allocated randomly.tw.
22. (allocated adj2 random).tw.
23. Single blind*.tw.
24. Double blind*.tw.
25. ((treble or triple) adj blind*).tw.
26. Placebo*.tw.
27. Prospective study/
28. or/9‐27
29. Case study/
30. Case report.tw.
31. Abstract report/ or letter/
32. or/29‐31
33. 28 not 32
34. 8 and 33
Appendix 5. Science Citation Index search strategy
# 1 TS=((acute or necro* or inflam* or interstitial or edema* or oedema*) near/3 pancrea*)
# 2 TS=(random* OR rct* OR crossover OR masked OR blind* OR placebo* OR meta‐analysis OR systematic review* OR meta‐analys*)
# 3 #2 AND #1
Appendix 6. ClinicalTrials.gov search strategy
"Interventional" [STUDY‐TYPES] AND acute pancreatitis [DISEASE] AND ( "Phase 2" OR "Phase 3" OR "Phase 4" ) [PHASE]
Appendix 7. Planned methods
We planned to conduct network meta‐analyses to compare multiple interventions simultaneously for each of the primary and secondary outcomes when there was direct and indirect evidence for at least one comparison. Network meta‐analysis combines direct evidence within trials and indirect evidence across trials (Mills 2012).
We planned to obtain a network plot (Figure 9) to ensure that the trials were connected by treatments using Stata/IC 11 (StataCorp LP) (see Appendix 9 for the Stata commands used). We planned to apply network meta‐analysis to each connected network. We planned to conduct a Bayesian network meta‐analysis using the Markov chain Monte Carlo method in WinBUGS 1.4. We planned to model the treatment contrast (e.g. log OR for binary outcomes, MD or SMD for continuous outcomes, rate ratio for count outcomes, HR for time‐to‐event outcomes) for any two interventions ('functional parameters') as a function of comparisons between each individual intervention and an arbitrarily selected reference group ('basic parameters') (Lu 2004). We planned to use inactive control (combination of placebo and no‐intervention) as the reference group. We planned to perform the network analysis as per the guidance from the NICE DSU documents (Dias 2013). We planned to perform the network meta‐analysis using arm level data. Further details of the codes we planned to use and the technical details of how we planned to perform the analysis are shown in Appendix 10 and Appendix 11. In short, we planned to use three chains and a burn in of 10,000 simulations to ensure convergence, and to obtain the posterior estimates after a further 20,000 simulations. We planned to run the fixed‐effect and random‐effects models (assuming homogeneous between‐trial variance across comparisons) for each outcome. We planned to choose the fixed‐effect model if it resulted in an equivalent or better fit (assessed by residual deviances, number of effective parameters, and deviance information criterion (DIC)) than the random‐effects model. A lower DIC indicates a better model fit. We planned to use the random‐effects model if it resulted in a better model fit as indicated by a DIC lower than that of the fixed‐effect model by at least three. In addition, we planned to perform a random‐effects inconsistency model suggested by NICE DSU (Dias 2012b). We planned to consider the inconsistency model to be better than the random‐effects consistency model (standard random‐effects network meta‐analysis model) if the model fit of the inconsistency model (as indicated by DIC) was at least three lower than the random‐effects consistency model.

Network plot showing the treatment comparisons that included short‐term mortality. The circles represent treatments while the lines represent the comparisons between the treatments.
For multi‐arm trials, one can enter the data from all the arms in a trial as: the number of people with events and the number of people exposed to the event, using the binomial likelihood and logit link for binary outcomes; the mean and standard error using the normal likelihood and identity link for continuous outcomes requiring calculation of the mean difference; the mean and standard error of the treatment differences using the normal likelihood and identity link for continuous outcomes requiring calculation of the standardised mean difference; the number of events and the number of people exposed to the event using the Poisson likelihood and log link for count outcomes; the follow‐up time in the study, number of people with the event and the number of people exposed to the event using the binomial likelihood and cloglog link for time‐to‐event outcomes. We planned to report the treatment contrasts (e.g. log ORs for binary outcomes, MDs for continuous outcomes, and so on) of the different treatments in relation to the reference treatment (inactive intervention i.e. combined placebo and no‐intervention), the residual deviances, number of effective parameters, and DIC for the fixed‐effect model and the random‐effects model for each outcome. We also planned to report the parameters used to assess the model fit (i.e. residual deviances, number of effective parameters, and DIC) for the inconsistency model for all the outcomes and the between‐trial variance for the random‐effects model (Dias 2012a; Dias 2012b). If the inconsistency model resulted in a better model fit than consistency models, the transitivity assumption is likely to be untrue and the effect estimates obtained may not be reliable. We planned to highlight such outcomes where the inconsistency model results in a better model fit than consistency models.
We found significant clinical heterogeneity in the type of participants included under the different comparisons. To overcome the heterogeneity in the type of people included in different comparisons (See 'Included studies') we planned to perform a separate network meta‐analysis for interventions for mild pancreatitis separately from moderately severe or severe pancreatitis. This is because mild pancreatitis has no local or systemic complications and combining participants with mild and severe acute pancreatitis in the same network meta‐analysis may violate the transitivity assumption (the assumption that the participants included in the different studies with different treatments can be considered to be a part of a multi‐arm randomised controlled trial ‐ i.e. they should be reasonably similar in characteristics). We then planned to assess inconsistency again. However, this was not appropriate in the subgroup of severe acute pancreatitis because of the absence of any comparison in which direct and indirect comparison was available. If there was no evidence of inconsistency in the revised analysis, we planned to present the results of the analysis for mild and moderate or severe acute pancreatitis separately. If there was persistent evidence of inconsistency, we planned to present the results from the direct comparison in the 'Summary of findings' table.
We planned to calculate the 95% CrIs of treatment effects (e.g. ORs for binary outcomes, MDs for continuous outcomes, and so on) in the Bayesian meta‐analysis, which is similar in use to the 95% confidence intervals in the frequentist meta‐analysis. These are the 2.5th percentile and 97.5th percentiles of the simulations. We planned to report the mean effect estimate and the 95% CrI for each pair‐wise comparison in a table. We also planned to estimate the probability that each intervention ranks at one of the possible positions, and have presented this information in graphs. It should be noted that a less than 90% probability that the treatment is the best treatment is unreliable (i.e. one should not conclude that the treatment is the best treatment for that outcome if the probability of it being the best treatment is less than 90%) (Dias 2012a). We also planned to present the cumulative probability of the treatment ranks (i.e. the probability that the treatment is within the top two, the probability that the treatment is within the top three, etc.) in graphs. We also planned to plot the probability that each treatment is best for each of the different outcomes (rankograms) which are generally considered more informative (Dias 2012a; Salanti 2011). We planned to perform direct comparisons using the same codes. This would have allowed us to assess the heterogeneity in the comparisons and provide additional information in the 'Summary of findings' table. We also planned to use the Tau² statistic to measure heterogeneity among the trials in each analysis. The Tau² statistic provides a measure of the variability of the effect estimate across studies in a random‐effects model (Higgins 2011). If we identified substantial heterogeneity, we planned to explore it by meta‐regression. We also planned to assess the differences in the effect estimates between the subgroups using meta‐regression for each source of heterogeneity (i.e. one analysis for each source of heterogeneity) with the help of the code shown in Appendix 12. We planned to perform the following subgroup analyses regardless of heterogeneity. We planned to calculate the interaction term (Dias 2012c). If the 95% CrI of the regression coefficient of the interaction term does not overlap zero, we considered this statistically significant.
In the presence of adequate data where authors report the outcomes of participants at multiple follow‐up time points, we planned to follow the methods suggested by Lu 2007 to perform the meta‐analysis.
We planned to use methods and recommendations described for grading network meta‐analysis (Puhan 2014). This includes grading the quality for direct comparison, indirect comparison, and network meta‐analysis and presenting the information in tabular format.
Appendix 8. WHO ICTRP search strategy
Acute pancreatitis
Appendix 9. Stata code for network plot
networkplot t1 t2, labels(T1 T2 T3 ..)
Appendix 10. Winbugs code
Binary outcome
Binary outcome ‐ fixed‐effect model
# Binomial likelihood, logit link
# Fixed effects model
model{ # *** PROGRAM STARTS
for(i in 1:ns){ # LOOP THROUGH STUDIES
mu[i] ˜ dnorm(0,.0001) # vague priors for all trial baselines
for (k in 1:na[i]) { # LOOP THROUGH ARMS
r[i,k] ˜ dbin(p[i,k],n[i,k]) # binomial likelihood
# model for linear predictor
logit(p[i,k]) <‐ mu[i] + d[t[i,k]] ‐ d[t[i,1]]
# expected value of the numerators
rhat[i,k] <‐ p[i,k] * n[i,k]
#Deviance contribution
dev[i,k] <‐ 2 * (r[i,k] * (log(r[i,k])‐log(rhat[i,k]))
+ (n[i,k]‐r[i,k]) * (log(n[i,k]‐r[i,k]) ‐ log(n[i,k]‐rhat[i,k])))
}
# summed residual deviance contribution for this trial
resdev[i] <‐ sum(dev[i,1:na[i]])
}
totresdev <‐ sum(resdev[]) # Total Residual Deviance
d[1]<‐0 # treatment effect is zero for reference treatment
# vague priors for treatment effects
for (k in 2:nt){ d[k] ˜ dnorm(0,.0001) }
# pairwise ORs and LORs for all possible pair‐wise comparisons, if nt>2
for (c in 1:(nt‐1)) {
for (k in (c+1):nt) {
or[c,k] <‐ exp(d[k] ‐ d[c])
lor[c,k] <‐ (d[k]‐d[c])
}
}
# ranking on relative scale
for (k in 1:nt) {
# rk[k] <‐ nt+1‐rank(d[],k) # assumes events are “good”
rk[k] <‐ rank(d[],k) # assumes events are “bad”
best[k] <‐ equals(rk[k],1) #calculate probability that treat k is best
for (h in 1:nt){ prob[h,k] <‐ equals(rk[k],h) } # calculates probability that treat k is h‐th best
}
} # *** PROGRAM ENDS
Binary outcome ‐ random‐effects model
# Binomial likelihood, logit link
# Random effects model
model{ # *** PROGRAM STARTS
for(i in 1:ns){ # LOOP THROUGH STUDIES
w[i,1] <‐ 0 # adjustment for multi‐arm trials is zero for control arm
delta[i,1] <‐ 0 # treatment effect is zero for control arm
mu[i] ˜ dnorm(0,.0001) # vague priors for all trial baselines
for (k in 1:na[i]) { # LOOP THROUGH ARMS
r[i,k] ˜ dbin(p[i,k],n[i,k]) # binomial likelihood
logit(p[i,k]) <‐ mu[i] + delta[i,k] # model for linear predictor
rhat[i,k] <‐ p[i,k] * n[i,k] # expected value of the numerators
#Deviance contribution
dev[i,k] <‐ 2 * (r[i,k] * (log(r[i,k])‐log(rhat[i,k]))
+ (n[i,k]‐r[i,k]) * (log(n[i,k]‐r[i,k]) ‐ log(n[i,k]‐rhat[i,k]))) }
# summed residual deviance contribution for this trial
resdev[i] <‐ sum(dev[i,1:na[i]])
for (k in 2:na[i]) { # LOOP THROUGH ARMS
# trial‐specific LOR distributions
delta[i,k] ˜ dnorm(md[i,k],taud[i,k])
# mean of LOR distributions (with multi‐arm trial correction)
md[i,k] <‐ d[t[i,k]] ‐ d[t[i,1]] + sw[i,k]
# precision of LOR distributions (with multi‐arm trial correction)
taud[i,k] <‐ tau *2*(k‐1)/k
# adjustment for multi‐arm RCTs
w[i,k] <‐ (delta[i,k] ‐ d[t[i,k]] + d[t[i,1]])
# cumulative adjustment for multi‐arm trials
sw[i,k] <‐ sum(w[i,1:k‐1])/(k‐1)
}
}
totresdev <‐ sum(resdev[]) # Total Residual Deviance
d[1]<‐0 # treatment effect is zero for reference treatment
# vague priors for treatment effects
for (k in 2:nt){ d[k] ˜ dnorm(0,.0001) }
sd ˜ dunif(0,5) # vague prior for between‐trial SD
tau <‐ pow(sd,‐2) # between‐trial precision = (1/between‐trial variance)
# pairwise ORs and LORs for all possible pair‐wise comparisons, if nt>2
for (c in 1:(nt‐1)) {
for (k in (c+1):nt) {
or[c,k] <‐ exp(d[k] ‐ d[c])
lor[c,k] <‐ (d[k]‐d[c])
}
}
# ranking on relative scale
for (k in 1:nt) {
# rk[k] <‐ nt+1‐rank(d[],k) # assumes events are “good”
rk[k] <‐ rank(d[],k) # assumes events are “bad”
best[k] <‐ equals(rk[k],1) #calculate probability that treat k is best
for (h in 1:nt){ prob[h,k] <‐ equals(rk[k],h) } # calculates probability that treat k is h‐th best
}
} # *** PROGRAM ENDS
Binary outcome ‐ inconsistency model (random‐effects)
# Binomial likelihood, logit link, inconsistency model
# Random effects model
model{ # *** PROGRAM STARTS
for(i in 1:ns){ # LOOP THROUGH trials
delta[i,1]<‐0 # treatment effect is zero in control arm
mu[i] ˜ dnorm(0,.0001) # vague priors for trial baselines
for (k in 1:na[i]) { # LOOP THROUGH ARMS
r[i,k] ˜ dbin(p[i,k],n[i,k]) # binomial likelihood
logit(p[i,k]) <‐ mu[i] + delta[i,k] # model for linear predictor
#Deviance contribution
rhat[i,k] <‐ p[i,k] * n[i,k] # expected value of the numerators
dev[i,k] <‐ 2 * (r[i,k] * (log(r[i,k])‐log(rhat[i,k]))
+ (n[i,k]‐r[i,k]) * (log(n[i,k]‐r[i,k]) ‐ log(n[i,k]‐rhat[i,k])))
}
# summed residual deviance contribution for this trial
resdev[i] <‐ sum(dev[i,1:na[i]])
for (k in 2:na[i]) { # LOOP THROUGH ARMS
# trial‐specific LOR distributions
delta[i,k] ˜ dnorm(d[t[i,1],t[i,k]] ,tau)
}
}
totresdev <‐ sum(resdev[]) # Total Residual Deviance
for (c in 1:(nt‐1)) { # priors for all mean treatment effects
for (k in (c+1):nt) { d[c,k] ˜ dnorm(0,.0001) }
}
sd ˜ dunif(0,5) # vague prior for between‐trial standard deviation
var <‐ pow(sd,2) # between‐trial variance
tau <‐ 1/var # between‐trial precision
} # *** PROGRAM ENDS
Continuous outcome (mean difference)
Continuous outcome (mean difference) ‐ fixed‐effect model
# Normal likelihood, identity link
# Fixed effect model
model{ # *** PROGRAM STARTS
for(i in 1:ns){ # LOOP THROUGH STUDIES
mu[i] ˜ dnorm(0,.0001) # vague priors for all trial baselines
for (k in 1:na[i]) { # LOOP THROUGH ARMS
var[i,k] <‐ pow(se[i,k],2) # calculate variances
prec[i,k] <‐ 1/var[i,k] # set precisions
y[i,k] ˜ dnorm(theta[i,k],prec[i,k])
# model for linear predictor
theta[i,k] <‐ mu[i] + d[t[i,k]] ‐ d[t[i,1]]
#Deviance contribution
dev[i,k] <‐ (y[i,k]‐theta[i,k])*(y[i,k]‐theta[i,k])*prec[i,k]
}
# summed residual deviance contribution for this trial
resdev[i] <‐ sum(dev[i,1:na[i]])
}
totresdev <‐ sum(resdev[]) #Total Residual Deviance
d[1]<‐0 # treatment effect is zero for control arm
# vague priors for treatment effects
for (k in 2:nt){ d[k] ˜ dnorm(0,.0001) }
# ranking on relative scale
for (k in 1:nt) {
rk[k] <‐ rank(d[],k) # assumes lower is better
# rk[k] <‐ nt+1‐rank(d[],k) # assumes lower outcome is worse
best[k] <‐ equals(rk[k],1) #calculate probability that treat k is best
for (h in 1:nt){ prob[h,k] <‐ equals(rk[k],h) } # calculates probability that treat k is h‐th best
}
} # *** PROGRAM ENDS
Continuous outcome (mean difference) ‐ random‐effects model
# Normal likelihood, identity link
# Random effects model for multi‐arm trials
model{ # *** PROGRAM STARTS
for(i in 1:ns){ # LOOP THROUGH STUDIES
w[i,1] <‐ 0 # adjustment for multi‐arm trials is zero for control arm
delta[i,1] <‐ 0 # treatment effect is zero for control arm
mu[i] ˜ dnorm(0,.0001) # vague priors for all trial baselines
for (k in 1:na[i]) { # LOOP THROUGH ARMS
var[i,k] <‐ pow(se[i,k],2) # calculate variances
prec[i,k] <‐ 1/var[i,k] # set precisions
y[i,k] ˜ dnorm(theta[i,k],prec[i,k])
theta[i,k] <‐ mu[i] + delta[i,k] # model for linear predictor
#Deviance contribution
dev[i,k] <‐ (y[i,k]‐theta[i,k])*(y[i,k]‐theta[i,k])*prec[i,k]
}
# summed residual deviance contribution for this trial
resdev[i] <‐ sum(dev[i,1:na[i]])
for (k in 2:na[i]) { # LOOP THROUGH ARMS
# trial‐specific MD distributions
delta[i,k] ˜ dnorm(md[i,k],taud[i,k])
# mean of MD distributions, with multi‐arm trial correction
md[i,k] <‐ d[t[i,k]] ‐ d[t[i,1]] + sw[i,k]
# precision of MD distributions (with multi‐arm trial correction)
taud[i,k] <‐ tau *2*(k‐1)/k
# adjustment, multi‐arm RCTs
w[i,k] <‐ (delta[i,k] ‐ d[t[i,k]] + d[t[i,1]])
# cumulative adjustment for multi‐arm trials
sw[i,k] <‐ sum(w[i,1:k‐1])/(k‐1)
}
}
totresdev <‐ sum(resdev[]) #Total Residual Deviance
d[1]<‐0 # treatment effect is zero for control arm
# vague priors for treatment effects
for (k in 2:nt){ d[k] ˜ dnorm(0,.0001) }
sd ˜ dunif(0,5) # vague prior for between‐trial SD
tau <‐ pow(sd,‐2) # between‐trial precision = (1/between‐trial variance)
# ranking on relative scale
for (k in 1:nt) {
rk[k] <‐ rank(d[],k) # assumes lower is better
# rk[k] <‐ nt+1‐rank(d[],k) # assumes lower outcome is worse
best[k] <‐ equals(rk[k],1) #calculate probability that treat k is best
for (h in 1:nt){ prob[h,k] <‐ equals(rk[k],h) } # calculates probability that treat k is h‐th best
}
} # *** PROGRAM ENDS
Continuous outcome (standardised mean difference)
The standardised mean difference and its standard error for each treatment comparison will be calculated using the statistical algorithms used by RevMan.
Continuous outcome (standardised mean difference) ‐ fixed‐effect model
# Normal likelihood, identity link
# Trial‐level data given as treatment differences
# Fixed effects model
model{ # *** PROGRAM STARTS
for(i in 1:ns2) { # LOOP THROUGH 2‐ARM STUDIES
y[i,2] ˜ dnorm(delta[i,2],prec[i,2]) # normal likelihood for 2‐arm trials
#Deviance contribution for trial i
resdev[i] <‐ (y[i,2]‐delta[i,2])*(y[i,2]‐delta[i,2])*prec[i,2]
}
for(i in (ns2+1):(ns2+ns3)) { # LOOP THROUGH THREE‐ARM STUDIES
for (k in 1:(na[i]‐1)) { # set variance‐covariance matrix
for (j in 1:(na[i]‐1)) {
Sigma[i,j,k] <‐ V[i]*(1‐equals(j,k)) + var[i,k+1]*equals(j,k)
}
}
Omega[i,1:(na[i]‐1),1:(na[i]‐1)] <‐ inverse(Sigma[i,,]) #Precision matrix
# multivariate normal likelihood for 3‐arm trials
y[i,2:na[i]] ˜ dmnorm(delta[i,2:na[i]],Omega[i,1:(na[i]‐1),1:(na[i]‐1)])
#Deviance contribution for trial i
for (k in 1:(na[i]‐1)){ # multiply vector & matrix
ydiff[i,k]<‐ y[i,(k+1)] ‐ delta[i,(k+1)]
z[i,k]<‐ inprod2(Omega[i,k,1:(na[i]‐1)], ydiff[i,1:(na[i]‐1)])
}
resdev[i]<‐ inprod2(ydiff[i,1:(na[i]‐1)], z[i,1:(na[i]‐1)])
}
for(i in 1:(ns2+ns3)){ # LOOP THROUGH ALL STUDIES
for (k in 2:na[i]) { # LOOP THROUGH ARMS
var[i,k] <‐ pow(se[i,k],2) # calculate variances
prec[i,k] <‐ 1/var[i,k] # set precisions
delta[i,k] <‐ d[t[i,k]] ‐ d[t[i,1]]
}
}
totresdev <‐ sum(resdev[]) #Total Residual Deviance
d[1]<‐0 # treatment effect is zero for reference treatment
# vague priors for treatment effects
for (k in 2:nt){ d[k] ˜ dnorm(0,.0001) }
# ranking on relative scale
for (k in 1:nt) {
rk[k] <‐ nt+1‐rank(d[],k) # assumes higher HRQoL is “good”
#rk[k] <‐ rank(d[],k) # assumes higher outcome is “bad”
best[k] <‐ equals(rk[k],1) #calculate probability that treat k is best
for (h in 1:nt){ prob[h,k] <‐ equals(rk[k],h) } # calculates probability that treat k is h‐th best
}
} # *** PROGRAM ENDS
Continuous outcome (standardised mean difference) ‐ random‐effects model
# Normal likelihood, identity link
# Trial‐level data given as treatment differences
# Random effects model
model{ # *** PROGRAM STARTS
for(i in 1:ns2) { # LOOP THROUGH 2‐ARM STUDIES
y[i,2] ˜ dnorm(delta[i,2],prec[i,2]) # normal likelihood for 2‐arm trials
#Deviance contribution for trial i
resdev[i] <‐ (y[i,2]‐delta[i,2])*(y[i,2]‐delta[i,2])*prec[i,2]
}
for(i in (ns2+1):(ns2+ns3)) { # LOOP THROUGH THREE‐ARM STUDIES
for (k in 1:(na[i]‐1)) { # set variance‐covariance matrix
for (j in 1:(na[i]‐1)) {
Sigma[i,j,k] <‐ V[i]*(1‐equals(j,k)) + var[i,k+1]*equals(j,k)
}
}
Omega[i,1:(na[i]‐1),1:(na[i]‐1)] <‐ inverse(Sigma[i,,]) #Precision matrix
# multivariate normal likelihood for 3‐arm trials
y[i,2:na[i]] ˜ dmnorm(delta[i,2:na[i]],Omega[i,1:(na[i]‐1),1:(na[i]‐1)])
#Deviance contribution for trial i
for (k in 1:(na[i]‐1)){ # multiply vector & matrix
ydiff[i,k]<‐ y[i,(k+1)] ‐ delta[i,(k+1)]
z[i,k]<‐ inprod2(Omega[i,k,1:(na[i]‐1)], ydiff[i,1:(na[i]‐1)])
}
resdev[i]<‐ inprod2(ydiff[i,1:(na[i]‐1)], z[i,1:(na[i]‐1)])
}
for(i in 1:(ns2+ns3)){ # LOOP THROUGH ALL STUDIES
w[i,1] <‐ 0 # adjustment for multi‐arm trials is zero for control arm
delta[i,1] <‐ 0 # treatment effect is zero for control arm
for (k in 2:na[i]) { # LOOP THROUGH ARMS
var[i,k] <‐ pow(se[i,k],2) # calculate variances
prec[i,k] <‐ 1/var[i,k] # set precisions
}
for (k in 2:na[i]) { # LOOP THROUGH ARMS
# trial‐specific SMD distributions
delta[i,k] ˜ dnorm(md[i,k],taud[i,k])
# mean of random effects distributions, with multi‐arm trial correction
md[i,k] <‐ d[t[i,k]] ‐ d[t[i,1]] + sw[i,k]
# precision of random effects distributions (with multi‐arm trial correction)
taud[i,k] <‐ tau *2*(k‐1)/k
# adjustment, multi‐arm RCTs
w[i,k] <‐ (delta[i,k] ‐ d[t[i,k]] + d[t[i,1]])
# cumulative adjustment for multi‐arm trials
sw[i,k] <‐ sum(w[i,1:k‐1])/(k‐1)
}
}
totresdev <‐ sum(resdev[]) #Total Residual Deviance
d[1]<‐0 # treatment effect is zero for reference treatment
# vague priors for treatment effects
for (k in 2:nt){ d[k] ˜ dnorm(0,.0001) }
sd ˜ dunif(0,5) # vague prior for between‐trial SD
tau <‐ pow(sd,‐2) # between‐trial precision = (1/between‐trial variance)
# ranking on relative scale
for (k in 1:nt) {
rk[k] <‐ nt+1‐rank(d[],k) # assumes higher HRQoL is “good”
# rk[k] <‐ rank(d[],k) # assumes higher outcome is “bad”
best[k] <‐ equals(rk[k],1) #calculate probability that treat k is best
for (h in 1:nt){ prob[h,k] <‐ equals(rk[k],h) } # calculates probability that treat k is h‐th best
}
} # *** PROGRAM ENDS
Count outcome
Count outcome ‐ fixed‐effect model
# Poisson likelihood, log link
# Fixed effects model
model{ # *** PROGRAM STARTS
for(i in 1:ns){ # LOOP THROUGH STUDIES
mu[i] ˜ dnorm(0,.0001) # vague priors for all trial baselines
for (k in 1:na[i]) { # LOOP THROUGH ARMS
r[i,k] ˜ dpois(theta[i,k]) # Poisson likelihood
theta[i,k] <‐ lambda[i,k]*E[i,k] # failure rate * exposure
# model for linear predictor
log(lambda[i,k]) <‐ mu[i] + d[t[i,k]] ‐ d[t[i,1]]
#Deviance contribution
dev[i,k] <‐ 2*((theta[i,k]‐r[i,k]) + r[i,k]*log(r[i,k]/theta[i,k])) }
# summed residual deviance contribution for this trial
resdev[i] <‐ sum(dev[i,1:na[i]])
}
totresdev <‐ sum(resdev[]) #Total Residual Deviance
d[1]<‐0 # treatment effect is zero reference treatment
# vague priors for treatment effects
for (k in 2:nt){ d[k] ˜ dnorm(0,.0001) }
# pairwise RRs and LRRs for all possible pair‐wise comparisons, if nt>2
for (c in 1:(nt‐1)) {
for (k in (c+1):nt) {
rater[c,k] <‐ exp(d[k] ‐ d[c])
lrater[c,k] <‐ (d[k]‐d[c])
}
}
# ranking on relative scale
for (k in 1:nt) {
# rk[k] <‐ nt+1‐rank(d[],k) # assumes events are “good”
rk[k] <‐ rank(d[],k) # assumes events are “bad”
best[k] <‐ equals(rk[k],1) #calculate probability that treat k is best
for (h in 1:nt){ prob[h,k] <‐ equals(rk[k],h) } # calculates probability that treat k is h‐th best
}
} # *** PROGRAM ENDS
Count outcome ‐ random‐effects model
# Poisson likelihood, log link
# Random effects model
model{ # *** PROGRAM STARTS
for(i in 1:ns){ # LOOP THROUGH STUDIES
w[i,1] <‐ 0 # adjustment for multi‐arm trials is zero for control arm
delta[i,1] <‐ 0 # treatment effect is zero for control arm
mu[i] ˜ dnorm(0,.0001) # vague priors for all trial baselines
for (k in 1:na[i]) { # LOOP THROUGH ARMS
r[i,k] ˜ dpois(theta[i,k]) # Poisson likelihood
theta[i,k] <‐ lambda[i,k]*E[i,k] # failure rate * exposure
# model for linear predictor
log(lambda[i,k]) <‐ mu[i] + d[t[i,k]] ‐ d[t[i,1]]
#Deviance contribution
dev[i,k] <‐ 2*((theta[i,k]‐r[i,k]) + r[i,k]*log(r[i,k]/theta[i,k])) }
# summed residual deviance contribution for this trial
resdev[i] <‐ sum(dev[i,1:na[i]])
for (k in 2:na[i]) { # LOOP THROUGH ARMS
# trial‐specific LOR distributions
delta[i,k] ˜ dnorm(md[i,k],taud[i,k])
# mean of LOR distributions (with multi‐arm trial correction)
md[i,k] <‐ d[t[i,k]] ‐ d[t[i,1]] + sw[i,k]
# precision of LOR distributions (with multi‐arm trial correction)
taud[i,k] <‐ tau *2*(k‐1)/k
# adjustment for multi‐arm RCTs
w[i,k] <‐ (delta[i,k] ‐ d[t[i,k]] + d[t[i,1]])
# cumulative adjustment for multi‐arm trials
sw[i,k] <‐ sum(w[i,1:k‐1])/(k‐1)
}
}
totresdev <‐ sum(resdev[]) # Total Residual Deviance
d[1]<‐0 # treatment effect is zero for reference treatment
# vague priors for treatment effects
for (k in 2:nt){ d[k] ˜ dnorm(0,.0001) }
sd ˜ dunif(0,5) # vague prior for between‐trial SD
tau <‐ pow(sd,‐2) # between‐trial precision = (1/between‐trial variance)
# pairwise ORs and LORs for all possible pair‐wise comparisons, if nt>2
for (c in 1:(nt‐1)) {
for (k in (c+1):nt) {
or[c,k] <‐ exp(d[k] ‐ d[c])
lor[c,k] <‐ (d[k]‐d[c])
}
}
# ranking on relative scale
for (k in 1:nt) {
# rk[k] <‐ nt+1‐rank(d[],k) # assumes events are “good”
rk[k] <‐ rank(d[],k) # assumes events are “bad”
best[k] <‐ equals(rk[k],1) #calculate probability that treat k is best
for (h in 1:nt){ prob[h,k] <‐ equals(rk[k],h) } # calculates probability that treat k is h‐th best
}
} # *** PROGRAM ENDS
Time‐to‐event outcome
Time‐to‐event outcome ‐ fixed‐effect model
# Binomial likelihood, cloglog link
# Fixed effects model
model{ # *** PROGRAM STARTS
for(i in 1:ns){ # LOOP THROUGH STUDIES
mu[i] ˜ dnorm(0,.0001) # vague priors for all trial baselines
for (k in 1:na[i]) { # LOOP THROUGH ARMS
r[i,k] ˜ dbin(p[i,k],n[i,k]) # Binomial likelihood
# model for linear predictor
cloglog(p[i,k]) <‐ log(time[i]) + mu[i] + d[t[i,k]] ‐ d[t[i,1]]
rhat[i,k] <‐ p[i,k] * n[i,k] # expected value of the numerators
#Deviance contribution
dev[i,k] <‐ 2 * (r[i,k] * (log(r[i,k])‐log(rhat[i,k]))
+ (n[i,k]‐r[i,k]) * (log(n[i,k]‐r[i,k]) ‐ log(n[i,k]‐rhat[i,k]))) }
# summed residual deviance contribution for this trial
resdev[i] <‐ sum(dev[i,1:na[i]])
}
totresdev <‐ sum(resdev[]) #Total Residual Deviance
d[1]<‐0 # treatment effect is zero for control arm
# vague priors for treatment effects
for (k in 2:nt){ d[k] ˜ dnorm(0,.0001) }
# ranking on relative scale
for (k in 1:nt) {
# rk[k] <‐ rank(d[],k) # assumes lower is better
rk[k] <‐ nt+1‐rank(d[],k) # assumes lower outcome is worse
best[k] <‐ equals(rk[k],1) #calculate probability that treat k is best
for (h in 1:nt){ prob[h,k] <‐ equals(rk[k],h) } # calculates probability that treat k is h‐th best
}
} # *** PROGRAM ENDS
Time‐to‐event outcome ‐ random‐effects model
# Binomial likelihood, cloglog link
# Random effects model
model{ # *** PROGRAM STARTS
for(i in 1:ns){ # LOOP THROUGH STUDIES
w[i,1] <‐ 0 # adjustment for multi‐arm trials is zero for control arm
delta[i,1] <‐ 0 # treatment effect is zero for control arm
mu[i] ˜ dnorm(0,.0001) # vague priors for all trial baselines
for (k in 1:na[i]) { # LOOP THROUGH ARMS
r[i,k] ˜ dbin(p[i,k],n[i,k]) # Binomial likelihood
# model for linear predictor
cloglog(p[i,k]) <‐ log(time[i]) + mu[i] + delta[i,k]
rhat[i,k] <‐ p[i,k] * n[i,k] # expected value of the numerators
#Deviance contribution
dev[i,k] <‐ 2 * (r[i,k] * (log(r[i,k])‐log(rhat[i,k]))
+ (n[i,k]‐r[i,k]) * (log(n[i,k]‐r[i,k]) ‐ log(n[i,k]‐rhat[i,k]))) }
# summed residual deviance contribution for this trial
resdev[i] <‐ sum(dev[i,1:na[i]])
for (k in 2:na[i]) { # LOOP THROUGH ARMS
# trial‐specific LOR distributions
delta[i,k] ˜ dnorm(md[i,k],taud[i,k])
# mean of LOR distributions, with multi‐arm trial correction
md[i,k] <‐ d[t[i,k]] ‐ d[t[i,1]] + sw[i,k]
# precision of LOR distributions (with multi‐arm trial correction)
taud[i,k] <‐ tau *2*(k‐1)/k
# adjustment, multi‐arm RCTs
w[i,k] <‐ (delta[i,k] ‐ d[t[i,k]] + d[t[i,1]])
# cumulative adjustment for multi‐arm trials
sw[i,k] <‐ sum(w[i,1:k‐1])/(k‐1)
}
}
totresdev <‐ sum(resdev[]) #Total Residual Deviance
d[1]<‐0 # treatment effect is zero for reference treatment
# vague priors for treatment effects
for (k in 2:nt){ d[k] ˜ dnorm(0,.0001) }
sd ˜ dunif(0,5) # vague prior for between‐trial SD
tau <‐ pow(sd,‐2) # between‐trial precision = (1/between‐trial variance)
# ranking on relative scale
for (k in 1:nt) {
# rk[k] <‐ rank(d[],k) # assumes lower is better
rk[k] <‐ nt+1‐rank(d[],k) # assumes lower outcome is worse
best[k] <‐ equals(rk[k],1) #calculate probability that treat k is best
for (h in 1:nt){ prob[h,k] <‐ equals(rk[k],h) } # calculates probability that treat k is h‐th best
}
} # *** PROGRAM ENDS
Appendix 11. Technical details of network meta‐analysis
The posterior probabilities (effect estimates or values) of the treatment contrast (i.e. log odds ratio, mean difference, standardised mean difference, rate ratio, or hazard ratio) may vary depending on the initial values to start the simulations. In order to control the random error due to the choice of initial values, we performed the network analysis for three different initial values (priors) as per the guidance from The National Institute for Health and Care Excellence (NICE) Decision Support Unit (DSU) documents (Dias 2013). If the results from three different priors are similar (convergence), then the results are reliable. It is important to discard the results of the initial simulations as they can be significantly affected by the choice of the priors and only include the results of the simulations obtained after the convergence. The discarding of the initial simulations is called 'burn in'. We ran the models for all outcomes for 10,000 simulations for 'burn in' for three different chains (a set of initial values). We ran the models for another 20,000 simulations to obtain the effect estimates. We obtained the effect estimates from the results of all the three chains (different initial values). We also ensured that the results in the three different chains are similar in order to control for random error due to the choice of initial values. This was done in addition to the visual inspection of convergence obtained after simulations in the burn in.
We ran three different models for each outcome. The fixed‐effect model assumes that the treatment effect is the same across studies. The random‐effects consistency model assumes that the treatment effect is distributed normally across the studies but assumes that the transitivity assumption is satisfied (i.e. the population studied, the definition of outcomes, and the methods used were similar across studies and that there is consistency between the direct comparison and indirect comparison). A random‐effects inconsistency model does not make the transitivity assumption. If the inconsistency model resulted in a better model fit than the consistency model, the results of the network meta‐analysis can be unreliable and so should be interpreted with extreme caution. If there is evidence of inconsistency, we planned to identify areas in the network where substantial inconsistency might be present in terms of clinical and methodological diversities between trials and, when appropriate, limit the network meta‐analysis to a more compatible subset of trials.
The choice of the model between fixed‐effect and random‐effects was based on the model fit as per the guidelines of the NICE TSU (Dias 2013). The model fit will be assessed by deviance residuals and Deviance Information Criteria (DIC) according to NICE TSU guidelines (Dias 2013). A difference of three or five in the DIC is not generally considered important (Dias 2012c). We used the simpler model, i.e. fixed‐effect model if the DIC are similar between the fixed‐effect and the random‐effects models. We used the random‐effects model if it results in a better model fit as indicated by a DIC lower than that of the fixed‐effect model by at least three.
We planned to calculate the effect estimates of the treatment and the 95% credible intervals using the following additional code.
# pairwise ORs and MD for all possible pair‐wise comparisons, if nt>2
for (c in 1:(nt‐1)) {
for (k in (c+1):nt) {
OR[c,k] <‐ exp(d[k] ‐ d[c])
#MD[c,k] <‐ (d[k]‐d[c])
}
}
where c indicates control group, k indicates intervention group, OR indicates odds ratio or other ratios, and MD indicates mean difference or other differences.
Appendix 12. Winbugs code for subgroup analysis
Categorical covariate
Only the code for random‐effects model for a binary outcome is shown. The differences in the code are underlined. We planned to make similar changes for other outcomes.
# Binomial likelihood, logit link, subgroup
# Random effects model for multi‐arm trials
model{ # *** PROGRAM STARTS
for(i in 1:ns){ # LOOP THROUGH STUDIES
w[i,1] <‐ 0 # adjustment for multi‐arm trials is zero for control arm
delta[i,1] <‐ 0 # treatment effect is zero for control arm
mu[i] ˜ dnorm(0,.0001) # vague priors for all trial baselines
for (k in 1:na[i]) { # LOOP THROUGH ARMS
r[i,k] ˜ dbin(p[i,k],n[i,k]) # binomial likelihood
# model for linear predictor, covariate effect relative to treat in arm 1
logit(p[i,k]) <‐ mu[i] + delta[i,k] + (beta[t[i,k]]‐beta[t[i,1]]) * x[i]
rhat[i,k] <‐ p[i,k] * n[i,k] # expected value of the numerators
#Deviance contribution
dev[i,k] <‐ 2 * (r[i,k] * (log(r[i,k])‐log(rhat[i,k]))
+ (n[i,k]‐r[i,k]) * (log(n[i,k]‐r[i,k]) ‐ log(n[i,k]‐rhat[i,k]))) }
# summed residual deviance contribution for this trial
resdev[i] <‐ sum(dev[i,1:na[i]])
for (k in 2:na[i]) { # LOOP THROUGH ARMS
# trial‐specific LOR distributions
delta[i,k] ˜ dnorm(md[i,k],taud[i,k])
# mean of LOR distributions (with multi‐arm trial correction)
md[i,k] <‐ d[t[i,k]] ‐ d[t[i,1]] + sw[i,k]
# precision of LOR distributions (with multi‐arm trial correction)
taud[i,k] <‐ tau *2*(k‐1)/k
# adjustment for multi‐arm RCTs
w[i,k] <‐ (delta[i,k] ‐ d[t[i,k]] + d[t[i,1]])
# cumulative adjustment for multi‐arm trials
sw[i,k] <‐ sum(w[i,1:k‐1])/(k‐1)
}
}
totresdev <‐ sum(resdev[]) # Total Residual Deviance
d[1]<‐0 # treatment effect is zero for reference treatment
beta[1] <‐ 0 # covariate effect is zero for reference treatment
for (k in 2:nt){ # LOOP THROUGH TREATMENTS
d[k] ˜ dnorm(0,.0001) # vague priors for treatment effects
beta[k] <‐ B[k] # exchangeable covariate effect
B[k] ˜ dnorm(0,.0001) # vague prior for covariate effect
}
sd ˜ dunif(0,5) # vague prior for between‐trial SD
tau <‐ pow(sd,‐2) # between‐trial precision = (1/between‐trial variance)
# treatment effect when covariate = z[j]
for (k in 1:nt){ # LOOP THROUGH TREATMENTS
for (j in 1:nz) { dz[j,k] <‐ d[k] + (beta[k]‐beta[1])*z[j] }
}
# *** PROGRAM ENDS
Continuous covariate
# Binomial likelihood, logit link, continuous covariate
# Random effects model for multi‐arm trials
model{ # *** PROGRAM STARTS
for(i in 1:ns){ # LOOP THROUGH STUDIES
w[i,1] <‐ 0 # adjustment for multi‐arm trials is zero for control arm
delta[i,1] <‐ 0 # treatment effect is zero for control arm
mu[i] ˜ dnorm(0,.0001) # vague priors for all trial baselines
for (k in 1:na[i]) { # LOOP THROUGH ARMS
r[i,k] ˜ dbin(p[i,k],n[i,k]) # binomial likelihood
# model for linear predictor, covariate effect relative to treat in arm 1
logit(p[i,k]) <‐ mu[i] + delta[i,k] + (beta[t[i,k]]‐beta[t[i,1]]) * (x[i]‐mx)
rhat[i,k] <‐ p[i,k] * n[i,k] # expected value of the numerators
#Deviance contribution
dev[i,k] <‐ 2 * (r[i,k] * (log(r[i,k])‐log(rhat[i,k]))
+ (n[i,k]‐r[i,k]) * (log(n[i,k]‐r[i,k]) ‐ log(n[i,k]‐rhat[i,k]))) }
# summed residual deviance contribution for this trial
resdev[i] <‐ sum(dev[i,1:na[i]])
for (k in 2:na[i]) { # LOOP THROUGH ARMS
# trial‐specific LOR distributions
delta[i,k] ˜ dnorm(md[i,k],taud[i,k])
# mean of LOR distributions (with multi‐arm trial correction)
md[i,k] <‐ d[t[i,k]] ‐ d[t[i,1]] + sw[i,k]
# precision of LOR distributions (with multi‐arm trial correction)
taud[i,k] <‐ tau *2*(k‐1)/k
# adjustment for multi‐arm RCTs
w[i,k] <‐ (delta[i,k] ‐ d[t[i,k]] + d[t[i,1]])
# cumulative adjustment for multi‐arm trials
sw[i,k] <‐ sum(w[i,1:k‐1])/(k‐1)
}
}
totresdev <‐ sum(resdev[]) # Total Residual Deviance
d[1]<‐0 # treatment effect is zero for reference treatment
beta[1] <‐ 0 # covariate effect is zero for reference treatment
for (k in 2:nt){ # LOOP THROUGH TREATMENTS
d[k] ˜ dnorm(0,.0001) # vague priors for treatment effects
beta[k] <‐ B[k] # exchangeable covariate effect
B[k] ˜ dnorm(0,.0001) # vague prior for covariate effect
}
sd ˜ dunif(0,5) # vague prior for between‐trial SD
tau <‐ pow(sd,‐2) # between‐trial precision = (1/between‐trial variance)
# treatment effect when covariate = z[j] (un‐centring treatment effects)
for (k in 1:nt){
for (j in 1:nz) { dz[j,k] <‐ d[k] ‐ (beta[k]‐beta[1])*(mx‐z[j]) }
}
# pairwise ORs and LORs for all possible pair‐wise comparisons, if nt>2
for (c in 1:(nt‐1)) {
for (k in (c+1):nt) {
# at mean value of covariate
or[c,k] <‐ exp(d[k] ‐ d[c])
lor[c,k] <‐ (d[k]‐d[c])
# at covariate=z[j]
for (j in 1:nz) {
orz[j,c,k] <‐ exp(dz[j,k] ‐ dz[j,c])
lorz[j,c,k] <‐ (dz[j,k]‐dz[j,c])
}
}
}
} # *** PROGRAM ENDS
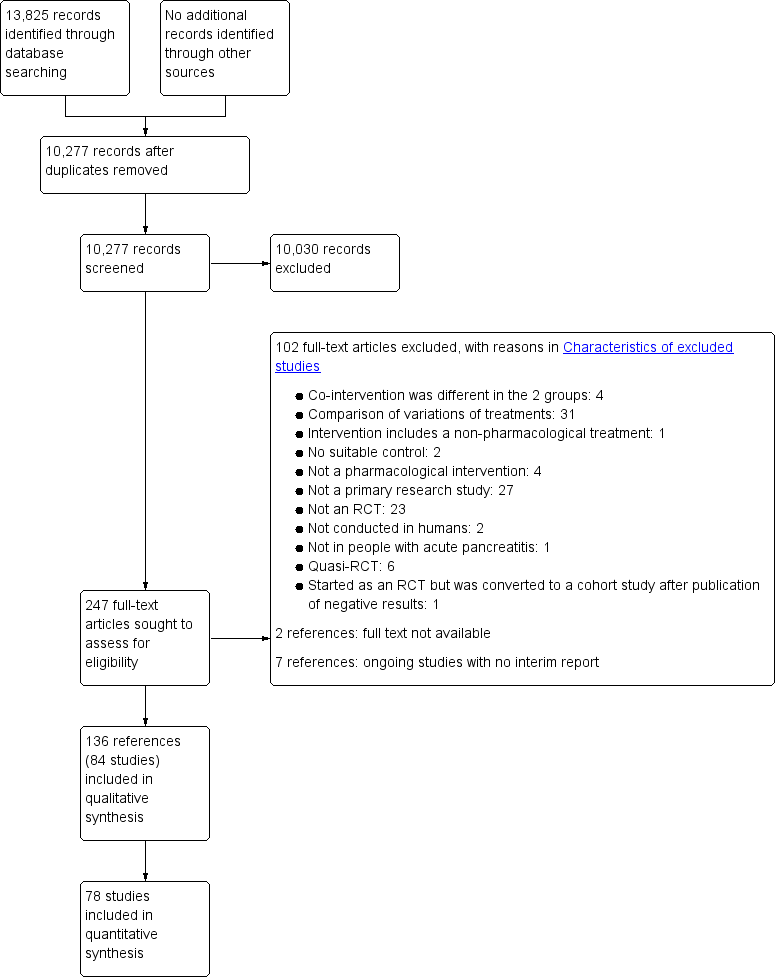
Study flow diagram.

Risk of bias graph: review authors' judgements about each risk of bias item presented as percentages across all included studies.

Risk of bias summary: review authors' judgements about each risk of bias item for each included study.

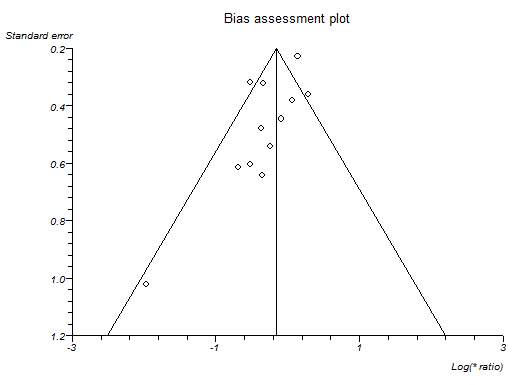
Funnel plot of short‐term mortality indicating no evidence of reporting bias.

Funnel plot of infected pancreatic necrosis indicating no evidence of reporting bias.

Funnel plot of requirement for additional invasive intervention indicating no evidence of reporting bias.
Funnel plot of serious adverse events (number) indicating that trials with lower precision favoured antibiotics without matching trials with lower precision which showed no effect or favouring control.

Funnel plot of adverse events (number) indicating that trials with lower precision favoured antibiotics while trials with greater precision favoured control.

Network plot showing the treatment comparisons that included short‐term mortality. The circles represent treatments while the lines represent the comparisons between the treatments.
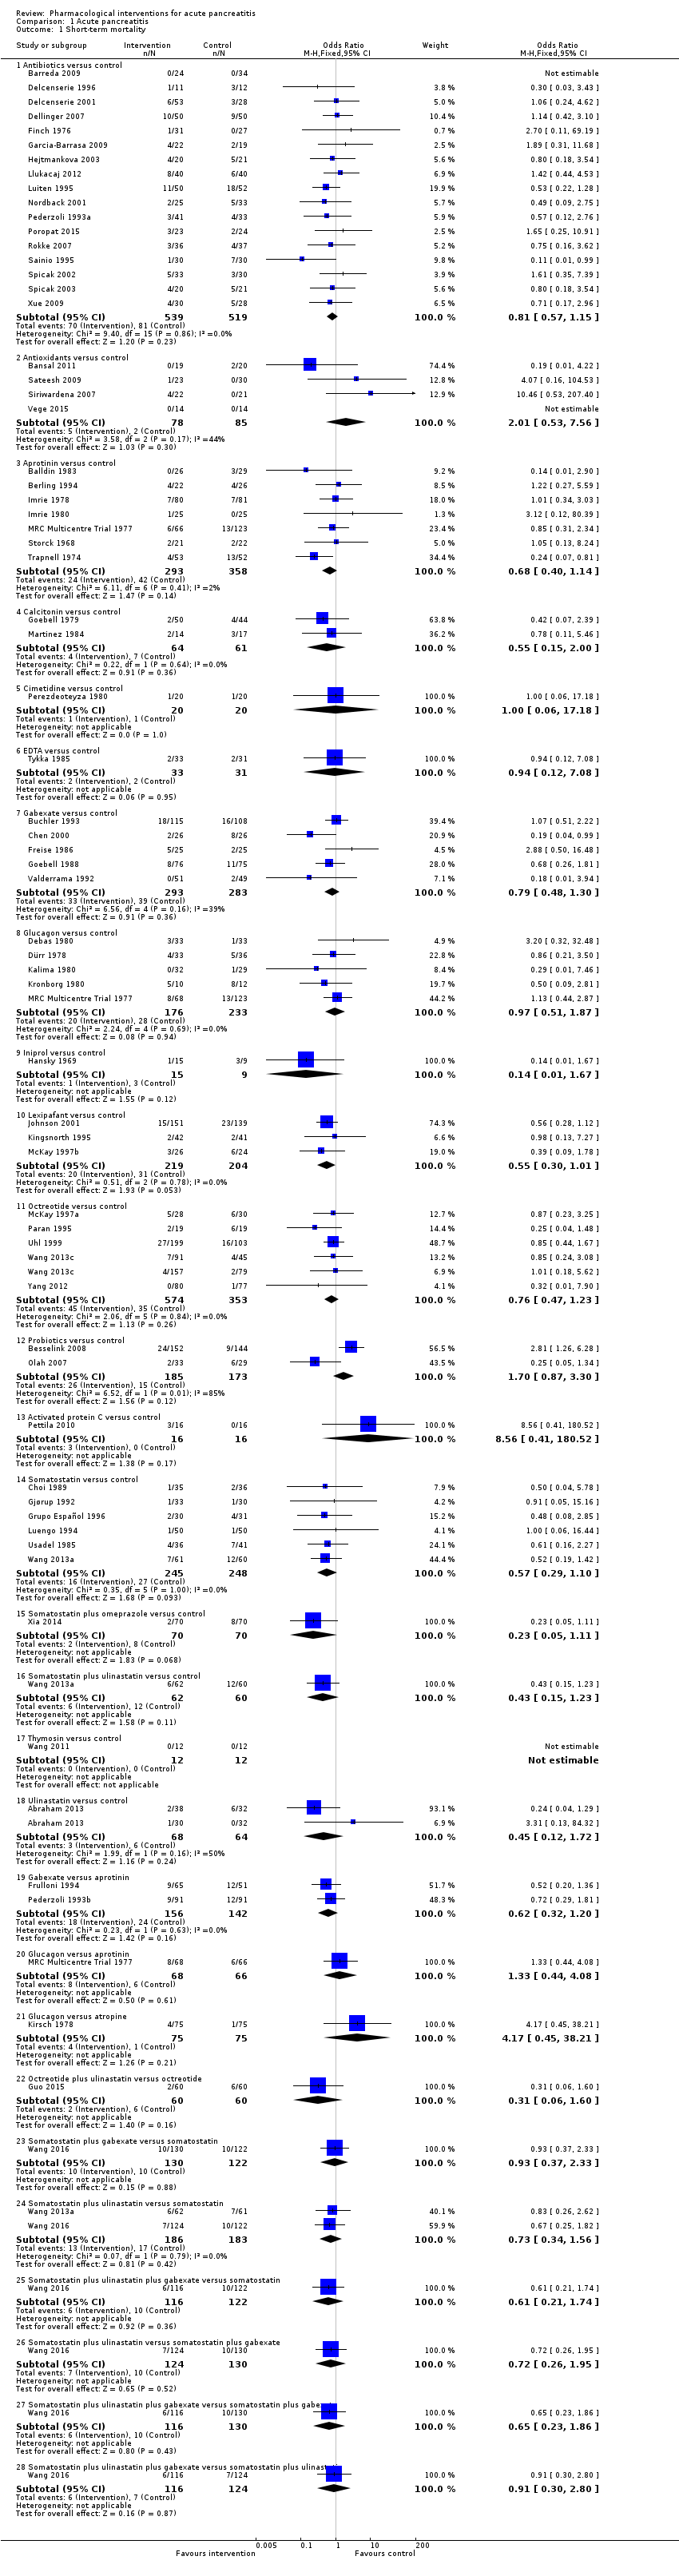
Comparison 1 Acute pancreatitis, Outcome 1 Short‐term mortality.
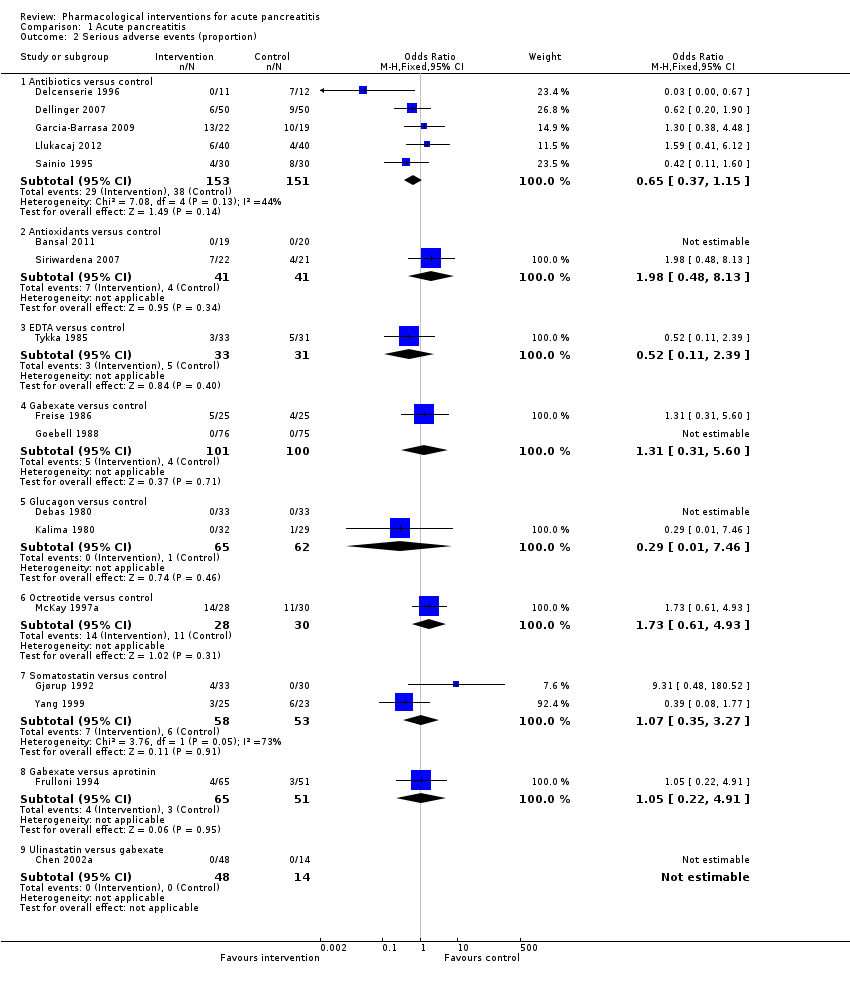
Comparison 1 Acute pancreatitis, Outcome 2 Serious adverse events (proportion).

Comparison 1 Acute pancreatitis, Outcome 3 Serious adverse events (number).

Comparison 1 Acute pancreatitis, Outcome 4 Organ failure.
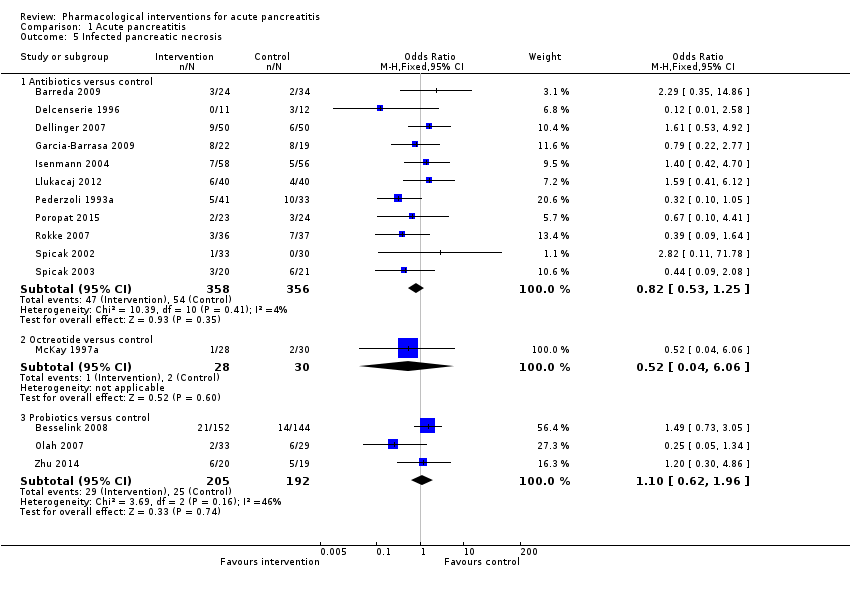
Comparison 1 Acute pancreatitis, Outcome 5 Infected pancreatic necrosis.

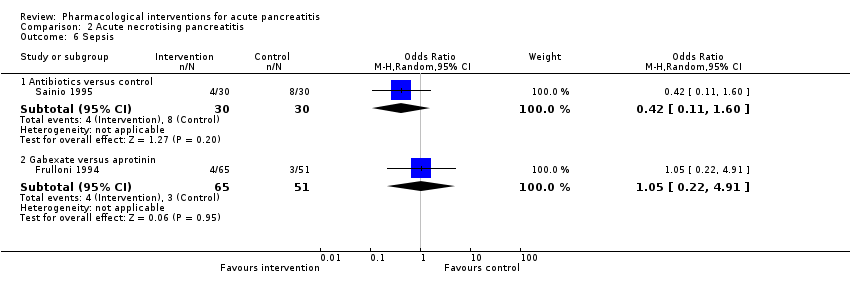
Comparison 1 Acute pancreatitis, Outcome 6 Sepsis.
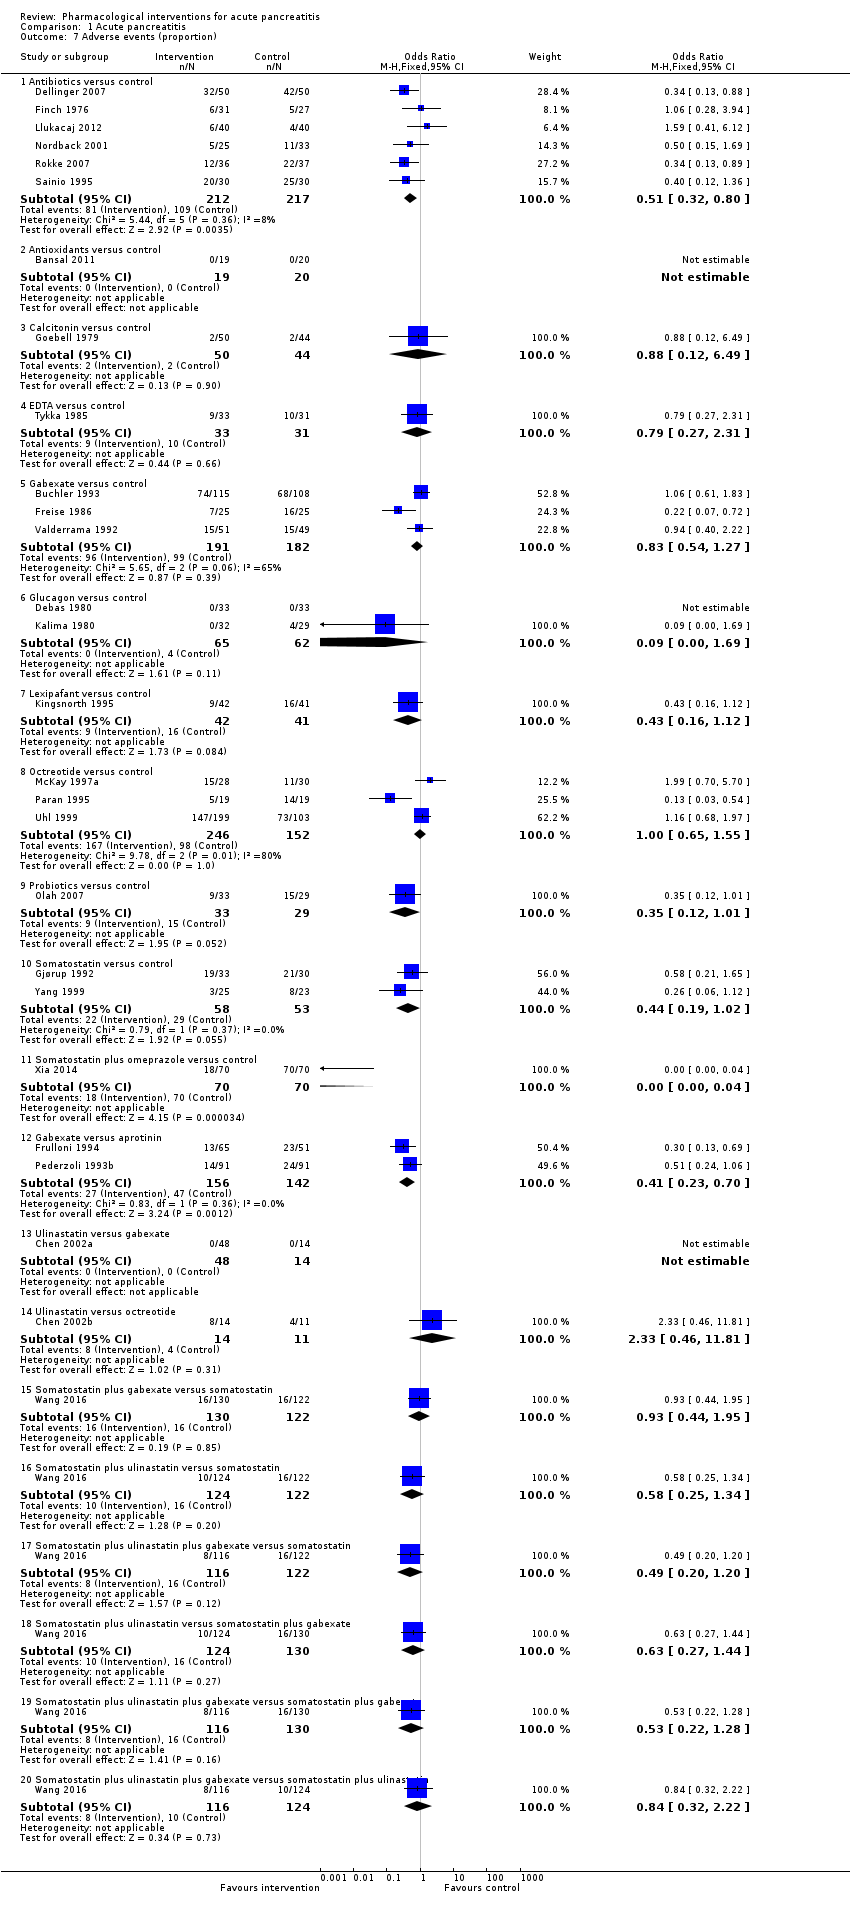
Comparison 1 Acute pancreatitis, Outcome 7 Adverse events (proportion).

Comparison 1 Acute pancreatitis, Outcome 8 Adverse events (number).

Comparison 1 Acute pancreatitis, Outcome 9 Requirement for additional invasive intervention.
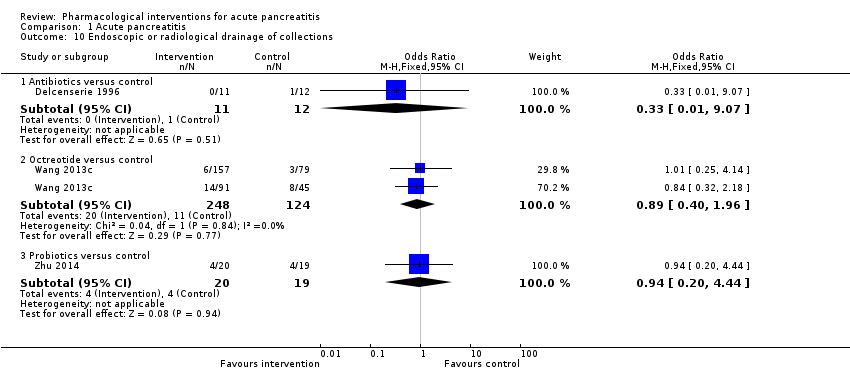
Comparison 1 Acute pancreatitis, Outcome 10 Endoscopic or radiological drainage of collections.
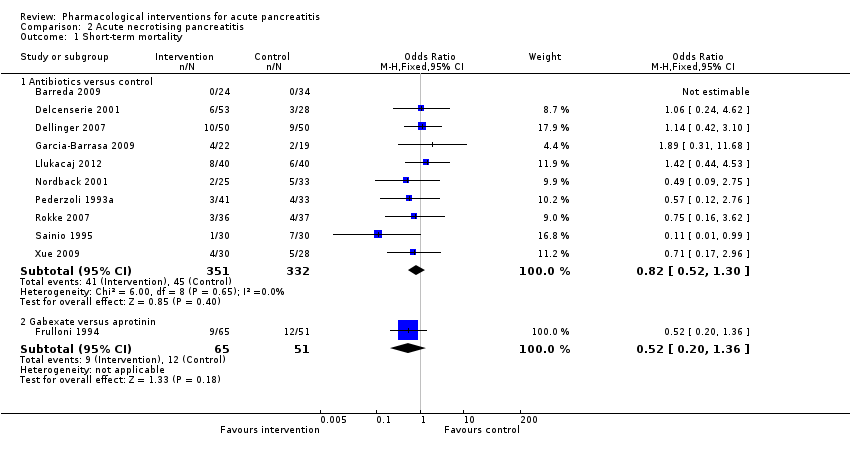
Comparison 2 Acute necrotising pancreatitis, Outcome 1 Short‐term mortality.

Comparison 2 Acute necrotising pancreatitis, Outcome 2 Serious adverse events (proportion).

Comparison 2 Acute necrotising pancreatitis, Outcome 3 Serious adverse events (number).

Comparison 2 Acute necrotising pancreatitis, Outcome 4 Organ failure.

Comparison 2 Acute necrotising pancreatitis, Outcome 5 Infected pancreatic necrosis.
Comparison 2 Acute necrotising pancreatitis, Outcome 6 Sepsis.
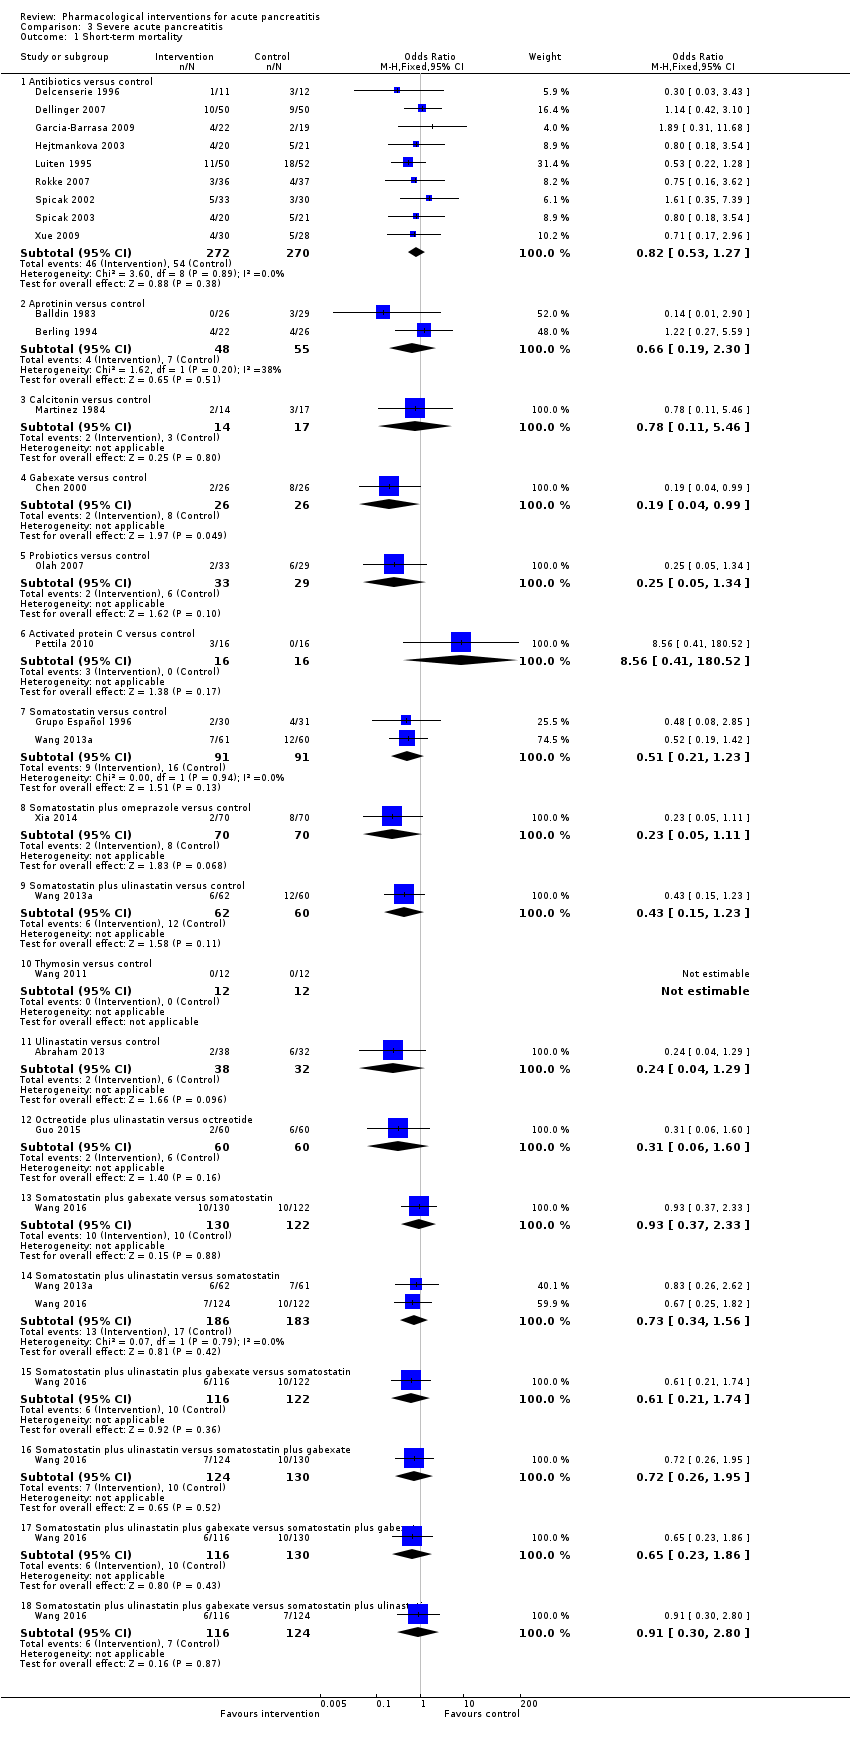
Comparison 3 Severe acute pancreatitis, Outcome 1 Short‐term mortality.
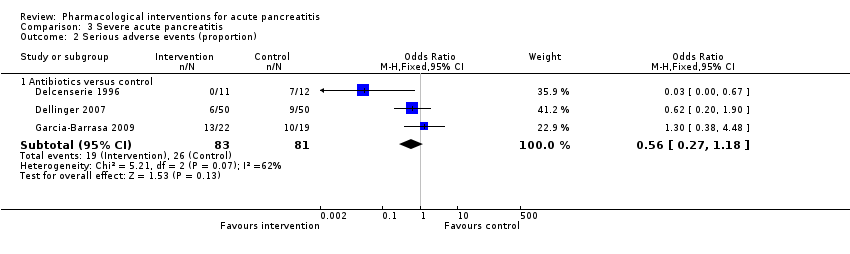
Comparison 3 Severe acute pancreatitis, Outcome 2 Serious adverse events (proportion).
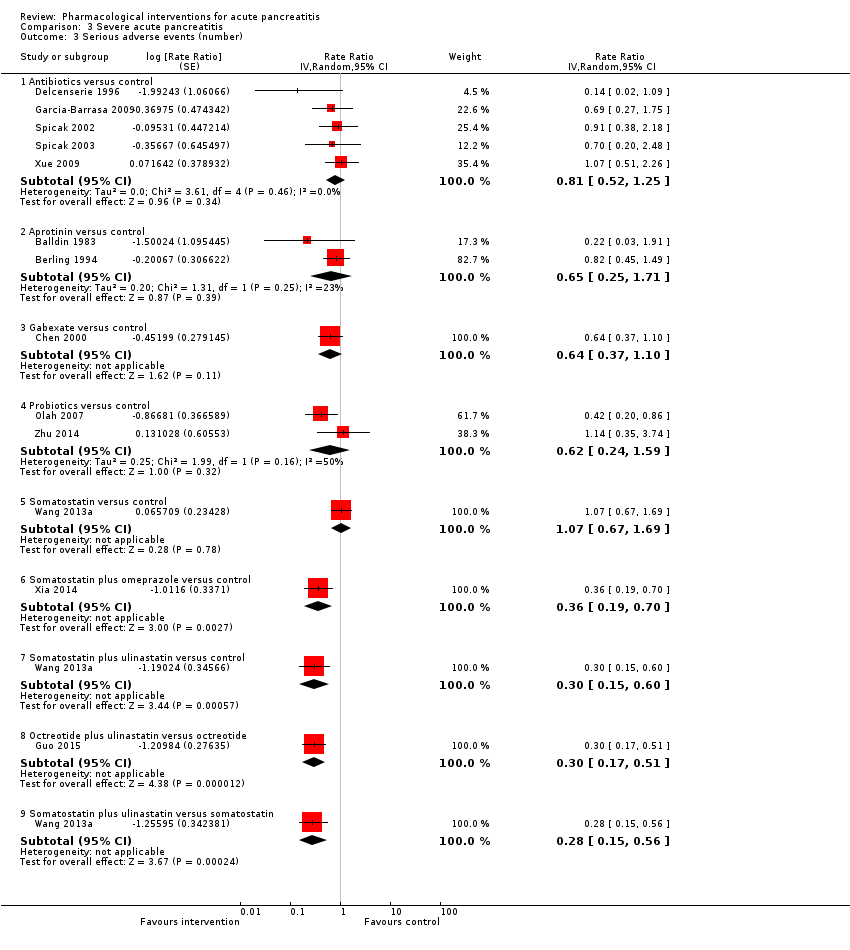
Comparison 3 Severe acute pancreatitis, Outcome 3 Serious adverse events (number).

Comparison 3 Severe acute pancreatitis, Outcome 4 Organ failure.

Comparison 3 Severe acute pancreatitis, Outcome 5 Infected pancreatic necrosis.
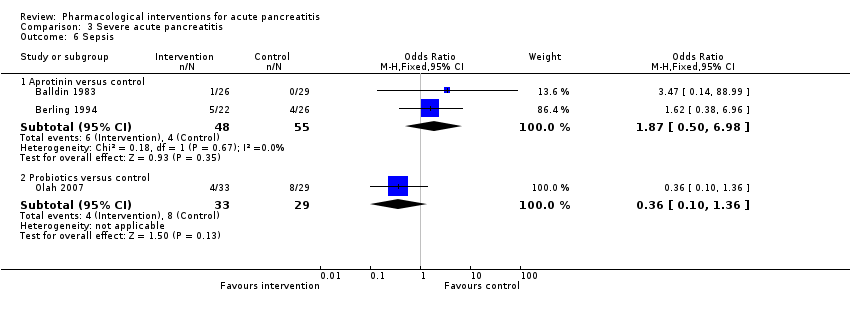
Comparison 3 Severe acute pancreatitis, Outcome 6 Sepsis.
| Pharmacological interventions for treatment of acute severe pancreatitis (mortality) | |||||
| Patient or population: people with acute pancreatitis | |||||
| Outcomes | Illustrative comparative risks* (95% CI) | Relative effect | No of participants | Quality of the evidence | |
| Assumed risk Inactive control | Corresponding risk Various treatments | ||||
| Short‐term mortality Follow‐up: up to 3 months | Antibiotics | OR 0.81 | 1058 | ⊕⊝⊝⊝ | |
| 120 per 1000 | 99 per 1000 | ||||
| Antioxidants | OR 2.01 | 163 | ⊕⊝⊝⊝ | ||
| 120 per 1000 | 215 per 1000 | ||||
| Aprotinin | OR 0.68 | 651 | ⊕⊝⊝⊝ | ||
| 120 per 1000 | 85 per 1000 | ||||
| Calcitonin | OR 0.55 | 125 | ⊕⊝⊝⊝ | ||
| 120 per 1000 | 69 per 1000 | ||||
| Cimetidine | OR 1.00 | 40 | ⊕⊝⊝⊝ | ||
| 120 per 1000 | 120 per 1000 | ||||
| EDTA | OR 0.94 | 64 | ⊕⊝⊝⊝ | ||
| 120 per 1000 | 113 per 1000 | ||||
| Gabexate | OR 0.79 | 576 | ⊕⊝⊝⊝ | ||
| 120 per 1000 | 98 per 1000 | ||||
| Glucagon | OR 0.97 | 409 | ⊕⊝⊝⊝ | ||
| 120 per 1000 | 117 per 1000 | ||||
| Iniprol | OR 0.14 | 24 | ⊕⊝⊝⊝ | ||
| 120 per 1000 | 19 per 1000 | ||||
| Lexipafant | OR 0.55 | 423 | ⊕⊝⊝⊝ | ||
| 120 per 1000 | 70 per 1000 | ||||
| Octreotide | OR 0.76 | 927 | ⊕⊝⊝⊝ | ||
| 120 per 1000 | 94 per 1000 | ||||
| Probiotics | OR 1.70 | 358 | ⊕⊝⊝⊝ | ||
| 120 per 1000 | 188 per 1000 | ||||
| Activated protein C | OR 8.56 | 32 | ⊕⊝⊝⊝ | ||
| 120 per 1000 | 539 per 1000 | ||||
| Somatostatin | OR 0.57 | 493 | ⊕⊝⊝⊝ | ||
| 120 per 1000 | 72 per 1000 | ||||
| Somatostatin plus omeprazole | OR 0.23 | 140 | ⊕⊝⊝⊝ | ||
| 120 per 1000 | 30 per 1000 | ||||
| Somatostatin plus ulinastatin | OR 0.43 | 122 | ⊕⊝⊝⊝ | ||
| 120 per 1000 | 55 per 1000 | ||||
| Thymosin | Not estimable | 24 | ⊕⊝⊝⊝ | ||
| 120 per 1000 | not estimable | ||||
| Ulinastatin | OR 0.45 | 132 | ⊕⊝⊝⊝ | ||
| 120 per 1000 | 58 per 1000 | ||||
| Long‐term mortality | None of the trials with inactive treatment in the control group reported long‐term mortality. | ||||
| *The basis for the assumed risk is the average control group proportion across all comparisons. The corresponding risk (and its 95% confidence interval) is based on the assumed risk in the comparison group and the relative effect of the intervention (and its 95% CI). CI: confidence intervals; OR: odds ratio; EDTA: ethylenediaminetetraacetic acid. | |||||
| GRADE Working Group grades of evidence | |||||
| aRisk of bias: downgraded by one level. | |||||
| Pharmacological interventions for treatment of acute severe pancreatitis (other outcomes) | |||||
| Patient or population: people with acute pancreatitis | |||||
| Outcomes | Illustrative comparative risks* (95% CI) | Relative effect | No of participants | Quality of the evidence | |
| Assumed risk | Corresponding risk | ||||
| Inactive control | Various treatments | ||||
| Serious adverse events (proportion) Follow‐up: up to 3 months | Antibiotics | OR 0.65 | 304 | ⊕⊝⊝⊝ | |
| 147 per 1000 | 101 per 1000 | ||||
| Antioxidants | OR 1.98 | 82 | ⊕⊝⊝⊝ | ||
| 147 per 1000 | 255 per 1000 | ||||
| EDTA | OR 0.52 | 64 | ⊕⊝⊝⊝ | ||
| 147 per 1000 | 83 per 1000 | ||||
| Gabexate | OR 1.31 | 201 | ⊕⊝⊝⊝ | ||
| 147 per 1000 | 185 per 1000 | ||||
| Glucagon | OR 0.29 | 127 | ⊕⊝⊝⊝ | ||
| 147 per 1000 | 48 per 1000 | ||||
| Octreotide | OR 1.73 | 58 | ⊕⊝⊝⊝ | ||
| 147 per 1000 | 230 per 1000 | ||||
| Somatostatin | OR 1.07 | 111 | ⊕⊝⊝⊝ | ||
| 147 per 1000 | 156 per 1000 | ||||
| Serious adverse events (number) Follow‐up: up to 3 months | Antibiotics | Rate ratio0.86 | 716 | ⊕⊝⊝⊝ | |
| 437 per 1000 | 374 per 1000 | ||||
| Antioxidants | Rate ratio0.22 | 71 | ⊕⊝⊝⊝ | ||
| 437 per 1000 | 94 per 1000 | ||||
| Aprotinin | Rate ratio0.79 | 264 | ⊕⊝⊝⊝ | ||
| 437 per 1000 | 345 per 1000 | ||||
| Cimetidine | Rate ratio1.00 | 60 | ⊕⊝⊝⊝ | ||
| 437 per 1000 | 437 per 1000 | ||||
| EDTA | Rate ratio0.94 | 64 | ⊕⊝⊝⊝ | ||
| 437 per 1000 | 411 per 1000 | ||||
| Gabexate | Rate ratio0.86 | 375 | ⊕⊝⊝⊝ | ||
| 437 per 1000 | 375 per 1000 | ||||
| Glucagon | Rate ratio1.00 | 68 | ⊕⊝⊝⊝ | ||
| 437 per 1000 | 437 per 1000 | ||||
| Lexipafant | rate ratio0.67 | 290 | ⊕⊝⊝⊝ | ||
| 437 per 1000 | 292 per 1000 | ||||
| Octreotide | Rate ratio0.74 | 770 | ⊕⊝⊝⊝ | ||
| 437 per 1000 | 321 per 1000 | ||||
| Probiotics | Rate ratio0.94 | 397 | ⊕⊝⊝⊝ | ||
| 437 per 1000 | 412 per 1000 | ||||
| Somatostatin | Rate ratio1.03 | 257 | ⊕⊝⊝⊝ | ||
| 437 per 1000 | 449 per 1000 | ||||
| Somatostatin plus omeprazole | Rate ratio0.36 | 140 | ⊕⊕⊝⊝ | ||
| 437 per 1000 | 159 per 1000 | ||||
| Somatostatin plus ulinastatin | Rate ratio0.30 | 122 | ⊕⊕⊝⊝ | ||
| 437 per 1000 | 133 per 1000 | ||||
| Organ failure Follow‐up: up to 3 months | Antibiotics | OR 0.78 | 258 | ⊕⊝⊝⊝ | |
| 289 per 1000 | 241 per 1000 | ||||
| Antioxidants | OR 0.92 | 163 | ⊕⊝⊝⊝ | ||
| 289 per 1000 | 271 per 1000 | ||||
| Gabexate | OR 0.32 | 50 | ⊕⊝⊝⊝ | ||
| 289 per 1000 | 115 per 1000 | ||||
| Lexipafant | OR 0.68 | 340 | ⊕⊝⊝⊝ | ||
| 289 per 1000 | 216 per 1000 | ||||
| Octreotide | OR 0.51 | 430 | ⊕⊝⊝⊝ | ||
| 289 per 1000 | 173 per 1000 | ||||
| Probiotics | OR 0.80 | 358 | ⊕⊝⊝⊝ | ||
| 289 per 1000 | 246 per 1000 | ||||
| Ulinastatin | OR 0.27 | 129 | ⊕⊝⊝⊝ | ||
| 289 per 1000 | 100 per 1000 | ||||
| Infected pancreatic necrosis Follow‐up: up to 3 months | Antibiotics | OR 0.82 | 714 | ⊕⊝⊝⊝ | |
| 140 per 1000 | 118 per 1000 | ||||
| Octreotide | OR 0.52 | 58 | ⊕⊝⊝⊝ | ||
| 140 per 1000 | 78 per 1000 | ||||
| Probiotics | OR 1.10 | 397 | ⊕⊝⊝⊝ | ||
| 140 per 1000 | 152 per 1000 | ||||
| Sepsis Follow‐up: up to 3 months | Antibiotics | OR 0.42 | 60 | ⊕⊝⊝⊝ | |
| 122 per 1000 | 56 per 1000 | ||||
| Aprotinin | OR 1.84 | 103 | ⊕⊝⊝⊝ | ||
| 122 per 1000 | 204 per 1000 | ||||
| Gabexate | OR 1.10 | 373 | ⊕⊝⊝⊝ | ||
| 122 per 1000 | 133 per 1000 | ||||
| Lexipafant | OR 0.26 | 290 | ⊕⊝⊝⊝ | ||
| 122 per 1000 | 35 per 1000 | ||||
| Octreotide | OR 0.40 | 340 | ⊕⊝⊝⊝ | ||
| 122 per 1000 | 53 per 1000 | ||||
| Probiotics | OR 0.36 | 62 | ⊕⊝⊝⊝ | ||
| 122 per 1000 | 48 per 1000 | ||||
| Health‐related quality of life | None of the trials reported this outcome. | ||||
| *The basis for the assumed risk is the average control group proportion across all comparisons. The corresponding risk (and its 95% confidence interval) is based on the assumed risk in the comparison group and the relative effect of the intervention (and its 95% CI). CI: confidence intervals; OR = odds ratio; EDTA = ethylenediaminetetraacetic acid. | |||||
| GRADE Working Group grades of evidence | |||||
| aRisk of bias: downgraded by one level. | |||||
| Study name | No of participants randomised | Postrandomisation dropouts | No of participants for whom outcome was reported | Treatment 1 | Treatment 2 | Selection bias | Performance and detection bias | Attrition bias | Selective reporting bias | Other bias |
| 32 | 0 | 32 | Activated protein C | Placebo | Unclear | Low | Low | High | High | |
| 80 | 22 | 58 | Antibiotics | No active intervention | Unclear | Unclear | High | Low | Unclear | |
| 23 | 0 | 23 | Antibiotics | No active intervention | Unclear | Unclear | Low | Low | Unclear | |
| 81 | Not stated | 81 | Antibiotics | No active intervention | Unclear | Unclear | Unclear | Low | Unclear | |
| 100 | 0 | 100 | Antibiotics | Placebo | Low | Low | Low | Low | High | |
| 62 | 4 | 58 | Antibiotics | No active intervention | Unclear | Unclear | High | Low | Unclear | |
| 46 | 5 | 41 | Antibiotics | Placebo | Unclear | Low | High | Low | Low | |
| 41 | Not stated | 41 | Antibiotics | No active intervention | Unclear | Unclear | Unclear | Low | Unclear | |
| 119 | 5 | 114 | Antibiotics | Placebo | Unclear | Low | High | High | High | |
| 80 | Not stated | 80 | Antibiotics | Placebo | Unclear | Low | Unclear | High | Unclear | |
| 109 | 7 | 102 | Antibiotics | No active intervention | Unclear | Unclear | High | Low | Unclear | |
| 90 | 32 | 58 | Antibiotics | Placebo | Unclear | Unclear | High | Low | Unclear | |
| 47 | 0 | 47 | Antibiotics | No active intervention | Unclear | Unclear | Low | Low | Unclear | |
| 74 | Not stated | 74 | Antibiotics | No active intervention | Unclear | Unclear | Low | Low | Unclear | |
| 73 | 0 | 73 | Antibiotics | No active intervention | Unclear | High | Low | Low | High | |
| 60 | 0 | 60 | Antibiotics | No active intervention | Unclear | Unclear | Low | Low | Unclear | |
| 63 | Not stated | 63 | Antibiotics | No active intervention | Unclear | Unclear | Unclear | Low | Unclear | |
| 41 | Not stated | 41 | Antibiotics | No active intervention | Unclear | Unclear | Unclear | Low | Unclear | |
| 59 | 3 | 56 | Antibiotics | No active intervention | Unclear | Unclear | High | Low | Low | |
| 44 | 5 | 39 | Antioxidants | No active intervention | Unclear | High | High | Low | Low | |
| 20 | Not stated | 20 | Antioxidants | No active intervention | Unclear | Unclear | Unclear | High | Unclear | |
| 73 | 0 | 73 | Antioxidants | Placebo | Unclear | Unclear | Low | High | Unclear | |
| 56 | 3 | 53 | Antioxidants | No active intervention | Unclear | High | High | Low | Unclear | |
| 43 | 0 | 43 | Antioxidants | Placebo | Low | Low | Low | Low | High | |
| 28 | Not stated | 28 | Antioxidants | Placebo | Unclear | Low | Low | Low | Unclear | |
| 34 | Not stated | 34 | Antioxidants plus Corticosteroids | No active intervention | Unclear | Unclear | Unclear | High | Unclear | |
| (this is a 3‐armed trial; the numbers stated included all 3 arms) | 264 | 7 | 257 | Aprotinin | Placebo | Unclear | Low | High | High | High |
| 55 | Not stated | 55 | Aprotinin | No active intervention | Unclear | Unclear | Unclear | Low | High | |
| 48 | Not stated | 48 | Aprotinin | No active intervention | Unclear | Low | Low | Low | High | |
| 161 | Not stated | 161 | Aprotinin | Placebo | Unclear | Low | Unclear | Low | High | |
| 50 | Not stated | 50 | Aprotinin | Placebo | Unclear | Low | Unclear | High | Unclear | |
| 43 | Not stated | 43 | Aprotinin | Placebo | Unclear | Low | Unclear | High | Unclear | |
| 105 | Not stated | 105 | Aprotinin | Placebo | Low | Low | Unclear | High | High | |
| (this is a 3‐armed trial; the numbers stated included all 3 arms) | 264 | 7 | 257 | Aprotinin | Glucagon | Unclear | Low | High | High | High |
| 94 | Not stated | 94 | Calcitonin | Placebo | Unclear | Low | Unclear | Low | Unclear | |
| 31 | 0 | 31 | Calcitonin | Placebo | Unclear | Unclear | Low | High | Unclear | |
| 40 | Not stated | 40 | Cimetidine | Placebo | Unclear | Low | Unclear | High | Unclear | |
| 60 | Not stated | 60 | Cimetidine | Placebo | Low | Unclear | Unclear | High | Unclear | |
| 64 | 0 | 64 | EDTA | Placebo | Unclear | Low | Low | Low | High | |
| 116 | Not stated | 116 | Gabexate | Aprotinin | Unclear | Unclear | Unclear | Low | Unclear | |
| 199 | 17 | 182 | Gabexate | Aprotinin | Unclear | Low | High | Low | Unclear | |
| 223 | Not stated | 223 | Gabexate | Placebo | Low | Low | Low | Low | Unclear | |
| 52 | Not stated | 52 | Gabexate | Placebo | Unclear | Unclear | Unclear | Low | Unclear | |
| 50 | Not stated | 50 | Gabexate | Placebo | Unclear | Low | Unclear | Low | Unclear | |
| 162 | 11 | 151 | Gabexate | Placebo | Unclear | Low | High | Low | Unclear | |
| 105 | 5 | 100 | Gabexate | Placebo | Low | Low | High | Low | High | |
| 150 | Not stated | 150 | Glucagon | Atropine | Unclear | Unclear | Unclear | Low | Unclear | |
| (this is a 3‐armed trial; the numbers stated included all 3 arms) | 264 | 7 | 257 | Glucagon | Placebo | Unclear | Unclear | Unclear | Low | High |
| 66 | Not stated | 66 | Glucagon | Placebo | Unclear | Low | Unclear | Low | Unclear | |
| 69 | Not stated | 69 | Glucagon | Placebo | Unclear | Low | Unclear | High | Unclear | |
| 80 | 9 | 71 | Glucagon | Placebo | Unclear | Unclear | High | Low | Unclear | |
| 22 | Not stated | 22 | Glucagon | Placebo | Unclear | Low | Unclear | High | Unclear | |
| 62 | Not stated | 62 | Glucagon | Oxyphenonium | Unclear | Low | Unclear | Low | Unclear | |
| 24 | Not stated | 24 | Iniprol | No active intervention | Unclear | High | Unclear | High | High | |
| 291 | 1 | 290 | Lexipafant | Placebo | Unclear | Low | High | Low | High | |
| 83 | Not stated | 83 | Lexipafant | Placebo | Unclear | Low | Unclear | High | High | |
| 51 | 1 | 50 | Lexipafant | Placebo | Unclear | Low | High | High | High | |
| 66 | 9 | 57 | NSAID | Placebo | Unclear | Unclear | Unclear | High | Unclear | |
| 30 | 0 | 30 | NSAID | Placebo | Unclear | Low | Low | High | High | |
| 58 | 0 | 58 | Octreotide | Placebo | Low | Low | Low | Low | Unclear | |
| 180 | Not stated | 180 | Octreotide | Placebo | Unclear | Unclear | Unclear | High | Unclear | |
| 51 | 13 | 38 | Octreotide | No active intervention | Unclear | High | High | Low | Unclear | |
| 302 | 0 | 302 | Octreotide | Placebo | Unclear | Low | Low | Low | High | |
| 372 | Not stated | 372 | Octreotide | No active intervention | Unclear | Unclear | High | Low | Low | |
| 163 | 6 | 157 | Octreotide | No active intervention | Unclear | Unclear | High | High | Low | |
| 354 | Not stated | 354 | Octreotide plus NSAID | Octreotide | Unclear | Unclear | Unclear | High | Unclear | |
| 120 | Not stated | 120 | Octreotide plus ulinastatin | Octreotide | Unclear | Unclear | Unclear | Low | Unclear | |
| 298 | 2 | 296 | Probiotics | Placebo | Low | Low | High | Low | High | |
| 83 | 21 | 62 | Probiotics | No active intervention | Unclear | Low | High | High | Unclear | |
| 90 | Not stated | 58 | Probiotics | No active intervention | Unclear | Low | Unclear | High | Unclear | |
| 50 | 0 | 50 | Probiotics | Placebo | Unclear | Low | Low | High | High | |
| 39 | Not stated | 39 | Probiotics | Placebo | Unclear | Low | Unclear | High | Unclear | |
| 70 | 9 | 61 | Somatostatin | Placebo | Unclear | Low | High | High | Unclear | |
| 71 | Not stated | 71 | Somatostatin | No active intervention | Unclear | Unclear | Unclear | Low | Unclear | |
| 63 | Not stated | 63 | Somatostatin | Placebo | Unclear | Low | Unclear | Low | Unclear | |
| 100 | Not stated | 100 | Somatostatin | No active intervention | Unclear | Low | Unclear | High | Unclear | |
| 87 | 3 | 84 | Somatostatin | Placebo | Unclear | Low | Unclear | High | High | |
| 77 | Not stated | 77 | Somatostatin | Placebo | Unclear | Low | Unclear | High | Unclear | |
| Wang 2013a (this is a 3‐armed trial; the numbers stated included all 3 arms) | 183 | Not stated | 183 | Somatostatin | No active intervention | Unclear | Low | Unclear | Low | Low |
| 48 | Not stated | 48 | Somatostatin | No active intervention | Unclear | Unclear | Unclear | High | Unclear | |
| 140 | Not stated | 140 | Somatostatin plus omeprazole | No active intervention | Unclear | Unclear | Unclear | Low | Unclear | |
| Wang 2013a (this is a 3‐armed trial; the numbers stated included all 3 arms) | 183 | Not stated | 183 | Somatostatin plus ulinastatin | Placebo | Unclear | Unclear | Unclear | High | Unclear |
| Wang 2013a (this is a 3‐armed trial; the numbers stated included all 3 arms) | 183 | Not stated | 183 | Somatostatin plus ulinastatin | Somatostatin | Unclear | Low | Unclear | Low | Low |
| Wang 2016 (this is a 4‐armed trial; the numbers stated included all 4 arms) | 492 | 0 | 492 | Somatostatin plus ulinastatin | Somatostatin | Low | Low | Low | Low | Low |
| Wang 2016 (this is a 4‐armed trial; the numbers stated included all 4 arms) | 492 | 0 | 492 | Somatostatin plus gabexate | Somatostatin | Low | Low | Low | Low | Low |
| Wang 2016 (this is a 4‐armed trial; the numbers stated included all 4 arms) | 492 | 0 | 492 | Somatostatin plus ulinastatin plus gabexate | Somatostatin | Low | Low | Low | Low | Low |
| Wang 2016 (this is a 4‐armed trial; the numbers stated included all 4 arms) | 492 | 0 | 492 | Somatostatin plus ulinastatin | Somatostatin plus gabexate | Low | Low | Low | Low | Low |
| Wang 2016 (this is a 4‐armed trial; the numbers stated included all 4 arms) | 492 | 0 | 492 | Somatostatin plus ulinastatin plus gabexate | Somatostatin plus gabexate | Low | Low | Low | Low | Low |
| Wang 2016 (this is a 4‐armed trial; the numbers stated included all 4 arms) | 492 | 0 | 492 | Somatostatin plus ulinastatin plus gabexate | Somatostatin plus ulinastatin | Low | Low | Low | Low | Low |
| 24 | Not stated | 24 | Thymosin | Placebo | Unclear | Low | Unclear | High | Unclear | |
| 135 | 6 | 129 | Ulinastatin | Placebo | Unclear | Low | High | Low | Unclear | |
| 68 | 6 | 62 | Ulinastatin | Gabexate | Unclear | Unclear | High | High | Unclear | |
| 26 | 1 | 25 | Ulinastatin | Octreotide | Unclear | Unclear | High | High | Unclear |
| Study name | Treatment 1 | Treatment 2 | Severe pancreatitis | Necrotising pancreatitis | Organ failure | Infection |
| Activated protein C | Placebo | yes | not stated | not stated | not stated | |
| Antibiotics | No active intervention | not stated | yes | not stated | not stated | |
| Antibiotics | No active intervention | yes | not stated | not stated | not stated | |
| Antibiotics | No active intervention | not stated | yes | not stated | not stated | |
| Antibiotics | Placebo | yes | yes | not stated | no | |
| Antibiotics | No active intervention | not stated | not stated | not stated | not stated | |
| Antibiotics | Placebo | yes | yes | not stated | not stated | |
| Antibiotics | No active intervention | yes | not stated | not stated | not stated | |
| Antibiotics | Placebo | not stated | not stated | not stated | not stated | |
| Antibiotics | Placebo | not stated | yes | not stated | no | |
| Antibiotics | No active intervention | yes | not stated | not stated | no | |
| Antibiotics | Placebo | not stated | yes | no | not stated | |
| Antibiotics | No active intervention | not stated | yes | not stated | not stated | |
| Antibiotics | No active intervention | yes | yes | not stated | not stated | |
| Antibiotics | No active intervention | not stated | yes | not stated | not stated | |
| Antibiotics | No active intervention | yes | not stated | not stated | not stated | |
| Antibiotics | No active intervention | yes | not stated | not stated | not stated | |
| Antibiotics | No active intervention | yes | yes | not stated | no | |
| Antioxidants | No active intervention | not stated | not stated | not stated | not stated | |
| Antioxidants | No active intervention | yes | not stated | not stated | not stated | |
| Antioxidants | Placebo | not stated | not stated | not stated | not stated | |
| Antioxidants | No active intervention | not stated | not stated | not stated | not stated | |
| Antioxidants | Placebo | not stated | not stated | not stated | not stated | |
| Antioxidants | Placebo | not stated | not stated | not stated | not stated | |
| Antioxidants plus corticosteroids | No active intervention | yes | not stated | not stated | not stated | |
| Aprotinin | No active intervention | yes | not stated | not stated | not stated | |
| Aprotinin | No active intervention | yes | not stated | not stated | not stated | |
| Aprotinin | Placebo | not stated | not stated | not stated | not stated | |
| Aprotinin | Placebo | not stated | not stated | not stated | not stated | |
| Aprotinin | Placebo | not stated | not stated | not stated | not stated | |
| Aprotinin | Placebo | not stated | not stated | not stated | not stated | |
| Aprotinin | Placebo | not stated | not stated | not stated | not stated | |
| Calcitonin | Placebo | not stated | not stated | not stated | not stated | |
| Calcitonin | Placebo | yes | not stated | not stated | not stated | |
| Cimetidine | Placebo | not stated | not stated | not stated | not stated | |
| Cimetidine | Placebo | not stated | not stated | not stated | not stated | |
| EDTA | Placebo | not stated | not stated | not stated | not stated | |
| Gabexate | Placebo | not stated | not stated | not stated | not stated | |
| Gabexate | Placebo | yes | not stated | yes | not stated | |
| Gabexate | Placebo | not stated | not stated | not stated | not stated | |
| Gabexate | Placebo | not stated | not stated | not stated | not stated | |
| Gabexate | Placebo | not stated | not stated | not stated | not stated | |
| Glucagon | Placebo | not stated | not stated | not stated | not stated | |
| Glucagon | Placebo | not stated | not stated | not stated | not stated | |
| Glucagon | Placebo | not stated | not stated | not stated | not stated | |
| Glucagon | Placebo | not stated | not stated | not stated | not stated | |
| Glucagon | Placebo | not stated | not stated | not stated | not stated | |
| Iniprol | No active intervention | not stated | not stated | not stated | not stated | |
| Lexipafant | Placebo | not stated | not stated | not stated | not stated | |
| Lexipafant | Placebo | not stated | not stated | not stated | not stated | |
| Lexipafant | Placebo | not stated | not stated | not stated | not stated | |
| NSAID | Placebo | not stated | not stated | not stated | not stated | |
| NSAID | Placebo | not stated | not stated | not stated | not stated | |
| Octreotide | Placebo | not stated | not stated | not stated | not stated | |
| Octreotide | Placebo | not stated | not stated | not stated | not stated | |
| Octreotide | No active intervention | not stated | not stated | not stated | not stated | |
| Octreotide | Placebo | not stated | not stated | not stated | not stated | |
| Wang 2013c (mild pancreatitis) | Octreotide | No active intervention | no | not stated | not stated | not stated |
| Wang 2013c (severe pancreatitis) | Octreotide | No active intervention | yes | not stated | not stated | not stated |
| Octreotide | No active intervention | no | not stated | not stated | not stated | |
| Probiotics | Placebo | not stated | not stated | not stated | not stated | |
| Probiotics | No active intervention | yes | not stated | not stated | not stated | |
| Probiotics | No active intervention | yes | not stated | not stated | not stated | |
| Probiotics | Placebo | not stated | not stated | not stated | not stated | |
| Probiotics | Placebo | yes | not stated | not stated | not stated | |
| Somatostatin | No active intervention | not stated | not stated | not stated | not stated | |
| Somatostatin | Placebo | not stated | not stated | not stated | not stated | |
| Somatostatin | Placebo | yes | not stated | not stated | not stated | |
| Somatostatin | No active intervention | not stated | not stated | not stated | not stated | |
| Somatostatin | Placebo | not stated | not stated | not stated | not stated | |
| Somatostatin | Placebo | not stated | not stated | not stated | not stated | |
| Somatostatin | No active intervention | yes | not stated | not stated | not stated | |
| Somatostatin | No active intervention | not stated | not stated | not stated | not stated | |
| Somatostatin plus omeprazole | No active intervention | yes | not stated | not stated | not stated | |
| Somatostatin plus ulinastatin | No active intervention | yes | not stated | not stated | not stated | |
| Thymosin | Placebo | yes | not stated | not stated | not stated | |
| Abraham 2013 (mild pancreatitis) | Ulinastatin | Placebo | no | not stated | not stated | no |
| Abraham 2013 (severe pancreatitis) | Ulinastatin | Placebo | yes | not stated | not stated | not stated |
| Gabexate | Aprotinin | not stated | yes | not stated | not stated | |
| Gabexate | Aprotinin | not stated | not stated | not stated | not stated | |
| Glucagon | Atropine | not stated | not stated | not stated | not stated | |
| Ulinastatin | Gabexate | no | no | no | not stated | |
| Aprotinin | Glucagon | not stated | not stated | not stated | not stated | |
| Octerotide plus ulinastatin | Octreotide | yes | not stated | not stated | not stated | |
| Octreotide plus NSAID | Octreotide | not stated | not stated | not stated | not stated | |
| Ulinastatin | Octreotide | yes | yes | not stated | not stated | |
| Glucagon | Oxyphenonium | not stated | not stated | not stated | not stated | |
| Antibiotics | No active intervention | not stated | not stated | not stated | no | |
| Somatostatin plus gabexate | Somatostatin | yes | not stated | not stated | not stated | |
| Somatostatin plus ulinastatin | Somatostatin | yes | not stated | not stated | not stated | |
| Somatostatin plus ulinastatin | Somatostatin | yes | not stated | not stated | not stated | |
| Somatostatin plus ulinastatin plus gabexate | Somatostatin | yes | not stated | not stated | not stated | |
| Somatostatin plus ulinastatin | Somatostatin plus gabexate | yes | not stated | not stated | not stated | |
| Somatostatin plus ulinastatin plus gabexate | Somatostatin plus gabexate | yes | not stated | not stated | not stated | |
| Somatostatin plus ulinastatin plus gabexate | Somatostatin plus ulinastatin | yes | not stated | not stated | not stated |
| Study name | Intervention | Comparator | Number of participants in intervention | Number of participants in control | Mean or median (standard deviation or interquartile range, if reported) hospital stay in intervention group | Mean or median (standard deviation or interquartile range, if reported) hospital stay in control group | Difference | Statistical significance (P‐value if reported) |
| Antibiotics | No active intervention | 24 | 34 | 54 | 45 | 9 | Not significant | |
| Antibiotics | No active intervention | 11 | 12 | 27.8 | 22 | 5.8 | Not significant | |
| Antibiotics | No active intervention | 31 | 27 | 10.4 | 11.3 | −0.9 | Not significant | |
| Antibiotics | Placebo | 22 | 19 | 21 | 19 | 2 | Not significant (0.80) | |
| Antibiotics | No active intervention | 20 | 21 | 18 (7.2) | 25 (14.8) | −7 | Not significant | |
| Antibiotics | Placebo | 58 | 56 | 21 | 18 | 3 | Not significant | |
| Antibiotics | No active intervention | 50 | 52 | 30 | 32 | −2 | Not significant | |
| Antibiotics | No active intervention | 36 | 37 | 18 | 22 | −4 | Not significant (0.32) | |
| Antibiotics | No active intervention | 30 | 30 | 33.2 (22.1) | 43.8 (43.1) | −10.6 | Not significant (0.24) | |
| Antibiotics | No active intervention | 33 | 30 | 18.9 (8.1) | 23.8 (19.3) | −4.9 | Not significant | |
| Antibiotics | No active intervention | 20 | 21 | 18 (7.2) | 25 (14.8) | −7 | Not significant | |
| Antibiotics | No active intervention | 29 | 27 | 28.3 | 30.7 | −2.4 | Not significant | |
| Antioxidants | No active intervention | 19 | 20 | 12.8 | 15.1 | −2.3 | Not significant | |
| Antioxidants | No active intervention | 23 | 30 | 7.2 (5) | 10.3 (7) | −3.1 | Not significant (0.07) | |
| Antioxidants | Placebo | 22 | 21 | 20.4 (24.4) | 14.3 (15.7) | 6.1 | Not significant (0.34) | |
| Antioxidants | Placebo | 14 | 14 | 3 | 5 | −2 | Not significant (0.06) | |
| Aprotinin | No active intervention | 26 | 29 | 17.3 | 16.5 | 0.8 | Not significant | |
| Aprotinin | No active intervention | 22 | 26 | 25 (15‐32) | 33 (17‐38) | −8 | Not significant (0.24) | |
| Calcitonin | Placebo | 50 | 44 | 18.3 (6.4) | 20.2 (7.5) | −1.9 | Not significant | |
| Calcitonin | Placebo | 14 | 17 | 24 (20.2) | 30 (21.7) | −6 | Not significant | |
| Gabexate | Placebo | 115 | 108 | 26 (20‐43) | 23 (28‐34) | 3 | Not significant | |
| Glucagon | Placebo | 33 | 33 | 26 (28.7) | 20 (19.2) | 6 | Not significant | |
| Glucagon | Placebo | 33 | 36 | 32.6 | 26.9 | 5.7 | Not significant | |
| Iniprol | No active intervention | 15 | 9 | 14.7 (9.3) | 18.7 (10.2) | −4 | Not significant | |
| Lexipafant | Placebo | 151 | 139 | 9 | 10 | −1 | Not significant | |
| Lexipafant | Placebo | 26 | 24 | 13.3 | 14.9 | −1.6 | Not significant | |
| NSAID | Placebo | 27 | 30 | 9 | 10 | −1 | Not significant | |
| NSAID | Placebo | 14 | 16 | 13 | 15 | −2 | Not significant | |
| Octreotide | Placebo | 28 | 30 | 10 | 10 | 0 | Not significant | |
| Octreotide | Placebo | 90 | 90 | 7.3 | 8.2 | −0.9 | Not significant | |
| Octreotide | No active intervention | 19 | 19 | 17.9 (13.2) | 34.1 (22.7) | −16.2 | Significant (0.02) | |
| Octreotide | Placebo | 199 | 103 | 21.5 | 21 | 0.5 | Not significant | |
| (mild acute pancreatitis) | Octreotide | No active intervention | 157 | 79 | 14.4 | 15.37 | −0.97 | Not significant |
| (severe acute pancreatitis) | Octreotide | No active intervention | 91 | 45 | 16 | 16 | 0 | Not significant |
| Octreotide | No active intervention | 80 | 77 | 7.4 (2) | 11.8 (4) | −4.4 | Significant | |
| Probiotics | Placebo | 152 | 144 | 28.9 (41.5) | 23.5 (25.9) | 5.4 | Not significant (0.98) | |
| Probiotics | No active intervention | 33 | 29 | 14.9 | 19.7 | −4.8 | Not significant | |
| Probiotics | Placebo | 24 | 26 | 13.23 (18.19) | 9.69 (9.69) | 3.54 | Not significant (0.76) | |
| Activated protein C | Placebo | 16 | 16 | 17.1 | 34.4 | −17.3 | Significant (P < 0.05) | |
| Somatostatin | Placebo | 33 | 30 | 12 | 10 | 2 | Not significant | |
| Somatostatin | No active intervention | 50 | 50 | 14.92 (11.46) | 20.28 (15) | −5.36 | Significant | |
| Thymosin | Placebo | 12 | 12 | 37.1 (22.7) | 60.6 (32.9) | −23.5 | Not significant (0.06) | |
| (mild acute pancreatitis) | Ulinastatin | Placebo | 30 | 32 | 7 (5‐22) | 8 (5‐15) | −1 | Not significant (0.07) |
| (severe acute pancreatitis) | Ulinastatin | Placebo | 35 | 32 | 9 (6‐22) | 10 (6‐22) | −1 | Not significant (0.21) |
| Octerotide plus ulinastatin | Octreotide | 60 | 60 | 11.8 (3.9) | 23.7 (16.3) | −11.9 | Significant | |
| Somatostatin plus ulinastatin plus gabexate | Somatostatin | 116 | 122 | 17.7 (32.1) | 31.3 (37.6) | ‐13.6 | Significant | |
| Somatostatin plus ulinastatin | Somatostatin | 124 | 122 | 22.6 (34.5) | 31.3 (37.6) | ‐8.7 | Significant | |
| Somatostatin plus gabexate | Somatostatin | 130 | 122 | 23.2 (29.6) | 31.3 (37.6) | ‐8.1 | Significant | |
| Somatostatin plus ulinastatin plus gabexate | Somatostatin plus gabexate | 116 | 130 | 17.7 (32.1) | 23.2 (29.6) | −5.5 | Significant | |
| Somatostatin plus ulinastatin | Somatostatin plus gabexate | 124 | 130 | 22.6 (34.5) | 23.2 (29.6) | −0.6 | Significant | |
| Somatostatin plus ulinastatin plus gabexate | Somatostatin plus ulinastatin | 116 | 124 | 17.7 (32.1) | 22.6 (34.5) | −4.9 | Significant | |
| NSAID: non‐steroidal anti‐inflammatory drug. | ||||||||
| Study name | Intervention | Control | Number of participants in intervention | Number of participants in control | Mean or median (standard deviation or interquartile range, if reported) intensive care stay in intervention group | Mean or median (standard deviation or interquartile range, if reported) intensive care stay in control group | Difference | Statistical significance (P‐value, reported) |
| Antibiotics | Placebo | 22 | 19 | 17 | 18 | ‐1 | Not significant (P‐value = 0.83) | |
| Antibiotics | Placebo | 58 | 56 | 8 | 6 | 2 | Not significant | |
| Antibiotics | Placebo | 25 | 33 | 8 | 8 | 0 | Not significant | |
| Antibiotics | No active intervention | 36 | 37 | 8 | 7 | 1 | Not significant (P‐value = 0.78) | |
| Antibiotics | No active intervention | 30 | 30 | 12.7 (10.7) | 23.6 (28.7) | ‐10.9 | Not significant (P‐value = 0.06) | |
| Antibiotics | No active intervention | 33 | 30 | 11.4 (5.4) | 15.9 (12) | ‐4.5 | Not significant | |
| Antioxidants | Placebo | 22 | 21 | 4 (10.3) | 0 (0) | 4 | Not significant (P‐value = 0.08) | |
| Antioxidants | Placebo | 14 | 14 | 0 | 0 | 0 | Significant (P‐value = 0.03) | |
| Aprotinin | No active intervention | 22 | 26 | 9.5 (4 ‐ 10) | 12 (3‐20) | ‐2.5 | Not significant (P‐value = 0.47) | |
| Lexipafant | Placebo | 151 | 139 | 9.5 | 11 | ‐1.5 | Not significant | |
| Probiotics | Placebo | 152 | 144 | 6.6 (17.1) | 3 (9.3) | 3.6 | Not significant (P‐value = 0.08) | |
| Probiotics | Placebo | 24 | 26 | 4.94 (9.54) | 4 (5.86) | 0.94 | Not significant (P‐value = 0.94) | |
| Thymosin | Placebo | 12 | 12 | 24.6 (19.6) | 50.5 (25.7) | ‐25.9 | Significant (P‐value = 0.01) |
| Outcome or subgroup title | No. of studies | No. of participants | Statistical method | Effect size |
| 1 Short‐term mortality Show forest plot | 67 | Odds Ratio (M‐H, Fixed, 95% CI) | Subtotals only | |
| 1.1 Antibiotics versus control | 17 | 1058 | Odds Ratio (M‐H, Fixed, 95% CI) | 0.81 [0.57, 1.15] |
| 1.2 Antioxidants versus control | 4 | 163 | Odds Ratio (M‐H, Fixed, 95% CI) | 2.01 [0.53, 7.56] |
| 1.3 Aprotinin versus control | 7 | 651 | Odds Ratio (M‐H, Fixed, 95% CI) | 0.68 [0.40, 1.14] |
| 1.4 Calcitonin versus control | 2 | 125 | Odds Ratio (M‐H, Fixed, 95% CI) | 0.55 [0.15, 2.00] |
| 1.5 Cimetidine versus control | 1 | 40 | Odds Ratio (M‐H, Fixed, 95% CI) | 1.0 [0.06, 17.18] |
| 1.6 EDTA versus control | 1 | 64 | Odds Ratio (M‐H, Fixed, 95% CI) | 0.94 [0.12, 7.08] |
| 1.7 Gabexate versus control | 5 | 576 | Odds Ratio (M‐H, Fixed, 95% CI) | 0.79 [0.48, 1.30] |
| 1.8 Glucagon versus control | 5 | 409 | Odds Ratio (M‐H, Fixed, 95% CI) | 0.97 [0.51, 1.87] |
| 1.9 Iniprol versus control | 1 | 24 | Odds Ratio (M‐H, Fixed, 95% CI) | 0.14 [0.01, 1.67] |
| 1.10 Lexipafant versus control | 3 | 423 | Odds Ratio (M‐H, Fixed, 95% CI) | 0.55 [0.30, 1.01] |
| 1.11 Octreotide versus control | 5 | 927 | Odds Ratio (M‐H, Fixed, 95% CI) | 0.76 [0.47, 1.23] |
| 1.12 Probiotics versus control | 2 | 358 | Odds Ratio (M‐H, Fixed, 95% CI) | 1.70 [0.87, 3.30] |
| 1.13 Activated protein C versus control | 1 | 32 | Odds Ratio (M‐H, Fixed, 95% CI) | 8.56 [0.41, 180.52] |
| 1.14 Somatostatin versus control | 6 | 493 | Odds Ratio (M‐H, Fixed, 95% CI) | 0.57 [0.29, 1.10] |
| 1.15 Somatostatin plus omeprazole versus control | 1 | 140 | Odds Ratio (M‐H, Fixed, 95% CI) | 0.23 [0.05, 1.11] |
| 1.16 Somatostatin plus ulinastatin versus control | 1 | 122 | Odds Ratio (M‐H, Fixed, 95% CI) | 0.43 [0.15, 1.23] |
| 1.17 Thymosin versus control | 1 | 24 | Odds Ratio (M‐H, Fixed, 95% CI) | 0.0 [0.0, 0.0] |
| 1.18 Ulinastatin versus control | 1 | 132 | Odds Ratio (M‐H, Fixed, 95% CI) | 0.45 [0.12, 1.72] |
| 1.19 Gabexate versus aprotinin | 2 | 298 | Odds Ratio (M‐H, Fixed, 95% CI) | 0.62 [0.32, 1.20] |
| 1.20 Glucagon versus aprotinin | 1 | 134 | Odds Ratio (M‐H, Fixed, 95% CI) | 1.33 [0.44, 4.08] |
| 1.21 Glucagon versus atropine | 1 | 150 | Odds Ratio (M‐H, Fixed, 95% CI) | 4.17 [0.45, 38.21] |
| 1.22 Octreotide plus ulinastatin versus octreotide | 1 | 120 | Odds Ratio (M‐H, Fixed, 95% CI) | 0.31 [0.06, 1.60] |
| 1.23 Somatostatin plus gabexate versus somatostatin | 1 | 252 | Odds Ratio (M‐H, Fixed, 95% CI) | 0.93 [0.37, 2.33] |
| 1.24 Somatostatin plus ulinastatin versus somatostatin | 2 | 369 | Odds Ratio (M‐H, Fixed, 95% CI) | 0.73 [0.34, 1.56] |
| 1.25 Somatostatin plus ulinastatin plus gabexate versus somatostatin | 1 | 238 | Odds Ratio (M‐H, Fixed, 95% CI) | 0.61 [0.21, 1.74] |
| 1.26 Somatostatin plus ulinastatin versus somatostatin plus gabexate | 1 | 254 | Odds Ratio (M‐H, Fixed, 95% CI) | 0.72 [0.26, 1.95] |
| 1.27 Somatostatin plus ulinastatin plus gabexate versus somatostatin plus gabexate | 1 | 246 | Odds Ratio (M‐H, Fixed, 95% CI) | 0.65 [0.23, 1.86] |
| 1.28 Somatostatin plus ulinastatin plus gabexate versus somatostatin plus ulinastatin | 1 | 240 | Odds Ratio (M‐H, Fixed, 95% CI) | 0.91 [0.30, 2.80] |
| 2 Serious adverse events (proportion) Show forest plot | 17 | Odds Ratio (M‐H, Fixed, 95% CI) | Subtotals only | |
| 2.1 Antibiotics versus control | 5 | 304 | Odds Ratio (M‐H, Fixed, 95% CI) | 0.65 [0.37, 1.15] |
| 2.2 Antioxidants versus control | 2 | 82 | Odds Ratio (M‐H, Fixed, 95% CI) | 1.98 [0.48, 8.13] |
| 2.3 EDTA versus control | 1 | 64 | Odds Ratio (M‐H, Fixed, 95% CI) | 0.52 [0.11, 2.39] |
| 2.4 Gabexate versus control | 2 | 201 | Odds Ratio (M‐H, Fixed, 95% CI) | 1.31 [0.31, 5.60] |
| 2.5 Glucagon versus control | 2 | 127 | Odds Ratio (M‐H, Fixed, 95% CI) | 0.29 [0.01, 7.46] |
| 2.6 Octreotide versus control | 1 | 58 | Odds Ratio (M‐H, Fixed, 95% CI) | 1.73 [0.61, 4.93] |
| 2.7 Somatostatin versus control | 2 | 111 | Odds Ratio (M‐H, Fixed, 95% CI) | 1.07 [0.35, 3.27] |
| 2.8 Gabexate versus aprotinin | 1 | 116 | Odds Ratio (M‐H, Fixed, 95% CI) | 1.05 [0.22, 4.91] |
| 2.9 Ulinastatin versus gabexate | 1 | 62 | Odds Ratio (M‐H, Fixed, 95% CI) | 0.0 [0.0, 0.0] |
| 3 Serious adverse events (number) Show forest plot | 37 | Rate Ratio (Fixed, 95% CI) | Subtotals only | |
| 3.1 Antibiotics versus control | 12 | 716 | Rate Ratio (Fixed, 95% CI) | 0.86 [0.68, 1.07] |
| 3.2 Antioxidants versus control | 2 | 71 | Rate Ratio (Fixed, 95% CI) | 0.22 [0.02, 2.21] |
| 3.3 Aprotinin versus control | 3 | 264 | Rate Ratio (Fixed, 95% CI) | 0.79 [0.49, 1.29] |
| 3.4 Cimetidine versus control | 1 | 60 | Rate Ratio (Fixed, 95% CI) | 1.0 [0.20, 4.95] |
| 3.5 EDTA versus control | 1 | 64 | Rate Ratio (Fixed, 95% CI) | 0.94 [0.19, 4.65] |
| 3.6 Gabexate versus control | 3 | 375 | Rate Ratio (Fixed, 95% CI) | 0.86 [0.64, 1.15] |
| 3.7 Glucagon versus control | 1 | 68 | Rate Ratio (Fixed, 95% CI) | 1.0 [0.02, 50.40] |
| 3.8 Lexipafant versus control | 1 | 290 | Rate Ratio (Fixed, 95% CI) | 0.67 [0.46, 0.96] |
| 3.9 Octreotide versus control | 4 | 770 | Rate Ratio (Fixed, 95% CI) | 0.74 [0.60, 0.89] |
| 3.10 Probiotics versus control | 3 | 397 | Rate Ratio (Fixed, 95% CI) | 0.94 [0.65, 1.36] |
| 3.11 Somatostatin versus control | 3 | 257 | Rate Ratio (Fixed, 95% CI) | 1.03 [0.66, 1.59] |
| 3.12 Somatostatin plus omeprazole versus control | 1 | 140 | Rate Ratio (Fixed, 95% CI) | 0.36 [0.19, 0.70] |
| 3.13 Somatostatin plus ulinastatin versus control | 1 | 122 | Rate Ratio (Fixed, 95% CI) | 0.30 [0.15, 0.60] |
| 3.14 Glucagon versus atropine | 1 | 150 | Rate Ratio (Fixed, 95% CI) | 0.33 [0.03, 3.20] |
| 3.15 Octreotide plus ulinastatin versus octreotide | 1 | 120 | Rate Ratio (Fixed, 95% CI) | 0.30 [0.17, 0.51] |
| 3.16 Somatostatin plus ulinastatin versus somatostatin | 1 | 123 | Rate Ratio (Fixed, 95% CI) | 0.28 [0.15, 0.56] |
| 4 Organ failure Show forest plot | 18 | Odds Ratio (M‐H, Random, 95% CI) | Subtotals only | |
| 4.1 Antibiotics versus control | 5 | 258 | Odds Ratio (M‐H, Random, 95% CI) | 0.78 [0.44, 1.38] |
| 4.2 Antioxidants versus control | 4 | 163 | Odds Ratio (M‐H, Random, 95% CI) | 0.92 [0.39, 2.12] |
| 4.3 Gabexate versus control | 1 | 50 | Odds Ratio (M‐H, Random, 95% CI) | 0.32 [0.01, 8.25] |
| 4.4 Lexipafant versus control | 2 | 340 | Odds Ratio (M‐H, Random, 95% CI) | 0.68 [0.36, 1.27] |
| 4.5 Octreotide versus control | 2 | 430 | Odds Ratio (M‐H, Random, 95% CI) | 0.51 [0.27, 0.97] |
| 4.6 Probiotics versus control | 2 | 358 | Odds Ratio (M‐H, Random, 95% CI) | 0.80 [0.26, 2.47] |
| 4.7 Ulinastatin versus control | 1 | 129 | Odds Ratio (M‐H, Random, 95% CI) | 0.27 [0.01, 6.67] |
| 4.8 Somatostatin plus gabexate versus somatostatin | 1 | 252 | Odds Ratio (M‐H, Random, 95% CI) | 0.78 [0.33, 1.80] |
| 4.9 Somatostatin plus ulinastatin versus somatostatin | 1 | 246 | Odds Ratio (M‐H, Random, 95% CI) | 0.58 [0.23, 1.45] |
| 4.10 Somatostatin plus ulinastatin plus gabexate versus somatostatin | 1 | 238 | Odds Ratio (M‐H, Random, 95% CI) | 0.46 [0.17, 1.25] |
| 4.11 Somatostatin plus ulinastatin versus somatostatin plus gabexate | 1 | 254 | Odds Ratio (M‐H, Random, 95% CI) | 0.75 [0.29, 1.92] |
| 4.12 Somatostatin plus ulinastatin plus gabexate versus somatostatin plus gabexate | 1 | 246 | Odds Ratio (M‐H, Random, 95% CI) | 0.59 [0.21, 1.65] |
| 4.13 Somatostatin plus ulinastatin plus gabexate versus somatostatin plus ulinastatin | 1 | 240 | Odds Ratio (M‐H, Random, 95% CI) | 0.79 [0.27, 2.35] |
| 5 Infected pancreatic necrosis Show forest plot | 15 | Odds Ratio (M‐H, Fixed, 95% CI) | Subtotals only | |
| 5.1 Antibiotics versus control | 11 | 714 | Odds Ratio (M‐H, Fixed, 95% CI) | 0.82 [0.53, 1.25] |
| 5.2 Octreotide versus control | 1 | 58 | Odds Ratio (M‐H, Fixed, 95% CI) | 0.52 [0.04, 6.06] |
| 5.3 Probiotics versus control | 3 | 397 | Odds Ratio (M‐H, Fixed, 95% CI) | 1.10 [0.62, 1.96] |
| 6 Sepsis Show forest plot | 11 | Odds Ratio (M‐H, Random, 95% CI) | Subtotals only | |
| 6.1 Antibiotics versus control | 1 | 60 | Odds Ratio (M‐H, Random, 95% CI) | 0.42 [0.11, 1.60] |
| 6.2 Aprotinin versus control | 2 | 103 | Odds Ratio (M‐H, Random, 95% CI) | 1.84 [0.49, 6.96] |
| 6.3 Gabexate versus control | 3 | 373 | Odds Ratio (M‐H, Random, 95% CI) | 1.10 [0.55, 2.19] |
| 6.4 Lexipafant versus control | 1 | 290 | Odds Ratio (M‐H, Random, 95% CI) | 0.26 [0.08, 0.83] |
| 6.5 Octreotide versus control | 2 | 340 | Odds Ratio (M‐H, Random, 95% CI) | 0.40 [0.05, 3.53] |
| 6.6 Probiotics versus control | 1 | 62 | Odds Ratio (M‐H, Random, 95% CI) | 0.36 [0.10, 1.36] |
| 6.7 Gabexate versus aprotinin | 1 | 116 | Odds Ratio (M‐H, Random, 95% CI) | 1.05 [0.22, 4.91] |
| 7 Adverse events (proportion) Show forest plot | 27 | Odds Ratio (M‐H, Fixed, 95% CI) | Subtotals only | |
| 7.1 Antibiotics versus control | 6 | 429 | Odds Ratio (M‐H, Fixed, 95% CI) | 0.51 [0.32, 0.80] |
| 7.2 Antioxidants versus control | 1 | 39 | Odds Ratio (M‐H, Fixed, 95% CI) | 0.0 [0.0, 0.0] |
| 7.3 Calcitonin versus control | 1 | 94 | Odds Ratio (M‐H, Fixed, 95% CI) | 0.88 [0.12, 6.49] |
| 7.4 EDTA versus control | 1 | 64 | Odds Ratio (M‐H, Fixed, 95% CI) | 0.79 [0.27, 2.31] |
| 7.5 Gabexate versus control | 3 | 373 | Odds Ratio (M‐H, Fixed, 95% CI) | 0.83 [0.54, 1.27] |
| 7.6 Glucagon versus control | 2 | 127 | Odds Ratio (M‐H, Fixed, 95% CI) | 0.09 [0.00, 1.69] |
| 7.7 Lexipafant versus control | 1 | 83 | Odds Ratio (M‐H, Fixed, 95% CI) | 0.43 [0.16, 1.12] |
| 7.8 Octreotide versus control | 3 | 398 | Odds Ratio (M‐H, Fixed, 95% CI) | 1.00 [0.65, 1.55] |
| 7.9 Probiotics versus control | 1 | 62 | Odds Ratio (M‐H, Fixed, 95% CI) | 0.35 [0.12, 1.01] |
| 7.10 Somatostatin versus control | 2 | 111 | Odds Ratio (M‐H, Fixed, 95% CI) | 0.44 [0.19, 1.02] |
| 7.11 Somatostatin plus omeprazole versus control | 1 | 140 | Odds Ratio (M‐H, Fixed, 95% CI) | 0.00 [0.00, 0.04] |
| 7.12 Gabexate versus aprotinin | 2 | 298 | Odds Ratio (M‐H, Fixed, 95% CI) | 0.41 [0.23, 0.70] |
| 7.13 Ulinastatin versus gabexate | 1 | 62 | Odds Ratio (M‐H, Fixed, 95% CI) | 0.0 [0.0, 0.0] |
| 7.14 Ulinastatin versus octreotide | 1 | 25 | Odds Ratio (M‐H, Fixed, 95% CI) | 2.33 [0.46, 11.81] |
| 7.15 Somatostatin plus gabexate versus somatostatin | 1 | 252 | Odds Ratio (M‐H, Fixed, 95% CI) | 0.93 [0.44, 1.95] |
| 7.16 Somatostatin plus ulinastatin versus somatostatin | 1 | 246 | Odds Ratio (M‐H, Fixed, 95% CI) | 0.58 [0.25, 1.34] |
| 7.17 Somatostatin plus ulinastatin plus gabexate versus somatostatin | 1 | 238 | Odds Ratio (M‐H, Fixed, 95% CI) | 0.49 [0.20, 1.20] |
| 7.18 Somatostatin plus ulinastatin versus somatostatin plus gabexate | 1 | 254 | Odds Ratio (M‐H, Fixed, 95% CI) | 0.63 [0.27, 1.44] |
| 7.19 Somatostatin plus ulinastatin plus gabexate versus somatostatin plus gabexate | 1 | 246 | Odds Ratio (M‐H, Fixed, 95% CI) | 0.53 [0.22, 1.28] |
| 7.20 Somatostatin plus ulinastatin plus gabexate versus somatostatin plus ulinastatin | 1 | 240 | Odds Ratio (M‐H, Fixed, 95% CI) | 0.84 [0.32, 2.22] |
| 8 Adverse events (number) Show forest plot | 40 | Rate Ratio (Random, 95% CI) | Subtotals only | |
| 8.1 Antibiotics versus control | 12 | 755 | Rate Ratio (Random, 95% CI) | 0.75 [0.58, 0.95] |
| 8.2 Antioxidants versus control | 2 | 94 | Rate Ratio (Random, 95% CI) | 0.82 [0.38, 1.79] |
| 8.3 Aprotinin versus control | 3 | 264 | Rate Ratio (Random, 95% CI) | 0.98 [0.69, 1.39] |
| 8.4 Calcitonin versus control | 1 | 94 | Rate Ratio (Random, 95% CI) | 0.88 [0.12, 6.25] |
| 8.5 Cimetidine versus control | 1 | 60 | Rate Ratio (Random, 95% CI) | 1.14 [0.64, 2.02] |
| 8.6 EDTA versus control | 1 | 64 | Rate Ratio (Random, 95% CI) | 0.63 [0.28, 1.39] |
| 8.7 Gabexate versus control | 3 | 375 | Rate Ratio (Random, 95% CI) | 0.76 [0.61, 0.95] |
| 8.8 Glucagon versus control | 2 | 90 | Rate Ratio (Random, 95% CI) | 1.19 [0.51, 2.80] |
| 8.9 Lexipafant versus control | 1 | 290 | Rate Ratio (Random, 95% CI) | 0.61 [0.44, 0.85] |
| 8.10 Octreotide versus control | 4 | 634 | Rate Ratio (Random, 95% CI) | 0.78 [0.58, 1.05] |
| 8.11 Probiotics versus control | 3 | 397 | Rate Ratio (Random, 95% CI) | 0.84 [0.52, 1.36] |
| 8.12 Somatostatin versus control | 2 | 134 | Rate Ratio (Random, 95% CI) | 0.75 [0.26, 2.18] |
| 8.13 Ulinastatin versus control | 1 | 129 | Rate Ratio (Random, 95% CI) | 0.69 [0.32, 1.46] |
| 8.14 Gabexate versus aprotinin | 1 | 182 | Rate Ratio (Random, 95% CI) | 0.66 [0.38, 1.14] |
| 8.15 Glucagon versus atropine | 1 | 150 | Rate Ratio (Random, 95% CI) | 0.79 [0.36, 1.73] |
| 8.16 Oxyphenonium versus glucagon | 1 | 62 | Rate Ratio (Random, 95% CI) | 0.93 [0.65, 1.34] |
| 8.17 Octreotide plus ulinastatin versus octreotide | 1 | 120 | Rate Ratio (Random, 95% CI) | 0.29 [0.17, 0.48] |
| 9 Requirement for additional invasive intervention Show forest plot | 32 | Odds Ratio (M‐H, Fixed, 95% CI) | Subtotals only | |
| 9.1 Antibiotics versus control | 14 | 884 | Odds Ratio (M‐H, Fixed, 95% CI) | 0.82 [0.59, 1.13] |
| 9.2 Aprotinin versus control | 2 | 237 | Odds Ratio (M‐H, Fixed, 95% CI) | 0.59 [0.23, 1.47] |
| 9.3 Calcitonin versus control | 2 | 125 | Odds Ratio (M‐H, Fixed, 95% CI) | 0.30 [0.08, 1.16] |
| 9.4 Cimetidine versus control | 1 | 60 | Odds Ratio (M‐H, Fixed, 95% CI) | 0.13 [0.01, 2.61] |
| 9.5 EDTA versus control | 1 | 64 | Odds Ratio (M‐H, Fixed, 95% CI) | 0.68 [0.14, 3.29] |
| 9.6 Gabexate versus control | 3 | 426 | Odds Ratio (M‐H, Fixed, 95% CI) | 0.58 [0.37, 0.90] |
| 9.7 Glucagon versus control | 2 | 260 | Odds Ratio (M‐H, Fixed, 95% CI) | 1.26 [0.58, 2.77] |
| 9.8 Octreotide versus control | 3 | 854 | Odds Ratio (M‐H, Fixed, 95% CI) | 0.76 [0.48, 1.21] |
| 9.9 Probiotics versus control | 2 | 358 | Odds Ratio (M‐H, Fixed, 95% CI) | 1.50 [0.83, 2.71] |
| 9.10 Somatostatin versus control | 1 | 100 | Odds Ratio (M‐H, Fixed, 95% CI) | 0.40 [0.11, 1.38] |
| 9.11 Gabexate versus aprotinin | 1 | 182 | Odds Ratio (M‐H, Fixed, 95% CI) | 0.5 [0.19, 1.32] |
| 9.12 Glucagon versus aprotinin | 1 | 134 | Odds Ratio (M‐H, Fixed, 95% CI) | 1.33 [0.44, 4.08] |
| 9.13 Oxyphenonium versus glucagon | 1 | 62 | Odds Ratio (M‐H, Fixed, 95% CI) | 1.0 [0.13, 7.59] |
| 10 Endoscopic or radiological drainage of collections Show forest plot | 3 | Odds Ratio (M‐H, Fixed, 95% CI) | Subtotals only | |
| 10.1 Antibiotics versus control | 1 | 23 | Odds Ratio (M‐H, Fixed, 95% CI) | 0.33 [0.01, 9.07] |
| 10.2 Octreotide versus control | 1 | 372 | Odds Ratio (M‐H, Fixed, 95% CI) | 0.89 [0.40, 1.96] |
| 10.3 Probiotics versus control | 1 | 39 | Odds Ratio (M‐H, Fixed, 95% CI) | 0.94 [0.20, 4.44] |
| Outcome or subgroup title | No. of studies | No. of participants | Statistical method | Effect size |
| 1 Short‐term mortality Show forest plot | 11 | Odds Ratio (M‐H, Fixed, 95% CI) | Subtotals only | |
| 1.1 Antibiotics versus control | 10 | 683 | Odds Ratio (M‐H, Fixed, 95% CI) | 0.82 [0.52, 1.30] |
| 1.2 Gabexate versus aprotinin | 1 | 116 | Odds Ratio (M‐H, Fixed, 95% CI) | 0.52 [0.20, 1.36] |
| 2 Serious adverse events (proportion) Show forest plot | 5 | Odds Ratio (M‐H, Fixed, 95% CI) | Subtotals only | |
| 2.1 Antibiotics versus control | 4 | 281 | Odds Ratio (M‐H, Fixed, 95% CI) | 0.84 [0.46, 1.54] |
| 2.2 Gabexate versus aprotinin | 1 | 116 | Odds Ratio (M‐H, Fixed, 95% CI) | 1.05 [0.22, 4.91] |
| 3 Serious adverse events (number) Show forest plot | 7 | Rate Ratio (Fixed, 95% CI) | Subtotals only | |
| 3.1 Antibiotics versus control | 7 | Rate Ratio (Fixed, 95% CI) | 0.79 [0.59, 1.06] | |
| 4 Organ failure Show forest plot | 4 | Odds Ratio (M‐H, Random, 95% CI) | Subtotals only | |
| 4.1 Antibiotics versus control | 4 | 211 | Odds Ratio (M‐H, Random, 95% CI) | 0.78 [0.42, 1.45] |
| 5 Infected pancreatic necrosis Show forest plot | 6 | Odds Ratio (M‐H, Fixed, 95% CI) | Subtotals only | |
| 5.1 Antibiotics versus control | 6 | 426 | Odds Ratio (M‐H, Fixed, 95% CI) | 0.85 [0.51, 1.42] |
| 6 Sepsis Show forest plot | 2 | Odds Ratio (M‐H, Random, 95% CI) | Subtotals only | |
| 6.1 Antibiotics versus control | 1 | 60 | Odds Ratio (M‐H, Random, 95% CI) | 0.42 [0.11, 1.60] |
| 6.2 Gabexate versus aprotinin | 1 | 116 | Odds Ratio (M‐H, Random, 95% CI) | 1.05 [0.22, 4.91] |
| Outcome or subgroup title | No. of studies | No. of participants | Statistical method | Effect size |
| 1 Short‐term mortality Show forest plot | 22 | Odds Ratio (M‐H, Fixed, 95% CI) | Subtotals only | |
| 1.1 Antibiotics versus control | 9 | 542 | Odds Ratio (M‐H, Fixed, 95% CI) | 0.82 [0.53, 1.27] |
| 1.2 Aprotinin versus control | 2 | 103 | Odds Ratio (M‐H, Fixed, 95% CI) | 0.66 [0.19, 2.30] |
| 1.3 Calcitonin versus control | 1 | 31 | Odds Ratio (M‐H, Fixed, 95% CI) | 0.78 [0.11, 5.46] |
| 1.4 Gabexate versus control | 1 | 52 | Odds Ratio (M‐H, Fixed, 95% CI) | 0.19 [0.04, 0.99] |
| 1.5 Probiotics versus control | 1 | 62 | Odds Ratio (M‐H, Fixed, 95% CI) | 0.25 [0.05, 1.34] |
| 1.6 Activated protein C versus control | 1 | 32 | Odds Ratio (M‐H, Fixed, 95% CI) | 8.56 [0.41, 180.52] |
| 1.7 Somatostatin versus control | 2 | 182 | Odds Ratio (M‐H, Fixed, 95% CI) | 0.51 [0.21, 1.23] |
| 1.8 Somatostatin plus omeprazole versus control | 1 | 140 | Odds Ratio (M‐H, Fixed, 95% CI) | 0.23 [0.05, 1.11] |
| 1.9 Somatostatin plus ulinastatin versus control | 1 | 122 | Odds Ratio (M‐H, Fixed, 95% CI) | 0.43 [0.15, 1.23] |
| 1.10 Thymosin versus control | 1 | 24 | Odds Ratio (M‐H, Fixed, 95% CI) | 0.0 [0.0, 0.0] |
| 1.11 Ulinastatin versus control | 1 | 70 | Odds Ratio (M‐H, Fixed, 95% CI) | 0.24 [0.04, 1.29] |
| 1.12 Octreotide plus ulinastatin versus octreotide | 1 | 120 | Odds Ratio (M‐H, Fixed, 95% CI) | 0.31 [0.06, 1.60] |
| 1.13 Somatostatin plus gabexate versus somatostatin | 1 | 252 | Odds Ratio (M‐H, Fixed, 95% CI) | 0.93 [0.37, 2.33] |
| 1.14 Somatostatin plus ulinastatin versus somatostatin | 2 | 369 | Odds Ratio (M‐H, Fixed, 95% CI) | 0.73 [0.34, 1.56] |
| 1.15 Somatostatin plus ulinastatin plus gabexate versus somatostatin | 1 | 238 | Odds Ratio (M‐H, Fixed, 95% CI) | 0.61 [0.21, 1.74] |
| 1.16 Somatostatin plus ulinastatin versus somatostatin plus gabexate | 1 | 254 | Odds Ratio (M‐H, Fixed, 95% CI) | 0.72 [0.26, 1.95] |
| 1.17 Somatostatin plus ulinastatin plus gabexate versus somatostatin plus gabexate | 1 | 246 | Odds Ratio (M‐H, Fixed, 95% CI) | 0.65 [0.23, 1.86] |
| 1.18 Somatostatin plus ulinastatin plus gabexate versus somatostatin plus ulinastatin | 1 | 240 | Odds Ratio (M‐H, Fixed, 95% CI) | 0.91 [0.30, 2.80] |
| 2 Serious adverse events (proportion) Show forest plot | 3 | Odds Ratio (M‐H, Fixed, 95% CI) | Subtotals only | |
| 2.1 Antibiotics versus control | 3 | 164 | Odds Ratio (M‐H, Fixed, 95% CI) | 0.56 [0.27, 1.18] |
| 3 Serious adverse events (number) Show forest plot | 13 | Rate Ratio (Random, 95% CI) | Subtotals only | |
| 3.1 Antibiotics versus control | 5 | Rate Ratio (Random, 95% CI) | 0.81 [0.52, 1.25] | |
| 3.2 Aprotinin versus control | 2 | Rate Ratio (Random, 95% CI) | 0.65 [0.25, 1.71] | |
| 3.3 Gabexate versus control | 1 | Rate Ratio (Random, 95% CI) | 0.64 [0.37, 1.10] | |
| 3.4 Probiotics versus control | 2 | Rate Ratio (Random, 95% CI) | 0.62 [0.24, 1.59] | |
| 3.5 Somatostatin versus control | 1 | Rate Ratio (Random, 95% CI) | 1.07 [0.67, 1.69] | |
| 3.6 Somatostatin plus omeprazole versus control | 1 | Rate Ratio (Random, 95% CI) | 0.36 [0.19, 0.70] | |
| 3.7 Somatostatin plus ulinastatin versus control | 1 | Rate Ratio (Random, 95% CI) | 0.30 [0.15, 0.60] | |
| 3.8 Octreotide plus ulinastatin versus octreotide | 1 | Rate Ratio (Random, 95% CI) | 0.30 [0.17, 0.51] | |
| 3.9 Somatostatin plus ulinastatin versus somatostatin | 1 | Rate Ratio (Random, 95% CI) | 0.28 [0.15, 0.56] | |
| 4 Organ failure Show forest plot | 6 | Odds Ratio (M‐H, Fixed, 95% CI) | Subtotals only | |
| 4.1 Antibiotics versus control | 3 | 137 | Odds Ratio (M‐H, Fixed, 95% CI) | 0.89 [0.40, 1.99] |
| 4.2 Lexipafant versus control | 0 | 0 | Odds Ratio (M‐H, Fixed, 95% CI) | 0.0 [0.0, 0.0] |
| 4.3 Probiotics versus control | 1 | 62 | Odds Ratio (M‐H, Fixed, 95% CI) | 0.40 [0.12, 1.36] |
| 4.4 Ulinastatin versus control | 1 | 67 | Odds Ratio (M‐H, Fixed, 95% CI) | 0.05 [0.01, 0.21] |
| 4.5 Somatostatin plus gabexate versus somatostatin | 1 | 252 | Odds Ratio (M‐H, Fixed, 95% CI) | 0.78 [0.33, 1.80] |
| 4.6 Somatostatin plus ulinastatin versus somatostatin | 1 | 246 | Odds Ratio (M‐H, Fixed, 95% CI) | 0.58 [0.23, 1.45] |
| 4.7 Somatostatin plus ulinastatin plus gabexate versus somatostatin | 1 | 238 | Odds Ratio (M‐H, Fixed, 95% CI) | 0.46 [0.17, 1.25] |
| 4.8 Somatostatin plus ulinastatin versus somatostatin plus gabexate | 1 | 254 | Odds Ratio (M‐H, Fixed, 95% CI) | 0.75 [0.29, 1.92] |
| 4.9 Somatostatin plus ulinastatin plus gabexate versus somatostatin plus gabexate | 1 | 246 | Odds Ratio (M‐H, Fixed, 95% CI) | 0.59 [0.21, 1.65] |
| 4.10 Somatostatin plus ulinastatin plus gabexate versus somatostatin plus ulinastatin | 1 | 240 | Odds Ratio (M‐H, Fixed, 95% CI) | 0.79 [0.27, 2.35] |
| 5 Infected pancreatic necrosis Show forest plot | 8 | Odds Ratio (M‐H, Fixed, 95% CI) | Subtotals only | |
| 5.1 Antibiotics versus control | 6 | 341 | Odds Ratio (M‐H, Fixed, 95% CI) | 0.73 [0.41, 1.33] |
| 5.2 Probiotics versus control | 2 | 101 | Odds Ratio (M‐H, Fixed, 95% CI) | 0.60 [0.22, 1.68] |
| 6 Sepsis Show forest plot | 3 | Odds Ratio (M‐H, Fixed, 95% CI) | Subtotals only | |
| 6.1 Aprotinin versus control | 2 | 103 | Odds Ratio (M‐H, Fixed, 95% CI) | 1.87 [0.50, 6.98] |
| 6.2 Probiotics versus control | 1 | 62 | Odds Ratio (M‐H, Fixed, 95% CI) | 0.36 [0.10, 1.36] |