Postupnik ubrzanog oporavka kod velikih operacija gornjeg probavnog trakta, jetre i gušterače
Abstract
Background
'Fast‐track surgery' or 'enhanced recovery protocol' or 'fast‐track rehabilitation', incorporating one or more elements of preoperative education, pain relief, early mobilisation, enteral nutrition and growth factors, may improve health‐related quality of life and reduce length of hospital stay and costs. The role of enhanced recovery protocols in major upper gastrointestinal, liver and pancreatic surgery is unclear.
Objectives
To assess the benefits and harms of enhanced recovery protocols compared with standard care (or usual practice) in major upper gastrointestinal, liver and pancreatic surgery.
Search methods
We searched the Cochrane Central Register of Controlled Trials (CENTRAL; Cochrane Library; 2015, Issue 3), MEDLINE, EMBASE and Science Citation Index Expanded until March 2015 to identify randomised trials. We also searched the references of included trials to identify further trials.
Selection criteria
We considered only randomised controlled trials (RCTs) performed in people undergoing major upper gastrointestinal, liver and pancreatic surgery, irrespective of language, blinding or publication status for inclusion in the review.
Data collection and analysis
Two review authors independently identified trials and independently extracted data. We calculated the risk ratio (RR), mean difference (MD), or standardised mean difference (SMD) with 95% confidence intervals (CIs) using both fixed‐effect and random‐effects models using Review Manager 5, based on available case analysis.
Main results
Ten studies met the inclusion criteria for the review, and nine studies provided information on one or more outcomes for the review. A total of 1014 participants were randomly assigned to the enhanced recovery protocol (499 participants) or standard care (515 participants) in the nine RCTs. Most of the trials included low anaesthetic risk participants with high performance status undergoing different upper gastrointestinal, liver and pancreatic surgeries. Eight trials incorporated more than one element of the enhanced recovery protocol. All of the trials were at high risk of bias. The overall quality of evidence was low or very low.
None of the trials reported long‐term mortality, medium‐term health‐related quality of life(three months to one year), time to return to normal activity, or time to return to work. The difference between the enhanced recovery protocol and standard care were imprecise for short‐term mortality (enhanced recovery protocol: 4/425 (adjusted proportion = 0.6%); standard care: 1/443 (0.2%); seven trials; 868 participants; RR 2.79; 95% CI 0.44 to 17.73; very low quality evidence), proportion of people with serious adverse events (enhanced recovery protocol: 4/157 (adjusted proportion = 0.6%); standard care: 0/184 (0.0%); two trials; 341 participants; RR 5.57; 95% CI 0.68 to 45.89; very low quality evidence), number of serious adverse events (enhanced recovery protocol: 34/421 (8 per 100 participants); standard care: 46/438 (11 per 100 participants); seven trials; 859 participants; rate ratio 0.72; 95% CI 0.45 to 1.13; very low quality evidence), health‐related quality of life (four trials; 373 participants; SMD 0.29; 95% CI ‐0.04 to 0.62; very low quality evidence) and hospital readmissions (enhanced recovery protocol: 14/355 (adjusted proportion = 3.3%); standard care: 9/378 (2.4%); seven trials; 733 participants; RR 1.4; 95% CI 0.69 to 2.87; very low quality evidence). The enhanced recovery protocol group had a lower proportion of people with mild adverse events (enhanced recovery protocol: 31/254 (adjusted proportion = 10.9%); standard care: 51/271 (18.8%); four trials; 525 participants; RR 0.58; 95% CI 0.39 to 0.85; low quality evidence), fewer number of mild adverse events (enhanced recovery protocol: 69/499 (13 per 100 participants); standard care: 128/515 (25 per 100 participants); nine trials; 1014 participants; rate ratio 0.52; 95% CI 0.39 to 0.70; low quality evidence), shorter length of hospital stay (nine trials; 1014 participants; MD ‐2.19 days; 95% CI ‐2.53 to ‐1.85; low quality evidence) and lower costs (four trials; 282 participants; MD USD ‐6300; 95% CI ‐8400 to ‐4200; low quality evidence) than standard care group.
Authors' conclusions
Based on low quality evidence, enhanced recovery protocols may reduce length of hospital stay and costs (primarily because of reduction in hospital stay) in people undergoing major upper gastrointestinal, liver and pancreatic surgeries. However, the validity of the results is uncertain because of the risk of bias in the trials and the way the outcomes were measured. Future RCTs should be conducted with low risk of bias, and measure clinically important outcomes for including the three months to one year period.
PICO
Laički sažetak
Protokol ubrzanog oporavka nakon velikih kirurških zahvata na jednjaku, želucu, jetri i gušterači
Istraživačko pitanje
Istraženo je jesu li protokoli ubrzanog oporavka korisni ili štetni u usporedbi sa standardnim postupcima nakon velikih kirurških zahvata na jednjaku, želucu, jetri i gušterači.
Dosadašnje spoznaje
Protokol ubrzanog (engl. fast‐track) oporavka uključuje edukaciju bolesnika prije operativnog zahvata, ublažavanje bolova za vrijeme i nakon operacije, rano dizanje nakon operacije, prehrambene dodatke, ishranu na usta ili pomoću cjevčice postavljene kroz nos ili trbušnu šupljinu, umjesto infuzije. Korisni i štetni učinci protokola ubrzanog oporavka kod bolesnika nakon velike operacije jednjaka, želuca, jetre i gušterače nisu poznati. U ovom Cochrane sustavnom pregledu analizirane su studije koje su to istraživale. Uključene su studije objavljene do 26. ožujka 2015.
Značajke istraživanja
Deset studija je ispunjavalo kriterije za ovaj pregled i 9 studija je sadržavalo podatke za ovaj pregled. Ukupno je sudjelovalo 1014 ispitanika u 9 studija, 499 je bilo liječeno ovim protokolom, a 515 ispitanika standardnim pristupom. Odabir pristupa je bio nasumičan, a što je preduvjet sličnosti skupina. U jednom istraživanju s 33 ispitanika je provedena ista usporedba, ali su podaci za ovaj pregled bili nedostatni. Većina ispitanika je osim osnovnog razloga za operaciju bila zdrava. U 8 istraživanja je bilo uključeno nekoliko dijelova protokola ubrzanog oporavka.
Ključni rezultati
Niti jedno istraživanje nije prikazalo dugoročnu smrtnost, srednjeročnu kvalitetu života (3 mj ‐ 1 god.), vrijeme do uspostave normalne aktivnosti ili vrijeme do povratka radne sposobnosti. Razlika između protokola ubrzanog oporavka i standardnih postupaka nije bila precizna za kratkoročnu smrtnost, postotak osoba s teškim komplikacijama, ukupni broj teških komplikacija, kvalitetom života povezanom sa zdravljem i ponovnom hospitalizacijom. Protokol ubrzanog oporavka je imao manji postotak bolesnika s manjim komplikacijama, manje manjih komplikacija, kraću hospitalizaciju (u prosjeku 2 dana kraću po osobi) i manje troškove (ušteda od od oko 6300 USD po osobi) u usporedbi sa standardnim postupkom. Istraživanja su bila niske kvalitete i nisu uključila važne ishode, te je dalje potrebno provesti kvalitetna istraživanja na ovu temu.
Kvaliteta dokaza
Kvaliteta dokaza je bila niska ili vrlo niska. Stoga rezultati nisu pouzdani.
Authors' conclusions
Summary of findings
| Enhanced recovery protocols versus standard care for major upper gastrointestinal, liver and pancreatic surgery | ||||||
| Patient or population: people with major upper gastrointestinal, liver and pancreatic surgery Control: standard care | ||||||
| Outcomes | Illustrative comparative risks* (95% CI) | Relative effect | No of Participants | Quality of the evidence | Comments | |
| Assumed risk | Corresponding risk | |||||
| Control | Enhanced recovery protocol versus standard care | |||||
| None of the trials reported long‐term mortality, medium‐term health‐related quality of life (3 months to 1 year), time to return to normal activity, or time to return to work. | ||||||
| Short‐term mortality | 2 per 1000 | 6 per 1000 | RR 2.79 | 868 | ⊕⊝⊝⊝ | |
| Serious adverse events (proportion) | 1 per 1000 | 6 per 1000 | RR 5.57 (0.68 to 45.89) | 341 | ⊕⊝⊝⊝ | Since there were no serious adverse events in the control group (in the two trials that reported the proportion of participants with serious adverse events), the control group risk was stated as 0.1% for this outcome alone |
| Serious adverse events (number) | 105 per 1000 | 76 per 1000 | Rate ratio 0.72 | 859 | ⊕⊝⊝⊝ | |
| Health‐related quality of life (until 3 months) | The mean health‐related quality of life in the intervention groups was | 373 | very low1,4 | SMD 0.29 (‐0.04 to 0.62) | ||
| Mild adverse events (proportion) | 188 per 1000 | 109 per 1000 | RR 0.58 | 525 | ⊕⊕⊝⊝ | |
| Mild adverse events (number) | 249 per 1000 | 129 per 1000 | Rate ratio 0.52 | 1014 | ⊕⊕⊝⊝ | |
| Length of hospital stay | The mean length of hospital stay in the control groups was | The mean length of hospital stay in the intervention groups was | 1014 | ⊕⊕⊝⊝ | The length of hospital stay reported in the trials included only the length of hospital stay during the admission for surgery and does not include the readmissions | |
| Readmissions | 24 per 1000 | 33 per 1000 | RR 1.4 | 733 | ⊕⊝⊝⊝ | |
| Costs | The mean costs in the control groups were | The mean costs in the intervention groups were | 282 | ⊕⊕⊝⊝ | ||
| *The basis for the assumed risk is the mean control group risk. The corresponding risk (and its 95% confidence interval) is based on the assumed risk in the comparison group and the relative effect of the intervention (and its 95% CI). | ||||||
| GRADE Working Group grades of evidence | ||||||
| 1 The risk of bias was high in all the trials. | ||||||
Background
Description of the condition
Upper gastrointestinal disorders include diseases affecting the oesophagus, stomach, liver, gallbladder and pancreas. The definition of major upper gastrointestinal, liver and pancreatic surgery is variable. One definition that we have used in this review includes all upper gastrointestinal, liver and pancreatic surgeries that have been excluded from the British Association of Day Surgery Directory of Procedures (BADS 2012), as well as surgeries such as transhiatal oesophagectomy, gastrectomy (irrespective of whether a total or subtotal distal gastrectomy is performed), liver resection (irrespective of the number of segments resected and the aetiology), pancreatic resection (irrespective of whether a pancreaticoduodenectomy or a distal pancreatectomy is performed, and irrespective of whether the pylorus is preserved), pancreatic drainage procedures (for chronic pancreatitis) and open pancreaticojejunostomy or pancreaticogastrostomy for pseudocyst. In upper gastrointestinal surgeries that are included in the British Association of Day Surgery Directory of Procedures (BADS 2012), early mobilisation and discharge are recommended when possible, and patients are admitted because of coexisting medical illnesses, for administrative reasons, because of complications related to surgery, or because of intolerance to surgery. As will be evident from the description of the intervention, early mobilisation is one of the elements of an enhanced recovery protocol; therefore this review includes only upper gastrointestinal, liver and pancreatic surgeries that are not included in the British Association of Day Surgery Directory of Procedures (BADS 2012). The number of major upper gastrointestinal, liver and pancreatic surgeries performed each year is difficult to estimate. In the UK alone, approximately 25,000 major upper gastrointestinal, liver and pancreatic surgeries are performed, costing approximately GBP 150 million each year (Hospital Episode Statistics 2013).
Description of the intervention
'Fast‐track surgery' or 'enhanced recovery protocol' or 'fast‐track rehabilitation' after surgery, again can be variably defined, and involves one or more of the following elements (Kehlet 1997).
-
Preoperative information and teaching.
-
Decreased stress related to surgery.
-
Pain relief.
-
Exercise (early mobilisation).
-
Enteral nutrition.
-
Growth factors.
How the intervention might work
Enhanced recovery protocols aim to decrease pathophysiological changes after surgery, including surgical stress, pain, immunosuppression, nausea, vomiting and ileus, hypoxaemia, immobilisation leading to blood clots in the legs and malnutrition leading to catabolism and muscle wasting (Kehlet 1997).
Why it is important to do this review
Implementation of enhanced recovery protocols involves considerable planning (including identifying the elements that need to be incorporated into the protocol for a particular surgery) and deployment (which involves educating and training the staff and encouraging staff members, including surgeons, to follow a unified protocol). Deployment may involve changing traditions and beliefs of surgeons and other clinicians who may be reluctant to change their traditional practices, or who may be concerned that the enhanced recovery protocol may be associated with patient risks and harms. It also incurs costs. Thus, implementation of enhanced recovery protocols involves considerable human and resource management. It is therefore essential to assess whether an enhanced recovery protocol is effective for major upper gastrointestinal, liver and pancreatic surgery. No Cochrane review on this topic has been conducted.
Objectives
To assess the benefits and harms of enhanced recovery protocols compared with standard care (or usual practice) in major upper gastrointestinal, liver and pancreatic surgery.
Methods
Criteria for considering studies for this review
Types of studies
We included randomised controlled trials (RCTs) reported as full‐text, those published as abstract only, and those with unpublished data.
Types of participants
We included adults, or children, or both, undergoing major upper gastrointestinal, liver and pancreatic surgery such as transhiatal oesophagectomy, gastrectomy (irrespective of whether a total or subtotal distal gastrectomy is performed), liver resection (irrespective of the number of segments resected and the aetiology), pancreatic resection (irrespective of whether a pancreaticoduodenectomy or a distal pancreatectomy is performed, and irrespective of whether the pylorus is preserved), pancreatic drainage procedures (for chronic pancreatitis) and open pancreaticojejunostomy or pancreaticogastrostomy for pseudocyst.
We excluded upper gastrointestinal, liver and pancreatic surgeries that are included in the British Association of Day Surgery Directory of Procedures (BADS 2012), including laparoscopic cholecystectomy or laparoscopic fundoplication, as patients are discharged on the same day when they have mobilised adequately.
Types of interventions
We included trials comparing an enhanced recovery protocol with usual care, provided that the only difference between randomly assigned groups is the use of an enhanced recovery protocol. We will accept the definition proposed by Kehlet 1997, which requires inclusion of one or more of the following elements.
-
Preoperative information and teaching.
-
Decreased stress related to surgery.
-
Pain relief.
-
Exercise (early mobilisation).
-
Enteral nutrition.
-
Growth factors.
We excluded trials comparing different enhanced recovery protocols. We also excluded trials comparing laparoscopic and open surgeries, as the issues surrounding laparoscopic or open surgery are different for different procedures.
Types of outcome measures
Primary outcomes
-
Mortality.
-
Short‐term mortality (in‐hospital mortality or mortality within three months).
-
Long‐term mortality (for patients undergoing surgery for cancer).
-
-
Serious adverse events (within three months). We accepted the following definitions of serious adverse events.
-
Clavien‐Dindo classification (Clavien 2009; Dindo 2004): grade III or higher.
-
International Conference on Harmonisation–Good Clinical Practice (ICH‐GCP) guideline (ICH‐GCP 1996): serious adverse events defined as any untoward medical occurrences that result in death, are life threatening, require inpatient hospitalisation or prolongation of existing hospitalisation and result in persistent or significant disability/incapacity.
-
Individual complications that could clearly be classified as grade III or higher by the Clavien‐Dindo classification (Clavien 2009; Dindo 2004), or as a serious adverse event by the ICH‐GCP classification.
-
-
Health‐related quality of life (using any validated scale).
-
Short‐term (until three months).
-
Medium‐term (three months to one year).
-
Secondary outcomes
-
Adverse events (within three months). We included all adverse events reported by the study authors, irrespective of their severity.
-
Length of hospital stay (including the index admission for major upper gastrointestinal, liver or pancreatic surgery and any surgical complication–related readmissions).
-
Number of hospital readmissions.
-
Time to return to normal activity (return to preoperative mobility without additional carer support).
-
Time to return to work (for those who were employed previously).
-
Costs (however reported by study authors; we converted costs to the single currency of USD based on the existing conversion rate on the day of the analysis).
The selection of the above clinical outcomes was based on the necessity to assess whether an enhanced recovery protocol decreases complications after surgery and results in earlier postoperative recovery, allowing earlier discharge from hospital, return to normal activity, return to work and improvement in health‐related quality of life.
Reporting of the outcomes listed here will not be an inclusion criterion for the review.
Search methods for identification of studies
Electronic searches
We conducted a literature search to identify all published and unpublished RCTs until 26th March 2015. This literature search identified potential studies published in all languages. We translated the non‐English language papers and fully assessed them for potential inclusion in the review as necessary.
We searched the following electronic databases to identify potential studies.
-
Cochrane Central Register of Controlled Trials (CENTRAL; Cochrane Library; 2015, Issue 3) (Appendix 1).
-
MEDLINE (OvidSP) (1966 to March 2015) (Appendix 2).
-
EMBASE (OvidSP) (1988 to March 2015) (Appendix 3).
-
Science Citation Index (Web of Knowledge) (1982 to March 2015) (Appendix 4).
We also conducted a search of ClinicalTrials.gov (Appendix 5) and the World Health Organization International Clinical Trials Registry Platform (WHO ICTRP) (Appendix 6) on 26th March 2015.
Searching other resources
We checked reference lists of all primary studies and review articles for additional references. We contacted authors of identified trials and asked them to identify other published and unpublished studies.
We searched for errata or retractions from eligible trials on http://www.ncbi.nlm.nih.gov/pubmed on 26th March 2015, but did not find any errata.
Data collection and analysis
Selection of studies
Two review authors (GBS and AB) independently screened titles and abstracts for inclusion of all potential studies identified as a result of the search and coded them as 'retrieve' (eligible or potentially eligible/unclear) or 'do not retrieve.'
We retrieved full‐text study reports, and the two review authors (GBS and AB) independently screened them, identified studies for inclusion and identified and record reasons for exclusion of ineligible studies.
We resolved disagreements through discussion and, when required, consulted a third person (KG). We identified and excluded duplicates and collated multiple reports of the same study, so that each study rather than each report is the unit of interest in the review. We recorded the selection process in sufficient detail to complete a PRISMA (Preferred Reporting Items for Systematic Reviews and Meta‐Analyses) flow diagram (Moher 2009; Figure 1), and a Characteristics of excluded studies table.
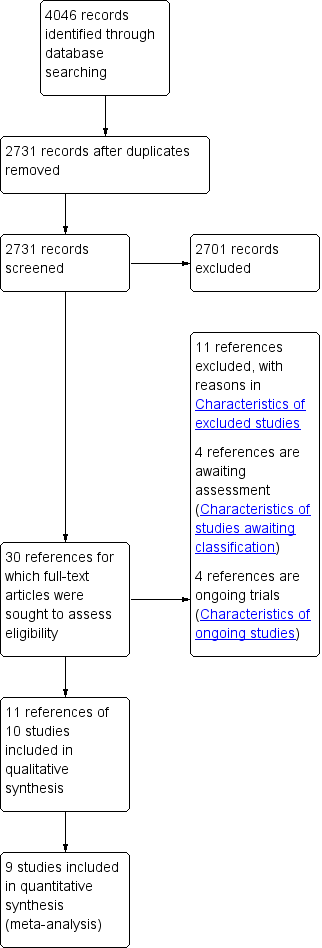
Study flow diagram.
Data extraction and management
We used a standard data collection form for study characteristics and outcome data that was piloted on two studies in the review. The two review authors (GBS and AB) extracted the following study characteristics from included studies.
-
Methods: study design, total duration of study and run‐in, number of study centres and locations, study settings, withdrawals, dates of study.
-
Participants: number (N), mean age, age range, gender, inclusion criteria, exclusion criteria.
-
Interventions: interventions, comparisons, concomitant interventions.
-
Outcomes: primary and secondary outcomes specified and collected, time points reported.
-
Notes: funding for trial, notable conflicts of interest of trial authors.
Two review authors (GBS and AB) independently extracted outcome data from the included studies. If outcomes were reported multiple times for the same time point, for example, if short‐term health‐related quality of life was reported at six weeks and at three months, we planned to choose the later time point (i.e. three months) for data extraction. For time‐to‐event outcomes, we planned to extract data to calculate the natural logarithm of the hazard ratio and its standard error using the methods suggested by Parmar 1998.
We planned to include all randomly assigned participants for the medium‐ and long‐term outcomes (e.g. mortality, quality of life), and this was not conditional upon short‐term outcomes (e.g. being alive at three months, having a low or high quality of life index at three months).
We noted in the Characteristics of included studies table whether outcome data were reported in an unusable way. We resolved disagreements by reaching consensus or by involving a third person (KG). One review author (KG) copied data from the data collection form into the Review Manager file (RevMan 2014). We double‐checked that data were entered correctly by comparing data in the study reports with data presented in the systematic review.
Assessment of risk of bias in included studies
Two review authors (GBS and AB) independently assessed risk of bias for each study, using the criteria outlined in the Cochrane Handbook for Systematic Reviews of Interventions (Higgins 2011). Disagreements were resolved by discussion or through involvement of a third assessor (KG). We assessed risk of bias according to the following domains.
-
Random sequence generation.
-
Allocation concealment.
-
Blinding of participants and personnel.
-
Blinding of outcome assessment.
-
Incomplete outcome data.
-
Selective outcome reporting.
-
Other bias.
We graded each potential source of bias as high, low or unclear risk and provided a quote from the study report together with a justification for our judgement in the 'Risk of bias' table. We summarised risk of bias judgements across different studies for each of the domains listed. We considered blinding separately for different key outcomes when necessary (e.g. for unblinded outcome assessment, risk of bias for all‐cause mortality may be very different than for a patient‐reported pain scale). When information on risk of bias was related to unpublished data or correspondence with a trialist, we noted this in the 'Risk of bias' table.
When considering treatment effects, we took into account the risk of bias for studies that contribute to those outcomes.
Assesment of bias in conducting the systematic review
We conducted the review according to the published protocol and reported deviations from the protocol in the Differences between protocol and review' section of this review.
Measures of treatment effect
We analysed dichotomous data as risk ratios (RRs) and continuous data as mean differences (MDs) when the outcome was reported or converted to the same units in all trials (e.g. hospital stay) or as standardised mean differences (SMDs) when different scales were used in measuring the outcome (e.g. quality of life). We ensured that higher scores for continuous outcomes had the same meaning for the particular outcome, explained the direction to the reader and reported when the directions were reversed.
We calculated rate ratios for outcomes such as adverse events and serious adverse events when it was possible for the same person to experience more than one adverse event (or serious adverse event). If the study authors had calculated the rate ratio of adverse events (or serious adverse events) for intervention versus control on the basis of Poisson regression, we planned to obtain the rate ratio by using the Poisson regression method in preference to the rate ratio calculated using the number of adverse events (or serious adverse events) reported during a specified period. We planned to calculate the hazard ratio for time‐to‐event outcomes such as long‐term mortality and long‐term recurrence.
We undertook meta‐analyses since all the surgeries were major hepato pancreato biliary surgeries. Trialists commonly indicate when they have skewed data by reporting medians and interquartile ranges. It was not possible to determine whether the data were skewed. We attempted to contact the trial authors to provide this information, but we were unable to obtain this information. So, if the median and interquartile range were reported, we imputed the mean and standard deviation (as mentioned in the Dealing with missing data), but we performed a sensitivity analysis, excluding the data from these trials (as mentioned in the Sensitivity analysis).
When multiple trial arms were reported in a single trial, we planned to include only the relevant arms. When two comparisons (e.g. enhanced recovery protocol A versus standard care and enhanced recovery protocol B versus standard care) had to be entered into the same meta‐analysis, we planned to pool the results of enhanced recovery protocol A and enhanced recovery protocol B and compare them with standard care. The alternative way of including such trials is to half the control group and compare it with enhanced recovery protocol A and with enhanced recovery protocol B to avoid double counting. We planned to perform a sensitivity analysis to determine whether results obtained using the two methods of dealing with multi‐arm trials led to different conclusions.
Unit of analysis issues
The unit of analysis was individual study participants undergoing major upper gastrointestinal, liver and pancreatic surgery. If cluster‐randomised trials were identified, we planned to obtain the effect estimate adjusted for the clustering effect. If this was not available, we planned to perform a sensitivity analysis by excluding the trial from the meta‐analysis, as the variance of the effect estimate unadjusted for cluster effect is less than the actual variance, which is adjusted for cluster effect, inappropriately giving more weight to the cluster‐RCT in the meta‐analysis.
Dealing with missing data
We attempted to contact the investigators or study sponsors to verify key study characteristics and to obtain missing numerical outcome data whenever possible (e.g. when a study is identified as an abstract only). We received additional data from two study authors (Jones 2013; Kim 2012). If we were unable to obtain information from investigators or study sponsors, we imputed mean from median (i.e. consider median as the mean) and standard deviation from standard error, interquartile range or P values according to the recommendations of the Cochrane Handbook for Systematic Reviews of Interventions (Higgins 2011), but we assessed the impact of including such studies as indicated in a sensitivity analysis.
If we were unable to calculate the standard deviation from the standard error, interquartile range or P values, we imputed the standard deviation as the highest standard deviation in the remaining trials included in the outcome, while remaining fully aware that this method of imputation will decrease the weight of the studies in the meta‐analysis of MDs and will shift the effect towards no effect for SMDs.
Assessment of heterogeneity
We used the I² statistic to measure heterogeneity among the trials in each analysis. If we identified substantial heterogeneity as per the Cochrane Handbook for Systematic Reviews of Interventions (greater than 50% to 60%), we planned to explore this by performing prespecified subgroup analysis (Higgins 2011).
Assessment of reporting biases
We attempted to contact study authors to ask them to provide missing outcome data. When this was not possible, and the missing data were thought to introduce serious bias, we explored the impact of including such studies in the overall assessment of results by a sensitivity analysis.
Since there were fewer than 10 trials for all the outcomes, we did not create and examine a funnel plot to explore possible publication biases. We planned to use Egger's test to determine the statistical significance of the reporting bias (Egger 1997). We planned to use a P value less than 0.05 to show statistically significant reporting bias.
Data synthesis
We performed analyses using Review Manager 5.3 (RevMan 2014). We used the Mantel Haenszel method for dichotomous data, inverse variance method for continuous data and generic inverse variance for count data. We planned to use generic inverse variance for time‐to‐event data. We used both the fixed‐effect model (DerSimonian 1986), and random‐effects model for the analysis (Demets 1987). In case of discrepancy between the two models, we reported both results; otherwise we reported only the results from the fixed‐effect model.
'Summary of findings' table
We created a 'Summary of findings' table using all outcomes. We used the five GRADE (Grades of Recommendation, Assessment, Development and Evaluation) considerations (study limitations, consistency of effect, imprecision, indirectness and publication bias) to assess the quality of a body of evidence as it related to the studies that contributed data to the meta‐analyses for prespecified outcomes.
We used methods and recommendations as described in Section 8.5 and Chapter 12 of the Cochrane Handbook for Systematic Reviews of Interventions (Higgins 2011), and used GRADEpro software (GRADEproGDT 2015). We justified all decisions to downgrade or upgrade the quality of studies by using footnotes and making comments to aid the reader's understanding of the review whenever necessary. We planned to consider whether any additional outcome information could not be incorporated into the meta‐analyses and noted this in the comments, stating whether it supported or contradicted the information derived from the meta‐analyses.
Subgroup analysis and investigation of heterogeneity
We planned to carry out the following subgroup analyses.
-
Different surgeries (e.g. total or subtotal gastrectomy, distal gastrectomy, pancreaticoduodenectomy, distal pancreatectomy).
-
Different enhanced recovery protocols (according to the element that the enhanced recovery protocol is meant to address, for example, pain relief, nutrition).
-
Adults versus children.
We planned to use the primary outcomes in the subgroup analysis. We used the formal Chi2 test for subgroup differences to test for subgroup interactions.
Sensitivity analysis
We performed sensitivity analysis, as defined a priori, to assess the robustness of our conclusions. This involved:
-
excluding trials at unclear or high risk of bias (one of more of the risk of bias domains is classified as unclear or high);
-
excluding trials for which mean or standard deviation or both were imputed; and
-
excluding cluster‐RCTs for which adjusted effect estimates are not reported.
-
different methods of dealing with multi‐arm trials (please see Measures of treatment effect).
Reaching conclusions
We based our conclusions only on findings from the quantitative or narrative synthesis of studies included in this review. We have avoided making recommendations for practice, and our implications for research will give the reader a clear sense of what the focus of future research in the area should be; we have identified remaining uncertainties.
Results
Description of studies
Results of the search
We identified 4046 references through electronic searches of the Cochrane Central Register of Controlled Trials (CENTRAL) (n = 324), MEDLINE (OvidSP) (n = 1087), EMBASE (OvidSP) (n = 731), Science Citation Index expanded (n = 1737), ClinicalTrials.gov (n = 89) and the WHO Trials register (n = 78). After removing duplicate references there were 2731 references. We excluded 2701 clearly irrelevant references through reading abstracts. We retrieved a total of 30 references for further assessment in detail, from the full publication. We excluded 11 references for the reasons listed in the Characteristics of excluded studies tables. Four references were references of ongoing trials (Characteristics of ongoing studies). Four references are awaiting classification Of these, two were published as abstracts and it is not clear whether an intervention that can be classified as an enhanced recovery protocol was included as one of the arms (Geubbels 2014; Jin 2013). One reference has been published as full‐text but we were unable to obtain the full‐text in order to assess eligibility (Wang 2014). One reference was identified as completed in the ClinicalTrials.gov trial register, but we could not identify any publication as abstract or full‐text. We were unable to obtain the results for any of these trials. Eleven references of 10 RCTs fulfilled the inclusion criteria (Characteristics of included studies). The reference flow is shown in Figure 1.
Included studies
We included a total of 10 RCTs (Barlow 2011; Jones 2013; Kim 2012; Lemanu 2013; Liu 2010; Lu 2014; Miyachi 2013; Ni 2013; Wang 2010; Zhao 2014). All of the 10 RCTs were two‐armed trials. A total of 1115 participants were randomised to either an enhanced recovery protocol or standard recovery protocol group. A total of 68 were excluded after randomisation for various reasons stated in the Characteristics of included studies. The mean or median age in the trials ranged from 44 years to 66 years. The average proportion of females ranged from 17.8% to 70.5%. The type of surgeries that the participants underwent is summarised in Table 1. Three trials included participants undergoing gastrectomy (Liu 2010; Miyachi 2013; Wang 2010) and three trials included participants undergoing liver surgery (Jones 2013; Lu 2014; Ni 2013). The participants underwent major upper gastrointestinal surgery, laparoscopic distal gastrectomy, laparoscopic sleeve gastrectomy, oesophagectomy in each of the remaining trials (Barlow 2011; Kim 2012; Lemanu 2013; Zhao 2014). The detailed inclusion and exclusion criteria of participants in the different trials are stated in the Characteristics of included studies tables.
| Study name | Surgery | Preoperative education | Pain relief protocol | Early mobilisation protocol | Nutritional protocol | Growth factors | Outcomes reported |
| Major upper gastrointestinal surgery (oesophagectomy, gastrectomy and pancreatectomy) | No | No | No | Yes | No |
| |
| Open liver surgery | Yes | No | Yes | Yes | No |
| |
| Laparoscopic distal gastrectomy | Yes | Yes | Yes | Yes | No |
| |
| Laparoscopic sleeve gastrectomy | Yes | Yes | Yes | Yes | No |
| |
| Gastrectomy | Yes | Yes | Yes | Yes | No |
| |
| Liver surgery | No | No | Yes | Yes | No |
| |
| Gastrectomy | No | No | No | No | Yes | None of the outcomes of interest were reported | |
| Partial liver resection | Yes | Yes | Yes | Yes | No |
| |
| Gastrectomy | Yes | Yes | Ys | Yes | No |
| |
| Oesophagectomy | Yes | Yes | N | No | No |
|
The table shows the surgeries that the participants underwent, the elements of enhanced recovery protocol that were different between the intervention and control, and the outcomes reported in the trials.
The elements of the enhanced recovery protocol that were different between the intervention and control in the different studies are summarised in Table 1 and Characteristics of included studies tables. Seven trials incorporated preoperative patient education in addition to the standard care (Jones 2013; Kim 2012; Lemanu 2013; Liu 2010; Ni 2013; Wang 2010; Zhao 2014). Six trials incorporated a pain relief regimen which was different between the enhanced recovery protocol and standard care (Kim 2012; Lemanu 2013; Liu 2010; Ni 2013; Wang 2010; Zhao 2014). Seven trials incorporated early mobilisation in the enhanced recovery protocol care group in addition to the standard care (Jones 2013; Kim 2012; Lemanu 2013; Liu 2010; Lu 2014; Ni 2013; Wang 2010). Eight trials incorporated early enteral nutrition in one form or the other in addition to the standard care (Barlow 2011; Jones 2013; Kim 2012; Lemanu 2013; Liu 2010; Lu 2014; Ni 2013; Wang 2010). One trial incorporated growth factors in the enhanced recovery protocol care group in addition to the standard care (Miyachi 2013). Eight trials incorporated more than one element of the enhanced recovery protocol in the enhanced recovery protocol group compared to the standard care group (Jones 2013; Kim 2012; Lemanu 2013; Liu 2010; Lu 2014; Ni 2013; Wang 2010; Zhao 2014). The outcomes reported in the trials are summarised in Table 1. Nine trials including a total of 1014 participants randomised to the enhanced recovery protocol (499 participants) and standard care (515 participants) provided data on one or more outcomes and could be included in the meta‐analysis.
Excluded studies
We excluded three trials as they were comparisons between two enhanced recovery protocols (Gillissen 2011; Hendry 2010; Revie 2012). We excluded four trials as they included patients undergoing surgeries, but were not specific to major upper gastrointestinal, liver or pancreatic surgeries (Cheifetz 2010; Hubner 2012; Serclova 2009; Wattchow 2009). We excluded three studies as they were non‐randomised studies (Dejong 2014; Feldman 2014; Sahoo 2014). We excluded another reference as it was a comment on an included trial (Strobel 2013).
Risk of bias in included studies
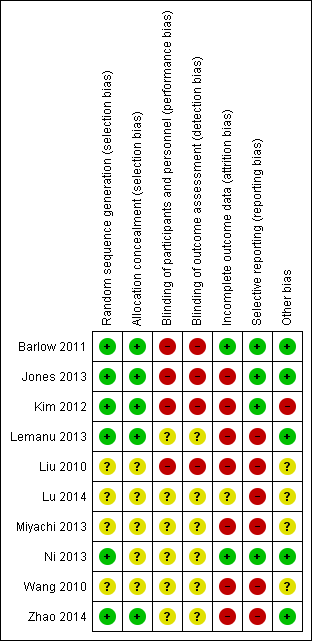
None of the trials were considered to be at low risk of bias. All the trials had unclear or high risk of bias on one or more domains (Figure 2; Figure 3). All‐cause mortality is unlikely to be influenced by the lack of blinding, while all the remaining outcomes are likely to be biased towards the enhanced recovery protocol because of lack of blinding. Blinding of participants is impossible for some of the elements of the enhanced recovery protocol (preoperative education and early mobilisation). Eight trials included at least one of preoperative education and early mobilisation (Jones 2013; Kim 2012; Lemanu 2013; Liu 2010; Lu 2014; Ni 2013; Wang 2010; Zhao 2014). It would have been impossible to blind the participants and the healthcare provider in these trials. So, we assessed whether the above trials were at low risk of other biases; none of the trials were at low risk of bias even after excluding the blinding of participants and personnel domain.

Risk of bias graph: review authors' judgements about each risk of bias item presented as percentages across all included studies.

Risk of bias summary: review authors' judgements about each risk of bias item for each included study.
Allocation
Five trials described random sequence generation and allocation concealment adequately (Barlow 2011; Jones 2013; Kim 2012; Lemanu 2013; Zhao 2014). We considered these five trials to be at low risk of selection bias; the selection bias in the remaining trials was unclear.
Blinding
No trials reported that the participants and healthcare personnel involved in patient care or the outcome assessors were blinded and so we considered all trials to be at unclear or high risk of performance and detection bias.
Incomplete outcome data
Two trials had no post‐randomisation drop‐outs and we considered them to be at low risk of attrition bias (Barlow 2011; Ni 2013). The remaining trials had post‐randomisation drop‐outs, particularly; they excluded participants who developed complications during surgery, or participants who did not follow the protocol to which they were randomised.
Selective reporting
Four trials reported mortality and morbidity adequately and we considered them to be at low risk of selective reporting bias (Barlow 2011; Jones 2013; Kim 2012; Ni 2013). The remaining trials did not report the mortality and morbidity or did not report the severity of the morbidity; we were unable to locate the trial protocol for these trials to compare whether the outcomes reported in the final report were in the same order as in the protocol. We considered these trials to be at high risk of selective reporting.
Other potential sources of bias
Six trials reported the source of funding (Barlow 2011; Jones 2013; Kim 2012; Lemanu 2013; Ni 2013; Zhao 2014), out of which we considered five trials to be at low risk of bias due to source of funding (Barlow 2011; Jones 2013; Lemanu 2013; Ni 2013; Zhao 2014); the risk of bias due to source of funding was unclear in the remaining trials. We did not identify any other risks of bias in the trials which could have influenced the effect estimates.
Effects of interventions
None of the trials reported long‐term mortality, medium‐term health‐related quality of life, time to return to normal activity, or time to return to work. A summary of the effect estimates is available in summary of findings Table for the main comparison. The quality of evidence was low (mild adverse events: proportion and number of events, length of hospital stay, and costs) or very low (short‐term mortality, serious adverse events: proportion and number, health‐related quality of life, and readmissions) for the outcomes reported in the trials.
Primary outcomes
Short‐term mortality
Seven trials (868 participants) reported short‐term mortality (Barlow 2011; Jones 2013; Kim 2012; Liu 2010; Lu 2014; Ni 2013; Wang 2010). There was no statistically significant difference in the short‐term mortality between the enhanced recovery protocol and standard care (risk ratio (RR) 2.79, 95% confidence interval (CI) 0.44 to 17.73; Analysis 1.1). There was no change in the statistical significance by using the random‐effects model. There was no evidence of heterogeneity (I2 = 0%; P = 0.36).
Serious adverse events
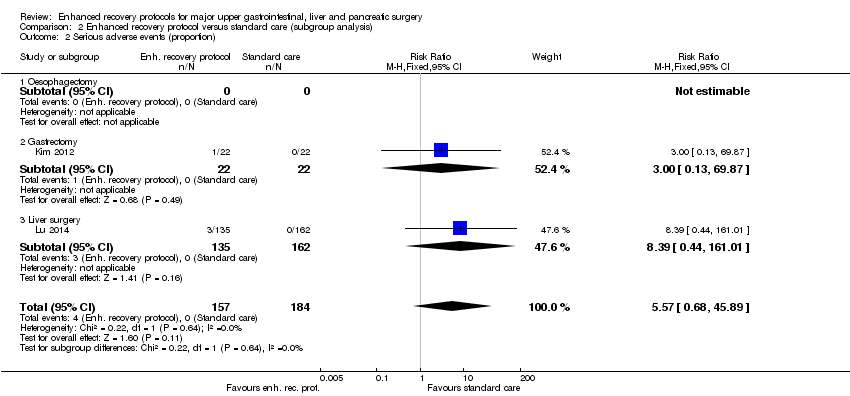
Two trials (341 participants) reported the proportion of participants with serious adverse events (Kim 2012; Liu 2010). There was no statistically significant difference in the proportion of participants with serious adverse events between the enhanced recovery protocol and standard care (RR 5.57, 95% CI 0.68 to 45.89; Analysis 1.2). There was no change in the statistical significance by using the random‐effects model. There was no evidence of heterogeneity (I2 = 0%; P = 0.64).
Seven trials (859 participants) reported the number of serious adverse events (Barlow 2011; Jones 2013; Kim 2012; Lemanu 2013; Lu 2014; Ni 2013; Zhao 2014). There was no statistically significant difference in the number of participants with serious adverse events between the enhanced recovery protocol and standard care (rate ratio 0.72, 95% CI 0.45 to 1.13; Analysis 1.3). There was no change in the statistical significance by using the random‐effects model. There was no evidence of heterogeneity (I2 = 16%; P = 0.31).
Health‐related quality of life (until three months)
Four trials (373 participants) reported health‐related quality of life (Jones 2013; Kim 2012; Lemanu 2013; Ni 2013). One trial measured health‐related quality of life at five days after surgery using the General Comfort Questionnaire (GCQ measured by Kolcaba Line; Ni 2013). Two trials measured health‐related quality of life at 14 days after surgery using the Surgical Recovery Scale (which measures postoperative fatigue) (Lemanu 2013), and the European Organisation for Research and Treatment of Cancer (EORTC) QLQ C‐30 (Kim 2012). One trial measured the health‐related quality of life at various time points until 28 days after surgery using the EQ‐5D questionnaire and reported the area under the curve of the health‐related quality of life (Jones 2013). The health‐related quality of life was statistically significantly better with enhanced recovery protocols than standard care using the fixed‐effect model (standardised mean difference (SMD) 0.33, 95% CI 0.13 to 0.54). However, on using the random‐effects model, there was no statistically significant difference in the health‐related quality of life between the enhanced recovery protocol and standard care (SMD 0.29, 95% CI ‐0.04 to 0.62) (Analysis 1.4). There was moderate heterogeneity (I2 = 57%; P = 0.07). The mean and standard deviation were imputed from the median and P value from one of the trials (Jones 2013). Exclusion of this trial did not alter the statistical significance of the results (SMD 0.17, 95% CI ‐0.19 to 0.53; Analysis 3.1).
Secondary outcomes
Mild adverse events
Four trials (525 participants) reported the proportion of participants with mild adverse events (Barlow 2011; Kim 2012; Liu 2010; Lu 2014). The proportion of participants with mild adverse events was statistically significantly better with enhanced recovery protocols than standard care (RR 0.58, 95% CI 0.39 to 0.85) (Analysis 1.5). There was no change in the statistical significance by using the random‐effects model. There was no evidence of heterogeneity (I2 = 0%; P = 0.87).
Nine trials (1014 participants) reported the number of mild adverse events (Barlow 2011; Jones 2013; Kim 2012; Lemanu 2013; Liu 2010; Lu 2014; Ni 2013; Wang 2010; Zhao 2014). The number of mild adverse events was statistically significantly better with enhanced recovery protocols than standard care (rate ratio 0.52, 95% CI 0.39 to 0.70; Analysis 1.6). There was no change in the statistical significance by using the random‐effects model. There was no evidence of heterogeneity (I2 = 0%; P = 0.47).
Length of hospital stay
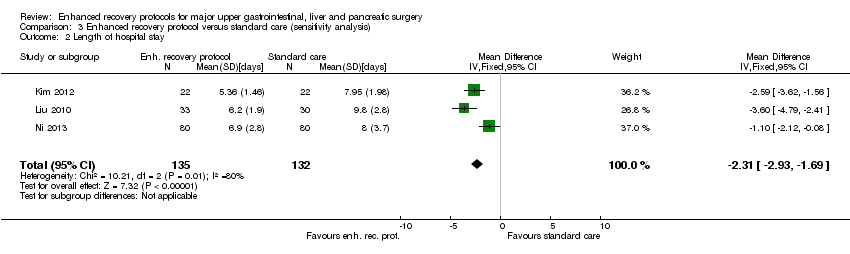
Nine trials (1014 participants) reported length of hospital stay (Barlow 2011; Jones 2013; Kim 2012; Lemanu 2013; Liu 2010; Lu 2014; Ni 2013; Wang 2010; Zhao 2014). The length of hospital stay reported in the trials included only the length of hospital stay during the admission for surgery and does not include the readmissions. The length of hospital stay was statistically significantly shorter with enhanced recovery protocols than standard care (MD ‐2.19 days, 95% CI ‐2.53 to ‐1.85; Analysis 1.7). There was no change in the statistical significance by using the random‐effects model. There was moderate heterogeneity (I2 = 66%; P = 0.003). The mean and standard deviation were imputed from the median and interquartile range or P value from six trials (Barlow 2011; Jones 2013; Lemanu 2013; Lu 2014; Wang 2010; Zhao 2014). The difference in the median hospital stay between enhanced recovery protocols and standard care ranged from one day and five days favouring enhanced recovery protocols (shorter hospital stay in enhanced recovery protocols). Excluding the trials in which mean and standard deviation were imputed did not alter the clinical or statistical significance of the results (MD ‐2.31 days, 95% CI ‐2.93 to ‐1.69; Analysis 3.2).
Readmissions
Seven trials (733 participants) reported hospital readmissions (Jones 2013; Kim 2012; Lemanu 2013; Liu 2010; Lu 2014; Wang 2010; Zhao 2014). There was no statistically significant difference in the proportion of participants requiring hospital readmissions between enhanced recovery protocols and standard care (RR 1.40, 95% CI 0.69 to 2.87; Analysis 1.8). There was no change in the statistical significance by using the random‐effects model. There was no evidence of heterogeneity (I2 = 0%; P = 0.84).
Costs
Four trials (282 participants) reported hospital costs (Kim 2012; Lemanu 2013; Wang 2010; Zhao 2014). The costs were reported in US dollars (USD) in one trial (Kim 2012), New Zealand dollars (NZD) in one trial (Lemanu 2013), and Chinese renminbi (CNY) in two trials (Wang 2010; Zhao 2014). All the currencies were converted to USD using the conversion rates of those currencies on www.xe.com on 2 April 2015. The hospital costs were statistically significantly lower with enhanced recovery protocols than standard care (MD ‐6300 USD, 95% CI ‐8400 to ‐4200; Analysis 1.9). There was no change in the statistical significance by using the random‐effects model. There was no evidence of heterogeneity (I2 = 12%; P = 0.33). The mean and standard deviation were imputed from the median and P value from one trial (Zhao 2014). Excluding this trial did not alter the clinical or statistical significance of the results (MD ‐6000 USD, 95% CI 8100 to 3900; Analysis 3.3).
Subgroup analysis
Of the planned subgroup analysis, we did not perform a subgroup analysis of the different elements of enhanced recovery protocols since there was considerable overlap between the trials in terms of the different elements of enhanced recovery protocols that was incorporated in the intervention arm of the trial (Table 1). None of the trials included children, so we did not perform a subgroup analysis of adults versus children. Amongst the different surgeries, only gastrectomy and liver surgery were surgeries that were assessed in two or more trials. We could not obtain the results of the test for subgroup differences for short‐term mortality since there was no short‐term mortality after gastrectomy in the trials included in the subgroup analysis (Analysis 2.1). The tests for subgroup differences were not statistically significant for proportion or number of serious adverse events. The test for subgroup differences was statistically significant for health‐related quality of life (P = 0.01) with the enhanced recovery protocol appearing beneficial mainly for liver surgery.
Discussion
Summary of main results
In this meta‐analysis we found that the proportion of people with mild adverse events, the number of mild adverse events, the length of hospital stay and costs were lower with enhanced recovery protocols compared to standard care after major upper gastrointestinal, liver and pancreatic surgery. There were no statistically significant differences in short‐term mortality, the proportion of people with serious adverse events, the number of serious adverse events, short‐term health‐related quality of life, and the proportion of people requiring readmissions. None of the trials reported long‐term mortality, medium‐term health‐related quality of life, time to return to normal activity or time to return to work.
While mortality and serious adverse events are clinically more important than mild adverse events, an intervention that decreases mild adverse events can be considered useful and can be recommended if it is cost‐effective. Enhanced recovery protocols reduced the length of hospital stay and costs. This is important for the vast majority of the healthcare funders, irrespective of whether the healthcare is funded by the state or the patients. On this basis, enhanced recovery protocols appear to be a useful intervention if the evidence is reliable. However, the quality of evidence is low and the effect estimates observed in the trials may not be close to the true effect of the enhanced recovery protocols compared to standard care, as discussed in the section on Quality of the evidence.
The test for subgroup differences was statistically significant for quality of life with enhanced recovery protocols demonstrating an improved quality of life in liver surgery, however, there are two notes of caution. The first is that when many subgroup analyses are performed, there is a significant chance of getting spuriously positive results. So, the results of this subgroup analysis have to be interpreted with caution. The second is that we do not know whether the demonstrated increase in the quality of life in liver surgery is clinically significant.
Overall completeness and applicability of evidence
A variety of surgeries on the oesophagus, stomach, liver and pancreas were included in this review. So, this evidence is applicable in these surgeries. However, it should be noted that only people with good performance status and low anaesthetic risk were included in the trials and so the evidence from this review is applicable only to such people.
Quality of the evidence
The overall quality of the evidence is low or very low as indicated in summary of findings Table for the main comparison. The factors that introduce bias and make the effect estimates unreliable are as follows. One of the major sources of bias in the trials included in this review is the lack of blinding of even the healthcare providers who assess the outcomes, including the adverse events, and make decisions on hospital discharge. Despite the use of specific definitions for adverse events being used for one trial (Barlow 2011), and predefined criteria for hospital discharge for four trials (Barlow 2011; Jones 2013; Liu 2010; Wang 2010), lack of observer blinding can result in bias of these outcomes. This is because adverse events and hospital stay are subjective outcomes since the criteria used for assessment of these outcomes (even if the trials had prespecified criteria) are subjective. Only one trial reported observer blinding for decision on discharge (Jones 2013), while none of the trials used observer blinding for serious adverse events. While it is difficult or even impossible to blind the participants and healthcare providers for some elements of enhanced recovery protocols (preoperative education and early mobilisation), it is possible to blind the outcome assessors for all the elements of enhanced recovery protocols by use of a second surgical team.
Another major source of bias is attrition bias. By excluding participants in whom the protocol was violated or who developed complications intraoperatively, the benefits of enhanced recovery protocols on the length of hospital stay and costs will be overestimated. The length of hospital stay reported in the trials did not include the length of hospital stay during readmissions. This will again overestimate the effect of the enhanced recovery protocol group on the length of hospital stay and costs. If there were no clinically significant differences in the number of people with serious adverse events or readmissions, the effect estimate of the enhanced recovery protocol on the length of hospital stay and costs will be shifted towards null effect. If there were more serious adverse events and readmissions in the enhanced recovery protocols, the balance of benefits and harms of enhanced recovery protocols compared to standard care will again be shifted. Future trials should include all randomised participants and perform an intention‐to‐treat analysis so that a reasonable estimate of the effect of the enhanced recovery protocol can be obtained and used to guide clinical practice. None of the studies included the organisational costs of implementing enhanced recovery protocols. While heterogeneity was noted in some of the outcomes, this was mainly in the magnitude of effect rather than the direction of effect. Heterogeneity appears to be less of a threat to the validity of the results compared to the other factors (lack of blinding of outcome assessors, attrition bias, and the way that the length of hospital stay and costs were measured). However, there is a potential for different effects of enhanced recovery protocols in different surgeries, and so future trials should report the effects of enhanced recovery protocols in different surgeries as subgroups.
Potential biases in the review process
We performed a thorough literature search using formal search strategies. At least two review authors independently identified trials for inclusion and extracted data, thus minimising errors in these aspects. We examined the influence of our imputations using sensitivity analyses which did not alter the clinical or statistical significance of the results. We were unable to explore publication bias because none of the outcomes had 10 or more trials. However, we searched the trial registers. Since the enhanced recovery protocol is a relatively new intervention, we anticipate that trials related to this topic are registered prospectively. However, four trials are awaiting further assessment (Geubbels 2014; Jin 2013; NCT02348229; Wang 2014), and four trials are currently ongoing (JPRN‐UMIN000011572; JPRN‐UMIN000014068; NCT01766765; NCT01938313). The inclusion of these trials may alter the conclusions of the review.
Agreements and disagreements with other studies or reviews
This is the first systematic review to compare enhanced recovery protocols with standard care in people undergoing major upper gastrointestinal, liver and pancreatic surgeries. We identified three systematic reviews with meta‐analysis on the role of enhanced recovery protocols versus standard care in people undergoing gastrectomy (Chen 2015; Li 2014; Yu 2014). The authors of these systematic reviews concluded that the length of hospital stay and costs are reduced with enhanced recovery protocols compared to standard care (Chen 2015; Li 2014; Yu 2014). While we observed similar results in our systematic review, we are unable to determine the validity of the results because of the reasons stated in the section on Quality of the evidence.

Study flow diagram.

Risk of bias graph: review authors' judgements about each risk of bias item presented as percentages across all included studies.
Risk of bias summary: review authors' judgements about each risk of bias item for each included study.

Comparison 1 Enhanced recovery protocol versus standard care, Outcome 1 Short‐term mortality.

Comparison 1 Enhanced recovery protocol versus standard care, Outcome 2 Serious adverse events (proportion).

Comparison 1 Enhanced recovery protocol versus standard care, Outcome 3 Serious adverse events (number).
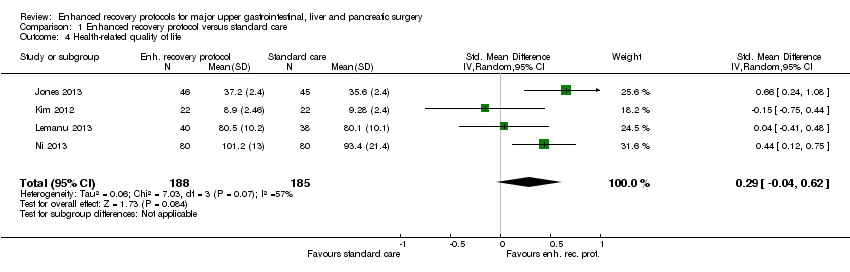
Comparison 1 Enhanced recovery protocol versus standard care, Outcome 4 Health‐related quality of life.

Comparison 1 Enhanced recovery protocol versus standard care, Outcome 5 Mild adverse events (proportion).
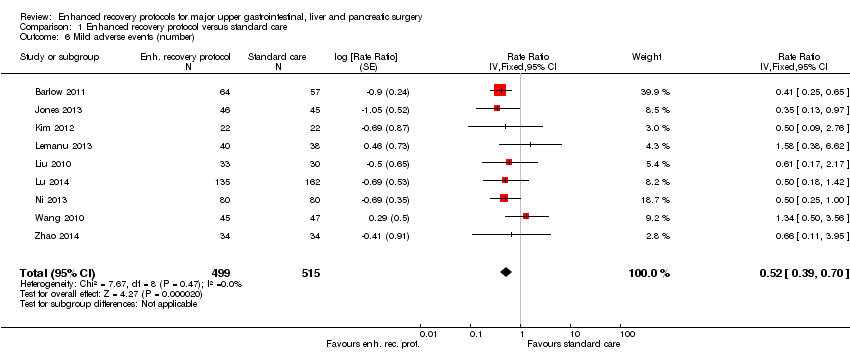
Comparison 1 Enhanced recovery protocol versus standard care, Outcome 6 Mild adverse events (number).

Comparison 1 Enhanced recovery protocol versus standard care, Outcome 7 Length of hospital stay.

Comparison 1 Enhanced recovery protocol versus standard care, Outcome 8 Readmissions.

Comparison 1 Enhanced recovery protocol versus standard care, Outcome 9 Costs.

Comparison 2 Enhanced recovery protocol versus standard care (subgroup analysis), Outcome 1 Short‐term mortality.
Comparison 2 Enhanced recovery protocol versus standard care (subgroup analysis), Outcome 2 Serious adverse events (proportion).

Comparison 2 Enhanced recovery protocol versus standard care (subgroup analysis), Outcome 3 Serious adverse events (number).

Comparison 2 Enhanced recovery protocol versus standard care (subgroup analysis), Outcome 4 Health‐related quality of life.

Comparison 3 Enhanced recovery protocol versus standard care (sensitivity analysis), Outcome 1 Health‐related quality of life.
Comparison 3 Enhanced recovery protocol versus standard care (sensitivity analysis), Outcome 2 Length of hospital stay.

Comparison 3 Enhanced recovery protocol versus standard care (sensitivity analysis), Outcome 3 Costs.
| Enhanced recovery protocols versus standard care for major upper gastrointestinal, liver and pancreatic surgery | ||||||
| Patient or population: people with major upper gastrointestinal, liver and pancreatic surgery Control: standard care | ||||||
| Outcomes | Illustrative comparative risks* (95% CI) | Relative effect | No of Participants | Quality of the evidence | Comments | |
| Assumed risk | Corresponding risk | |||||
| Control | Enhanced recovery protocol versus standard care | |||||
| None of the trials reported long‐term mortality, medium‐term health‐related quality of life (3 months to 1 year), time to return to normal activity, or time to return to work. | ||||||
| Short‐term mortality | 2 per 1000 | 6 per 1000 | RR 2.79 | 868 | ⊕⊝⊝⊝ | |
| Serious adverse events (proportion) | 1 per 1000 | 6 per 1000 | RR 5.57 (0.68 to 45.89) | 341 | ⊕⊝⊝⊝ | Since there were no serious adverse events in the control group (in the two trials that reported the proportion of participants with serious adverse events), the control group risk was stated as 0.1% for this outcome alone |
| Serious adverse events (number) | 105 per 1000 | 76 per 1000 | Rate ratio 0.72 | 859 | ⊕⊝⊝⊝ | |
| Health‐related quality of life (until 3 months) | The mean health‐related quality of life in the intervention groups was | 373 | very low1,4 | SMD 0.29 (‐0.04 to 0.62) | ||
| Mild adverse events (proportion) | 188 per 1000 | 109 per 1000 | RR 0.58 | 525 | ⊕⊕⊝⊝ | |
| Mild adverse events (number) | 249 per 1000 | 129 per 1000 | Rate ratio 0.52 | 1014 | ⊕⊕⊝⊝ | |
| Length of hospital stay | The mean length of hospital stay in the control groups was | The mean length of hospital stay in the intervention groups was | 1014 | ⊕⊕⊝⊝ | The length of hospital stay reported in the trials included only the length of hospital stay during the admission for surgery and does not include the readmissions | |
| Readmissions | 24 per 1000 | 33 per 1000 | RR 1.4 | 733 | ⊕⊝⊝⊝ | |
| Costs | The mean costs in the control groups were | The mean costs in the intervention groups were | 282 | ⊕⊕⊝⊝ | ||
| *The basis for the assumed risk is the mean control group risk. The corresponding risk (and its 95% confidence interval) is based on the assumed risk in the comparison group and the relative effect of the intervention (and its 95% CI). | ||||||
| GRADE Working Group grades of evidence | ||||||
| 1 The risk of bias was high in all the trials. | ||||||
| Study name | Surgery | Preoperative education | Pain relief protocol | Early mobilisation protocol | Nutritional protocol | Growth factors | Outcomes reported |
| Major upper gastrointestinal surgery (oesophagectomy, gastrectomy and pancreatectomy) | No | No | No | Yes | No |
| |
| Open liver surgery | Yes | No | Yes | Yes | No |
| |
| Laparoscopic distal gastrectomy | Yes | Yes | Yes | Yes | No |
| |
| Laparoscopic sleeve gastrectomy | Yes | Yes | Yes | Yes | No |
| |
| Gastrectomy | Yes | Yes | Yes | Yes | No |
| |
| Liver surgery | No | No | Yes | Yes | No |
| |
| Gastrectomy | No | No | No | No | Yes | None of the outcomes of interest were reported | |
| Partial liver resection | Yes | Yes | Yes | Yes | No |
| |
| Gastrectomy | Yes | Yes | Ys | Yes | No |
| |
| Oesophagectomy | Yes | Yes | N | No | No |
| |
| The table shows the surgeries that the participants underwent, the elements of enhanced recovery protocol that were different between the intervention and control, and the outcomes reported in the trials. | |||||||
| Outcome or subgroup title | No. of studies | No. of participants | Statistical method | Effect size |
| 1 Short‐term mortality Show forest plot | 7 | 868 | Risk Ratio (M‐H, Fixed, 95% CI) | 2.79 [0.44, 17.73] |
| 2 Serious adverse events (proportion) Show forest plot | 2 | 341 | Risk Ratio (M‐H, Fixed, 95% CI) | 5.57 [0.68, 45.89] |
| 3 Serious adverse events (number) Show forest plot | 7 | 859 | Rate Ratio (Fixed, 95% CI) | 0.72 [0.45, 1.13] |
| 4 Health‐related quality of life Show forest plot | 4 | 373 | Std. Mean Difference (IV, Random, 95% CI) | 0.29 [‐0.04, 0.62] |
| 5 Mild adverse events (proportion) Show forest plot | 4 | 525 | Risk Ratio (M‐H, Fixed, 95% CI) | 0.58 [0.39, 0.85] |
| 6 Mild adverse events (number) Show forest plot | 9 | 1014 | Rate Ratio (Fixed, 95% CI) | 0.52 [0.39, 0.70] |
| 7 Length of hospital stay Show forest plot | 9 | 1014 | Mean Difference (IV, Fixed, 95% CI) | ‐2.19 [‐2.53, ‐1.85] |
| 8 Readmissions Show forest plot | 7 | 733 | Risk Ratio (M‐H, Fixed, 95% CI) | 1.40 [0.69, 2.87] |
| 9 Costs Show forest plot | 4 | 282 | Mean Difference (IV, Fixed, 95% CI) | ‐0.63 [‐0.84, ‐0.42] |
| Outcome or subgroup title | No. of studies | No. of participants | Statistical method | Effect size |
| 1 Short‐term mortality Show forest plot | 6 | 747 | Risk Ratio (M‐H, Fixed, 95% CI) | 0.98 [0.06, 15.17] |
| 1.1 Oesophagectomy | 0 | 0 | Risk Ratio (M‐H, Fixed, 95% CI) | 0.0 [0.0, 0.0] |
| 1.2 Gastrectomy | 3 | 548 | Risk Ratio (M‐H, Fixed, 95% CI) | 0.98 [0.06, 15.17] |
| 1.3 Liver surgery | 3 | 199 | Risk Ratio (M‐H, Fixed, 95% CI) | 0.0 [0.0, 0.0] |
| 2 Serious adverse events (proportion) Show forest plot | 2 | 341 | Risk Ratio (M‐H, Fixed, 95% CI) | 5.57 [0.68, 45.89] |
| 2.1 Oesophagectomy | 0 | 0 | Risk Ratio (M‐H, Fixed, 95% CI) | 0.0 [0.0, 0.0] |
| 2.2 Gastrectomy | 1 | 44 | Risk Ratio (M‐H, Fixed, 95% CI) | 3.0 [0.13, 69.87] |
| 2.3 Liver surgery | 1 | 297 | Risk Ratio (M‐H, Fixed, 95% CI) | 8.39 [0.44, 161.01] |
| 3 Serious adverse events (number) Show forest plot | 6 | Rate Ratio (Fixed, 95% CI) | 0.87 [0.53, 1.43] | |
| 3.1 Oesophagectomy | 1 | Rate Ratio (Fixed, 95% CI) | 0.33 [0.01, 8.12] | |
| 3.2 Gastrectomy | 2 | Rate Ratio (Fixed, 95% CI) | 1.10 [0.35, 3.49] | |
| 3.3 Liver surgery | 3 | Rate Ratio (Fixed, 95% CI) | 0.84 [0.48, 1.48] | |
| 4 Health‐related quality of life Show forest plot | 4 | 373 | Std. Mean Difference (IV, Random, 95% CI) | 0.29 [‐0.04, 0.62] |
| 4.1 Oesophagectomy | 0 | 0 | Std. Mean Difference (IV, Random, 95% CI) | 0.0 [0.0, 0.0] |
| 4.2 Gastrectomy | 2 | 122 | Std. Mean Difference (IV, Random, 95% CI) | ‐0.03 [‐0.39, 0.32] |
| 4.3 Liver surgery | 2 | 251 | Std. Mean Difference (IV, Random, 95% CI) | 0.52 [0.27, 0.77] |
| Outcome or subgroup title | No. of studies | No. of participants | Statistical method | Effect size |
| 1 Health‐related quality of life Show forest plot | 3 | 282 | Std. Mean Difference (IV, Random, 95% CI) | 0.17 [‐0.19, 0.53] |
| 2 Length of hospital stay Show forest plot | 3 | 267 | Mean Difference (IV, Fixed, 95% CI) | ‐2.31 [‐2.93, ‐1.69] |
| 3 Costs Show forest plot | 3 | 214 | Mean Difference (IV, Fixed, 95% CI) | ‐0.60 [‐0.81, ‐0.39] |