Imunomodulatori i imunosupresivi za relapsno‐remitirajuću multiplu sklerozu: mrežna meta‐analiza
Referencias
References to studies included in this review
References to studies excluded from this review
References to ongoing studies
Additional references
References to other published versions of this review
Characteristics of studies
Characteristics of included studies [ordered by study ID]
| Methods | RCT | |
| Participants | Age: 19 to 60 years; definite RRMS; mean disease duration 4 years; mean EDSS 3.0; prior use of DMT not reported | |
| Interventions | Loading dose of immunoglobulins 0.4 g/kg body weight intravenously daily for 5 consecutive days followed by additional booster doses of immunoglobulins 0.4 g/kg body weight intravenously daily every 2 months for 24 months (n = 20) Placebo consisting of 0.9% saline administered with the same schedule as the active treatment (n = 20) | |
| Outcomes | Relapse at 12 and 24 months. Disability worsening at 24 months | |
| Notes | Funding: Miles Inc. Cutter Biological, Bayer and Promedico | |
| Risk of bias | ||
| Bias | Authors' judgement | Support for judgement |
| Random sequence generation (selection bias) | Low risk | "Patients were assigned to receive immunoglobulin or placebo by a block‐stratified randomisation procedure, designed to ensure groups balanced for YER, age, and disease duration" (Page 399) |
| Allocation concealment (selection bias) | Unclear risk | "Randomization was performed at the pharmacy, and the bottles of immunoglobulin or placebo were wrapped in sealed opaque bags and brought to the patients' rooms. The entire IV set was covered by an opaque plastic bag to ensure that any possible fluid turbidity or frothing would not be evident to the investigators or patients" (Page 399) |
| Blinding of participants and personnel (performance bias) | Low risk | "All patients and evaluators were blinded to treatment" (Page 399) |
| Blinding of outcome assessment (detection bias) | Low risk | "A relapse was confirmed only when the patient's symptoms were accompanied by objective changes on neurologic examination by the treating neurologist who was blind to the patient's treatment", and "Upon entry, and monthly thereafter, every patient underwent a neurologic examination by two examining neurologists, and an independent EDSS score was recorded by each" (Page 399) |
| Incomplete outcome data (attrition bias) | Low risk | Overall, 5.0% were lost to follow‐up (5.0% in immunoglobulins and 5.0% in placebo), without indication of the differences in reasons |
| Selective reporting (reporting bias) | Low risk | The published report included all pre‐specified primary benefit outcomes |
| Other bias | High risk | ‐ The study was sponsored by Triton Biosciences and the role of the study sponsor was unclear ‐ The primary benefit outcome measure for relapse (ARR) was strongly affected by differences among treatment groups both in the number of patients who discontinued the study and in time to discontinuation, which they did not report ‐ Relapse and disability worsening confirmed at 3 months outcomes were reported incompletely, and disability worsening confirmed at 6 months was not assessed |
| Methods | RCT | |
| Participants | Age: 18 to 65 years; definite RRMS; mean disease duration 7 years; mean EDSS 2.5; prior use of any MS medication at any time prior to the start of study: 17% | |
| Interventions | Peg‐interferon beta‐1a 125 μg subcutaneously once every 2 weeks for 12 months (n = 512) Peg‐interferon beta‐1a 125 μg subcutaneously once every 4 weeks for 12 months (n = 500) Placebo subcutaneously once every 2 weeks for 12 months (n = 500) | |
| Outcomes | Relapse at 12 months | |
| Notes | Funding: Biogen Idec | |
| Risk of bias | ||
| Bias | Authors' judgement | Support for judgement |
| Random sequence generation (selection bias) | Low risk | "Patients were randomly assigned (1:1:1) to receive subcutaneous injections with pre‐filled syringes of placebo, peginterferon beta‐1a at a dose of 125 μg once every 2 weeks, or peginterferon beta‐1a 125 μg once every 4 weeks, stratified by site" (Page 658) |
| Allocation concealment (selection bias) | Low risk | "Randomisation was done by a centralised interactive voice response and web system. Placebo was a matched diluent, given with a matched pre‐filled syringe. Patients received either study drug or placebo every 2 weeks to maintain masking; those assigned to receive study drug every 4 weeks received alternate injections of placebo and peginterferon beta‐1a every 2 weeks" (Page 658) |
| Blinding of participants and personnel (performance bias) | Low risk | "All study management and site personnel, investigators, and patients were masked to treatment assignment" (Page 658) |
| Blinding of outcome assessment (detection bias) | Unclear risk | "Each site had separate examining and treating neurologists, thereby maintaining rater masking for all treatment groups" and "relapse was confirmed by the independent neurological evaluation committee" (Page 658) |
| Incomplete outcome data (attrition bias) | High risk | Overall, 11.9% were lost‐to follow‐up (14.5% in peg‐interferon beta‐1a 125 μg every 2 weeks, 12.4% in peg‐interferon beta‐1a 125 μg every 4 weeks, and 8.8% in placebo), with some indication of the differences in reasons: adverse events of 4.8% in peg‐interferon beta‐1a 125 μg every 2 weeks, 4.7% in peg‐interferon beta‐1a 125 μg every 4 weeks, and 1.0% in placebo |
| Selective reporting (reporting bias) | Low risk | The published report included all pre‐specified primary benefit outcomes |
| Other bias | High risk | ‐ The study was sponsored by Biogen Idec, "Biogen Idec collected, analysed, and contributed to the interpretation of the data" (Page 659), and 5 co‐authors of the published paper were affiliated to the pharmaceutical company ‐ The primary benefit outcome measure for relapse (ARR) was strongly affected by differences among treatment groups both in the number of patients who discontinued the study and in time to discontinuation, which they did not report |
| Methods | RCT | |
| Participants | Age: 18 to 50 years; definite RRMS; median disease duration 5 years (range, 0 to 34 years); mean EDSS 2.3; prior use of DMT not reported | |
| Interventions | Natalizumab 300 mg by intravenous infusion once every 4 weeks for up to 116 weeks (n = 627) | |
| Outcomes | Relapse at 12 and 24 months. Disability worsening at 24 months | |
| Notes | Funding: Biogen Idec, Inc. and Elan Pharmaceutica | |
| Risk of bias | ||
| Bias | Authors' judgement | Support for judgement |
| Random sequence generation (selection bias) | Low risk | "Patients were randomly assigned to treatment that was stratified according to study site in blocks of three (two active, one placebo) with the use of a computer‐generated block randomization schedule" (Page 900) |
| Allocation concealment (selection bias) | Low risk | "A multidigit identification number, implemented by an interactive voice‐response system was used" (Page 900) |
| Blinding of participants and personnel (performance bias) | Low risk | "All study personnel, patients, sponsor personnel involved in the conduct of the study, and the investigator advisory committee were unaware of treatment assignments throughout the study", and "Treating neurologists were responsible for all aspects of patient care, including the management of adverse events and the treatment of relapsing disease" (Pages 900‐1) |
| Blinding of outcome assessment (detection bias) | Low risk | "Examining neurologists performed objective evaluation with use of the EDSS and neurologic examination during all study visits; they were not in contact with patients in any other capacity, so as to reduce the possibility of being unblinded by side effects or laboratory assessments", "Patients visited the clinic every 12 weeks for scoring on the EDSS", and "If a relapse was suspected, the patient was referred to the examining neurologist, who evaluated the patient within five days after the event" (Page 901) |
| Incomplete outcome data (attrition bias) | Low risk | Overall, 9.1% were lost‐to follow‐up (8.3% in natalizumab and 10.8% in placebo), without indication of the differences in reasons |
| Selective reporting (reporting bias) | Low risk | The published report included all pre‐specified primary benefit outcomes |
| Other bias | High risk | ‐ The study was sponsored by Biogen Idec and Elan Pharmaceuticals, "Data were analyzed by Biogen Idec and Elan Pharmaceuticals" (Page 909) and 4 co‐authors of the published paper were affiliated to the pharmaceutical company ‐ The primary benefit outcome measure for relapse (ARR) was strongly affected by differences among treatment groups both in the number of participants who discontinued the study and in time to discontinuation, which they did not report ‐ Relapse and disability worsening confirmed at 3 months outcomes were reported incompletely |
| Methods | RCT | |
| Participants | Age: 18 to 55 years; definite RRMS; mean disease duration 9 years; mean EDSS 2.6; prior use of DMT at any time prior to the start of study: 39.0% (38.2% in laquinimod and 39.7% in placebo) | |
| Interventions | Laquinimod 0.6 mg oral capsule once daily for 24 months (n = 550) Placebo oral capsule once daily for 24 months (n = 556) | |
| Outcomes | Relapse at 24 months. Disability worsening at 24 months | |
| Notes | Funding: Teva Pharmaceutical Industries | |
| Risk of bias | ||
| Bias | Authors' judgement | Support for judgement |
| Random sequence generation (selection bias) | Low risk | "The randomization list, stratified according to study center, was computer‐generated" (Page 1002) |
| Allocation concealment (selection bias) | Low risk | "The subject was allocated a screening number by the investigator using an Interactive Voice Response System (IVRS)" (Page 44 of Protocol) |
| Blinding of participants and personnel (performance bias) | Low risk | "Patients and investigators were unaware of the study assignments" (Page 1002) |
| Blinding of outcome assessment (detection bias) | Low risk | "Neurologic assessments and general medical evaluations were conducted by two neurologists in order to minimize the possibility of unblinding: an examining neurologist assessed neurologic condition, and the treating neurologist determined whether a patient had a relapse", and "the treating neurologist was unaware of the study‐group assignment" (Page 1002) |
| Incomplete outcome data (attrition bias) | High risk | Overall, 21.9% were lost‐to follow‐up (20.5% in laquinimod and 23.2% in placebo), with some indication of the differences in reasons: adverse event(s) in 7.6% in laquinimod and 5.0% in placebo |
| Selective reporting (reporting bias) | Low risk | The published report included all pre‐specified primary benefit outcomes |
| Other bias | High risk | ‐ "The sponsor designed and monitored the study" and "The data were collected and analyzed by the sponsor" (Page 1001) ‐ The primary benefit outcome measure for relapse (ARR) was strongly affected by differences among treatment groups both in the number of participants who discontinued the study and in time to discontinuation, which they did not report ‐ Relapse and disability worsening confirmed at 6 months outcomes were reported incompletely, and no additional data were provided on request |
| Methods | RCT | |
| Participants | Age: 18 to 55; definite RRMS or CIS; median time since MS onset 1 year; mean EDSS 2.0; all participants (except 1) were previously untreated patients | |
| Interventions | Interferon beta‐1b (Betaseron) 250 μg subcutaneously every other day for 24 months (n = 36) Glatiramer acetate 20 mg subcutaneous daily for 24 months (n = 39) | |
| Outcomes | Relapse at 12 and 24 months. Disability worsening at 24 months | |
| Notes | Funding: Bayer Schering Pharma | |
| Risk of bias | ||
| Bias | Authors' judgement | Support for judgement |
| Random sequence generation (selection bias) | Low risk | "Randomization was stratified by clinical site (Newark or Teaneck) and the presence of enhancement on screening MRI" (Page 1977) |
| Allocation concealment (selection bias) | Unclear risk | Nothing was said about allocation concealment |
| Blinding of participants and personnel (performance bias) | High risk | "Patients could not be blinded because of the characteristic injection reactions to IFN‐1b or GA" (Page 1977) |
| Blinding of outcome assessment (detection bias) | Unclear risk | "Subjective relapses that were confirmed by a blinded examining neurologist using worsening scores on either the Scripps Neurological Rating Scale (SNRS) or the Expanded Disability Status Scale (EDSS) were considered objective relapses" (Page 1977). However, it is not clear how and when the examining neurologist evaluated subjective relapses and EDSS scores |
| Incomplete outcome data (attrition bias) | Low risk | Overall, 14.7% were lost‐to follow‐up (19.4% in interferon beta‐1b and 10.3% in glatiramer acetate), without indication of the differences in reasons |
| Selective reporting (reporting bias) | Low risk | The published report included all pre‐specified primary benefit outcomes |
| Other bias | High risk | ‐ "The BECOME study was supported by Bayer Schering Pharma, distributors of IFN‐1b, but was investigator‐initiated and remains the intellectual property of New Jersey Medical School/University of Medicine & Dentistry of New Jersey. The sponsor of the study was allowed to comment on data interpretation and had the opportunity to review and comment on the final manuscript prior to submission. The sponsor was not allowed to participate in any of the following phases of the study: conduct of the study, data collection, data management, data analysis, and preparation of the manuscript" (Page 1981) ‐ Relapse outcome was reported incompletely, and no additional data were provided on request |
| Methods | RCT | |
| Participants | Age: 18 to 55 years; definite RRMS; mean disease duration 5 years; mean EDSS 2.3; prior use of DMT not reported | |
| Interventions | Interferon beta‐1b (Betaseron) 250 µg subcutaneous every other day for 24 months (n = 897) Interferon beta‐1b (Betaseron) 500 µg subcutaneous every other day for 24 months (n = 899) Glatiramer acetate 20 mg subcutaneous daily for 24 months (n = 448) | |
| Outcomes | Relapse at 24 months. Disability worsening at 24 months | |
| Notes | Funding: Bayer HealthCare Pharmaceuticals | |
| Risk of bias | ||
| Bias | Authors' judgement | Support for judgement |
| Random sequence generation (selection bias) | Low risk | "Use of SAS‐based block randomisation with regional stratification" (Page 890) |
| Allocation concealment (selection bias) | Unclear risk | "Patients were randomly assigned in a 2:2:1 ratio ... by the central randomisation group..." (Page 890) |
| Blinding of participants and personnel (performance bias) | High risk | "Physicians and patients were double‐blind to comparisons between the two doses of IFNß‐1b... Ibuprofen or acetaminophen were given at the same time as random assignment to IFNß‐1b, at least during the first 3 months, to reduce flu‐like symptoms. The treating physicians and the patients were therefore aware of treatment assignments" (Page 891) |
| Blinding of outcome assessment (detection bias) | Low risk | "The masked evaluating physicians did all neurological assessments and ascertained functional system and EDSS scores...The evaluating physicians were not involved in the care of patients and had no access to patient files or previous assessments", and "Patients covered their injection sites during neurological examination and did not discuss any adverse events with the evaluating physician" (Pages 891‐2) |
| Incomplete outcome data (attrition bias) | Low risk | Overall, 16.0% were lost‐to follow‐up (19.2% in interferon beta‐1b 500 µg, 12.6% in interferon beta‐1b 250 µg, and 16.5% in glatiramer acetate), without indication of the differences in reasons |
| Selective reporting (reporting bias) | Low risk | The published report included all pre‐specified primary benefit outcomes |
| Other bias | High risk | Relapse and disability worsening outcomes were reported incompletely |
| Methods | RCT | |
| Participants | Age: 20 to 35 years; definite RRMS; mean disease duration 6 years; mean EDSS 3.1; prior use of DMT not reported | |
| Interventions | Glatiramer acetate 20 mg subcutaneous daily for 24 months (n = 25) Placebo bacteriostatic saline subcutaneous daily for 24 months (n = 25) | |
| Outcomes | Relapse at 12 and 24 months. Disability worsening at 24 months | |
| Notes | Funding: grants from the NINCDS and the NIH, Bethesda, Md | |
| Risk of bias | ||
| Bias | Authors' judgement | Support for judgement |
| Random sequence generation (selection bias) | Unclear risk | "The random assignment of the first patient of a pair determined the assignment of both" (Page 409) |
| Allocation concealment (selection bias) | High risk | An open allocation schedule was used: "Treatment assignments were made known to the clinical assistant responsible for the production, labelling and distribution of medication" (Page 409) |
| Blinding of participants and personnel (performance bias) | High risk | "The patient's self evaluation of ... side effects were reported to the clinical assistant, who was not blinded to the treatment" (Page 409) |
| Blinding of outcome assessment (detection bias) | Low risk | "Patients visited the clinic every three months for two years. At each visit, a neurologist unaware of the patient's treatment group completed a neurologic examination and status evaluation" and "Patients were also seen at the time of suspected exacerbations ... the neurologist verified exacerbations on the basis of study criteria" (Page 409) |
| Incomplete outcome data (attrition bias) | Low risk | Overall, 4.0% were lost‐to follow‐up (0% in glatiramer acetate and 8.0% in placebo), without indication of the differences in reasons |
| Selective reporting (reporting bias) | Low risk | The published report included all pre‐specified primary benefit outcomes |
| Other bias | Low risk | The study appears to be free of other sources of bias |
| Methods | RCT | |
| Participants | Age: 18 to 55 years; definite RRMS; median disease duration 5 years; median EDSS 2.5; prior use of DMT at any time prior to the start of study: 7.4% (6.9% in laquinimod, 9.4% in interferon beta‐1a and 6.0% in placebo) | |
| Interventions | Laquinimod 0.6 mg oral capsule once daily for 24 months (n = 434) Interferon beta‐1a (Avonex) 30 µg intramuscular once a week for 24 months (n = 447) Placebo oral capsule once daily for 24 months (n = 450) | |
| Outcomes | Relapse at 24 months. Disability worsening at 24 months | |
| Notes | Funding: Teva Pharmaceutical Industries | |
| Risk of bias | ||
| Bias | Authors' judgement | Support for judgement |
| Random sequence generation (selection bias) | Low risk | "The computer‐generated randomization scheme prepared by the Teva Global Biostatistics Unit" (Page 775) |
| Allocation concealment (selection bias) | Unclear risk | "1:1:1 treatment assignment ratio stratified by study center, to laquinimod 0.6 mg capsule once‐daily, matching oral placebo, or IFNß‐1a IM 30 µg once‐weekly injection" (Page 775) |
| Blinding of participants and personnel (performance bias) | High risk | "Patients and treating neurologists were blinded to oral treatment assignment (laquinimod or placebo), but not to IFNb‐1a IM assignment", and "All patients, including those receiving oral treatment, wore clothing and/or a robe that ensured coverage of all potential IM injection sites during examination and were instructed not to discuss adverse events (AEs), routes of administration, or treatment assignments with the examining neurologist" (Page 775) |
| Blinding of outcome assessment (detection bias) | Low risk | "The examining neurologist was blinded to all treatments", and "The examining neurologist performed an EDSS assessment for relapse confirmation within 7 days of symptom onset" (Page 775) |
| Incomplete outcome data (attrition bias) | Low risk | Overall, 18.1% were lost‐to follow‐up (18.7% in laquinimod, 15.4% in interferon beta‐1a, and 20.2% in placebo), without indication of the differences in reasons |
| Selective reporting (reporting bias) | Low risk | The published report included all pre‐specified primary benefit outcomes |
| Other bias | High risk | ‐ "N. Sasson of Teva Pharmaceutical Industries provided statistical support for the manuscript" (Page 773), and 2 co‐authors of the published paper were affiliated to the pharmaceutical company ‐ The primary benefit outcome measure for relapse (ARR) was strongly affected by differences among treatment groups both in the number of participants who discontinued the study and in time to discontinuation, which they did not report |
| Methods | RCT | |
| Participants | Age: 18 to 50; definite RRMS; median time since first relapse 1 year; mean EDSS 1.9; all participants were previously untreated patients | |
| Interventions | Alemtuzumab 24 mg per day intravenously on 5 consecutive days during the first month and on 3 consecutive days at months 12 and 24 (n = 110) Alemtuzumab 12 mg per day intravenously on 5 consecutive days during the first month and on 3 consecutive days at months 12 and 24 (n = 113) Interferon beta‐1a (Rebif) 44 µg subcutaneous 3 times a week for 36 months (n = 111) All participants received 1 g of intravenous methylprednisolone for 3 days at baseline and at months 12 and 24 | |
| Outcomes | Relapse at 12, 24, and 36 months. Disability worsening at 24 and 36 months | |
| Notes | Funding: Genzyme (a Sanofi company) and Bayer Schering Pharma | |
| Risk of bias | ||
| Bias | Authors' judgement | Support for judgement |
| Random sequence generation (selection bias) | Low risk | "Eligible patients were randomly assigned in a 1:1:1 ratio to receive alemtuzumab (at a dose of either 12 mg per day or 24 mg per day) or interferon beta‐1a with the use of the Pocock and Simon minimization algorithm to balance the study groups with regard to age (<30 years or ≥30 years), sex, and baseline EDSS score (<2.0 or ≥2.0)" (Page 1787) |
| Allocation concealment (selection bias) | Low risk | "Patients were allocated via an interactive voice response system (IVRS)" (Information provided on request by Genzyme) |
| Blinding of participants and personnel (performance bias) | High risk | "Patients wore clothing that covered injection sites", and "Safety was assessed quarterly by the treating neurologist, who was aware of study‐group assignment" (Page 1787) |
| Blinding of outcome assessment (detection bias) | Unclear risk | "EDSS scores were determined quarterly in a blinded fashion by a neurologist who also adjudicated possible relapses. Patients wore clothing that covered injection sites" (Page 1787). It is not clear how potential relapses were assessed |
| Incomplete outcome data (attrition bias) | High risk | Overall, 25.1% were lost to follow‐up (16.4% in alemtuzumab 24 mg, 18.6% in alemtuzumab 12 mg, and 40.5% in interferon beta‐1a), with some indication of the differences in reasons: adverse events of 0.01% in alemtuzumab 24 mg, 1.8% in alemtuzumab 12 mg, and 11.7% in interferon beta‐1a; and lack of benefit of 1.8% in alemtuzumab 24 mg, 1.8% in alemtuzumab 12 mg, and 14.4% in interferon beta‐1a |
| Selective reporting (reporting bias) | Low risk | The published report included all pre‐specified primary benefit outcomes. Missing data not reported in the published paper were provided on request by Genzyme |
| Other bias | High risk | "Genzyme employees analyzed the data" (Page 1789), and 5 co‐authors of the published paper were affiliated to the pharmaceutical company |
| Methods | RCT | |
| Participants | Age: 18 to 50 years; definite RRMS; mean disease duration 2 years; mean EDSS 2.0; all participants were previously untreated patients | |
| Interventions | Alemtuzumab 12 mg per day intravenously on 5 consecutive days at month 0 and 3 consecutive days at month 12 (n = 386) Interferon beta‐1a (Rebif) 44 µg subcutaneous 3 times a week for 24 months (n = 195) Participants in both groups received 1 g per day of intravenous methylprednisolone on 3 consecutive days at baseline and at month 12. After a protocol amendment in January 2009, alemtuzumab patients received oral aciclovir 200 mg twice daily during alemtuzumab infusion and for 28 days thereafter as prophylaxis against herpes infection | |
| Outcomes | Relapse at 12 and 24 months. Disability worsening at 24 months | |
| Notes | Funding: Genzyme (a Sanofi company) | |
| Risk of bias | ||
| Bias | Authors' judgement | Support for judgement |
| Random sequence generation (selection bias) | Low risk | "We randomly allocated patients in a 2:1 ratio" and "Randomisation was stratified by site" (Page 1820) |
| Allocation concealment (selection bias) | Low risk | "We randomly allocated patients using an interactive voice response system" (Page 1820) |
| Blinding of participants and personnel (performance bias) | High risk | "Because both study drugs have adverse effects that precluded masking of patients and treating clinicians to treatment assignment, and because subcutaneous interferon beta 1a was available only in proprietary prefilled syringes that could not effectively be duplicated for placebo..." (Page 1820) |
| Blinding of outcome assessment (detection bias) | Unclear risk | "We secured clinical data integrity by stringent clinical and MRI rater masking, and adjudication of relapses by a committee comprising six independent and masked neurologists. In the absence of a masked rater, unmasked raters could submit EDSS assessments" (Page 1820). Moreover, it is not clear how and when the committee evaluated potential relapses |
| Incomplete outcome data (attrition bias) | High risk | Overall, 7.1% were lost to follow‐up (4.9% in alemtuzumab 12 mg and 11.3% in interferon beta‐1a), with some indication of the differences in reasons: adverse events of 2.6% in alemtuzumab and 0% in interferon beta‐1a |
| Selective reporting (reporting bias) | Low risk | The published report included all pre‐specified primary benefit outcomes |
| Other bias | High risk | "The study sponsor (Genzyme) was involved in the design and undertaking of the trial, data analysis and interpretation, writing of the manuscript, and the decision to submit the manuscript for publication. Bayer Schering Pharma participated in the design and oversight of the trial", "The sponsor did the statistical analyses" (Page 1822), and 4 co‐authors of the published paper were affiliated to the pharmaceutical company |
| Methods | RCT | |
| Participants | Age: 18 to 55 years; definite RRMS; mean disease duration 5 years; mean EDSS 2.7; all patients were previously treated: "at least one relapse while on interferon beta or glatiramer after at least 6 months of treatment" | |
| Interventions | Alemtuzumab 24 mg per day intravenously on 5 consecutive days at month 0 and 3 consecutive days at month 12 (n = 170; data presented for safety assessment only) Alemtuzumab 12 mg per day intravenously on 5 consecutive days at month 0 and 3 consecutive days at month 12 (n = 436) Interferon beta‐1a (Rebif) 44 µg subcutaneous 3 times a week for 24 months (n = 231) Participants in both groups received 1 g per day of intravenous methylprednisolone on 3 consecutive days at baseline and at month 12. After a protocol amendment in December 2008, alemtuzumab patients received oral aciclovir 200 mg twice daily during alemtuzumab infusion and for 28 days thereafter as prophylaxis against herpes infection | |
| Outcomes | Relapse at 12 and 24 months. Disability worsening at 24 months | |
| Notes | Funding: Genzyme (a Sanofi company) | |
| Risk of bias | ||
| Bias | Authors' judgement | Support for judgement |
| Random sequence generation (selection bias) | Low risk | "2:1 randomisation allocation stratified by site" (Pages 1830‐1) |
| Allocation concealment (selection bias) | Low risk | "We randomly allocated patients with an interactive voice response system" (Page 1830) |
| Blinding of participants and personnel (performance bias) | High risk | "Because both study drugs had adverse effects that precluded double‐blinding, and interferon beta 1a proprietary syringes could not effectively be duplicated for placebo..." (Page 1831) |
| Blinding of outcome assessment (detection bias) | Unclear risk | "Clinical data integrity was secured by stringent rater‐masking and independent adjudication of relapses. Raters, who were masked to treatment‐group assignment, did the EDSS assessments every 3 months and when a relapse was suspected" and "In the absence of a masked rater, unmasked raters could submit EDSS assessments" (Page 1831). Moreover, it is not clear how and when the raters evaluated potential relapses |
| Incomplete outcome data (attrition bias) | High risk | Overall, 11.4% were lost to follow‐up (4.6% in alemtuzumab 12 mg and 24.2% in interferon beta‐1a), with some indication of the differences in reasons: lack of benefit of 0% in alemtuzumab 12 mg and 2.6% in interferon beta‐1a |
| Selective reporting (reporting bias) | Low risk | The published report included all pre‐specified primary benefit outcomes |
| Other bias | High risk | ‐ "Genzyme (Sanofi) was involved in the design and undertaking of the trial, data analysis and interpretation, writing of the manuscript, and the decision to submit the manuscript for publication" (Page 1833), and 4 co‐authors of the published paper were affiliated to the pharmaceutical company ‐ Sample size reported in the article was not that estimated in the protocol but calculated after an amendment in December 2008 |
| Methods | RCT | |
| Participants | Age: 18 to 60 years; definite RRMS; mean disease duration 1 year; mean EDSS 2.0; all participants were previously untreated patients | |
| Interventions | Interferon beta‐1a (Avonex) 30 µg intramuscular once a week with matched placebo preparation for 36 months (n = 250) Glatiramer acetate 20 mg subcutaneous daily with matched placebo preparation for 36 months (n = 259) | |
| Outcomes | Relapse at 36 months. Disability worsening at 36 months | |
| Notes | Funding: National Institutes of Health (NIH) | |
| Risk of bias | ||
| Bias | Authors' judgement | Support for judgement |
| Random sequence generation (selection bias) | Low risk | "Participants were randomized via a computerized data entry system using a permuted block design within sites with block sizes of 6 and 12" (Page 328) |
| Allocation concealment (selection bias) | Low risk | "Participants were randomized via a computerized data entry system that masked treatment arm allocation" (Page 328) |
| Blinding of participants and personnel (performance bias) | Low risk | "Participants were randomized via a computerized data entry system that masked drug dispensing to participants and all site personnel for the entire duration of the trial period" (Page 328) |
| Blinding of outcome assessment (detection bias) | Unclear risk | "Treating clinician and an examining clinician were both blinded to treatment assignment", "confirmed progression was assessed by the blinded EDSS examiner and confirmed centrally", and "The designation of the type of relapse was determined centrally according to data entered onto a relapse assessment form and the change in EDSS" (Page 328‐329). The blinding of central commission was not reported |
| Incomplete outcome data (attrition bias) | High risk | Overall, 18.1% were lost to follow‐up (22.4% in interferon beta‐1a and 13.9% in glatiramer acetate; P value for proportion terminating early = 0.029), with some indication of the differences in reasons: adverse event(s) of 7.2% in interferon beta‐1a and 4.6% in glatiramer acetate |
| Selective reporting (reporting bias) | Low risk | The published report included all pre‐specified primary benefit outcomes |
| Other bias | High risk | ‐ The primary benefit outcome measure for relapse (ARR) was strongly affected by differences among treatment groups both in the number of patients who discontinued the study and in time to discontinuation, which they did not report ‐ Relapse and disability worsening confirmed at 6 months outcomes were reported incompletely, and no additional data were provided on request |
| Methods | RCT | |
| Participants | Age 18 to 50 years; definite RRMS; mean disease duration 8 years; mean EDSS 2.4; prior use of DMT not reported | |
| Interventions | Glatiramer acetate 20 mg subcutaneous daily for 9 months (n = 119) Placebo (not described) (n = 120) | |
| Outcomes | Relapse at 9 months | |
| Notes | Funding: Teva Pharmaceutical | |
| Risk of bias | ||
| Bias | Authors' judgement | Support for judgement |
| Random sequence generation (selection bias) | Low risk | "The randomization list, stratified by centers, was computer‐generated by the TEVA Statistical Data Management Department. Equal allocation of the two treatment groups was used" (Page 291) |
| Allocation concealment (selection bias) | Unclear risk | Not described |
| Blinding of participants and personnel (performance bias) | Unclear risk | "A treating neurologist was responsible for the overall medical management of the patient including safety monitoring ... All personnel were unaware of treatment allocation... both the treating neurologist and the patient were informed on the importance of not discussing safety issue with the examining neurologist" (Page 291) |
| Blinding of outcome assessment (detection bias) | Unclear risk | "An examining neurologist was responsible for all scheduled neurological examinations and exacerbation follow‐up" (Page 291) |
| Incomplete outcome data (attrition bias) | Low risk | Overall, 5.9% were lost to follow‐up (5.9% in glatiramer acetate and 5.8% in placebo), without indication of the differences in reasons |
| Selective reporting (reporting bias) | Low risk | The published report included all pre‐specified primary benefit outcomes |
| Other bias | High risk | ‐ The study was sponsored by Teva Pharmaceutical, and "Drs Stark, Gurevich, Kadosh, Zak, Pinchassi, and Ladkani are employees of Teva Pharmaceutical, Ltd., involved in trial design and execution, study management, database management, and statistical analysis" (Page 296) ‐ Relapse outcome was reported incompletely |
| Methods | RCT | |
| Participants | Age: 18 to 55 years; definite RRMS; mean disease duration (time since diagnosis) 5 years; mean EDSS 2.6; prior use of any MS medication at any time prior to the start of study: 40% to 41% across study groups | |
| Interventions | Dimethyl fumarate 240 mg oral capsule 3 times daily for 24 months (n = 345) Dimethyl fumarate 240 mg oral capsule 2 times daily for 24 months (n = 362) Glatiramer acetate 20 mg subcutaneous daily for 24 months (n = 350) Placebo oral capsule 3 times daily for 24 months (n = 363) | |
| Outcomes | Relapse at 12 and 24 months. Disability worsening at 24 months | |
| Notes | Funding: Biogen Idec | |
| Risk of bias | ||
| Bias | Authors' judgement | Support for judgement |
| Random sequence generation (selection bias) | Low risk | "Patients were randomly assigned in a 1:1:1:1 ratio to receive oral placebo, BG‐12 at a dose of 240 mg two times daily, BG‐12 at a dose of 240 mg three times daily, or subcutaneous daily injections of 20 mg of glatiramer acetate for 96 weeks" (Page 1088); and "The randomization was stratified by site" (Page 33 of Protocol) |
| Allocation concealment (selection bias) | Low risk | "Randomization took place across all study sites using a centralized Interactive Voice Response System (IVRS)" (Page 33 of Protocol) |
| Blinding of participants and personnel (performance bias) | High risk | "Patients receiving glatiramer acetate were aware of their treatment assignment. All study management and site personnel, investigators, and patients were unaware of assignment to the BG‐12 and placebo groups", and "To ensure that the assignments to the BG‐12 and placebo groups would not be revealed, patients in those groups were instructed not to take the study medication within 4 hours before each study visit, since a flushing reaction is known to be more common with BG‐12" (Page 1088). Since flushing is a known side effect of dimethyl fumarate, patients were possibly not blinded |
| Blinding of outcome assessment (detection bias) | Low risk | "An independent neurologic evaluation committee, whose members were unaware of the study‐group assignments, provided confirmation of relapses of multiple sclerosis" and "examining neurologists and members of the independent neurologic evaluation committee were unaware of all study‐group assignments" (Page 1088) |
| Incomplete outcome data (attrition bias) | High risk | Overall, 20.3% were lost to follow‐up (20.8% in dimethyl fumarate 240 mg 3 times daily, 20.7% in dimethyl fumarate 240 mg 2 times daily, 16.1% in glatiramer acetate, and 23.4% in placebo), with some indication of the differences in reasons: adverse events of 8.1% in dimethyl fumarate 240 mg 3 times daily, 6.1% in dimethyl fumarate 240 mg 2 times daily, 3.6% in glatiramer acetate, and 3.3% in placebo |
| Selective reporting (reporting bias) | High risk | The published report included all pre‐specified primary benefit outcomes. However, disability confirmed at 6 months was not reported in the published report, it was reported by the FDA in terms of survival probabilities |
| Other bias | High risk | ‐ The study was sponsored by Biogen Idec, "data were analyzed by the sponsor" (Page 1088), and 6 co‐authors of the published paper were affiliated to the pharmaceutical company ‐ The primary benefit outcome measure for relapse (ARR) was strongly affected by differences among treatment groups both in the number of participants who discontinued the study and in time to discontinuation, which they did not report |
| Methods | RCT | |
| Participants | Age: 18 to 55 years; definite RRMS; mean disease duration (time since diagnosis) 6 years; mean EDSS 2.4; prior use of DMT at any time prior to the start of study: 40.7% (40.4% in dimethyl fumarate 240 mg 3 times daily, 39.5% in dimethyl fumarate 240 mg 2 times daily, and 42.2% in placebo) | |
| Interventions | Dimethyl fumarate 240 mg oral capsule 3 times daily for 24 months (n = 416) Dimethyl fumarate 240 mg oral capsule 2 times daily for 24 months (n = 411) Placebo oral capsule 3 times daily for 24 months (n = 410) | |
| Outcomes | Relapse at 12 and 24 months. Disability worsening at 24 months | |
| Notes | Funding: Biogen Idec | |
| Risk of bias | ||
| Bias | Authors' judgement | Support for judgement |
| Random sequence generation (selection bias) | Low risk | "Patients were randomly assigned, in a 1:1:1 ratio, to receive BG‐12 at a dose of 240 mg twice daily, BG‐12 at a dose of 240 mg three times daily, or placebo. Randomization was performed centrally and was stratified according to site" (Page 1100) |
| Allocation concealment (selection bias) | Low risk | "Randomization was performed centrally" (Page 1100), and "Randomization took place across all study sites using a centralized Interactive Voice Response System (IVRS)" (Page 33 of Protocol) |
| Blinding of participants and personnel (performance bias) | Unclear risk | "Double‐blind", and "To ensure that the study‐group assignments would not be revealed, patients were instructed to take the assigned study drug at least 4 hours before study visits, in case patients in the BG‐12 groups had a side effect of flushing" (Page 1100). Since flushing is a known side effect of dimethyl fumarate, patients were possibly not blinded |
| Blinding of outcome assessment (detection bias) | Low risk | "To maintain concealment of the study‐group assignments, each study center used separate examining and treating neurologists (all of whom remained unaware of the assignments throughout the trial). The examining neurologists conducted neurologic assessments, including assessment of the EDSS score, whereas the treating neurologists were responsible for all aspects of patient care, including the treatment of relapses and other disease symptoms" and "relapses were evaluated by an independent neurologic evaluation committee, whose members reviewed a standardized set of blinded clinical records (which did not include MRI data) from the treating and examining neurologists" (Page 1100) |
| Incomplete outcome data (attrition bias) | High risk | Overall, 23.0% were lost to follow‐up (23.1% in dimethyl fumarate 240 mg 3 times daily, 23.4% in dimethyl fumarate 240 mg 2 times daily, and 22.7% in placebo), with some indication of the differences in reasons: adverse events of 8.7% in dimethyl fumarate 240 mg 3 times daily, 9.8% in dimethyl fumarate 240 mg 2 times daily, and 5.4% in placebo |
| Selective reporting (reporting bias) | High risk | The published report included all pre‐specified primary benefit outcomes. However, disability confirmed at 6 months was not reported in the published report, it was reported by the FDA in terms of survival probabilities |
| Other bias | High risk | The study was sponsored by Biogen Idec, "data were analyzed by the sponsor" (Page 1099), and 4 co‐authors of the published paper were affiliated to the pharmaceutical company |
| Methods | RCT | |
| Participants | Age: 13 to 50 years; definite RRMS; mean disease duration not reported ("short duration"); mean EDSS 1.5; all participants were previously untreated patients | |
| Interventions | Azathioprine 3 mg/kg body weight oral daily for 12 months (n = 47) Interferons beta (Betaseron, Avonex, or Rebif) for 12 months (n = 47: 15 Betaseron 250 μg subcutaneously every other day, 19 Avonex 30 µg intramuscular once a week, 13 Rebif 44 µg subcutaneous 3 times a week) | |
| Outcomes | Relapse at 12 months | |
| Notes | — | |
| Risk of bias | ||
| Bias | Authors' judgement | Support for judgement |
| Random sequence generation (selection bias) | Low risk | "Patients were randomized according to a preexisting list produced by a computer program that differed from a random number generator only in that it assigned equal numbers of patients into each treatment group" (Page 1724) |
| Allocation concealment (selection bias) | Unclear risk | "The first treatment group received IFNβ products regimen. The second group received AZA" (Page 1724) |
| Blinding of participants and personnel (performance bias) | High risk | "The trial was single blinded in that patients were aware but physicians who assessed the outcome were unaware of treatment type that the patient was receiving" (Page 1724) |
| Blinding of outcome assessment (detection bias) | Low risk | "The trial was single blinded in that patients were aware but physicians who assessed the outcome were unaware of treatment type that the patient was receiving", and "Two neurologists (ME and VS) who do not know which patients had received which treatment clinically evaluated all patients" (Page 1724‐5) |
| Incomplete outcome data (attrition bias) | Low risk | Overall, 6.4% were lost to follow‐up (6.4% in azathioprine and 6.4% in interferon beta), without indication of the differences in reasons |
| Selective reporting (reporting bias) | Low risk | The published report included all pre‐specified primary benefit outcomes |
| Other bias | Low risk | The study appears to be free of other sources of bias |
| Methods | RCT | |
| Participants | Age: 18 to 55 years; definite RRMS; mean disease duration 7 years; mean EDSS 2.3; prior use of DMT not reported | |
| Interventions | Interferon beta‐1a (Rebif) 44 µg subcutaneous 3 times a week for 12 months (n = 339) Interferon beta‐1a (Avonex) 30 µg intramuscular once a week for 12 months (n = 338) | |
| Outcomes | Relapse at 12 months | |
| Notes | Funding: Serono Inc. | |
| Risk of bias | ||
| Bias | Authors' judgement | Support for judgement |
| Random sequence generation (selection bias) | Low risk | "Computer‐generated scheme with block size of 6 followed by block size of 4" (Page 2033) |
| Allocation concealment (selection bias) | Unclear risk | Not described |
| Blinding of participants and personnel (performance bias) | High risk | "Patients and a treating physician who was not involved in end point assessment were aware of treatment assignments" (Page 2033) |
| Blinding of outcome assessment (detection bias) | Low risk | "Evaluating physicians who were blinded to the patients' treatment and symptoms performed all clinical exams" (Page 2033) |
| Incomplete outcome data (attrition bias) | Low risk | Overall, 10.6% were lost to follow‐up (11.8% in Rebif and 9.5% in Avonex), without indication of the differences in reasons |
| Selective reporting (reporting bias) | Low risk | The published report included all pre‐specified primary benefit outcomes |
| Other bias | High risk | ‐ The study was sponsored by Serono Inc., "The sponsor designed and implemented the study and managed the data" (Page 2047) ‐ Relapse outcome was reported incompletely |
| Methods | RCT | |
| Participants | Age: 15 to 64 years; definite RRMS; mean disease duration 7 years; mean EDSS 3.3; prior use of DMT not reported | |
| Interventions | Immunoglobulins 0.15 to 0.20 g/kg body weight intravenously monthly for 24 months (n = 75) Placebo intravenously monthly for 24 months (n = 75) | |
| Outcomes | Relapse at 24 months. Disability worsening at 24 months | |
| Notes | Funding: Sero‐Merieux (Vienna, Austria) | |
| Risk of bias | ||
| Bias | Authors' judgement | Support for judgement |
| Random sequence generation (selection bias) | Low risk | "Centralised computer‐generated randomisation schedule with stratification by centre, age, sex, and deterioration rate" (Page 590) |
| Allocation concealment (selection bias) | Low risk | "Randomly and centrally allocated" and "Infusions of IVIg and placebo were identical in appearance and were stored in plastic bags for concealment during administration" (Page 590) |
| Blinding of participants and personnel (performance bias) | Unclear risk | "At each monthly visit a neurologist who was aware of treatment allocation (treating physician) administered the study medication and asked the patient about any side‐effects" (Page 590) |
| Blinding of outcome assessment (detection bias) | Low risk | "Patients were assessed on the first day of treatment, every 6 months, and at the end of the 2‐year study by a different neurologist (assessing physician) who was unaware of treatment allocation", and "All patients were told to contact their centre as soon as there was any change in their condition. In such cases, the assessing physician examined the patient to confirm a possible relapse and to assess the severity of the disability" (Page 590) |
| Incomplete outcome data (attrition bias) | Low risk | Overall, 1.3% were lost to follow‐up (0% in immunoglobulins and 2.7% in placebo), without indication of the differences in reasons |
| Selective reporting (reporting bias) | Low risk | The published report included all pre‐specified primary benefit outcomes |
| Other bias | Unclear risk | ‐ The study was sponsored by Triton Biosciences and the role of the study sponsor was unclear ‐ Definition of sustained disability worsening was not clearly reported |
| Methods | RCT | |
| Participants | Age: 18 to 55 years; definite RRMS; mean disease duration 3 years; mean EDSS 2.0; prior use of DMT not reported | |
| Interventions | Immunoglobulins 0.2 g/kg body weight intravenously monthly for 12 months (n = 45) | |
| Outcomes | Relapse at 12 months | |
| Notes | Funding: Bayer HealthCare AG | |
| Risk of bias | ||
| Bias | Authors' judgement | Support for judgement |
| Random sequence generation (selection bias) | Low risk | "The random code number was computer generated by the Statistics and Data System Department of Bayer" (Page 266) |
| Allocation concealment (selection bias) | Unclear risk | "Randomisation performed by an unblinded pharmacist who assigned code numbers from sealed envelopes in a sequential manner" (Page 266) |
| Blinding of participants and personnel (performance bias) | Unclear risk | "Considerable effort was made to achieve optimal blinding, including the provision that all patients received a total volume of 4 mL/kg body weight per infusion, which was adjusted by the addition of dextrose 5%" (Page 266) |
| Blinding of outcome assessment (detection bias) | Unclear risk | Endpoints "assessed by an evaluating physician who was otherwise not involved in patient care" (Page 266) |
| Incomplete outcome data (attrition bias) | Low risk | Overall, 12.5% were lost to follow‐up (9.5% in immunoglobulins 0.4 g/kg, 17.8% in immunoglobulins 0.2 g/kg, and 9.8% in placebo), without indication of the differences in reasons |
| Selective reporting (reporting bias) | Low risk | The published report included all pre‐specified primary benefit outcomes |
| Other bias | High risk | ‐ The study was sponsored by Bayer HealthCare AG and the role of the study sponsor was unclear. 3 co‐authors of the published paper were affiliated to the pharmaceutical company ‐ Relapse outcome was reported incompletely |
| Methods | RCT | |
| Participants | Age: 18 to 55 years; definite RRMS; mean disease duration 8 years; mean EDSS 2.4; prior use of DMT at any time prior to the start of study: 40.9% (39.6% in fingolimod 1.25 mg, 42.6% in fingolimod 0.5 mg, and 40.4% in placebo) | |
| Interventions | Fingolimod 1.25 mg oral capsule once daily for 24 months (n = 429) Fingolimod 0.5 mg oral capsule once daily for 24 months (n = 425) Placebo oral capsule once daily for 24 months (n = 418) | |
| Outcomes | Relapse at 12 and 24 months. Disability worsening at 24 months | |
| Notes | Funding: Novartis Pharma | |
| Risk of bias | ||
| Bias | Authors' judgement | Support for judgement |
| Random sequence generation (selection bias) | Low risk | "Patients were randomly assigned, in a 1:1:1 ratio, to receive oral fingolimod capsules in a dose of 0.5 mg or 1.25 mg or matching placebo ... Randomization was performed ... with the use of stratification according to site, with a block size of six within each site" (Page 388) |
| Allocation concealment (selection bias) | Unclear risk | "Randomization was performed centrally, with the use of a validated system " (Page 388) |
| Blinding of participants and personnel (performance bias) | Unclear risk | "Double blind" (Page 388) |
| Blinding of outcome assessment (detection bias) | Low risk | "To ensure that all assessments remained unbiased regarding the study‐group assignments (i.e., unaffected by awareness of them), an independent, specially trained and certified examining neurologist determined all the EDSS scores" (Page 388). "Relapses were verified by the examining neurologist within 7 days after the onset of symptoms" (Page 389) |
| Incomplete outcome data (attrition bias) | High risk | Overall, 18.8% were lost to follow‐up (22.6% in fingolimod 1.25 mg, 13.2% in fingolimod 0.5 mg, and 20.6% in placebo), with some indication of the differences in reasons: unsatisfactory therapeutic effect 3.0% in fingolimod 1.25 mg, 1.4% in fingolimod 0.5 mg, and 6.0% in placebo; and abnormal laboratory values(s) 4.7% in fingolimod 1.25 mg, 2.1% in fingolimod 0.5 mg, and 0.2% in placebo |
| Selective reporting (reporting bias) | Low risk | The published report included all pre‐specified primary benefit outcomes |
| Other bias | High risk | ‐ The study was sponsored by Novartis Pharma, "data were analyzed by the sponsor" (Page 388), and 4 co‐authors of the published paper were affiliated to the pharmaceutical company ‐ The primary benefit outcome measure for relapse (ARR) was strongly affected by differences among treatment groups both in the number of participants who discontinued the study and in time to discontinuation, which they did not report |
| Methods | RCT | |
| Participants | Age: 18 to 55 years; definite RRMS; mean disease duration 11 years; mean EDSS 2.4; prior use of DMT at any time prior to the start of study: 74.8% (77.6% in fingolimod 1.25 mg, 73.7% in fingolimod 0.5 mg, and 73.0% in placebo) | |
| Interventions | Fingolimod 1.25 mg oral capsule once daily for 24 months (n = 370) Fingolimod 0.5 mg oral capsule once daily for 24 months (n = 358) Placebo oral capsule once daily for 24 months (n = 355) "After review of data from the FREEDOMS and TRANSFORMS phase 3 studies, completed on Nov 12, 2009, after consultation with and at the recommendation of the data and safety monitoring board, we decided to stop the 1·25 mg dose. Patients on the high dose were subsequently switched to the 0·5 mg dose in a blinded manner" (Page 546) | |
| Outcomes | Relapse at 12 and 24 months. Disability worsening at 24 months | |
| Notes | Funding: Novartis Pharma | |
| Risk of bias | ||
| Bias | Authors' judgement | Support for judgement |
| Random sequence generation (selection bias) | Low risk | "We randomly allocated patients (1:1:1; stratified by study centre) to receive oral fingolimod capsules in a dose of 0.5 mg or 1.25 mg or matching placebo, once daily for 24 months. The randomisation sequence was generated with an automated system under the supervision of the Novartis Drug Supply Management team" (Page 546) |
| Allocation concealment (selection bias) | Unclear risk | "To mask treatment allocation, both fingolimod and placebo were dispensed in hard gelatin capsules of identical colour and size and packed in identical bottles" (Page 546) |
| Blinding of participants and personnel (performance bias) | Low risk | "Patients, investigators, site personnel, independent evaluating physician, first dose administrator and all Novartis personnel were blinded to the study medication assignments from the time of randomisation until the database lock and data analysis for the double‐blind Treatment Phase was completed" (Appendix, Page 2) |
| Blinding of outcome assessment (detection bias) | Low risk | "The efficacy assessments (ie, confirmation of relapses, scheduled EDSS, ...) were done by an independent, specially trained, and certified assessor not otherwise involved in the treatment of patients)" (Page 546), "Patients were instructed not to discuss adverse events with the independent evaluating physician", "Another physician not otherwise involved in the care of the study patient monitored patients for 6 or more hours after administration of the first dose of the study drug to maintain blind for the known heart rate decrease with fingolimod upon first dose administration", "Clinical assessments were performed at screening and at randomization (baseline), and study visits were scheduled at 2 weeks and 1, 2, 3, 6, 9, 12, 15, 18, 21, and 24 months after randomization", and "In the case of MS relapse EDSS assessment was required at every unscheduled visit to confirm relapse" (Appendix, Page 2) |
| Incomplete outcome data (attrition bias) | High risk | Overall, 28.2% were lost to follow‐up (32.2% in fingolimod 1.25 mg, 24.0% in fingolimod 0.5 mg, and 28.2% in placebo), with some indication of the differences in reasons: unsatisfactory therapeutic effect 2.7% in fingolimod 1.25 mg, 1.7% in fingolimod 0.5 mg, and 4.8% in placebo; and adverse events or abnormal laboratory values(s) 12.7% in fingolimod 1.25 mg, 10.1% in fingolimod 0.5 mg, and 5.1% in placebo |
| Selective reporting (reporting bias) | Low risk | The published report included all pre‐specified primary benefit outcomes |
| Other bias | High risk | ‐ The study was sponsored by Novartis Pharma, "The study sponsor participated in the design of the study, conduct of the study, data collection, data management, data analysis and interpretation, and preparation, review, and approval of the paper" (Page 550), and 4 co‐authors of the published paper were affiliated to the pharmaceutical company ‐ The primary benefit outcome measure for relapse (ARR) was strongly affected by differences among treatment groups both in the number of participants who discontinued the study and in time to discontinuation, which they did not report |
| Methods | RCT | |
| Participants | Age: 18 to 55 years; definite RRMS; mean disease duration 8 years; mean EDSS 2.8; prior use of DMT at any time prior to the start of study: 13.6% (13.6% in glatiramer acetate and 13.7% in placebo) | |
| Interventions | Glatiramer acetate 40 mg subcutaneous 3 times a week for 12 months (n = 943) Placebo subcutaneous 3 times a week for 12 months (n = 461) | |
| Outcomes | Relapse at 12 months | |
| Notes | Funding: Teva Pharmaceutical Industries | |
| Risk of bias | ||
| Bias | Authors' judgement | Support for judgement |
| Random sequence generation (selection bias) | Low risk | "Eligible patients were assigned to treatment groups in a 2:1 ratio (GA 40mg tiw or placebo) according to the randomization scheme produced. The randomization scheme used constrained blocks stratified by center" (Page 706) |
| Allocation concealment (selection bias) | Unclear risk | "Study drugs were packaged and labeled in a way that maintained the masked nature of the study; the appearance, shape, color, and smell were identical" (Page 706) |
| Blinding of participants and personnel (performance bias) | Low risk | "The investigators, the sponsor, and any personnel involved in patients’ assessments, monitoring, analysis, and data management were blinded to treatment assignment" (Page 706) |
| Blinding of outcome assessment (detection bias) | Low risk | "Patients’ general medical assessments were performed separately from the neurological assessments by 2 neurologists or physicians. The examining neurologist/physician was responsible for all neurological assessments" and "All follow‐up neurological examinations were performed by the blinded examining neurologist" (Page 706‐7) |
| Incomplete outcome data (attrition bias) | Low risk | Overall, 8.2% were lost to follow‐up (8.9% in glatiramer acetate and 6.7% in placebo), without indication of the differences in reasons |
| Selective reporting (reporting bias) | Low risk | The published report included all pre‐specified primary benefit outcomes |
| Other bias | High risk | ‐ "This study was funded by Teva Pharmaceutical Industries, Petah Tikva, Israel. All members of the clinical advisory board, the country principal investigators, the Data Monitoring Committee (DMC), and the MRI Reading Center were reimbursed for their specific services on a contractual basis by Teva Pharmaceutical Industries" (Page 711) ‐ The primary benefit outcome measure for relapse (ARR) was strongly affected by differences among treatment groups both in the number of participants who discontinued the study and in time to discontinuation, which they did not report. ‐ Relapse outcome was reported incompletely, and no additional data were provided on request |
| Methods | RCT | |
| Participants | Age: 18 to 65 years; definite RRMS; mean disease duration 6 years; mean EDSS 3.5; prior use of DMT not reported | |
| Interventions | Azathioprine 3.0 mg/kg body weight oral daily for 24 months (n = 30) | |
| Outcomes | Relapse at 12 and 24 months. Disability worsening at 24 months | |
| Notes | Funding: Wellcome Company | |
| Risk of bias | ||
| Bias | Authors' judgement | Support for judgement |
| Random sequence generation (selection bias) | Low risk | "Randomised by the statistician using random number tables" (Page 21) |
| Allocation concealment (selection bias) | Unclear risk | Not described |
| Blinding of participants and personnel (performance bias) | Low risk | Patients and personnel were blinded, "group PLC received indistinguishable placebo", and "whenever the treating physician made a dose change for an AZA patient, a similar dose change was simultaneously made for a matched placebo patient to preserve the blind" (Pages 20‐1) |
| Blinding of outcome assessment (detection bias) | Low risk | "Each patient had the same masked examining neurologist and unmasked treating neurologist for the duration of the study. Standardized neurologic examinations were recorded at study entry and at 6 month intervals by the examining neurologist unless the patient reported subjective worsening, in which case an examination was performed as soon as was practical" (Page 21) |
| Incomplete outcome data (attrition bias) | Low risk | Overall, 11.9% were lost to follow‐up (10.0% in azathioprine and 13.8% in placebo), without indication of the differences in reasons |
| Selective reporting (reporting bias) | Low risk | The published report included all pre‐specified primary benefit outcomes |
| Other bias | Unclear risk | Definition of sustained disability worsening not clearly reported |
| Methods | RCT | |
| Participants | Age: 18 to 50 years; definite RRMS; mean disease duration (time since diagnosis) 4 years; mean EDSS 2.9; prior use of DMT not reported | |
| Interventions | Interferon beta‐1b (Betaseron) 250 µg subcutaneous every other day for 24 months (n = 124) Interferon beta‐1b (Betaseron) 50 µg subcutaneous every other day for 24 months (n = 125) Placebo subcutaneous every other day for 24 months (n = 123) | |
| Outcomes | Relapse at 24 months. Disability worsening at 24 months | |
| Notes | Funding: Triton Biosciences, Inc., Alameda, CA and Berlex Laboratories Inc. | |
| Risk of bias | ||
| Bias | Authors' judgement | Support for judgement |
| Random sequence generation (selection bias) | Unclear risk | Not described |
| Allocation concealment (selection bias) | Unclear risk | Not described |
| Blinding of participants and personnel (performance bias) | Unclear risk | "Each placebo vial contained only similar quantity of albumin and dextrose", "All personnel were blinded to treatment categories", and "One treating neurologist who knew about side effects, reviewed laboratory findings for toxicity, and was responsible for overall care" (Page 656) |
| Blinding of outcome assessment (detection bias) | Unclear risk | "One neurologist who was not aware of drug side effects to do the periodic examinations" (Page 656). However, it is not clear how and when potential relapses and EDSS were assessed |
| Incomplete outcome data (attrition bias) | Unclear risk | Overall, 9.1% were lost to follow‐up (7.3% in interferon beta‐1b 250 µg, 11.2% in interferon beta‐1b 50 µg, and 8.9% in placebo). Nothing was said about the reasons for study discontinuation |
| Selective reporting (reporting bias) | Low risk | The published report included all pre‐specified primary benefit outcomes |
| Other bias | High risk | ‐ The study was sponsored by Triton Biosciences and the role of the study sponsor was unclear ‐ The primary benefit outcome measure for relapse (ARR) was strongly affected by differences among treatment groups both in the number of participants who discontinued the study and in time to discontinuation, which they did not report ‐ Disability worsening confirmed at 3 months outcome was reported incompletely, and disability worsening confirmed at 6 months was not assessed |
| Methods | RCT | |
| Participants | Age: 18 to 50 years; definite RRMS; mean disease duration (time since diagnosis) 6 years; mean EDSS 2.0; all participants were previously untreated patients | |
| Interventions | Interferon beta‐1b (Betaseron) 250 µg subcutaneous every other day for 24 months (n = 96) Interferon beta‐1a (Avonex) 30 µg intramuscular once a week for 24 months (n = 92) | |
| Outcomes | Relapse at 24 months. Disability worsening at 24 months | |
| Notes | Funding: The Italian Ministry of Health and the Italian MS Society | |
| Risk of bias | ||
| Bias | Authors' judgement | Support for judgement |
| Random sequence generation (selection bias) | Low risk | "Randomisation followed computer‐generated random sequences of digits that were different for each centre and for each sex, to achieve centre and sex stratification" (Page 1454) |
| Allocation concealment (selection bias) | Low risk | "The codes were randomly assigned to treatments by an independent team of statisticians unaware of the patient’s clinical characteristics" (Page 1454) |
| Blinding of participants and personnel (performance bias) | High risk | "All clinical outcomes were assessed in an open‐label manner" (Page 1454) |
| Blinding of outcome assessment (detection bias) | High risk | "All clinical outcomes were assessed in an open‐label manner" (Page 1454) |
| Incomplete outcome data (attrition bias) | Unclear risk | Overall, 3.2% were lost to follow‐up (2.1% in interferon beta‐1b and 4.3% in interferon beta‐1a). Nothing was said about the reasons for study discontinuation |
| Selective reporting (reporting bias) | Low risk | The published report included all pre‐specified primary benefit outcomes |
| Other bias | Unclear risk | Relapse and disability worsening outcomes were reported incompletely |
| Methods | RCT | |
| Participants | Age: 18 to 45 years; definite RRMS; mean disease duration 7 years; mean EDSS 2.6; prior use of DMT not reported | |
| Interventions | Glatiramer acetate 20 mg subcutaneous daily for 24 months (n = 125) Placebo (not described) (n = 126) | |
| Outcomes | Relapse at 24 months. Disability worsening at 24 months | |
| Notes | Funding: Teva Pharmaceutical | |
| Risk of bias | ||
| Bias | Authors' judgement | Support for judgement |
| Random sequence generation (selection bias) | Unclear risk | "A centralized randomization scheme was used" (Page 1270) |
| Allocation concealment (selection bias) | Unclear risk | Not described |
| Blinding of participants and personnel (performance bias) | Unclear risk | "Treating neurologists were blinded" (Page 1270) |
| Blinding of outcome assessment (detection bias) | Unclear risk | "Examining neurologists were blinded" (Page 1270) |
| Incomplete outcome data (attrition bias) | Low risk | Overall, 14.3% were lost to follow‐up (15.2% in glatiramer acetate and 13.5% in placebo), without indication of the differences in reasons |
| Selective reporting (reporting bias) | Low risk | The published report included all pre‐specified primary benefit outcomes |
| Other bias | High risk | ‐ The primary benefit outcome measure for relapse (ARR) was strongly affected by differences among treatment groups both in the number of participants who discontinued the study and in time to discontinuation, which they did not report ‐ Relapse and disability worsening confirmed at 3 months outcomes were reported incompletely, and disability worsening confirmed at 6 months was not assessed |
| Methods | RCT | |
| Participants | Age: 18 to 55 years; definite RRMS; mean disease duration 8 years; mean EDSS 2.9; prior use of DMT not reported | |
| Interventions | Interferon beta‐1b (Betaseron) 250 µg subcutaneous every other day for 24 months (n = 158) Interferon beta‐1a (Rebif) 22 µg subcutaneous once a week for 24 months (n = 143) | |
| Outcomes | Relapse at 24 months. Disability worsening at 24 months | |
| Notes | Funding: not reported | |
| Risk of bias | ||
| Bias | Authors' judgement | Support for judgement |
| Random sequence generation (selection bias) | Low risk | "The randomization algorithm was adjusted to reduce deviations from a 50/50 result in each center" (Page 1057) |
| Allocation concealment (selection bias) | Low risk | "A central computerized randomization schedule assigned patients to treatment" (Page 1057) |
| Blinding of participants and personnel (performance bias) | High risk | "Blinding was abandoned because it could not be maintained owing to the different administration schemes of the two study drugs" (Page 1057) |
| Blinding of outcome assessment (detection bias) | High risk | "Open‐label trial" (Page 1057) |
| Incomplete outcome data (attrition bias) | High risk | Overall, 25.6% were lost to follow‐up (27.8% in interferon beta‐1b and 23.1% in interferon beta‐1a), with some indication of the differences in reasons: "The main cause of withdrawal in the IFN‐1b 250 g arm was side effects (24/158, 15.2%), and treatment failure was the most frequent cause in the IFN‐1a arm (15/143, 10.5%)" (Page 1057) |
| Selective reporting (reporting bias) | Low risk | The published report included all pre‐specified primary benefit outcomes |
| Other bias | High risk | ‐ It is unclear if the study was sponsored ‐ The primary benefit outcome measure for relapse (ARR) was strongly affected by differences among treatment groups both in the number of participants who discontinued the study and in time to discontinuation, which they did not report ‐ Relapse and disability worsening confirmed at 3 months outcomes were reported incompletely, and disability worsening confirmed at 6 months was not assessed ‐ Rebif at very low dose that is not used in clinical practice |
| Methods | RCT | |
| Participants | Age: 18 to 55 years; definite RRMS; mean disease duration 9 years; mean EDSS 3.0; prior use of DMT not reported | |
| Interventions | Immunoglobulins 0.2 g/kg body weight intravenously monthly for 12 months (n = 17) | |
| Outcomes | Relapse at 12 months | |
| Notes | Funding: Supported by the KBN (State Research Committee) | |
| Risk of bias | ||
| Bias | Authors' judgement | Support for judgement |
| Random sequence generation (selection bias) | Low risk | "The generation of allocation sequence was based on random‐number table" (Page 566) |
| Allocation concealment (selection bias) | Unclear risk | "Infusions of intravenous immunoglobulins and placebo were stored in identical opaque plastic bags for concealment during administration" (Page 566) |
| Blinding of participants and personnel (performance bias) | Unclear risk | Not described |
| Blinding of outcome assessment (detection bias) | Unclear risk | "Evaluating physician was unaware of the actual treatment allocation. Before entry to the study, and monthly thereafter during the study and 3 months after the end of the study, each patient was examined blindly by the same neurologist who was unaware of treatment allocation. Monitoring and recording of relapses, concomitant treatment, side‐effects or other medical events were documented throughout the study" (Page 566) |
| Incomplete outcome data (attrition bias) | Low risk | Overall, 3.9% were lost to follow‐up (6.3% in immunoglobulins 0.4 g/kg, 0% in immunoglobulins 0.2 g/kg, and 5.6% in placebo), without indication of the differences in reasons |
| Selective reporting (reporting bias) | Low risk | The published report included all pre‐specified primary benefit outcomes |
| Other bias | High risk | ‐ The primary benefit outcome measure for relapse (ARR) was strongly affected by differences among treatment groups both in the number of participants who discontinued the study and in time to discontinuation, which they did not report. ‐ Relapse outcome was reported incompletely |
| Methods | RCT | |
| Participants | Age: 18 to 55 years; definite RRMS; mean disease duration 6 years; mean EDSS 1.9; prior use of DMT at any time prior to the start of study: 6.0% (6.5% in azathioprine and 5.5% in interferon beta) | |
| Interventions | Azathioprine 3 mg/kg body weight oral daily for 24 months (n = 77) Interferons beta (Betaseron, Avonex, or Rebif) for 24 months (n = 73: 5 Betaseron 250 μg subcutaneously every other day, 26 Avonex 30 µg intramuscular once a week, 35 Rebif 22 µg subcutaneous 3 times a week, 7 Rebif 44 µg subcutaneous 3 times a week) | |
| Outcomes | Relapse at 12 and 24 months. Disability worsening at 24 months | |
| Notes | Funding: AIFA (Italian medicines agency) | |
| Risk of bias | ||
| Bias | Authors' judgement | Support for judgement |
| Random sequence generation (selection bias) | Low risk | "Patients were selected for AZA or IFNs using a randomization list (1:1 ratio), in blocks of four and stratified by disability score (EDSS≤3.5 or>3.5)" |
| Allocation concealment (selection bias) | Low risk | "Patients were selected for AZA or IFNs using a computer generated central randomization list" |
| Blinding of participants and personnel (performance bias) | High risk | "Single‐masked" |
| Blinding of outcome assessment (detection bias) | High risk | "Patients were assessed by an un‐masked treating and a masked examining neurologist at their centers", and "The masked examining neurologist was responsible for the neurological examination and EDSS scoring at scheduled (every six months) and unscheduled visits, requested by the treating neurologist to confirm relapses". Relapse assessment was not blinded |
| Incomplete outcome data (attrition bias) | Low risk | Overall, 15.3% were lost to follow‐up (19.5% in azathioprine and 11.0% in interferon beta), without indication of the differences in reasons |
| Selective reporting (reporting bias) | Low risk | The published report included all pre‐specified primary benefit outcomes |
| Other bias | Low risk | The study appears to be free of other sources of bias |
| Methods | RCT | |
| Participants | Age: 18 to 45 years; definite RRMS; mean disease duration 5 years; mean EDSS 3.6; prior use of DMT not reported | |
| Interventions | Mitoxantrone 8 mg/m² of body surface intravenously monthly for 12 months (total dosage of 96 mg/m² of body surface over 12 months) (n = 27) | |
| Outcomes | Relapse at 12 and 24 months. Disability worsening at 24 months | |
| Notes | Funding: not reported | |
| Risk of bias | ||
| Bias | Authors' judgement | Support for judgement |
| Random sequence generation (selection bias) | Low risk | "Patients were randomized to MTX or placebo using a scheme stratified on age, sex and EDSS which resulted in eight different age/sex/EDSS strata. According to the study protocol, within each stratum the allocation of patients to treatment or placebo was balanced by using a block design of size eight" (Page 154) |
| Allocation concealment (selection bias) | Low risk | "Central allocation and the intravenous bag and tubing were black to ensure no differences between the treatment groups" (Page 154) |
| Blinding of participants and personnel (performance bias) | Unclear risk | Treating physicians were not blinded. Unclear blinding of patients |
| Blinding of outcome assessment (detection bias) | High risk | "Monitoring and recording of exacerbations, concomitant therapy or other medical events were documented throughout the study by a treating physician selected in each centre before the beginning of the study. The treating physician was not blinded to study treatment", and "In order to maintain blindness, the interaction of the EDSS physicians with the patient was strictly restricted to the neurological examination. The neurologist was not allowed to talk with the patient about adverse events, or any other issue which could potentially disclose the patient’s treatment" (Page 154) |
| Incomplete outcome data (attrition bias) | Low risk | None were lost to follow‐up |
| Selective reporting (reporting bias) | Low risk | The published report included all pre‐specified primary benefit outcomes |
| Other bias | High risk | ‐ It is unclear if this study was sponsored ‐ Definition of sustained disability worsening was not clearly reported |
| Methods | RCT | |
| Participants | Age: 18 to 55 years; definite RRMS; mean disease duration 7 years; mean EDSS 2.4; all participants were previously untreated patients | |
| Interventions | Interferon beta‐1a (Avonex) 30 µg intramuscular once a week for 24 months (n = 158) Placebo intramuscular once a week for 24 months (n = 143) | |
| Outcomes | Relapse at 12 and 24 months. Disability worsening at 24 months | |
| Notes | Funding: Biogen, Inc, Cambridge, MA | |
| Risk of bias | ||
| Bias | Authors' judgement | Support for judgement |
| Random sequence generation (selection bias) | Unclear risk | "Randomisation performed at statistical centre of Buffalo General Hospital, one of the participating centres (biased coin assignment used for sequence generation)" (Page 286) |
| Allocation concealment (selection bias) | Unclear risk | "schedule sent to each clinical centre, included patients were sequentially assigned the next ID number from the schedule"(Page 286) |
| Blinding of participants and personnel (performance bias) | Unclear risk | "Personnel and participants were blinded to treatment status" (Page 286) |
| Blinding of outcome assessment (detection bias) | Unclear risk | "Evaluating physicians were blinded to treatment status" (Page 286) |
| Incomplete outcome data (attrition bias) | Low risk | Overall, 42.9% were lost to follow‐up (46.2% in interferon beta‐1a and 39.2% in placebo). The study stopped early for benefit without a formal‐stopping rule |
| Selective reporting (reporting bias) | Low risk | The published report included all pre‐specified primary benefit outcomes |
| Other bias | High risk | The study was sponsored by Biogen and "Personnel of the study sponsor (Biogen) were involved in the conduct and data analysis" (Page 293) |
| Methods | RCT | |
| Participants | Age: 18 to 50 years; definite RRMS; mean disease duration 7 years; mean EDSS 2.6; prior use of DMT not reported | |
| Interventions | Interferon beta‐1a (Rebif) 44 µg subcutaneous 3 times a week for 12 months (n = 98) Interferon beta‐1a (Rebif) 22 µg subcutaneous 3 times a week for 12 months (n = 95) Placebo subcutaneous 3 times a week for 12 months (n = 100) | |
| Outcomes | Relapse at 12 months | |
| Notes | Funding: Ares‐Serono International SA, Geneva, Switzerland | |
| Risk of bias | ||
| Bias | Authors' judgement | Support for judgement |
| Random sequence generation (selection bias) | Low risk | "Randomisation performed at Corporate Biometrics Department of Ares‐Serono (computer‐generated list)" (Page 680) |
| Allocation concealment (selection bias) | Low risk | "The randomization code for each patient was delivered to the investigator in sealed envelopes" (Page 680) |
| Blinding of participants and personnel (performance bias) | Unclear risk | "If desired, patients could remain on blinded study medication for another 24 weeks", "Both active treatment and placebo were administered as ready‐to‐use solutions in a volume of 0.5 mL", and "To preserve blinding, patients were instructed to cover injection sites and to refrain from discussing any symptoms that might be in any way related to treatment when visiting the evaluating physician" (Page 681) |
| Blinding of outcome assessment (detection bias) | Low risk | "The evaluating physician was responsible for neurologic assessments, both at scheduled visits and during exacerbations. Throughout the study, the evaluating physician remained unaware of adverse event profiles and any changes in safety assessments" (Page 681) |
| Incomplete outcome data (attrition bias) | High risk | Overall, 8.2% were lost to follow‐up (13.3% in interferon beta‐1a 44 µg, 8.4% in interferon beta‐1a 22 µg, and 3.0% in placebo), with some indication of the differences in reasons |
| Selective reporting (reporting bias) | Low risk | The published report included all pre‐specified primary benefit outcomes |
| Other bias | High risk | ‐ The study was sponsored by Ares‐Serono International SA, Geneva, Switzerland ‐ Relapse outcome was reported incompletely |
| Methods | RCT | |
| Participants | Age: 18 to 50 years; definite RRMS; mean disease duration 7 years; mean EDSS 2.5; prior use of DMT: "Only 3% of patients had received previous immunosuppressive therapy" | |
| Interventions | Interferon beta‐1a (Rebif) 44 µg subcutaneous 3 times a week for 24 months (n = 184) Interferon beta‐1a (Rebif) 22 µg subcutaneous 3 times a week for 24 months (n = 189) Placebo subcutaneous 3 times a week for 24 months (n = 187) | |
| Outcomes | Relapse at 12 and 24 months. Disability worsening at 24 months | |
| Notes | Funding: Ares‐Serono International SA, Geneva, Switzerland | |
| Risk of bias | ||
| Bias | Authors' judgement | Support for judgement |
| Random sequence generation (selection bias) | Low risk | "Randomisation at Corporate Biometrics Department of Ares‐Serono (computer‐generated list, stratified by centre, equal allocation of the treatment groups by a block size of 6)" (Page 1499) |
| Allocation concealment (selection bias) | Low risk | "The study drug was packed accordingly to the randomisation list and delivered to the centres so that treatment allocation remained concealed" (Page 1499) |
| Blinding of participants and personnel (performance bias) | Unclear risk | "All personnel involved in the study were unaware of treatment allocation", and "All injection sites were covered up at neurological examinations to ensure that masking was not compromised because of local reactions" (Page 1499) |
| Blinding of outcome assessment (detection bias) | Low risk | "All personnel involved in the study were unaware of treatment allocation", "Patients were assessed by two physicians. A “treating” neurologist was responsible for overall medical management of the patient, including treatment of any side‐effects, and an “assessing” neurologist was responsible for neurological assessments and follow‐up of relapses", and "All patients had a neurological assessment every 3 months. Additional assessments were done during relapses" (Page 1499) |
| Incomplete outcome data (attrition bias) | Low risk | Overall, 4.8% were lost to follow‐up (2.7% in interferon beta‐1a 44 µg, 6.3% in interferon beta‐1a 22 µg, and 5.3% in placebo), without indication of the differences in reasons |
| Selective reporting (reporting bias) | Low risk | The published report included all pre‐specified primary benefit outcomes |
| Other bias | High risk | ‐ The study was sponsored by Ares‐Serono International SA, Geneva, Switzerland ‐ The primary benefit outcome measure for relapse (ARR) was strongly affected by differences among treatment groups both in the number of participants who discontinued the study and in time to discontinuation, which they did not report ‐ Relapse outcome was reported incompletely |
| Methods | RCT | |
| Participants | Age: 18 to 60 years; definite RRMS; mean disease duration 6 years; mean EDSS 2.3; prior use of DMT not reported | |
| Interventions | Interferon beta‐1a (Rebif) 44 µg subcutaneous 3 times a week for 24 months (n = 386) Glatiramer acetate 20 mg subcutaneous daily for 24 months (n = 378) | |
| Outcomes | Relapse at 24 months. Disability worsening at 24 months | |
| Notes | Funding: EMD Serono and Pfizer | |
| Risk of bias | ||
| Bias | Authors' judgement | Support for judgement |
| Random sequence generation (selection bias) | Low risk | "Computer‐generated randomisation list stratified by centre" (Page 904) |
| Allocation concealment (selection bias) | Unclear risk | Not described |
| Blinding of participants and personnel (performance bias) | High risk | "Neither the patients nor the treating physicians were blinded to treatment" (Page 904) |
| Blinding of outcome assessment (detection bias) | Low risk | "The physicians who assessed patients ...were blinded to treatment and communicated with the patients only as needed to complete the EDSS, Kurtzke functional scale (KFS), and relapse assessments. Patients were asked not to discuss their treatment with the assessing physician and they covered their injection sites" (Page 904) |
| Incomplete outcome data (attrition bias) | Unclear risk | Overall, 3.3% were lost to follow‐up (5.2% in interferon beta‐1a and 1.3% in glatiramer acetate). Nothing was said about the reasons for study discontinuation |
| Selective reporting (reporting bias) | Low risk | The published report included all pre‐specified primary benefit outcomes |
| Other bias | High risk | ‐ "The study protocol was drafted and developed by the study sponsors, EMD Serono and Pfizer, in conjunction with the investigator steering committee. Data management and analysis were done by the study sponsors" (Page 907), and 2 co‐authors of the published paper were affiliated to the pharmaceutical company ‐ Disability worsening confirmed at 6 months outcome was reported incompletely |
| Methods | RCT | |
| Participants | Age: 18 to 55 years; definite RRMS; median disease duration (since diagnosis) 3 years; mean EDSS 2.7; prior use of DMT at any time prior to the start of study: 23.7% (22.5% in daclizumab 300 mg, 25.5% in daclizumab 150 mg, and 24.0% in placebo) | |
| Interventions | Daclizumab 300 mg subcutaneously once every 4 weeks for 12 months (n = 209) Daclizumab 150 mg subcutaneously once every 4 weeks for 12 months (n = 208) Placebo subcutaneously once every 4 weeks for 12 months (n = 204) | |
| Outcomes | Relapse at 12 months | |
| Notes | Funding: Biogen Idec and AbbVie Biotherapeutics Inc. | |
| Risk of bias | ||
| Bias | Authors' judgement | Support for judgement |
| Random sequence generation (selection bias) | Unclear risk | "Patients were randomly assigned in a 1:1:1 ratio" (Page 2168) |
| Allocation concealment (selection bias) | Low risk | "Patients were randomly assigned via a centralised interactive voice response system" (Page 2168) |
| Blinding of participants and personnel (performance bias) | Low risk | "All personnel and patients were masked to treatment assignment" (Page 2168) |
| Blinding of outcome assessment (detection bias) | Low risk | "Three members of an independent neurology assessment committee, consisting of multiple sclerosis neurologists who were masked to group assignment, adjudicated whether the protocol definition of relapse was satisfied" (Page 2168) |
| Incomplete outcome data (attrition bias) | Unclear risk | Overall, 7.1% were lost to follow‐up (5.7% in daclizumab 300 mg, 7.7% in daclizumab 150 mg, and 7.8% in placebo). Nothing was said about the reasons for study discontinuation |
| Selective reporting (reporting bias) | Low risk | The published report included all pre‐specified primary benefit outcomes |
| Other bias | High risk | ‐ The study was sponsored by Biogen Idec and AbbVie Biotherapeutics Inc, "The sponsor of the study provided assistance in manuscript preparation. The study was designed by the sponsor; the sponsor held and analysed data" (Page 2169), and 5 co‐authors of the published paper were affiliated to the pharmaceutical company |
| Methods | RCT | |
| Participants | Age: 18 to 55 years; definite RRMS; mean disease duration 9 years; mean EDSS 2.7; prior use of DMT in the previous 2 years: 27.0% (28.4% in teriflunomide 14 mg, 27.9% in teriflunomide 7 mg, and 24.8% in placebo) | |
| Interventions | Teriflunomide 14 mg oral capsule once daily for 25 months (n = 359) Teriflunomide 7 mg oral capsule once daily for 25 months (n = 366) Placebo oral capsule once daily for 25 months (n = 363) | |
| Outcomes | Relapse at 12 and 24 months. Disability worsening at 24 months | |
| Notes | Funding: Sanofi‐Aventis | |
| Risk of bias | ||
| Bias | Authors' judgement | Support for judgement |
| Random sequence generation (selection bias) | Low risk | "Eligible patients were randomly assigned (in a 1:1:1 ratio) to receive a once‐daily oral dose of placebo, 7 mg of teriflunomide, or 14 mg of teriflunomide for 108 weeks. Randomization was stratified according to the baseline EDSS score (≤3.5 or >3.5) and according to trial site, with a block size of 6." (Page 1294) |
| Allocation concealment (selection bias) | Low risk | "The treatment allocation was determined according to the randomization code provided by an interactive voice response system (IVRS)" (Page 74 of Medical Review of FDA) |
| Blinding of participants and personnel (performance bias) | Low risk | "Double blind" (Page 1294), and at Page 40 of the Protocol they described blinding, packaging and labeling ("Each medication kit was labeled with a two‐part tear‐off label..."). "Unblinding of 40 patients in TEMSO study, and the reasons provided do not appear to justify the need of unblinding" (Page 230 of Statistical Review of FDA) |
| Blinding of outcome assessment (detection bias) | High risk | "A treating neurologist at each site was responsible for evaluating patient eligibility, supervising the administration of study medication, recording and managing adverse events, assessing relapses, and monitoring safety assessments. An independent, specially trained and certified examining neurologist determined all the EDSS scores and performed all assessments of functional systems. Both treating and examining neurologists were unaware of treatment assignments; only the treating neurologist was aware of any side effects that could potentially be related to active therapy" (Pages 1294‐5), "Each episode of relapse was to be confirmed by the treating neurologist (unblinded), based on the objective assessments by an independent examining neurologist (blinded)" (Page 207 of Statistical Review of FDA) and "Patients were required to visit the study site within 7 days after the onset of a suspected relapse, for assessments by the examining neurologist" (Page 1295). |
| Incomplete outcome data (attrition bias) | Unclear risk | Overall, 20.1% were lost to follow‐up (21.2% in teriflunomide 14 mg, 19.1% in teriflunomide 7 mg, and 20.1% in placebo). Nothing was said about the reasons for study discontinuation. "Some patients discontinued study at the time of blind broken, although it is not clear whether or not the discontinuation was due to unblinding" (Page 208 of Statistical Review of FDA) |
| Selective reporting (reporting bias) | High risk | The published report included all pre‐specified primary benefit outcomes. However, disability confirmed at 6 months was not reported in the published report, it was reported by the FDA in terms of survival probabilities |
| Other bias | High risk | ‐ The study was sponsored by Sanofi‐Aventis, "data were analyzed by the sponsor" (Page 1294), and 3 co‐authors of the published paper were affiliated to the pharmaceutical company |
| Methods | RCT | |
| Participants | Age: 18 years and older; definite RRMS; mean disease duration 7 years; mean EDSS 2.1; prior use of DMT in the previous 2 years: 18.8% (11.7% in teriflunomide 14 mg, 21.1% in teriflunomide 7 mg, and 24.0% in interferon beta‐1a) | |
| Interventions | Teriflunomide 14 mg oral capsule once daily for at least 12 months (n = 111) Teriflunomide 7 mg oral capsule once daily for at least 12 months (n = 109) Interferon beta‐1a (Rebif) 44 µg ("when the 44 μg dose was not tolerated, the dose was reduced to 22 μg") subcutaneous 3 times a week for at least 12 months (n = 104) The study was completed 48 weeks after the last patient was randomised, resulting in a variable duration of follow‐up | |
| Outcomes | Relapse at 12 months | |
| Notes | Funding: Genzyme (a Sanofi company) | |
| Risk of bias | ||
| Bias | Authors' judgement | Support for judgement |
| Random sequence generation (selection bias) | Low risk | "Patients were randomised 1:1:1 to teriflunomide 7 mg or 14 mg or IFNβ‐1a, and stratified by country (Americas, Eastern Europe, Western Europe and Africa) and baseline EDSS score (≤3.5 or >3.5)" (Page 706) |
| Allocation concealment (selection bias) | Low risk | "A phone interactive voice response system was used to randomize patients" (information provided on request by Genzyme) |
| Blinding of participants and personnel (performance bias) | High risk | "Patients were randomised 1:1:1 to teriflunomide 7 mg or 14 mg (double‐blind) or IFNβ‐1a (open‐label)" (Page 706) |
| Blinding of outcome assessment (detection bias) | High risk | "The treating neurologist was responsible for relapse assessments, while an examining neurologist scored the EDSS. The examining neurologist remained blinded to treatment and associated AEs", and "Each relapse was confirmed by the treating neurologist based on the objective assessment of the examining neurologist" (Page 706) |
| Incomplete outcome data (attrition bias) | High risk | Overall, at 1 year 17.9% were lost to follow‐up (17.1% in teriflunomide 14 mg, 10.1% in teriflunomide 7 mg, and 26.9% in interferon beta‐1a) (data provided on request by Genzyme), with some indication of the differences in reasons |
| Selective reporting (reporting bias) | Low risk | The published report included all pre‐specified primary benefit outcomes. Missing data not reported in the published paper were provided on request by Genzyme |
| Other bias | High risk | "This study was funded by Genzyme, a Sanofi company. Editorial support was provided by Meg Church, Fishawack Communications, Ltd, also funded by Genzyme, a Sanofi company" (Page 716), and 3 co‐authors of the published paper were affiliated to the pharmaceutical company |
| Methods | RCT | |
| Participants | Age: 18 to 55 years; definite RRMS; mean disease duration 8 years; mean EDSS 2.7; prior use of DMT in the previous 2 years: 32.8% (33.9% in teriflunomide 14 mg, 30.1% in teriflunomide 7 mg, and 34.7% in placebo) | |
| Interventions | Teriflunomide 14 mg oral capsule once daily for at least 12 months (n = 372) Teriflunomide 7 mg oral capsule once daily for at least 12 months (n = 408) Placebo oral capsule once daily for at least 12 months (n = 389) The study was completed 48 weeks after the last patient was randomised, resulting in a variable duration of follow‐up | |
| Outcomes | Relapse at 12 months | |
| Notes | Funding: Genzyme (a Sanofi company) | |
| Risk of bias | ||
| Bias | Authors' judgement | Support for judgement |
| Random sequence generation (selection bias) | Low risk | "Randomisation was done using a permuted‐block randomisation schedule with stratification according to study site and baseline EDSS score (≤3.5 or >3.5)" (Page 248) |
| Allocation concealment (selection bias) | Low risk | "Randomisation was done centrally, via an interactive voice recognition system that generated an allocation sequence" and "investigators used the allocation sequence to randomly assign eligible patients in a 1:1:1 ratio to receive once‐daily oral placebo, teriflunomide 7 mg, or teriflunomide 14 mg (identical in taste and appearance)" (Page 248) |
| Blinding of participants and personnel (performance bias) | Low risk | "Patients and individuals administering the interventions were masked to treatment assignment" (Page 248) |
| Blinding of outcome assessment (detection bias) | Unclear risk | "Those assessing the outcomes were masked to treatment assignment" and "A treating neurologist was responsible for recording of adverse events, and assessment of relapses. An examining neurologist assigned EDSS scores at screening, randomisation, and every 12 weeks until the last treatment visit, and on any unscheduled visits for assessment of suspected relapse or disability worsening" (Page 248) |
| Incomplete outcome data (attrition bias) | High risk | Overall, 29.8% were lost to follow‐up (30.6% in teriflunomide 14 mg, 29.2% in teriflunomide 7 mg, and 29.6% in placebo), with some indication of the differences in reasons: adverse events of 15.6% in teriflunomide 14 mg, 13.2% in teriflunomide 7 mg, and 6.7% in placebo; and lack of benefit of 5.4% in teriflunomide 14 mg, 7.4% in teriflunomide 7 mg, and 9.5% in placebo |
| Selective reporting (reporting bias) | Low risk | The published report included all pre‐specified primary benefit outcomes |
| Other bias | High risk | ‐ The study was sponsored by Genzyme, "data were analyzed by the sponsor" (Page 250), and 4 co‐authors of the published paper were affiliated to the pharmaceutical company |
| Methods | RCT | |
| Participants | Age: 18 to 55 years; definite RRMS; mean disease duration 7 years; mean EDSS 2.2; prior use of DMT at any time prior to the start of study: 56.7% (58.5% in fingolimod 1.25 mg, 55.2% in fingolimod 0.5 mg, and 56.3% in interferon beta‐1a) | |
| Interventions | Fingolimod 1.25 mg oral capsule once daily for 12 months (n = 426) Fingolimod 0.5 mg oral capsule once daily for 12 months (n = 431) Interferon beta‐1a (Avonex) 30 µg intramuscular once a week for 12 months (n = 435) | |
| Outcomes | Relapse at 12 months | |
| Notes | Funding: Novartis Pharma | |
| Risk of bias | ||
| Bias | Authors' judgement | Support for judgement |
| Random sequence generation (selection bias) | Low risk | "Randomization was performed in blocks of six within each site and was stratified according to site" (Page 403) |
| Allocation concealment (selection bias) | Low risk | "Randomization was performed centrally" and "Study‐group assignments were performed with the use of an interactive voice‐response system" (Page 403) |
| Blinding of participants and personnel (performance bias) | Low risk | "Capsules, syringes and packaging materials for active and placebo treatments were indistinguishable", "During the trial, patients, study personnel, steering‐committee members, and the study statistician were unaware of study‐group assignments and leukocyte counts", and "An independent physician monitored patients after the first dose of the oral study drug was administered and was instructed not to discuss heart‐rate changes with patients or study personnel" (Page 404) |
| Blinding of outcome assessment (detection bias) | High risk | "At each site, a treating neurologist supervised medical management", "Patients were instructed to not to discuss adverse events with clinical evaluators", and "Potential relapses triggered an unscheduled visit and were confirmed by the treating neurologist on the basis of blinded examination by the examining neurologist" (Pages 403‐4) |
| Incomplete outcome data (attrition bias) | Low risk | Overall, 10.8% were lost to follow‐up (13.4% in fingolimod 1.25 mg, 7.7% in fingolimod 0.5 mg, and 11.3% in interferon beta‐1a), with few indications of the differences in reasons: unsatisfactory therapeutic effect of 0.7% in fingolimod 1.25 mg, 0.7% in fingolimod 0.5 mg, and 1.6% in interferon beta‐1a; adverse event(s) of 6.1% in fingolimod 1.25 mg, 2.1% in fingolimod 0.5 mg, and 2.1% in interferon beta‐1a; and abnormal laboratory values(s) of 0.9% in fingolimod 1.25 mg, 1.4% in fingolimod 0.5 mg, and 0.2% in interferon beta‐1a |
| Selective reporting (reporting bias) | Low risk | The published report included all pre‐specified primary benefit outcomes. Missing data not reported in the published paper were provided on request by Novartis Pharma |
| Other bias | High risk | ‐ The study was sponsored by Novartis Pharma, "data were analyzed by the sponsor" (Page 403), and 5 co‐authors of the published paper were affiliated to the pharmaceutical company |
ARR: annualised relapse rate
CIS: clinically isolated syndrome
DMT: disease modifying therapy
EDSS: Expanded Disability Status Scale
FDA: (US) Food and Drug Administration
MS: multiple sclerosis
RCT: randomised controlled trial
RRMS: relapsing‐remitting multiple sclerosis
Characteristics of excluded studies [ordered by study ID]
| Study | Reason for exclusion |
| Study evaluating combination therapy (interferon beta‐1a combined with methotrexate, methylprednisolone, or both) | |
| Study on interferon beta‐1a versus methotrexate; methotrexate is not relevant to the review | |
| Study on atacicept versus placebo; atacicept is not relevant to the review | |
| Non‐randomised study | |
| Follow‐up of 6 months | |
| Non‐randomised study | |
| Study evaluating 2 doses of glatiramer acetate (40 mg compared to 20 mg) without a control group | |
| Study evaluating combination therapy (interferon beta‐1a alone and combined with teriflunomide), with a follow‐up of 6 months | |
| Study evaluating combination therapy (interferon beta‐1a alone and combined with low‐dose azathioprine alone or low‐dose azathioprine and low‐dose corticosteroids) | |
| Follow‐up of 6 months The patients were possibly included in the FREEDOMS study | |
| Follow‐up of 6 months | |
| Follow‐up of 6 months | |
| Study evaluating combination therapy (glatiramer acetate alone and combined with albuterol) | |
| Follow‐up of 6 months | |
| Follow‐up of 6 months | |
| Study evaluating combination therapy (natalizumab combined with interferon beta‐1a versus interferon beta‐1a alone) | |
| Follow‐up of 6 months |
Characteristics of ongoing studies [ordered by study ID]
| Trial name or title | Multicenter, double‐blind, randomized, parallel‐group, monotherapy, active‐control study to determine the efficacy and safety of daclizumab high yield process (DAC HYP) versus Avonex® (interferon β 1a) in patients with relapsing‐remitting multiple sclerosis |
| Methods | RCT |
| Participants | Inclusion criteria:
Exclusion criteria:
|
| Interventions | Daclizumab 150 mg subcutaneously once every 4 weeks for 24 to 36 months Interferon beta‐1a (Avonex) 30 µg intramuscular once a week for 24 to 36 months |
| Outcomes | Primary outcome measures:
Secondary outcome measures (time frame: 2 years):
|
| Starting date | May 2010 |
| Contact information | Biogen Idec |
| Notes | Sponsor: Biogen Idec ClinicalTrials.gov Identifier: NCT01064401 |
| Trial name or title | A randomized, double‐blind, double‐dummy, parallel‐group study to evaluate the efficacy and safety of Ocrelizumab in comparison to Interferon Beta‐1a (Rebif®) in patients with relapsing multiple sclerosis |
| Methods | RCT |
| Participants | Inclusion criteria:
Exclusion criteria:
|
| Interventions | Ocrelizumab 600 mg intravenously every 24 weeks for 24 months Interferon beta‐1a (Rebif) 8.8 µg (weeks 1 + 2)/22 µg (weeks 3 + 4)/44 µg (week 5 and following) subcutaneous 3 times a week for 24 months |
| Outcomes | Primary outcome measures:
Secondary outcome measures (time frame: 2 years):
|
| Starting date | August 2011 |
| Contact information | Hoffmann‐La Roche |
| Notes | Sponsor: Hoffmann‐La Roche ClinicalTrials.gov Identifier: NCT01247324 |
| Trial name or title | A randomized, double‐blind, double‐dummy, parallel‐group study to evaluate the efficacy and safety of ocrelizumab in comparison to interferon beta‐1a (Rebif®) in patients with relapsing multiple sclerosis |
| Methods | RCT |
| Participants | Inclusion criteria:
Exclusion criteria:
|
| Interventions | Ocrelizumab 600 mg intravenously every 24 weeks for 24 months Interferon beta‐1a (Rebif) 8.8 µg (weeks 1 + 2)/22 µg (weeks 3 + 4)/44 µg (week 5 and following) subcutaneous 3 times a week for 24 months |
| Outcomes | Primary outcome measures:
Secondary outcome measures (time frame: 2 years):
|
| Starting date | September 2011 |
| Contact information | Hoffmann‐La Roche |
| Notes | Sponsor: Hoffmann‐La Roche ClinicalTrials.gov Identifier: NCT01412333 |
EDSS: Expanded Disability Status Scale
MRI: magnetic resonance imaging
MS: multiple sclerosis
RCT: randomised controlled trial
Data and analyses
| Outcome or subgroup title | No. of studies | No. of participants | Statistical method | Effect size |
| 1 Comparisons for relapses over 12 months Show forest plot | 29 | Risk Ratio (M‐H, Random, 95% CI) | Subtotals only | |
| Analysis 1.1  Comparison 1 Treatment benefit within pairwise comparisons, Outcome 1 Comparisons for relapses over 12 months. | ||||
| 1.1 Interferon beta‐1a (Avonex) versus placebo | 1 | 301 | Risk Ratio (M‐H, Random, 95% CI) | 0.88 [0.73, 1.05] |
| 1.2 Interferon beta‐1a (Rebif) versus placebo | 2 | 853 | Risk Ratio (M‐H, Random, 95% CI) | 0.89 [0.66, 1.19] |
| 1.3 Glatiramer acetate versus placebo | 4 | 2416 | Risk Ratio (M‐H, Random, 95% CI) | 0.79 [0.66, 0.95] |
| 1.4 Natalizumab versus placebo | 1 | 942 | Risk Ratio (M‐H, Random, 95% CI) | 0.56 [0.47, 0.66] |
| 1.5 Mitoxantrone versus placebo | 1 | 51 | Risk Ratio (M‐H, Random, 95% CI) | 0.40 [0.21, 0.74] |
| 1.6 Fingolimod versus placebo | 2 | 2355 | Risk Ratio (M‐H, Random, 95% CI) | 0.63 [0.48, 0.82] |
| 1.7 Teriflunomide versus placebo | 2 | 2257 | Risk Ratio (M‐H, Random, 95% CI) | 0.86 [0.78, 0.95] |
| 1.8 Dimethyl fumarate versus placebo | 2 | 2307 | Risk Ratio (M‐H, Random, 95% CI) | 0.79 [0.71, 0.88] |
| 1.9 Pegylated interferon beta‐1a versus placebo | 1 | 1512 | Risk Ratio (M‐H, Random, 95% CI) | 0.89 [0.78, 1.01] |
| 1.10 Daclizumab versus placebo | 1 | 621 | Risk Ratio (M‐H, Random, 95% CI) | 0.79 [0.68, 0.92] |
| 1.11 Azathioprine versus placebo | 1 | 59 | Risk Ratio (M‐H, Random, 95% CI) | 0.87 [0.61, 1.24] |
| 1.12 Immunoglobulins versus placebo | 3 | 219 | Risk Ratio (M‐H, Random, 95% CI) | 0.80 [0.47, 1.36] |
| 1.13 Interferon beta‐1a (Rebif) versus interferon beta‐1a (Avonex) | 1 | 677 | Risk Ratio (M‐H, Random, 95% CI) | 0.91 [0.80, 1.03] |
| 1.14 Glatiramer acetate versus interferon beta‐1b (Betaseron) | 1 | 75 | Risk Ratio (M‐H, Random, 95% CI) | 0.81 [0.48, 1.38] |
| 1.15 Azathioprine versus interferons beta (Avonex, Rebif or Betaseron) | 2 | 244 | Risk Ratio (M‐H, Random, 95% CI) | 0.81 [0.49, 1.33] |
| 1.16 Fingolimod versus interferon beta‐1a (Avonex) | 1 | 1292 | Risk Ratio (M‐H, Random, 95% CI) | 0.67 [0.57, 0.79] |
| 1.17 Teriflunomide versus interferon beta‐1a (Rebif) | 1 | 324 | Risk Ratio (M‐H, Random, 95% CI) | 0.91 [0.69, 1.18] |
| 1.18 Dimethyl fumarate versus glatiramer acetate | 1 | 1067 | Risk Ratio (M‐H, Random, 95% CI) | 0.96 [0.80, 1.14] |
| 1.19 Alemtuzumab versus interferon beta‐1a (Rebif) | 3 | 1582 | Risk Ratio (M‐H, Random, 95% CI) | 0.46 [0.39, 0.55] |
| 2 Comparisons for relapses over 24 months Show forest plot | 26 | Risk Ratio (M‐H, Random, 95% CI) | Subtotals only | |
| Analysis 1.2  Comparison 1 Treatment benefit within pairwise comparisons, Outcome 2 Comparisons for relapses over 24 months. | ||||
| 2.1 Interferon beta‐1b (Betaseron) versus placebo | 1 | 372 | Risk Ratio (M‐H, Random, 95% CI) | 0.89 [0.81, 0.99] |
| 2.2 Interferon beta‐1a (Avonex) versus placebo | 2 | 1198 | Risk Ratio (M‐H, Random, 95% CI) | 0.89 [0.76, 1.04] |
| 2.3 Interferon beta‐1a (Rebif) versus placebo | 1 | 560 | Risk Ratio (M‐H, Random, 95% CI) | 0.85 [0.77, 0.92] |
| 2.4 Glatiramer acetate versus placebo | 3 | 1024 | Risk Ratio (M‐H, Random, 95% CI) | 0.86 [0.75, 0.98] |
| 2.5 Natalizumab versus placebo | 1 | 942 | Risk Ratio (M‐H, Random, 95% CI) | 0.56 [0.49, 0.64] |
| 2.6 Mitoxantrone versus placebo | 1 | 51 | Risk Ratio (M‐H, Random, 95% CI) | 0.47 [0.27, 0.80] |
| 2.7 Fingolimod versus placebo | 2 | 2355 | Risk Ratio (M‐H, Random, 95% CI) | 0.72 [0.67, 0.78] |
| 2.8 Teriflunomide versus placebo | 1 | 1088 | Risk Ratio (M‐H, Random, 95% CI) | 0.88 [0.79, 0.98] |
| 2.9 Dimethyl fumarate versus placebo | 2 | 2307 | Risk Ratio (M‐H, Random, 95% CI) | 0.89 [0.81, 0.97] |
| 2.10 Laquinimod versus placebo | 2 | 1990 | Risk Ratio (M‐H, Random, 95% CI) | 0.86 [0.75, 0.99] |
| 2.11 Azathioprine versus placebo | 1 | 59 | Risk Ratio (M‐H, Random, 95% CI) | 0.77 [0.56, 1.05] |
| 2.12 Immunoglobulins versus placebo | 2 | 190 | Risk Ratio (M‐H, Random, 95% CI) | 0.74 [0.61, 0.90] |
| 2.13 Interferon beta‐1a (Avonex) versus interferon beta‐1b (Betaseron) | 1 | 188 | Risk Ratio (M‐H, Random, 95% CI) | 1.34 [1.06, 1.71] |
| 2.14 Interferon beta‐1a (Rebif) versus interferon beta‐1b (Betaseron) | 1 | 301 | Risk Ratio (M‐H, Random, 95% CI) | 0.99 [0.89, 1.11] |
| 2.15 Glatiramer acetate versus interferon beta‐1b (Betaseron) | 2 | 2319 | Risk Ratio (M‐H, Random, 95% CI) | 0.80 [0.47, 1.38] |
| 2.16 Glatiramer acetate versus interferon beta‐1a (Rebif) | 1 | 764 | Risk Ratio (M‐H, Random, 95% CI) | 0.92 [0.78, 1.09] |
| 2.17 Dimethyl fumarate versus glatiramer acetate | 1 | 1067 | Risk Ratio (M‐H, Random, 95% CI) | 1.09 [0.98, 1.21] |
| 2.18 Alemtuzumab versus interferon beta‐1a (Rebif) | 3 | 1582 | Risk Ratio (M‐H, Random, 95% CI) | 0.50 [0.39, 0.65] |
| 2.19 Laquinimod versus interferon beta‐1a (Avonex) | 1 | 881 | Risk Ratio (M‐H, Random, 95% CI) | 1.13 [0.97, 1.32] |
| 2.20 Azathioprine versus interferons beta (Avonex, Rebif or Betaseron) | 1 | 150 | Risk Ratio (M‐H, Random, 95% CI) | 0.86 [0.64, 1.16] |
| 3 Comparisons for disability worsening over 24 months Show forest plot | 26 | Risk Ratio (M‐H, Random, 95% CI) | Subtotals only | |
| Analysis 1.3  Comparison 1 Treatment benefit within pairwise comparisons, Outcome 3 Comparisons for disability worsening over 24 months. | ||||
| 3.1 Interferon beta‐1b (Betaseron) versus placebo | 1 | 372 | Risk Ratio (M‐H, Random, 95% CI) | 0.98 [0.72, 1.32] |
| 3.2 Interferon beta‐1a (Avonex) versus placebo | 2 | 1198 | Risk Ratio (M‐H, Random, 95% CI) | 0.87 [0.70, 1.09] |
| 3.3 Interferon beta‐1a (Rebif) versus placebo | 1 | 560 | Risk Ratio (M‐H, Random, 95% CI) | 0.77 [0.61, 0.96] |
| 3.4 Glatiramer acetate versus placebo | 3 | 1024 | Risk Ratio (M‐H, Random, 95% CI) | 0.81 [0.61, 1.09] |
| 3.5 Natalizumab versus placebo | 1 | 942 | Risk Ratio (M‐H, Random, 95% CI) | 0.64 [0.52, 0.80] |
| 3.6 Mitoxantrone versus placebo | 1 | 51 | Risk Ratio (M‐H, Random, 95% CI) | 0.20 [0.05, 0.83] |
| 3.7 Fingolimod versus placebo | 2 | 2355 | Risk Ratio (M‐H, Random, 95% CI) | 0.87 [0.76, 0.99] |
| 3.8 Teriflunomide versus placebo | 1 | 1088 | Risk Ratio (M‐H, Random, 95% CI) | 0.87 [0.75, 1.01] |
| 3.9 Dimethyl fumarate versus placebo | 2 | 2307 | Risk Ratio (M‐H, Random, 95% CI) | 0.80 [0.72, 0.90] |
| 3.10 Laquinimod versus placebo | 2 | 1990 | Risk Ratio (M‐H, Random, 95% CI) | 0.83 [0.73, 0.95] |
| 3.11 Azathioprine versus placebo | 1 | 59 | Risk Ratio (M‐H, Random, 95% CI) | 0.64 [0.31, 1.34] |
| 3.12 Immunoglobulins versus placebo | 2 | 190 | Risk Ratio (M‐H, Random, 95% CI) | 0.70 [0.39, 1.24] |
| 3.13 Interferon beta‐1a (Avonex) versus interferon beta‐1b (Betaseron) | 1 | 188 | Risk Ratio (M‐H, Random, 95% CI) | 2.23 [1.29, 3.83] |
| 3.14 Interferon beta‐1a (Rebif) versus interferon beta‐1b (Betaseron) | 1 | 301 | Risk Ratio (M‐H, Random, 95% CI) | 0.99 [0.78, 1.25] |
| 3.15 Glatiramer acetate versus interferon beta‐1b (Betaseron) | 2 | 2319 | Risk Ratio (M‐H, Random, 95% CI) | 0.99 [0.86, 1.13] |
| 3.16 Glatiramer acetate versus interferon beta‐1a (Rebif) | 1 | 764 | Risk Ratio (M‐H, Random, 95% CI) | 0.58 [0.39, 0.85] |
| 3.17 Dimethyl fumarate versus glatiramer acetate | 1 | 1067 | Risk Ratio (M‐H, Random, 95% CI) | 1.01 [0.83, 1.22] |
| 3.18 Alemtuzumab versus interferon beta‐1a (Rebif) | 3 | 1582 | Risk Ratio (M‐H, Random, 95% CI) | 0.41 [0.32, 0.54] |
| 3.19 Laquinimod versus interferon beta‐1a (Avonex) | 1 | 881 | Risk Ratio (M‐H, Random, 95% CI) | 1.07 [0.85, 1.33] |
| 3.20 Azathioprine versus interferons beta (Avonex, Rebif or Betaseron) | 1 | 150 | Risk Ratio (M‐H, Random, 95% CI) | 0.77 [0.49, 1.23] |
| Outcome or subgroup title | No. of studies | No. of participants | Statistical method | Effect size |
| 1 Comparisons for treatment discontinuation due to AEs over 12 months Show forest plot | 13 | Risk Ratio (M‐H, Random, 95% CI) | Subtotals only | |
| Analysis 2.1  Comparison 2 Treatment acceptability within pairwise comparisons, Outcome 1 Comparisons for treatment discontinuation due to AEs over 12 months. | ||||
| 1.1 Interferon beta‐1a (Avonex) 30 µg versus placebo | 1 | 301 | Risk Ratio (M‐H, Random, 95% CI) | 3.17 [0.67, 15.00] |
| 1.2 Interferon beta‐1a (Rebif) 22 µg versus placebo | 1 | 195 | Risk Ratio (M‐H, Random, 95% CI) | 3.16 [0.13, 76.54] |
| 1.3 Interferon beta‐1a (Rebif) 44 µg versus placebo | 1 | 198 | Risk Ratio (M‐H, Random, 95% CI) | 11.22 [0.63, 200.27] |
| 1.4 Glatiramer acetate 20 mg daily versus placebo | 1 | 239 | Risk Ratio (M‐H, Random, 95% CI) | 1.51 [0.26, 8.89] |
| 1.5 Glatiramer 40 mg three times per week versus placebo | 1 | 1404 | Risk Ratio (M‐H, Random, 95% CI) | 2.36 [0.99, 5.65] |
| 1.6 Teriflunomide 7 mg versus placebo | 1 | 797 | Risk Ratio (M‐H, Random, 95% CI) | 2.06 [1.31, 3.24] |
| 1.7 Teriflunomide 14 mg versus placebo | 1 | 761 | Risk Ratio (M‐H, Random, 95% CI) | 2.51 [1.61, 3.91] |
| 1.8 Pegylated interferon beta‐1a every 4 weeks versus placebo | 1 | 1000 | Risk Ratio (M‐H, Random, 95% CI) | 2.78 [1.31, 5.89] |
| 1.9 Pegylated interferon beta‐1a every 2 weeks versus placebo | 1 | 1012 | Risk Ratio (M‐H, Random, 95% CI) | 2.82 [1.34, 5.96] |
| 1.10 Daclizumab 150 mg versus placebo | 1 | 412 | Risk Ratio (M‐H, Random, 95% CI) | 3.43 [0.72, 16.33] |
| 1.11 Daclizumab 300 mg versus placebo | 1 | 413 | Risk Ratio (M‐H, Random, 95% CI) | 4.39 [0.96, 20.08] |
| 1.12 Immunoglobulins 0.2 g versus placebo | 2 | 163 | Risk Ratio (M‐H, Random, 95% CI) | 2.14 [0.23, 19.96] |
| 1.13 Immunoglobulins 0.4 g versus placebo | 1 | 34 | Risk Ratio (M‐H, Random, 95% CI) | 3.35 [0.15, 76.93] |
| 1.14 Interferon beta‐1a (Rebif) 44 µg versus interferon beta‐1a (Avonex) 30 µg | 1 | 677 | Risk Ratio (M‐H, Random, 95% CI) | 1.05 [0.56, 1.97] |
| 1.15 Fingolimod 0.5 mg versus interferon beta‐1a (Avonex) 30 µg | 1 | 866 | Risk Ratio (M‐H, Random, 95% CI) | 1.43 [0.81, 2.54] |
| 1.16 Fingolimod 1.25 mg versus interferon beta‐1a (Avonex) 30 µg | 1 | 861 | Risk Ratio (M‐H, Random, 95% CI) | 2.36 [1.40, 3.98] |
| 1.17 Teriflunomide 7 mg versus interferon beta‐1a (Rebif) 44 µg | 1 | 213 | Risk Ratio (M‐H, Random, 95% CI) | 0.39 [0.19, 0.81] |
| 1.18 Teriflunomide 14 mg versus interferon beta‐1a (Rebif) 44 µg | 1 | 215 | Risk Ratio (M‐H, Random, 95% CI) | 0.51 [0.27, 0.98] |
| 1.19 Azathioprine versus interferons beta (Avonex, Rebif or Betaseron) | 1 | 94 | Risk Ratio (M‐H, Random, 95% CI) | 1.0 [0.21, 4.70] |
| 2 Comparisons for treatment discontinuation due to AEs over 24 months Show forest plot | 23 | Risk Ratio (M‐H, Random, 95% CI) | Subtotals only | |
| Analysis 2.2  Comparison 2 Treatment acceptability within pairwise comparisons, Outcome 2 Comparisons for treatment discontinuation due to AEs over 24 months. | ||||
| 2.1 Interferon beta‐1b (Betaseron) 50 µg versus placebo | 1 | 248 | Risk Ratio (M‐H, Random, 95% CI) | 4.92 [0.58, 41.51] |
| 2.2 Interferon beta‐1b (Betaseron) 250 µg versus placebo | 1 | 247 | Risk Ratio (M‐H, Random, 95% CI) | 9.92 [1.29, 76.32] |
| 2.3 Interferon beta‐1a (Avonex) 30 µg versus placebo | 1 | 897 | Risk Ratio (M‐H, Random, 95% CI) | 1.43 [0.81, 2.54] |
| 2.4 Interferon beta‐1a (Rebif) 22 µg versus placebo | 1 | 376 | Risk Ratio (M‐H, Random, 95% CI) | 2.31 [0.61, 8.79] |
| 2.5 Interferon beta‐1a (Rebif) 44 µg versus placebo | 1 | 371 | Risk Ratio (M‐H, Random, 95% CI) | 3.05 [0.84, 11.08] |
| 2.6 Glatiramer acetate 20 mg daily versus placebo | 3 | 1024 | Risk Ratio (M‐H, Random, 95% CI) | 1.74 [0.49, 6.13] |
| 2.7 Natalizumab versus placebo | 1 | 942 | Risk Ratio (M‐H, Random, 95% CI) | 1.53 [0.93, 2.53] |
| 2.8 Mitoxantrone versus placebo | 1 | 51 | Risk Ratio (M‐H, Random, 95% CI) | 9.82 [0.57, 168.84] |
| 2.9 Fingolimod 0.5 mg versus placebo | 2 | 1556 | Risk Ratio (M‐H, Random, 95% CI) | 1.42 [0.89, 2.25] |
| 2.10 Fingolimod 1.25 mg versus placebo | 2 | 1572 | Risk Ratio (M‐H, Random, 95% CI) | 1.93 [1.48, 2.52] |
| 2.11 Teriflunomide 7 mg versus placebo | 1 | 729 | Risk Ratio (M‐H, Random, 95% CI) | 1.23 [0.77, 1.96] |
| 2.12 Teriflunomide 14 mg versus placebo | 1 | 722 | Risk Ratio (M‐H, Random, 95% CI) | 1.36 [0.86, 2.15] |
| 2.13 Dimethyl fumarate 480 mg versus placebo | 2 | 1546 | Risk Ratio (M‐H, Random, 95% CI) | 1.17 [0.91, 1.51] |
| 2.14 Dimethyl fumarate 720 mg versus placebo | 2 | 1534 | Risk Ratio (M‐H, Random, 95% CI) | 1.20 [0.93, 1.54] |
| 2.15 Laquinimod versus placebo | 2 | 1990 | Risk Ratio (M‐H, Random, 95% CI) | 1.39 [0.96, 2.00] |
| 2.16 Azathioprine versus placebo | 1 | 59 | Risk Ratio (M‐H, Random, 95% CI) | 5.8 [0.74, 45.26] |
| 2.17 Immunoglobulins 0.15 to 0.20 g versus placebo | 1 | 150 | Risk Ratio (M‐H, Random, 95% CI) | 3.0 [0.32, 28.19] |
| 2.18 Interferon beta‐1a (Avonex) 30 µg versus interferon beta‐1b (Betaseron) 250 µg | 1 | 188 | Risk Ratio (M‐H, Random, 95% CI) | 0.21 [0.02, 1.75] |
| 2.19 Glatiramer acetate 20 mg daily versus interferon beta‐1b (Betaseron) 250 μg | 2 | 1420 | Risk Ratio (M‐H, Random, 95% CI) | 1.19 [0.56, 2.53] |
| 2.20 Glatiramer acetate 20 mg daily versus interferon beta‐1b (Betaseron) 500 μg | 1 | 1347 | Risk Ratio (M‐H, Random, 95% CI) | 0.79 [0.37, 1.68] |
| 2.21 Glatiramer acetate 20 mg daily versus interferon beta‐1a (Rebif) 44 µg | 1 | 764 | Risk Ratio (M‐H, Random, 95% CI) | 0.84 [0.47, 1.52] |
| 2.22 Dimethyl fumarate 480 mg versus glatiramer acetate 20 mg daily | 1 | 722 | Risk Ratio (M‐H, Random, 95% CI) | 1.22 [0.80, 1.84] |
| 2.23 Dimethyl fumarate 720 mg versus glatiramer acetate 20 mg daily | 1 | 705 | Risk Ratio (M‐H, Random, 95% CI) | 1.22 [0.80, 1.85] |
| 2.24 Alemtuzumab 12 mg versus interferon beta‐1a (Rebif) 44 µg | 3 | 1472 | Risk Ratio (M‐H, Random, 95% CI) | 0.38 [0.22, 0.68] |
| 2.25 Alemtuzumab 24 mg versus interferon beta‐1a (Rebif) 44 µg | 2 | 625 | Risk Ratio (M‐H, Random, 95% CI) | 0.33 [0.10, 1.09] |
| 2.26 Laquinimod versus interferon beta‐1a (Avonex) 30 µg | 1 | 881 | Risk Ratio (M‐H, Random, 95% CI) | 0.84 [0.49, 1.45] |
| 2.27 Azathioprine versus interferons beta (Avonex, Rebif or Betaseron) | 1 | 150 | Risk Ratio (M‐H, Random, 95% CI) | 2.21 [0.90, 5.45] |
| Outcome or subgroup title | No. of studies | No. of participants | Statistical method | Effect size |
| 1 Serious adverse events Show forest plot | 16 | Risk Ratio (M‐H, Random, 95% CI) | Subtotals only | |
| Analysis 3.1  Comparison 3 Treatment safety against placebo within pairwise comparisons, Outcome 1 Serious adverse events. | ||||
| 1.1 Interferons beta (Avonex, Rebif or Betaseron) versus placebo | 3 | 870 | Risk Ratio (M‐H, Random, 95% CI) | 1.26 [0.67, 2.37] |
| 1.2 Glatiramer acetate versus placebo | 2 | 490 | Risk Ratio (M‐H, Random, 95% CI) | 1.87 [0.73, 4.74] |
| 1.3 Natalizumab versus placebo | 1 | 939 | Risk Ratio (M‐H, Random, 95% CI) | 1.19 [0.81, 1.73] |
| 1.4 Fingolimod versus placebo | 2 | 1572 | Risk Ratio (M‐H, Random, 95% CI) | 0.97 [0.72, 1.30] |
| 1.5 Teriflunomide versus placebo | 1 | 718 | Risk Ratio (M‐H, Random, 95% CI) | 1.26 [0.87, 1.83] |
| 1.6 Dimethyl fumarate versus placebo | 2 | 1531 | Risk Ratio (M‐H, Random, 95% CI) | 1.09 [0.76, 1.55] |
| 1.7 Pegylated interferon beta‐1a versus placebo | 1 | 1012 | Risk Ratio (M‐H, Random, 95% CI) | 0.98 [0.57, 1.68] |
| 1.8 Daclizumab versus placebo | 1 | 413 | Risk Ratio (M‐H, Random, 95% CI) | 1.55 [0.77, 3.10] |
| 1.9 Laquinimod versus placebo | 2 | 1988 | Risk Ratio (M‐H, Random, 95% CI) | 0.97 [0.67, 1.41] |
| 1.10 Immunoglobulins versus placebo | 1 | 83 | Risk Ratio (M‐H, Random, 95% CI) | 0.65 [0.11, 3.70] |
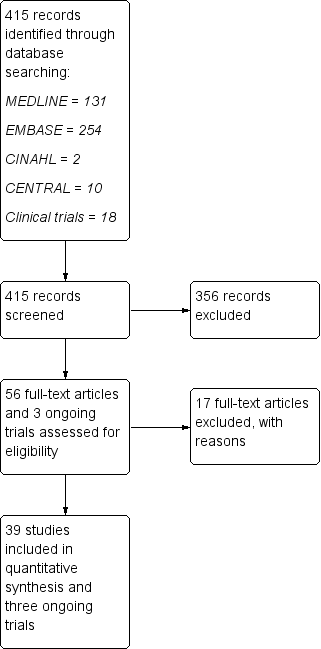
Study flow diagram.

'Risk of bias' graph: review authors' judgements about each risk of bias item presented as percentages across all included studies.
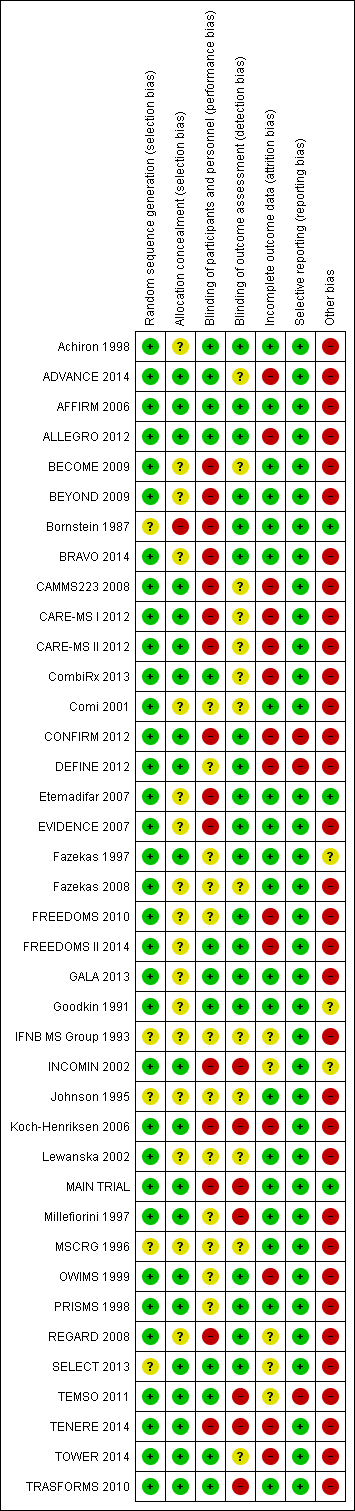
'Risk of bias' summary: review authors' judgements about each risk of bias item for each included study.
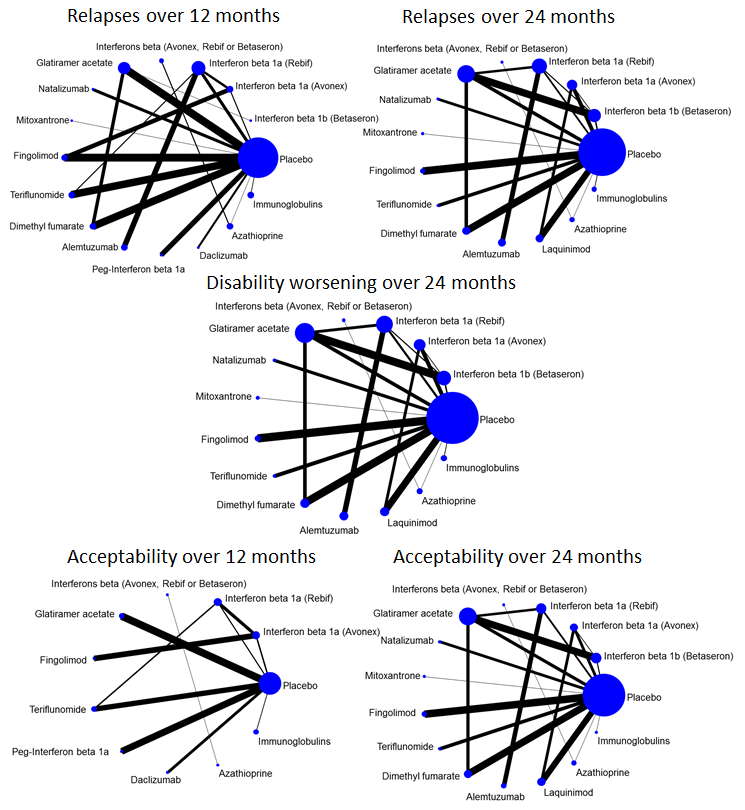
Network plots of treatment comparisons for benefit and acceptability outcomes.

Network meta‐analysis (NMA) estimates of treatment benefit against placebo: relapses over 12 and 24 months, and disability worsening over 24 months.
CI: confidence interval; RR: risk ratio.

Network meta‐analysis (NMA) estimates of treatment acceptability against placebo: treatment discontinuation due to AEs over 12 and 24 months.
AEs: adverse events; CI: confidence interval; RR: risk ratio.
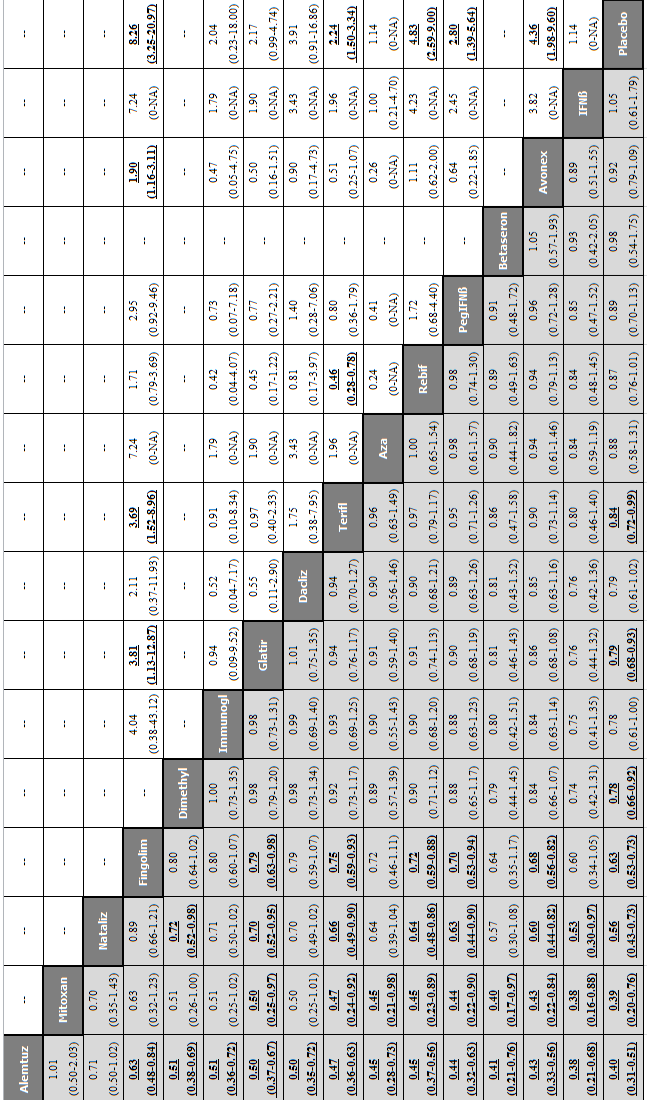
Network meta‐analysis (NMA) estimates of treatment benefit (lower triangle) and acceptability (upper triangle) over 12 months for each comparison: relapses and treatment discontinuation due to adverse events (AEs) over 12 months.
Drugs are reported in order of primary benefit ranking. Comparisons should be read from left to right. The estimate (risk ratio, RR) is located at the intersection of the column‐defining treatment and the row‐defining treatment. A RR value below 1 favours the column‐defining treatment for lower triangle, and the row‐defining treatment for upper triangle. To obtain RRs for comparisons in the opposing direction, reciprocals should be taken. Significant results are bolded and underscored.
Alemtuz: alemtuzumab; Avonex: interferon beta‐1a (Avonex); Aza: azathioprine; Betaseron: interferon beta‐1b (Betaseron); Dacliz: daclizumab; Dimethyl: dimethyl fumarate; Fingolim: fingolimod; Glatir: glatiramer acetate; IFNß: interferons beta; Immunogl: immunoglobulins; Mitoxan: mitoxantrone; Nataliz: natalizumab; PegIFNß: pegylated interferon beta‐1a; Rebif: interferon beta‐1a (Rebif); Terifl: teriflunomide.

Network meta‐analysis (NMA) estimates of treatment benefit (lower triangle) and acceptability (upper triangle) over 24 months for each comparison: relapses and treatment discontinuation due to adverse events (AEs) over 24 months. Drugs are reported in order of primary benefit ranking. Comparisons should be read from left to right. The estimate (risk ratio, RR) is located at the intersection of the column‐defining treatment and the row‐defining treatment. A RR value below 1 favours the column‐defining treatment for lower triangle, and the row‐defining treatment for upper triangle. To obtain RRs for comparisons in the opposing direction, reciprocals should be taken. Significant results are bolded and underscored.
Alemtuz: alemtuzumab; Avonex: interferon beta‐1a (Avonex); Aza: azathioprine; Betaseron: interferon beta‐1b (Betaseron); Dimethyl: dimethyl fumarate; Fingolim: fingolimod; Glatir: glatiramer acetate; IFNß: interferons beta; Immunogl: immunoglobulins; Laquin: laquinimod; Mitoxan: mitoxantrone; Nataliz: natalizumab; Rebif: interferon beta‐1a (Rebif); Terifl: teriflunomide.
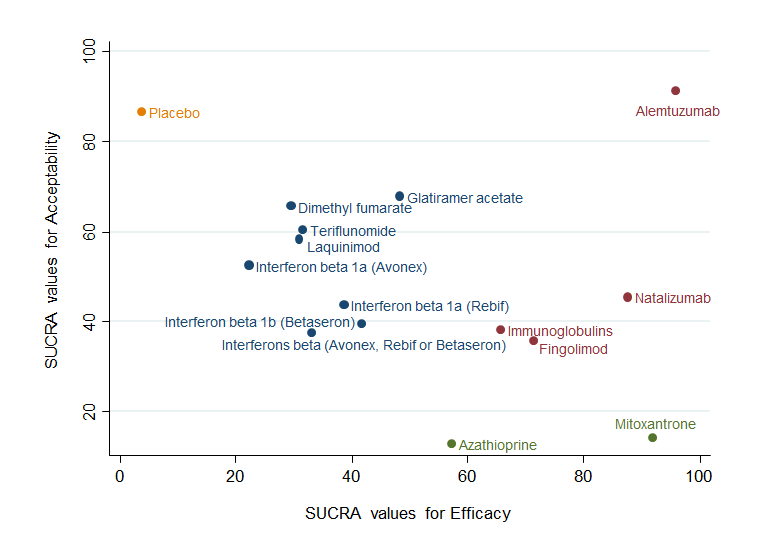
Clustered ranking plot based on cluster analysis of surface under the cumulative ranking curve (SUCRA) values for benefit (relapses) and acceptability (treatment discontinuation due to AEs) over 24 months. Each colour represents a group of treatments that belong to the same cluster. Treatments lying in the upper right corner are more effective and acceptable than the other treatments.
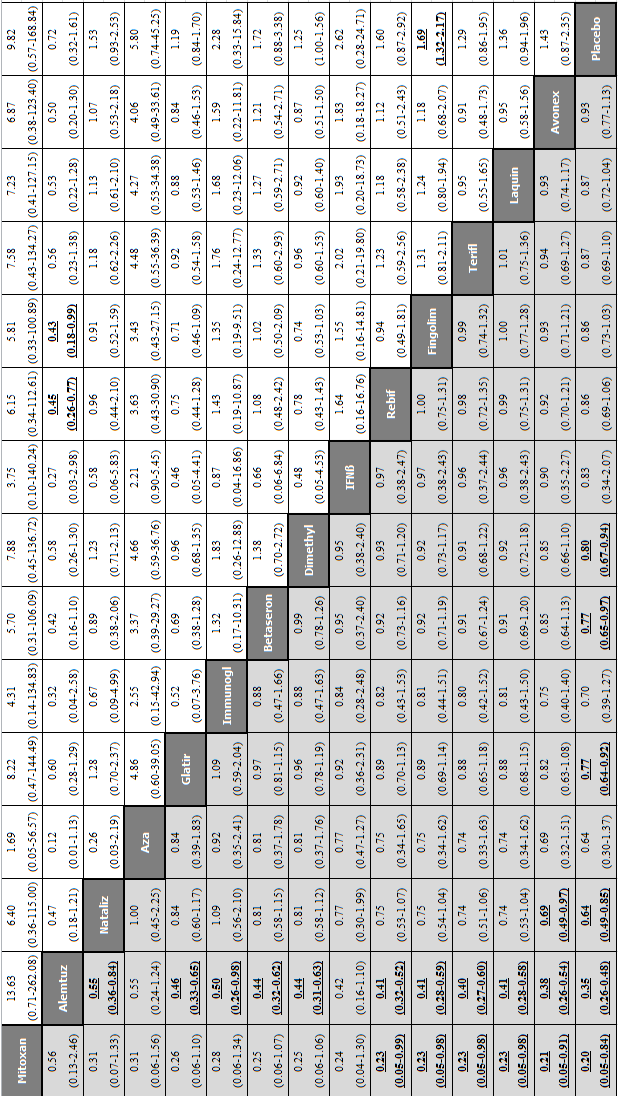
Network meta‐analysis (NMA) estimates of treatment benefit (lower triangle) and acceptability (upper triangle) over 24 months for each comparison: disability worsening and treatment discontinuation due to adverse events (AEs) over 24 months. Drugs are reported in order of primary benefit ranking. Comparisons should be read from left to right. The estimate is located at the intersection of the column‐defining treatment and the row‐defining treatment. A RR value below 1 favours the column‐defining treatment for lower triangle, and the row‐defining treatment for upper triangle. To obtain RRs for comparisons in the opposing direction, reciprocals should be taken. Significant results are bolded and underscored.
Alemtuz: alemtuzumab; Avonex: interferon beta‐1a (Avonex); Aza: azathioprine; Betaseron: interferon beta‐1b (Betaseron); Dimethyl: dimethyl fumarate; Fingolim: fingolimod; Glatir: glatiramer acetate; IFNß: interferons beta; Immunogl: immunoglobulins; Laquin: laquinimod; Mitoxan: mitoxantrone; Nataliz: natalizumab; Rebif: interferon beta‐1a (Rebif); Terifl: teriflunomide.
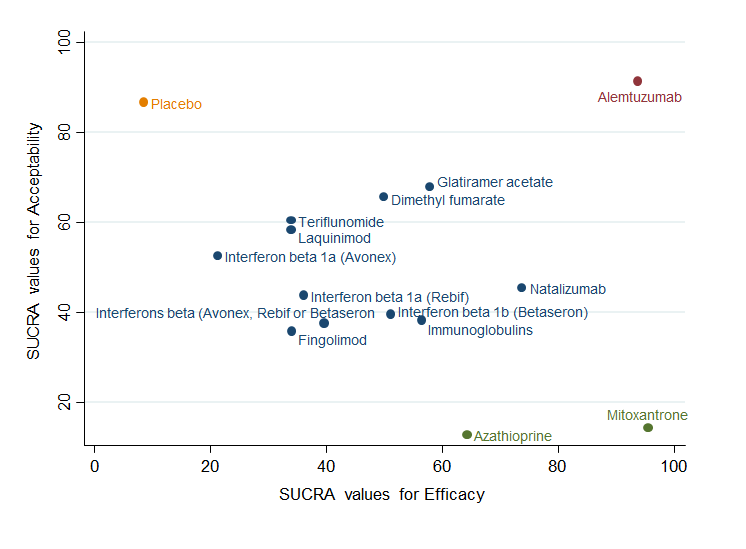
Clustered ranking plot based on cluster analysis of surface under the cumulative ranking curve (SUCRA) values for benefit (disability worsening) and acceptability (treatment discontinuation due to AEs) over 24 months. Each colour represents a group of treatments that belong to the same cluster. Treatments lying in the upper right corner are more effective and acceptable than the other treatments.
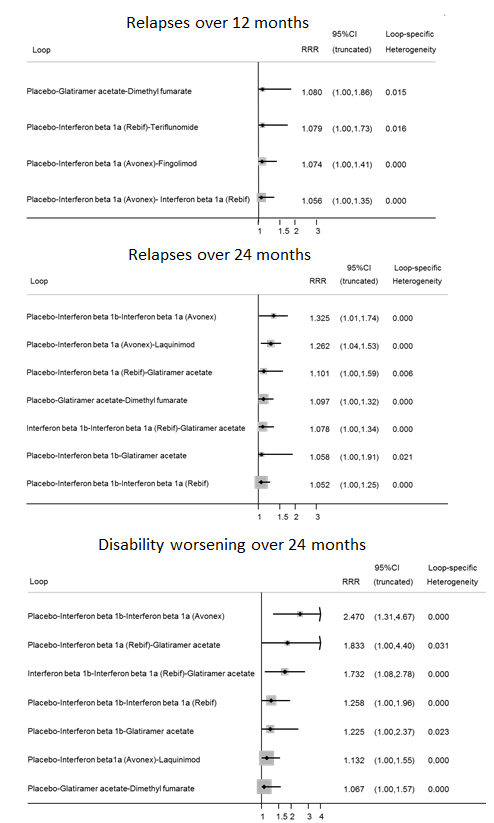
Inconsistency plots for relapses over 12 and 24 months and disability worsening over 24 months assuming loop‐specific heterogeneity estimates. RRR is calculated as the risk ratio for direct evidence over the risk ratio for indirect evidence in the loop and it is reported together with its 95% confidence interval (CI). RRR values close to one indicate the absence of evidence for disagreement between direct and indirect evidence.

Inconsistency plots for acceptability over 12 and 24 months assuming loop‐specific heterogeneity estimates. RRR is calculated as the risk ratio for direct evidence over the risk ratio for indirect evidence in the loop and it is reported together with its 95% confidence interval (CI). RRR values close to one indicate the absence of evidence for disagreement between direct and indirect evidence.

Study limitations distribution for each network estimate for pairwise comparisons versus placebo on relapses over 12 and 24 months and disability worsening over 24 months outcomes. Calculations are based on the contributions of direct evidence to the network estimates and the overall risks of bias considering our predefined criteria (allocation concealment, blinding of outcome assessor, and incomplete outcome data) within studies contributing to the direct evidence. The colours represent risk (green, low; yellow, moderate; red, high). The direct comparisons against placebo are described in the vertical axis.

Contribution matrix: percentage contribution of each direct estimate to the NMA estimates versus placebo for relapses over 12 months outcome. Rows correspond to NMA risk ratios of each treatment versus placebo (separated for mixed and indirect evidence) and the columns correspond to direct meta‐analysis risk ratios. The last row shows the number of included direct comparisons. The names of the treatment comparisons are shown in the first column. For example, for relapses over 12 months, information for the network estimate of interferon beta 1a (Avonex) versus placebo is derived from both direct and indirect evidence (generating a mixed estimate). Of this mixed network estimate, trials directly comparing interferon beta 1a (Avonex) versus placebo contribute 31.2% of the information to the network estimate of effect and trials directly comparing interferon beta 1a (Rebif) versus interferon beta 1a (Avonex) contribute 18.8% of the network estimated effect, etc. The contribution matrix shows how much each direct comparison in the network contributes to each network (mixed or indirect) estimate and to the entire network.

Contribution matrix: percentage contribution of each direct estimate to the NMA estimates versus placebo for relapses over 24 months outcome.

Contribution matrix: percentage contribution of each direct estimate to the NMA estimates versus placebo for disability worsening over 24 months outcome.

Comparison 1 Treatment benefit within pairwise comparisons, Outcome 1 Comparisons for relapses over 12 months.
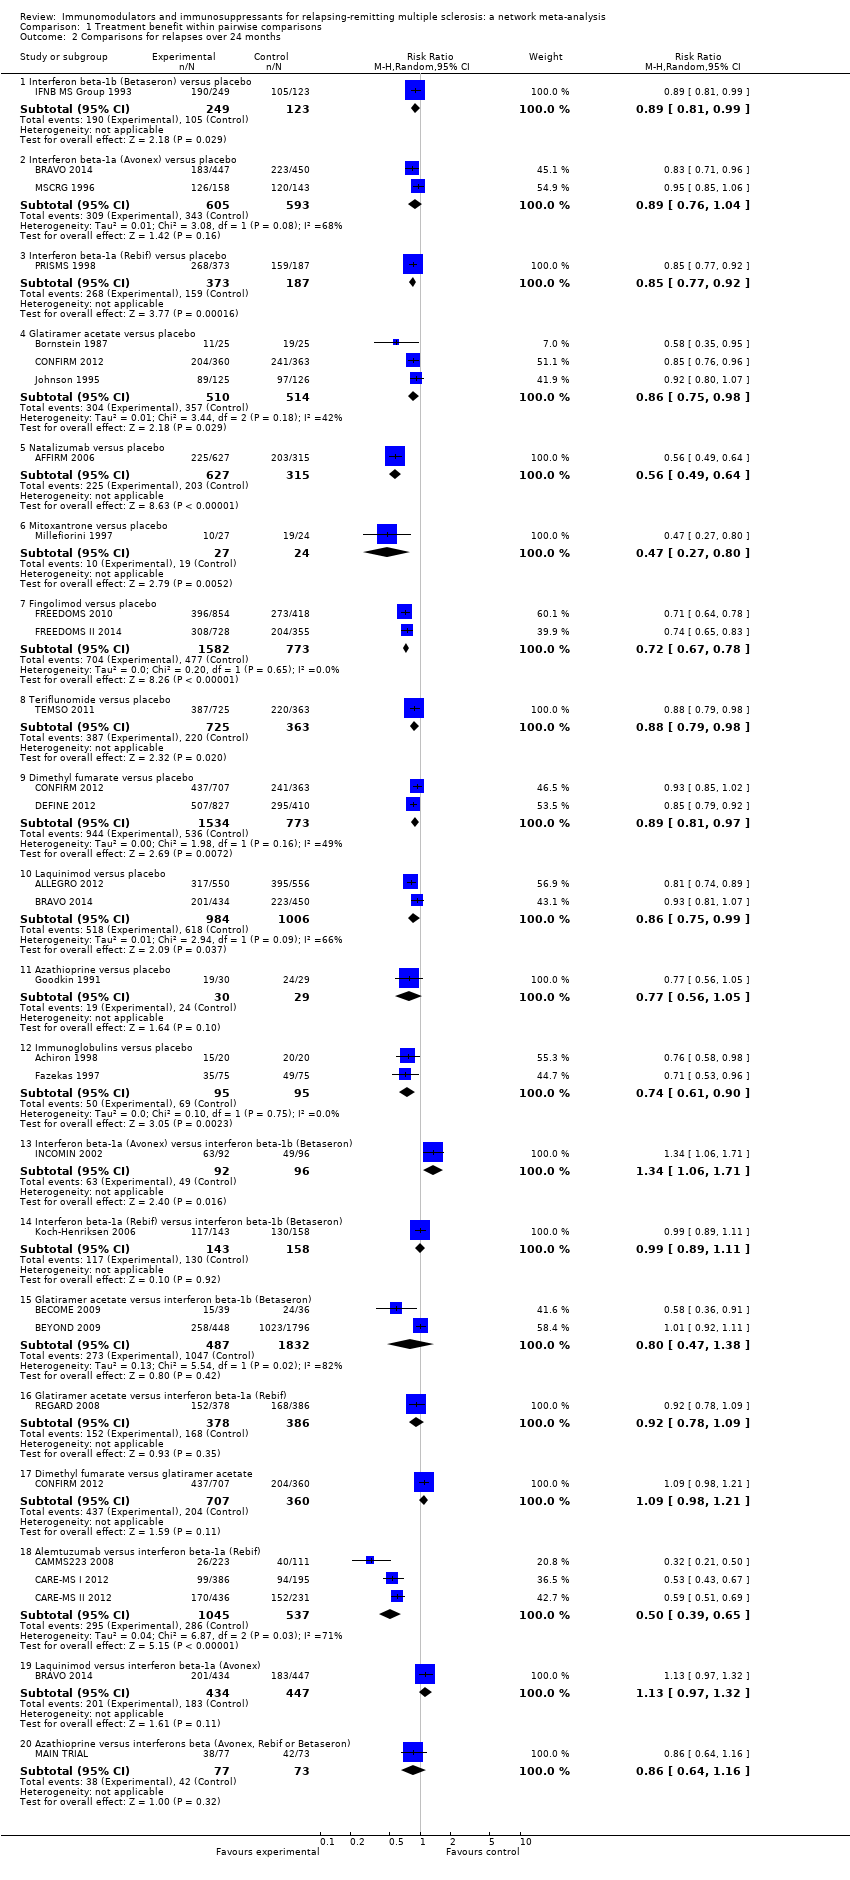
Comparison 1 Treatment benefit within pairwise comparisons, Outcome 2 Comparisons for relapses over 24 months.
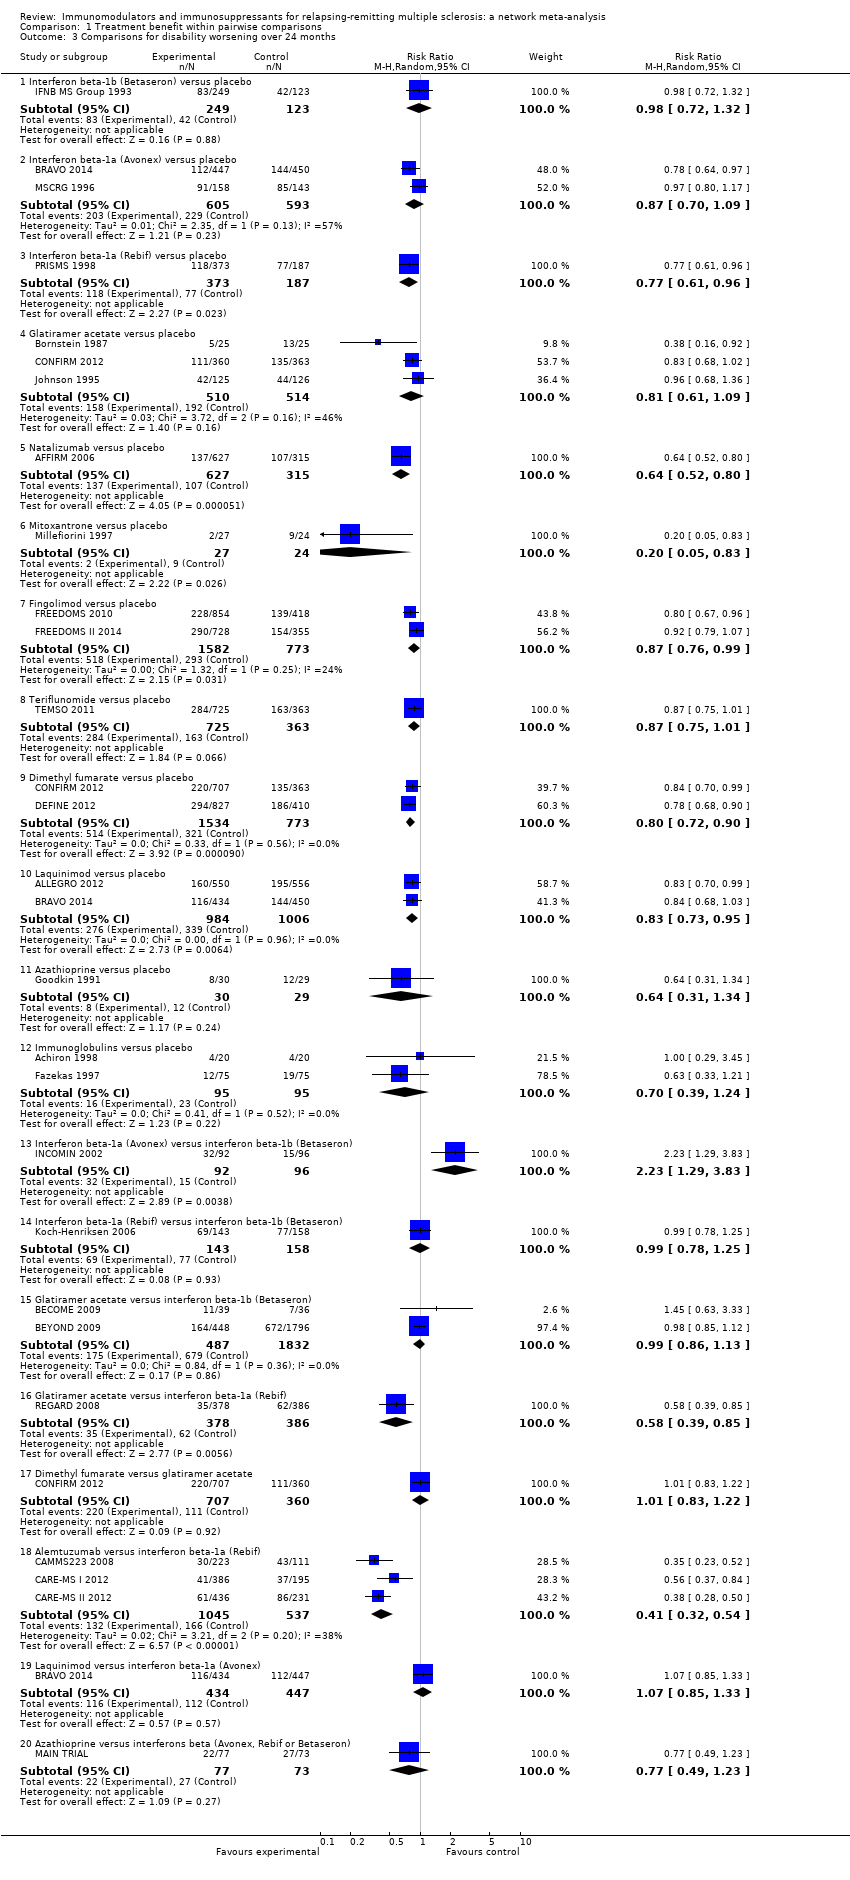
Comparison 1 Treatment benefit within pairwise comparisons, Outcome 3 Comparisons for disability worsening over 24 months.

Comparison 2 Treatment acceptability within pairwise comparisons, Outcome 1 Comparisons for treatment discontinuation due to AEs over 12 months.

Comparison 2 Treatment acceptability within pairwise comparisons, Outcome 2 Comparisons for treatment discontinuation due to AEs over 24 months.

Comparison 3 Treatment safety against placebo within pairwise comparisons, Outcome 1 Serious adverse events.
| Patient or population: patients with relapsing‐remitting multiple sclerosis (RRMS) Settings: secondary healthcare centres Intervention: any immunomodulators or immunosuppressants used for RRMS Comparison: placebo | |||||||
| Intervention | Illustrative comparative risks* | Relative effect | SUCRA | No of participants | Confidence in the evidence | Reasons for downgrading | |
| Assumed risk with placebo | Corresponding risk with intervention | ||||||
| CHANCE OF EXPERIENCING ONE OR MORE RELAPSES OVER 12 MONTHS | |||||||
| Alemtuzumab | Low | RR 0.40 (0.31 to 0.51) | 97% | — | Moderate | Downgraded one level due to risk of bias ‐ the majority of studies at high or unclear risk of bias in allocation concealment and/or blinding of outcome assessor domains | |
| 41 per 100 | 16 per 100 | ||||||
| High | |||||||
| 89 per 100 | 36 per 100 | ||||||
| Mitoxantrone | Low | RR 0.40 (0.20 to 0.76) | 93% | 51 | Low | Downgraded two levels due to risk of bias ‐ the singular study contributing to this estimate at high risk of bias in blinding of outcome assessor domain | |
| 41 per 100 | 16 per 100 | ||||||
| High | |||||||
| 89 per 100 | 36 per 100 | ||||||
| Natalizumab | Low | RR 0.56 (0.43 to 0.73) | 85% | 942 | High | — | |
| 41 per 100 | 23 per 100 | ||||||
| High | |||||||
| 89 per 100 | 50 per 100 | ||||||
| Fingolimod | Low | RR 0.63 (0.53 to 0.74) | 80% | 2355 | Low | Downgraded one level due to risk of bias and one level due to inconsistency ‐ the majority of studies at high or unclear risk of bias in allocation concealment and/or blinding of outcome assessor domains; I2 = 82% (P value = 0.02) | |
| 41 per 100 | 26 per 100 | ||||||
| High | |||||||
| 89 per 100 | 56 per 100 | ||||||
| Dimethyl fumarate | Low | RR 0.78 (0.65 to 0.93) | 55% | 2307 | Moderate | Downgraded one level due to inconsistency ‐ wide predictive interval | |
| 41 per 100 | 32 per 100 | ||||||
| High | |||||||
| 89 per 100 | 69 per 100 | ||||||
| Immunoglobulins | Low | RR 0.78 (0.61 to 1.00) | 53% | 219 | Very low | Downgraded one level due to risk of bias, two levels due to inconsistency, and one level due to imprecision ‐ the majority of studies at unclear risk of bias in allocation concealment and/or blinding of outcome assessor domains; I2 = 83% (P value = 0.003) and differences between pairwise and common τ2 (0.18 versus 0.01); wide CIs | |
| 41 per 100 | 32 per 100 | ||||||
| High | |||||||
| 89 per 100 | 69 per 100 | ||||||
| Glatiramer acetate | Low | RR 0.80 (0.68 to 0.93) | 52% | 2416 | Moderate | Downgraded one level due to inconsistency ‐ wide predictive interval | |
| 41 per 100 | 33 per 100 | ||||||
| High | |||||||
| 89 per 100 | 71 per 100 | ||||||
| Daclizumab | Low | RR 0.79 (0.61 to 1.02) | 52% | 621 | Moderate | Downgraded one level due to imprecision ‐ wide CIs | |
| 41 per 100 | 32 per 100 | ||||||
| High | |||||||
| 89 per 100 | 70 per 100 | ||||||
| Teriflunomide | Low | RR 0.84 (0.72 to 0.99) | 42% | 2257 | Low | Downgraded one level due to risk of bias and one level due to inconsistency ‐ the majority of studies at unclear risk of bias in allocation concealment and/or blinding of outcome assessor domains; wide predictive interval | |
| 41 per 100 | 34 per 100 | ||||||
| High | |||||||
| 89 per 100 | 75 per 100 | ||||||
| Azathioprine | Low | RR 0.87 (0.58 to 1.31) | 39% | 59 | Very low | Downgraded one level due to risk of bias, one level due to indirectness, and two levels due to imprecision ‐ the singular study contributing to this estimate at unclear risk of bias in allocation concealment domain; indirectness of population (one monocentric study); wide CIs | |
| 41 per 100 | 36 per 100 | ||||||
| High | |||||||
| 89 per 100 | 77 per 100 | ||||||
| Interferon beta‐1a (Rebif) | Low | RR 0.87 (0.76 to 1.01) | 36% | 853 | Low | Downgraded one level due to risk of bias and one level due to inconsistency ‐ the majority of studies at high or unclear risk of bias in allocation concealment and/or blinding of outcome assessor domains; I2 = 88% (P value = 0.004) | |
| 41 per 100 | 36 per 100 | ||||||
| High | |||||||
| 89 per 100 | 77 per 100 | ||||||
| Pegylated interferon beta‐1a | Low | RR 0.89 (0.70 to 1.13) | 33% | 1512 | Low | Downgraded one level due to risk of bias and one level due to imprecision ‐ the singular study contributing to this estimate at unclear risk of bias in blinding of outcome assessor domain; wide CIs | |
| 41 per 100 | 36 per 100 | ||||||
| High | |||||||
| 89 per 100 | 79 per 100 | ||||||
| Interferon beta‐1b (Betaseron) | Low | RR 0.98 (0.54 to 1.75) | 27% | — | Very low | Downgraded one level due to risk of bias and two levels due to imprecision ‐ the majority of studies at unclear risk of bias in allocation concealment and/or blinding of outcome assessor domains; wide CIs | |
| 41 per 100 | 40 per 100 | ||||||
| High | |||||||
| 89 per 100 | 87 per 100 | ||||||
| Interferon beta‐1a (Avonex) | Low | RR 0.93 (0.78 to 1.10) | 25% | 301 | Moderate | Downgraded one level due to risk of bias ‐ the majority of studies at high or unclear risk of bias in allocation concealment and/or blinding of outcome assessor domains | |
| 41 per 100 | 38 per 100 | ||||||
| High | |||||||
| 89 per 100 | 83 per 100 | ||||||
| Interferons beta (Avonex, Rebif or Betaseron) | Low | RR 1.05 (0.61 to 1.79) | 20% | — | Very low | Downgraded one level due to risk of bias, one level due to indirectness, and two levels due to imprecision ‐ the majority of studies at high or unclear risk of bias in allocation concealment and/or blinding of outcome assessor domains; indirectness of population (one monocentric study contributing 50% to this estimate); wide CIs | |
| 41 per 100 | 43 per 100 | ||||||
| High | |||||||
| 89 per 100 | 93 per 100 | ||||||
| CHANCE OF EXPERIENCING ONE OR MORE RELAPSES OVER 24 MONTHS | |||||||
| Alemtuzumab | Low | RR 0.46 (0.38 to 0.55) | 96% | — | Moderate | Downgraded one level due to risk of bias ‐ the majority of studies at high or unclear risk of bias in allocation concealment and/or blinding of outcome assessor domains | |
| 57 per 100 | 26 per 100 | ||||||
| High | |||||||
| 85 per 100 | 39 per 100 | ||||||
| Mitoxantrone | Low | RR 0.47 (0.27 to 0.81) | 92% | 51 | Very low | Downgraded two levels due to risk of bias and one level due to inconsistency ‐ the singular study contributing to this estimate at high risk of bias in blinding of outcome assessor domain; wide predictive interval | |
| 57 per 100 | 27 per 100 | ||||||
| High | |||||||
| 85 per 100 | 40 per 100 | ||||||
| Natalizumab | Low | RR 0.56 (0.47 to 0.66) | 88% | 942 | High | — | |
| 57 per 100 | 32 per 100 | ||||||
| High | |||||||
| 85 per 100 | 48 per 100 | ||||||
| Fingolimod | Low | RR 0.72 (0.64 to 0.81) | 71% | 2355 | Moderate | Downgraded one level due to risk of bias ‐ studies at unclear risk of bias in allocation concealment domain | |
| 57 per 100 | 41 per 100 | ||||||
| High | |||||||
| 85 per 100 | 61 per 100 | ||||||
| Immunoglobulins | Low | RR 0.74 (0.60 to 0.91) | 66% | 190 | Moderate | Downgraded one level due to inconsistency ‐ wide predictive interval | |
| 57 per 100 | 42 per 100 | ||||||
| High | |||||||
| 85 per 100 | 63 per 100 | ||||||
| Azathioprine | Low | RR 0.77 (0.55 to 1.07) | 57% | 59 | Very low | Downgraded one level due to risk of bias, one level due to indirectness, and one level due to imprecision ‐ the singular study contributing to this estimate at unclear risk of bias in allocation concealment domain; indirectness of population (one monocentric study); wide CIs | |
| 57 per 100 | 44 per 100 | ||||||
| High | |||||||
| 85 per 100 | 65 per 100 | ||||||
| Glatiramer acetate | Low | RR 0.83 (0.75 to 0.91) | 48% | 1024 | Moderate | Downgraded one level due to inconsistency ‐ wide predictive interval | |
| 57 per 100 | 47 per 100 | ||||||
| High | |||||||
| 85 per 100 | 71 per 100 | ||||||
| Interferon beta‐1b (Betaseron) | Low | RR 0.85 (0.77 to 0.94) | 42% | 372 | Very low | Downgraded one level due to risk of bias and two levels due to inconsistency ‐ the majority of studies at high or unclear risk of bias in allocation concealment and/or blinding of outcome assessor domains; wide predictive interval and inconsistent loops of evidence | |
| 57 per 100 | 48 per 100 | ||||||
| High | |||||||
| 85 per 100 | 72 per 100 | ||||||
| Interferon beta‐1a (Rebif) | Low | RR 0.86 (0.77 to 0.95) | 39% | 560 | Low | Downgraded one level due to risk of bias and one level due to inconsistency ‐ the majority of studies at high or unclear risk of bias in allocation concealment and/or blinding of outcome assessor domains; wide predictive interval | |
| 57 per 100 | 49 per 100 | ||||||
| High | |||||||
| 85 per 100 | 73 per 100 | ||||||
| Interferons beta (Avonex, Rebif or Betaseron) | Low | RR 0.89 (0.56 to 1.42) | 33% | — | Very low | Downgraded one level due to risk of bias, one level due to indirectness, and one level due to imprecision ‐ the majority of studies at high or unclear risk of bias in allocation concealment and/or blinding of outcome assessor domains; indirectness of population (one monocentric study contributing for 50% to this estimate); wide CIs | |
| 57 per 100 | 51 per 100 | ||||||
| High | |||||||
| 85 per 100 | 76 per 100 | ||||||
| Teriflunomide | Low | RR 0.88 (0.75 to 1.03) | 32% | 1088 | Very low | Downgraded two levels due to risk of bias and one level due to imprecision ‐ the singular study contributing to this estimate at high risk of bias in blinding of outcome assessor domain; wide CIs | |
| 57 per 100 | 50 per 100 | ||||||
| High | |||||||
| 85 per 100 | 75 per 100 | ||||||
| Laquinimod | Low | RR 0.88 (0.79 to 0.99) | 31% | 1990 | Very low | Downgraded one level due to risk of bias and two levels due to inconsistency ‐ the majority of studies at high or unclear risk of bias in allocation concealment and/or blinding of outcome assessor domains; I2 = 66% (P value = 0.09), wide predictive interval and inconsistent loops of evidence | |
| 57 per 100 | 50 per 100 | ||||||
| High | |||||||
| 85 per 100 | 75 per 100 | ||||||
| Dimethyl fumarate | Low | RR 0.89 (0.81 to 0.98) | 30% | 2307 | Moderate | Downgraded one level due to inconsistency ‐ wide predictive interval | |
| 57 per 100 | 51 per 100 | ||||||
| High | |||||||
| 85 per 100 | 76 per 100 | ||||||
| Interferon beta‐1a (Avonex) | Low | RR 0.91 (0.82 to 1.02) | 22% | 1198 | Low | Downgraded one level due to risk of bias and one level due to inconsistency ‐ the majority of studies at high or unclear risk of bias in allocation concealment and/or blinding of outcome assessor domains; inconsistent loops of evidence | |
| 57 per 100 | 52 per 100 | ||||||
| High | |||||||
| 85 per 100 | 77 per 100 | ||||||
| CHANCE OF DISABILITY GETTING WORSE OVER 24 MONTHS | |||||||
| Mitoxantrone | Low | RR 0.20 (0.05 to 0.84) | 96% | 51 | Low | Downgraded one level due to indirectness and one level due to inconsistency ‐ surrogate outcome unclear; wide predictive interval | |
| 25 per 100 | 5 per 100 | ||||||
| High | |||||||
| 52 per 100 | 10 per 100 | ||||||
| Alemtuzumab | Low | RR 0.35 (0.26 to 0.48) | 94% | — | Low | Downgraded one level due to risk of bias and one level due to indirectness ‐ the majority of studies at high or unclear risk of bias in allocation concealment and/or blinding of outcome assessor domains; surrogate outcome in the majority of studies contributing to this estimate | |
| 25 per 100 | 9 per 100 | ||||||
| High | |||||||
| 52 per 100 | 18 per 100 | ||||||
| Natalizumab | Low | RR 0.64 (0.49 to 0.85) | 74% | 942 | Moderate | Downgraded one level due to indirectness ‐ surrogate outcome | |
| 25 per 100 | 16 per 100 | ||||||
| High | |||||||
| 52 per 100 | 33 per 100 | ||||||
| Azathioprine | Low | RR 0.64 (0.30 to 1.37) | 64% | 59 | Very low | Downgraded one level due to risk of bias, two levels due to indirectness, and two levels due to imprecision ‐ the singular study contributing to this estimate at unclear risk of bias in allocation concealment domain; indirectness of population (one monocentric study) and surrogate outcome unclear; wide CIs | |
| 25 per 100 | 16 per 100 | ||||||
| High | |||||||
| 52 per 100 | 33 per 100 | ||||||
| Glatiramer acetate | Low | RR 0.77 (0.64 to 0.92) | 58% | 1024 | Very low | Downgraded one level due to indirectness and two levels due to inconsistency ‐ surrogate outcome in the majority of studies contributing to this estimate; wide predictive interval and inconsistent loops of evidence | |
| 25 per 100 | 19 per 100 | ||||||
| High | |||||||
| 52 per 100 | 40 per 100 | ||||||
| Immunoglobulins | Low | RR 0.70 (0.39 to 1.27) | 56% | 190 | Very low | Downgraded one level due to indirectness, one level due to inconsistency, and two levels due to imprecision ‐ surrogate outcome in the majority of studies contributing to this estimate; wide predictive interval; wide CIs | |
| 25 per 100 | 18 per 100 | ||||||
| High | |||||||
| 52 per 100 | 36 per 100 | ||||||
| Interferon beta‐1b (Betaseron) | Low | RR 0.79 (0.65 to 0.97) | 51% | 372 | Very low | Downgraded one level due to risk of bias, one level due to indirectness, and two levels due to inconsistency ‐ the majority of studies at high or unclear risk of bias in allocation concealment and/or blinding of outcome assessor domains; surrogate outcome in the majority of studies contributing to this estimate; wide predictive interval and inconsistent loops of evidence | |
| 25 per 100 | 20 per 100 | ||||||
| High | |||||||
| 52 per 100 | 41 per 100 | ||||||
| Dimethyl fumarate | Low | RR 0.80 (0.67 to 0.94) | 50% | 2307 | Low | Downgraded one level due to indirectness and one level due to inconsistency ‐ surrogate outcome in the majority of studies contributing to this estimate; wide predictive interval | |
| 25 per 100 | 20 per 100 | ||||||
| High | |||||||
| 52 per 100 | 42 per 100 | ||||||
| Interferons beta (Avonex, Rebif or Betaseron) | Low | RR 0.83 (0.34 to 2.07) | 40% | — | Very low | Downgraded one level due to indirectness, one level due to inconsistency, and two levels due to imprecision ‐ indirectness of population and surrogate outcome unclear (one study contributing for 50% to this estimate); wide predictive interval; wide CIs | |
| 25 per 100 | 21 per 100 | ||||||
| High | |||||||
| 52 per 100 | 43 per 100 | ||||||
| Interferon beta‐1a (Rebif) | Low | RR 0.86 (0.69 to 1.06) | 36% | 560 | Very low | Downgraded one level due to risk of bias, one level due to indirectness, one level due to inconsistency, and one level due to imprecision ‐ the majority of studies at high or unclear risk of bias in allocation concealment and/or blinding of outcome assessor domains; surrogate outcome in the majority of studies contributing to this estimate; inconsistent loops of evidence; wide CIs | |
| 25 per 100 | 22 per 100 | ||||||
| High | |||||||
| 52 per 100 | 45 per 100 | ||||||
| Fingolimod | Low | RR 0.86 (0.73 to 1.03) | 34% | 2355 | Very low | Downgraded one level due to risk of bias, one level due to indirectness, and one level due to imprecision ‐ studies at unclear risk of bias in allocation concealment domain; surrogate outcome; wide CIs | |
| 25 per 100 | 22 per 100 | ||||||
| High | |||||||
| 52 per 100 | 45 per 100 | ||||||
| Laquinimod | Low | RR 0.87 (0.72 to 1.04) | 34% | 1990 | Low | Downgraded one level due to indirectness and one level due to imprecision ‐ surrogate outcome in the majority of studies contributing to this estimate; wide CIs | |
| 25 per 100 | 22 per 100 | ||||||
| High | |||||||
| 52 per 100 | 45 per 100 | ||||||
| Teriflunomide | Low | RR 0.87 (0.69 to 1.10) | 34% | 1088 | Low | Downgraded one level due to indirectness and one level due to imprecision ‐ surrogate outcome; wide CIs | |
| 25 per 100 | 22 per 100 | ||||||
| High | |||||||
| 52 per 100 | 45 per 100 | ||||||
| Interferon beta‐1a (Avonex) | Low | RR 0.93 (0.77 to 1.13) | 21% | 1198 | Very low | Downgraded one level due to risk of bias, one level due to indirectness, and two levels due to inconsistency ‐ the majority of studies at high or unclear risk of bias in allocation concealment and/or blinding of outcome assessor domains; surrogate outcome in the majority of studies contributing to this estimate; I2 = 57% (P value = 0.13), and inconsistent loops of evidence | |
| 25 per 100 | 23 per 100 | ||||||
| High | |||||||
| 52 per 100 | 48 per 100 | ||||||
| *The corresponding risk with intervention (and its 95% confidence interval) is based on the assumed risk with placebo and the relative effect of the intervention (and its 95% CI). Two values were chosen for the assumed risk with placebo, i.e. the second highest and second lowest placebo group risks in the included studies, defined as low and high assumed risk. #No of Participants (studies) is not available when the nature of the evidence is indirect. °We did not downgrade for reasons of reporting bias as insufficient studies contributed to network treatment estimates to draw meaningful conclusions. | |||||||
| GRADE Working Group grades of evidence | |||||||
| Study | Risk of bias | Did the researchers actively monitor for adverse events (AEs) or did they simply provide spontaneous reporting of AEs that arose? | Risk of bias | Did the authors define serious AEs (SAEs) according to an accepted international classification and report the number of SAEs? |
| Unclear | Not reported | High | SAEs not reported | |
| Unclear | Not reported | Low | Categorisation of SAEs conformed to ICH guidelines (International Conference on Harmonisation of Technical Requirements for Registration of Pharmaceuticals for Human Use) | |
| Low | "Treating neurologists were responsible for all aspects of patient care, including the management of adverse events". Participants"visited the clinic every 12 weeks for ... blood chemical and hematologic analyses, evaluation of adverse events..." (Page 901) | Unclear | Insufficient information on SAEs definition | |
| Low | "Safety assessments were performed at screening, at baseline, and every 3 months until month 24" (Page 1002) | Low | Categorisation of SAEs conformed to ICH guidelines (International Conference on Harmonisation of Technical Requirements for Registration of Pharmaceuticals for Human Use) | |
| Low | "After the initial interim analysis failed to raise any safety concerns with the use of monthly triple dose gadolinium, all patients still in the study were offered the option of obtaining additional monthly MRI scans for a second year of treatment" (Page 1977) | High | SAEs not reported | |
| Low | "Clinic visits were scheduled every 3 months to assess ... safety, and tolerability. The occurrence of new neurological symptoms and adverse events was assessed by telephone, 6 weeks after each visit" (Page 891) | Low | Categorisation of SAEs conformed to ICH guidelines (International Conference on Harmonisation of Technical Requirements for Registration of Pharmaceuticals for Human Use) | |
| High | "Self‐evaluation reported to a clinical assistant" (Page 409) | High | SAEs not reported | |
| Low | "Patients were evaluated at 12 scheduled visits: months ‐1 (screening), 0 (baseline), 1, 2, 3, 6, 9, 12, 15, 18, 21, and 24. Safety assessments (laboratory measures, vital signs) were performed at all visits, and electrocardiograms (ECGs) were performed at months ‐1, 0, 1, 2, 3, 6, 12, 18, and 24/early termination" (Page 775) | Unclear | Insufficient information on SAEs definition | |
| Low | "Safety was assessed quarterly by the treating neurologist, who was aware of study‐group assignment" (Page 1787), "Thyroid function and levels of antithyrotropinreceptor antibodies and lymphocyte subpopulations were measured quarterly at a central laboratory", and "All adverse events with an onset up to 36 months are reported. In addition, all serious adverse events and autoimmune‐associated disorders occurring before March 1, 2008, are listed" (Page 1788) | Low | Categorisation of SAEs conformed to ICH guidelines (International Conference on Harmonisation of Technical Requirements for Registration of Pharmaceuticals for Human Use) | |
| Low | "To assess safety, we undertook monthly questionnaire follow‐up of patients, and did complete blood counts, serum creatinine, urinalysis, and microscopy monthly (every three months in patients in the interferon beta 1a group), and thyroid function tests every 3 months", "Circulating lymphocyte subsets were assessed every 3 months in all patients and 1 month after alemtuzumab administration. We screened for antialemtuzumab antibodies with a bridging ELISA before and at 1 month, 3 months, and 12 months after each dosing", and "We measured interferon beta 1a‐neutralising antibodies at baseline and at 24 months with a cytopathic effect inhibition assay" (Page 1821) | Low | Categorisation of SAEs conformed to ICH guidelines (International Conference on Harmonisation of Technical Requirements for Registration of Pharmaceuticals for Human Use). | |
| Low | "To assess safety, we undertook monthly questionnaire follow‐up of patients, and did complete blood counts, serum creatinine, and urinalysis with microscopy monthly (every 3 months in patients in the interferon beta 1a group), and thyroid function tests every 3 months", "We assessed circulating lymphocyte subsets every 3 months in all patients and 1 month after every course of alemtuzumab. We screened for anti‐alemtuzumab antibodies with ELISA before and at 1 month, 3 months and 12 months after each dosing", and "We measured interferon beta 1a‐neutralising antibodies at baseline and at 24 months with a cytopathic effect inhibition assay" (Page 1832) | Low | Categorisation of SAEs conformed to ICH guidelines (International Conference on Harmonisation of Technical Requirements for Registration of Pharmaceuticals for Human Use) | |
| Low | "Safety was assessed by recording all adverse events, serious and nonserious" (Page 329) | Unclear | No information on SAE definition | |
| Unclear | "The treating physician monitored safety..." (Page 291) | Unclear | Insufficient information on SAEs definition | |
| Low | "Throughout the course of the study, every effort was made to remain alert to possible adverse events (AEs)" and "Any AE or SAE experienced by the subject was recorded on the CRF, regardless of the severity of the event or its relationship to study treatment" (Pages 66‐7 of Protocol) | Low | Categorisation of SAEs conformed to ICH guidelines (International Conference on Harmonisation of Technical Requirements for Registration of Pharmaceuticals for Human Use) | |
| Low | "Study visits were scheduled every 4 weeks for safety assessments, including the monitoring of laboratory values" (Page 1100) | Low | Categorisation of SAEs conformed to ICH guidelines (International Conference on Harmonisation of Technical Requirements for Registration of Pharmaceuticals for Human Use) | |
| Low | "Adverse events, vital signs and blood tests were monitored monthly" (Page 1724) | High | SAEs not reported | |
| High | "Adverse events were determined by spontaneous reporting and monthly laboratory testing during the comparative phase" (Page 2031) | Unclear | Insufficient information on SAEs definition | |
| Low | Participants "asked about safety monthly..." (Page 590) | High | SAEs not reported | |
| Unclear | Not reported | Unclear | Insufficient information on SAEs definition | |
| Low | "An independent data and safety monitoring board evaluated the safety" and "Study visits, including safety assessments, were scheduled at 2 weeks and 1, 2, 3, 6, 9, 12, 15, 18, 21, and 24 months after randomization" (Page 389) | Low | Categorisation of SAEs conformed to ICH guidelines (International Conference on Harmonisation of Technical Requirements for Registration of Pharmaceuticals for Human Use) | |
| Low | "...safety assessments, were scheduled at 2 weeks and 1, 2, 3, 6, 9, 12, 15, 18, 21, and 24 months after randomization" (Appendix, Page 2) | Low | Categorisation of SAEs conformed to ICH guidelines (International Conference on Harmonisation of Technical Requirements for Registration of Pharmaceuticals for Human Use) | |
| Low | "Safety assessments included adverse events (AEs), standard clinical laboratory tests, vital signs, and electrocardiographic (ECG) measurements" (Page 707) | Unclear | No information on SAE definition | |
| High | "Side effect were reported to the treating neurologist every 6 months" (Page 21) | High | SAEs not reported | |
| Low | "Treating neurologist reviewed side effects, laboratory findings for toxicity ..." (Page 656) | High | SAEs not reported | |
| Low | "Safety assessments included adverse events, vital signs, physical examination, and concomitant medications. Patients underwent haematology and biochemical tests, including liver‐function tests, every 2 weeks for the first 8 weeks, and then every 3 months" (Page 1455) | High | SAEs not reported | |
| Low | "The evaluating physician monitored safety every 3 month..." (Page 1270) | Unclear | Insufficient information on SAEs definition | |
| Low | "Patients were interviewed about side effects and had routine blood tests including hematology and liver function tests every 3 months and thyroid tests and neutralizing antibodies every 6 months" (Page 1057) | High | SAEs not reported | |
| Unclear | "Laboratory safety examinations were made at the beginning and at the end of the study period" (Page 566) | Unclear | Insufficient information on SAEs definition | |
| Low | "At scheduled (quarterly) and unscheduled (i.e., at the onset of new symptoms or complications) follow‐up visits the treating neurologist recorded symptoms, blood test results, clinical AEs and their management" | Low | Categorisation of SAEs conformed to ICH guidelines (International Conference on Harmonisation of Technical Requirements for Registration of Pharmaceuticals for Human Use) | |
| Low | "The safety of the treatment was assessed on the basis of adverse events volunteered by the patient either spontaneously or on questioning and monitoring of the main laboratory parameters" (Page 155) | Unclear | Insufficient information on SAEs definition | |
| Low | "Study visits were scheduled at baseline and every 6 months. Treating physicians reviewed toxicity test results, examined patients, and made all medical decision" (Page 286) | Unclear | Insufficient information on SAEs definition | |
| Unclear | "The treating physician recorded and treated AEs..." (Page 680) | Unclear | Insufficient information on SAEs definition | |
| Unclear | "A “treating” neurologist was responsible for overall medical management of the patient, including treatment of any side‐effects" (Page 1499) | Unclear | Insufficient information on SAEs definition | |
| Unclear | "Adverse events (including pregnancy), withdrawals owing to adverse events, serious adverse events, and laboratory results were obtained for safety comparisons" (Page 905) | Unclear | Insufficient information on SAEs definition | |
| Low | "Safety parameters were assessed at all visits" (Page 2168) | Unclear | No information on SAE definition | |
| Low | "A treating neurologist at each site was responsible for recording and managing adverse events and monitoring safety assessments" and "Safety was evaluated on the basis of adverse events reported by study participants or investigators. Laboratory tests were performed at the time of screening, at baseline, every 2 weeks for the first 24 weeks, and then every 6 weeks until study completion. Physical and neurologic examinations were performed at week 12 and then every 24 weeks. An abdominal ultrasonographic examination to asses for pancreatic abnormalities was performed before the study and then every 24 weeks, because of previous infrequent reports of pancreatitis associated with leflunomide use" (Pages 1294‐5) | Low | Categorisation of SAEs conformed to ICH guidelines (International Conference on Harmonisation of Technical Requirements for Registration of Pharmaceuticals for Human Use) | |
| Low | "Safety and tolerability were assessed using AE reporting, vital signs and laboratory assessments. Adverse event reports were collected at randomisation, Weeks 2, 6, 12, 18, 24, 36 and every 12 weeks thereafter. Vital signs were documented at screening, randomisation and every 12 weeks thereafter; clinical laboratory results were assessed throughout the study. Adverse events and vital signs were also recorded during unscheduled relapse visits" (Page 707) | Low | Categorisation of SAEs conformed to ICH guidelines (International Conference on Harmonisation of Technical Requirements for Registration of Pharmaceuticals for Human Use) [information provided on request by Genzyme] | |
| Low | "Safety was assessed through adverse event reporting (upon occurrence), clinical laboratory tests (every 2 weeks until week 24, then every 6 weeks while still on treatment), vital signs (at weeks 2 and 6, then every 6 weeks until week 24, then every 12 weeks while still on treatment), abdominal ultrasonography (at week 24, then every 24 weeks), and electrocardiography (at baseline and end of treatment)" (Page 248) | Low | Categorisation of SAEs conformed to ICH guidelines (International Conference on Harmonisation of Technical Requirements for Registration of Pharmaceuticals for Human Use) | |
| Low | "An independent data and safety monitoring board evaluated overall safety in the fingolimod phase 3 program" and "Safety assessments were conducted during screening, at baseline, and at months 1, 2, 3, 6, 9, and 12" (Page 404) | Low | Categorisation of SAEs conformed to ICH guidelines (International Conference on Harmonisation of Technical Requirements for Registration of Pharmaceuticals for Human Use) |
| Intervention | Subgroup analysis by | |||||||
| Diagnostic criteria | Previous treatments RR (95% CI) | Definition of relapse RR (95% CI) | Pre‐trial relapse rate RR (95% CI) | |||||
| Poser criteria | McDonald criteria | No | Yes | 24‐hour definition | 48‐hour definition | ≥ 1 during the year before randomisation | ≥ 2 during the 2/3 years before randomisation | |
| Alemtuzumab | — | 0.48 (0.33 to 0.68) | 0.46 (0.28 to 0.76) | 0.47 (0.27 to 0.79) | — | 0.46 (0.27 to 0.78) | 0.63 (0.48 to 0.81) | 0.28 (0.16 to 0.49) |
| Natalizumab | — | 0.56 (0.45 to 0.69) | — | 0.70 (0.56 to 0.88) | 0.63 (0.52 to 0.77) | — | 0.68 (0.54 to 0.85) | — |
| Fingolimod | — | 0.72 (0.63 to 0.83) | — | 0.72 (0.65 to 0.80) | 0.81 (0.67 to 0.97) | — | — | 0.72 (0.60 to 0.87) |
| CI: confidence interval; NMA: network meta‐analysis; RR: risk ratio. | ||||||||
| Intervention | Sensitivity analysis | ||
| Including only trials of low risk of bias | Excluding studies that did not provide complete and clear reporting of dropout data RR (95% CI) | Excluding trials with a total sample size of fewer than 50 randomised participants RR (95% CI) | |
| Alemtuzumab | — | 0.47 (0.35 to 0.63) | 0.46 (0.39 to 0.56) |
| Natalizumab | 0.66 (0.54 to 0.81) | — | 0.56 (0.47 to 0.66) |
| Fingolimod | — | 0.72 (0.65 to 0.80) | 0.72 (0.64 to 0.81) |
| CI: confidence interval; NMA: network meta‐analysis; RR: risk ratio. | |||
| Outcome or subgroup title | No. of studies | No. of participants | Statistical method | Effect size |
| 1 Comparisons for relapses over 12 months Show forest plot | 29 | Risk Ratio (M‐H, Random, 95% CI) | Subtotals only | |
| 1.1 Interferon beta‐1a (Avonex) versus placebo | 1 | 301 | Risk Ratio (M‐H, Random, 95% CI) | 0.88 [0.73, 1.05] |
| 1.2 Interferon beta‐1a (Rebif) versus placebo | 2 | 853 | Risk Ratio (M‐H, Random, 95% CI) | 0.89 [0.66, 1.19] |
| 1.3 Glatiramer acetate versus placebo | 4 | 2416 | Risk Ratio (M‐H, Random, 95% CI) | 0.79 [0.66, 0.95] |
| 1.4 Natalizumab versus placebo | 1 | 942 | Risk Ratio (M‐H, Random, 95% CI) | 0.56 [0.47, 0.66] |
| 1.5 Mitoxantrone versus placebo | 1 | 51 | Risk Ratio (M‐H, Random, 95% CI) | 0.40 [0.21, 0.74] |
| 1.6 Fingolimod versus placebo | 2 | 2355 | Risk Ratio (M‐H, Random, 95% CI) | 0.63 [0.48, 0.82] |
| 1.7 Teriflunomide versus placebo | 2 | 2257 | Risk Ratio (M‐H, Random, 95% CI) | 0.86 [0.78, 0.95] |
| 1.8 Dimethyl fumarate versus placebo | 2 | 2307 | Risk Ratio (M‐H, Random, 95% CI) | 0.79 [0.71, 0.88] |
| 1.9 Pegylated interferon beta‐1a versus placebo | 1 | 1512 | Risk Ratio (M‐H, Random, 95% CI) | 0.89 [0.78, 1.01] |
| 1.10 Daclizumab versus placebo | 1 | 621 | Risk Ratio (M‐H, Random, 95% CI) | 0.79 [0.68, 0.92] |
| 1.11 Azathioprine versus placebo | 1 | 59 | Risk Ratio (M‐H, Random, 95% CI) | 0.87 [0.61, 1.24] |
| 1.12 Immunoglobulins versus placebo | 3 | 219 | Risk Ratio (M‐H, Random, 95% CI) | 0.80 [0.47, 1.36] |
| 1.13 Interferon beta‐1a (Rebif) versus interferon beta‐1a (Avonex) | 1 | 677 | Risk Ratio (M‐H, Random, 95% CI) | 0.91 [0.80, 1.03] |
| 1.14 Glatiramer acetate versus interferon beta‐1b (Betaseron) | 1 | 75 | Risk Ratio (M‐H, Random, 95% CI) | 0.81 [0.48, 1.38] |
| 1.15 Azathioprine versus interferons beta (Avonex, Rebif or Betaseron) | 2 | 244 | Risk Ratio (M‐H, Random, 95% CI) | 0.81 [0.49, 1.33] |
| 1.16 Fingolimod versus interferon beta‐1a (Avonex) | 1 | 1292 | Risk Ratio (M‐H, Random, 95% CI) | 0.67 [0.57, 0.79] |
| 1.17 Teriflunomide versus interferon beta‐1a (Rebif) | 1 | 324 | Risk Ratio (M‐H, Random, 95% CI) | 0.91 [0.69, 1.18] |
| 1.18 Dimethyl fumarate versus glatiramer acetate | 1 | 1067 | Risk Ratio (M‐H, Random, 95% CI) | 0.96 [0.80, 1.14] |
| 1.19 Alemtuzumab versus interferon beta‐1a (Rebif) | 3 | 1582 | Risk Ratio (M‐H, Random, 95% CI) | 0.46 [0.39, 0.55] |
| 2 Comparisons for relapses over 24 months Show forest plot | 26 | Risk Ratio (M‐H, Random, 95% CI) | Subtotals only | |
| 2.1 Interferon beta‐1b (Betaseron) versus placebo | 1 | 372 | Risk Ratio (M‐H, Random, 95% CI) | 0.89 [0.81, 0.99] |
| 2.2 Interferon beta‐1a (Avonex) versus placebo | 2 | 1198 | Risk Ratio (M‐H, Random, 95% CI) | 0.89 [0.76, 1.04] |
| 2.3 Interferon beta‐1a (Rebif) versus placebo | 1 | 560 | Risk Ratio (M‐H, Random, 95% CI) | 0.85 [0.77, 0.92] |
| 2.4 Glatiramer acetate versus placebo | 3 | 1024 | Risk Ratio (M‐H, Random, 95% CI) | 0.86 [0.75, 0.98] |
| 2.5 Natalizumab versus placebo | 1 | 942 | Risk Ratio (M‐H, Random, 95% CI) | 0.56 [0.49, 0.64] |
| 2.6 Mitoxantrone versus placebo | 1 | 51 | Risk Ratio (M‐H, Random, 95% CI) | 0.47 [0.27, 0.80] |
| 2.7 Fingolimod versus placebo | 2 | 2355 | Risk Ratio (M‐H, Random, 95% CI) | 0.72 [0.67, 0.78] |
| 2.8 Teriflunomide versus placebo | 1 | 1088 | Risk Ratio (M‐H, Random, 95% CI) | 0.88 [0.79, 0.98] |
| 2.9 Dimethyl fumarate versus placebo | 2 | 2307 | Risk Ratio (M‐H, Random, 95% CI) | 0.89 [0.81, 0.97] |
| 2.10 Laquinimod versus placebo | 2 | 1990 | Risk Ratio (M‐H, Random, 95% CI) | 0.86 [0.75, 0.99] |
| 2.11 Azathioprine versus placebo | 1 | 59 | Risk Ratio (M‐H, Random, 95% CI) | 0.77 [0.56, 1.05] |
| 2.12 Immunoglobulins versus placebo | 2 | 190 | Risk Ratio (M‐H, Random, 95% CI) | 0.74 [0.61, 0.90] |
| 2.13 Interferon beta‐1a (Avonex) versus interferon beta‐1b (Betaseron) | 1 | 188 | Risk Ratio (M‐H, Random, 95% CI) | 1.34 [1.06, 1.71] |
| 2.14 Interferon beta‐1a (Rebif) versus interferon beta‐1b (Betaseron) | 1 | 301 | Risk Ratio (M‐H, Random, 95% CI) | 0.99 [0.89, 1.11] |
| 2.15 Glatiramer acetate versus interferon beta‐1b (Betaseron) | 2 | 2319 | Risk Ratio (M‐H, Random, 95% CI) | 0.80 [0.47, 1.38] |
| 2.16 Glatiramer acetate versus interferon beta‐1a (Rebif) | 1 | 764 | Risk Ratio (M‐H, Random, 95% CI) | 0.92 [0.78, 1.09] |
| 2.17 Dimethyl fumarate versus glatiramer acetate | 1 | 1067 | Risk Ratio (M‐H, Random, 95% CI) | 1.09 [0.98, 1.21] |
| 2.18 Alemtuzumab versus interferon beta‐1a (Rebif) | 3 | 1582 | Risk Ratio (M‐H, Random, 95% CI) | 0.50 [0.39, 0.65] |
| 2.19 Laquinimod versus interferon beta‐1a (Avonex) | 1 | 881 | Risk Ratio (M‐H, Random, 95% CI) | 1.13 [0.97, 1.32] |
| 2.20 Azathioprine versus interferons beta (Avonex, Rebif or Betaseron) | 1 | 150 | Risk Ratio (M‐H, Random, 95% CI) | 0.86 [0.64, 1.16] |
| 3 Comparisons for disability worsening over 24 months Show forest plot | 26 | Risk Ratio (M‐H, Random, 95% CI) | Subtotals only | |
| 3.1 Interferon beta‐1b (Betaseron) versus placebo | 1 | 372 | Risk Ratio (M‐H, Random, 95% CI) | 0.98 [0.72, 1.32] |
| 3.2 Interferon beta‐1a (Avonex) versus placebo | 2 | 1198 | Risk Ratio (M‐H, Random, 95% CI) | 0.87 [0.70, 1.09] |
| 3.3 Interferon beta‐1a (Rebif) versus placebo | 1 | 560 | Risk Ratio (M‐H, Random, 95% CI) | 0.77 [0.61, 0.96] |
| 3.4 Glatiramer acetate versus placebo | 3 | 1024 | Risk Ratio (M‐H, Random, 95% CI) | 0.81 [0.61, 1.09] |
| 3.5 Natalizumab versus placebo | 1 | 942 | Risk Ratio (M‐H, Random, 95% CI) | 0.64 [0.52, 0.80] |
| 3.6 Mitoxantrone versus placebo | 1 | 51 | Risk Ratio (M‐H, Random, 95% CI) | 0.20 [0.05, 0.83] |
| 3.7 Fingolimod versus placebo | 2 | 2355 | Risk Ratio (M‐H, Random, 95% CI) | 0.87 [0.76, 0.99] |
| 3.8 Teriflunomide versus placebo | 1 | 1088 | Risk Ratio (M‐H, Random, 95% CI) | 0.87 [0.75, 1.01] |
| 3.9 Dimethyl fumarate versus placebo | 2 | 2307 | Risk Ratio (M‐H, Random, 95% CI) | 0.80 [0.72, 0.90] |
| 3.10 Laquinimod versus placebo | 2 | 1990 | Risk Ratio (M‐H, Random, 95% CI) | 0.83 [0.73, 0.95] |
| 3.11 Azathioprine versus placebo | 1 | 59 | Risk Ratio (M‐H, Random, 95% CI) | 0.64 [0.31, 1.34] |
| 3.12 Immunoglobulins versus placebo | 2 | 190 | Risk Ratio (M‐H, Random, 95% CI) | 0.70 [0.39, 1.24] |
| 3.13 Interferon beta‐1a (Avonex) versus interferon beta‐1b (Betaseron) | 1 | 188 | Risk Ratio (M‐H, Random, 95% CI) | 2.23 [1.29, 3.83] |
| 3.14 Interferon beta‐1a (Rebif) versus interferon beta‐1b (Betaseron) | 1 | 301 | Risk Ratio (M‐H, Random, 95% CI) | 0.99 [0.78, 1.25] |
| 3.15 Glatiramer acetate versus interferon beta‐1b (Betaseron) | 2 | 2319 | Risk Ratio (M‐H, Random, 95% CI) | 0.99 [0.86, 1.13] |
| 3.16 Glatiramer acetate versus interferon beta‐1a (Rebif) | 1 | 764 | Risk Ratio (M‐H, Random, 95% CI) | 0.58 [0.39, 0.85] |
| 3.17 Dimethyl fumarate versus glatiramer acetate | 1 | 1067 | Risk Ratio (M‐H, Random, 95% CI) | 1.01 [0.83, 1.22] |
| 3.18 Alemtuzumab versus interferon beta‐1a (Rebif) | 3 | 1582 | Risk Ratio (M‐H, Random, 95% CI) | 0.41 [0.32, 0.54] |
| 3.19 Laquinimod versus interferon beta‐1a (Avonex) | 1 | 881 | Risk Ratio (M‐H, Random, 95% CI) | 1.07 [0.85, 1.33] |
| 3.20 Azathioprine versus interferons beta (Avonex, Rebif or Betaseron) | 1 | 150 | Risk Ratio (M‐H, Random, 95% CI) | 0.77 [0.49, 1.23] |
| Outcome or subgroup title | No. of studies | No. of participants | Statistical method | Effect size |
| 1 Comparisons for treatment discontinuation due to AEs over 12 months Show forest plot | 13 | Risk Ratio (M‐H, Random, 95% CI) | Subtotals only | |
| 1.1 Interferon beta‐1a (Avonex) 30 µg versus placebo | 1 | 301 | Risk Ratio (M‐H, Random, 95% CI) | 3.17 [0.67, 15.00] |
| 1.2 Interferon beta‐1a (Rebif) 22 µg versus placebo | 1 | 195 | Risk Ratio (M‐H, Random, 95% CI) | 3.16 [0.13, 76.54] |
| 1.3 Interferon beta‐1a (Rebif) 44 µg versus placebo | 1 | 198 | Risk Ratio (M‐H, Random, 95% CI) | 11.22 [0.63, 200.27] |
| 1.4 Glatiramer acetate 20 mg daily versus placebo | 1 | 239 | Risk Ratio (M‐H, Random, 95% CI) | 1.51 [0.26, 8.89] |
| 1.5 Glatiramer 40 mg three times per week versus placebo | 1 | 1404 | Risk Ratio (M‐H, Random, 95% CI) | 2.36 [0.99, 5.65] |
| 1.6 Teriflunomide 7 mg versus placebo | 1 | 797 | Risk Ratio (M‐H, Random, 95% CI) | 2.06 [1.31, 3.24] |
| 1.7 Teriflunomide 14 mg versus placebo | 1 | 761 | Risk Ratio (M‐H, Random, 95% CI) | 2.51 [1.61, 3.91] |
| 1.8 Pegylated interferon beta‐1a every 4 weeks versus placebo | 1 | 1000 | Risk Ratio (M‐H, Random, 95% CI) | 2.78 [1.31, 5.89] |
| 1.9 Pegylated interferon beta‐1a every 2 weeks versus placebo | 1 | 1012 | Risk Ratio (M‐H, Random, 95% CI) | 2.82 [1.34, 5.96] |
| 1.10 Daclizumab 150 mg versus placebo | 1 | 412 | Risk Ratio (M‐H, Random, 95% CI) | 3.43 [0.72, 16.33] |
| 1.11 Daclizumab 300 mg versus placebo | 1 | 413 | Risk Ratio (M‐H, Random, 95% CI) | 4.39 [0.96, 20.08] |
| 1.12 Immunoglobulins 0.2 g versus placebo | 2 | 163 | Risk Ratio (M‐H, Random, 95% CI) | 2.14 [0.23, 19.96] |
| 1.13 Immunoglobulins 0.4 g versus placebo | 1 | 34 | Risk Ratio (M‐H, Random, 95% CI) | 3.35 [0.15, 76.93] |
| 1.14 Interferon beta‐1a (Rebif) 44 µg versus interferon beta‐1a (Avonex) 30 µg | 1 | 677 | Risk Ratio (M‐H, Random, 95% CI) | 1.05 [0.56, 1.97] |
| 1.15 Fingolimod 0.5 mg versus interferon beta‐1a (Avonex) 30 µg | 1 | 866 | Risk Ratio (M‐H, Random, 95% CI) | 1.43 [0.81, 2.54] |
| 1.16 Fingolimod 1.25 mg versus interferon beta‐1a (Avonex) 30 µg | 1 | 861 | Risk Ratio (M‐H, Random, 95% CI) | 2.36 [1.40, 3.98] |
| 1.17 Teriflunomide 7 mg versus interferon beta‐1a (Rebif) 44 µg | 1 | 213 | Risk Ratio (M‐H, Random, 95% CI) | 0.39 [0.19, 0.81] |
| 1.18 Teriflunomide 14 mg versus interferon beta‐1a (Rebif) 44 µg | 1 | 215 | Risk Ratio (M‐H, Random, 95% CI) | 0.51 [0.27, 0.98] |
| 1.19 Azathioprine versus interferons beta (Avonex, Rebif or Betaseron) | 1 | 94 | Risk Ratio (M‐H, Random, 95% CI) | 1.0 [0.21, 4.70] |
| 2 Comparisons for treatment discontinuation due to AEs over 24 months Show forest plot | 23 | Risk Ratio (M‐H, Random, 95% CI) | Subtotals only | |
| 2.1 Interferon beta‐1b (Betaseron) 50 µg versus placebo | 1 | 248 | Risk Ratio (M‐H, Random, 95% CI) | 4.92 [0.58, 41.51] |
| 2.2 Interferon beta‐1b (Betaseron) 250 µg versus placebo | 1 | 247 | Risk Ratio (M‐H, Random, 95% CI) | 9.92 [1.29, 76.32] |
| 2.3 Interferon beta‐1a (Avonex) 30 µg versus placebo | 1 | 897 | Risk Ratio (M‐H, Random, 95% CI) | 1.43 [0.81, 2.54] |
| 2.4 Interferon beta‐1a (Rebif) 22 µg versus placebo | 1 | 376 | Risk Ratio (M‐H, Random, 95% CI) | 2.31 [0.61, 8.79] |
| 2.5 Interferon beta‐1a (Rebif) 44 µg versus placebo | 1 | 371 | Risk Ratio (M‐H, Random, 95% CI) | 3.05 [0.84, 11.08] |
| 2.6 Glatiramer acetate 20 mg daily versus placebo | 3 | 1024 | Risk Ratio (M‐H, Random, 95% CI) | 1.74 [0.49, 6.13] |
| 2.7 Natalizumab versus placebo | 1 | 942 | Risk Ratio (M‐H, Random, 95% CI) | 1.53 [0.93, 2.53] |
| 2.8 Mitoxantrone versus placebo | 1 | 51 | Risk Ratio (M‐H, Random, 95% CI) | 9.82 [0.57, 168.84] |
| 2.9 Fingolimod 0.5 mg versus placebo | 2 | 1556 | Risk Ratio (M‐H, Random, 95% CI) | 1.42 [0.89, 2.25] |
| 2.10 Fingolimod 1.25 mg versus placebo | 2 | 1572 | Risk Ratio (M‐H, Random, 95% CI) | 1.93 [1.48, 2.52] |
| 2.11 Teriflunomide 7 mg versus placebo | 1 | 729 | Risk Ratio (M‐H, Random, 95% CI) | 1.23 [0.77, 1.96] |
| 2.12 Teriflunomide 14 mg versus placebo | 1 | 722 | Risk Ratio (M‐H, Random, 95% CI) | 1.36 [0.86, 2.15] |
| 2.13 Dimethyl fumarate 480 mg versus placebo | 2 | 1546 | Risk Ratio (M‐H, Random, 95% CI) | 1.17 [0.91, 1.51] |
| 2.14 Dimethyl fumarate 720 mg versus placebo | 2 | 1534 | Risk Ratio (M‐H, Random, 95% CI) | 1.20 [0.93, 1.54] |
| 2.15 Laquinimod versus placebo | 2 | 1990 | Risk Ratio (M‐H, Random, 95% CI) | 1.39 [0.96, 2.00] |
| 2.16 Azathioprine versus placebo | 1 | 59 | Risk Ratio (M‐H, Random, 95% CI) | 5.8 [0.74, 45.26] |
| 2.17 Immunoglobulins 0.15 to 0.20 g versus placebo | 1 | 150 | Risk Ratio (M‐H, Random, 95% CI) | 3.0 [0.32, 28.19] |
| 2.18 Interferon beta‐1a (Avonex) 30 µg versus interferon beta‐1b (Betaseron) 250 µg | 1 | 188 | Risk Ratio (M‐H, Random, 95% CI) | 0.21 [0.02, 1.75] |
| 2.19 Glatiramer acetate 20 mg daily versus interferon beta‐1b (Betaseron) 250 μg | 2 | 1420 | Risk Ratio (M‐H, Random, 95% CI) | 1.19 [0.56, 2.53] |
| 2.20 Glatiramer acetate 20 mg daily versus interferon beta‐1b (Betaseron) 500 μg | 1 | 1347 | Risk Ratio (M‐H, Random, 95% CI) | 0.79 [0.37, 1.68] |
| 2.21 Glatiramer acetate 20 mg daily versus interferon beta‐1a (Rebif) 44 µg | 1 | 764 | Risk Ratio (M‐H, Random, 95% CI) | 0.84 [0.47, 1.52] |
| 2.22 Dimethyl fumarate 480 mg versus glatiramer acetate 20 mg daily | 1 | 722 | Risk Ratio (M‐H, Random, 95% CI) | 1.22 [0.80, 1.84] |
| 2.23 Dimethyl fumarate 720 mg versus glatiramer acetate 20 mg daily | 1 | 705 | Risk Ratio (M‐H, Random, 95% CI) | 1.22 [0.80, 1.85] |
| 2.24 Alemtuzumab 12 mg versus interferon beta‐1a (Rebif) 44 µg | 3 | 1472 | Risk Ratio (M‐H, Random, 95% CI) | 0.38 [0.22, 0.68] |
| 2.25 Alemtuzumab 24 mg versus interferon beta‐1a (Rebif) 44 µg | 2 | 625 | Risk Ratio (M‐H, Random, 95% CI) | 0.33 [0.10, 1.09] |
| 2.26 Laquinimod versus interferon beta‐1a (Avonex) 30 µg | 1 | 881 | Risk Ratio (M‐H, Random, 95% CI) | 0.84 [0.49, 1.45] |
| 2.27 Azathioprine versus interferons beta (Avonex, Rebif or Betaseron) | 1 | 150 | Risk Ratio (M‐H, Random, 95% CI) | 2.21 [0.90, 5.45] |
| Outcome or subgroup title | No. of studies | No. of participants | Statistical method | Effect size |
| 1 Serious adverse events Show forest plot | 16 | Risk Ratio (M‐H, Random, 95% CI) | Subtotals only | |
| 1.1 Interferons beta (Avonex, Rebif or Betaseron) versus placebo | 3 | 870 | Risk Ratio (M‐H, Random, 95% CI) | 1.26 [0.67, 2.37] |
| 1.2 Glatiramer acetate versus placebo | 2 | 490 | Risk Ratio (M‐H, Random, 95% CI) | 1.87 [0.73, 4.74] |
| 1.3 Natalizumab versus placebo | 1 | 939 | Risk Ratio (M‐H, Random, 95% CI) | 1.19 [0.81, 1.73] |
| 1.4 Fingolimod versus placebo | 2 | 1572 | Risk Ratio (M‐H, Random, 95% CI) | 0.97 [0.72, 1.30] |
| 1.5 Teriflunomide versus placebo | 1 | 718 | Risk Ratio (M‐H, Random, 95% CI) | 1.26 [0.87, 1.83] |
| 1.6 Dimethyl fumarate versus placebo | 2 | 1531 | Risk Ratio (M‐H, Random, 95% CI) | 1.09 [0.76, 1.55] |
| 1.7 Pegylated interferon beta‐1a versus placebo | 1 | 1012 | Risk Ratio (M‐H, Random, 95% CI) | 0.98 [0.57, 1.68] |
| 1.8 Daclizumab versus placebo | 1 | 413 | Risk Ratio (M‐H, Random, 95% CI) | 1.55 [0.77, 3.10] |
| 1.9 Laquinimod versus placebo | 2 | 1988 | Risk Ratio (M‐H, Random, 95% CI) | 0.97 [0.67, 1.41] |
| 1.10 Immunoglobulins versus placebo | 1 | 83 | Risk Ratio (M‐H, Random, 95% CI) | 0.65 [0.11, 3.70] |