Inmunomoduladores e inmunosupresores para la esclerosis múltiple recurrente remitente: un metanálisis de redes
Resumen
Antecedentes
Para el tratamiento de los pacientes con esclerosis múltiple recurrente remitente (EMRR) están disponibles diferentes estrategias terapéuticas que incluyen inmunomoduladores, inmunosupresores y productos biológicos. Aunque hay consenso con respecto a que estos tratamientos reducen la frecuencia de las recurrencias, su efecto beneficioso relativo para retardar las nuevas recurrencias o el empeoramiento de la discapacidad todavía no está claro debido al número limitado de ensayos de comparación directa.
Objetivos
Comparar el efecto beneficioso y la aceptabilidad del interferón beta‐1b, el interferón beta‐1a (Avonex, Rebif), el acetato de glatiramero, el natalizumab, la mitoxantrona, el fingolimod, la teriflunomida, el dimetilfumarato, el alemtuzumab, el interferón pegilado beta‐1a, el daclizumab, el laquinimod, la azatioprina y las inmunoglobulinas para el tratamiento de los pacientes con EMRR y proporcionar una clasificación de estos tratamientos según su efecto beneficioso y aceptabilidad, definida como la proporción de participantes que se retiraron debido a cualquier evento adverso.
Métodos de búsqueda
Se hicieron búsquedas en el registro de ensayos del Grupo Cochrane de Esclerosis Múltiple y Enfermedades Raras del Sistema Nervioso Central (Cochrane Multiple Sclerosis and Rare Diseases of the CNS Group Trials Register), que contiene registros de CENTRAL (2014, número 9), MEDLINE (1966 hasta 2014), EMBASE (1974 hasta 2014), CINAHL (1981 hasta 2014), LILACS (1982 hasta 2014), clinicaltrials.gov, en el WHO trials registry, y en los informes de la US Food and Drug Administration (FDA). La búsqueda más reciente se hizo en septiembre 2014.
Criterios de selección
Ensayos controlados aleatorios (ECA) que estudiaron uno o más de los 15 tratamientos como monoterapia, en comparación con placebo o con otro agente activo, para su uso en adultos con EMRR.
Obtención y análisis de los datos
Dos autores identificaron de forma independiente los estudios a partir de los resultados de búsqueda y extrajeron los datos. La síntesis de los datos se realizó mediante el metanálisis pareado y el metanálisis de redes. La calidad del grupo de pruebas de los resultados dentro del metanálisis de redes se evaluó según GRADE como muy baja, baja, moderada o alta.
Resultados principales
Se incluyeron 39 estudios en esta revisión, en los que se asignaron al azar a 25 113 participantes. En su mayoría los ensayos incluidos fueron estudios a corto plazo, con una duración mediana de 24 meses. Veinticuatro (60%) fueron controlados con placebo y 15 (40%) fueron estudios de comparación directa.
El metanálisis de redes mostró que, desde el punto de vista de un efecto protector contra las reincidencias de las recurrencias en la EMRR durante los primeros 24 meses de tratamiento, el alemtuzumab, la mitoxantrona, el natalizumab y el fingolimod sobresalieron por encima de otros fármacos. El fármaco más eficaz fue alemtuzumab (cociente de riesgos [CR] versus placebo 0,46; intervalo de confianza [IC] del 95%: 0,38 a 0,55; superficie bajo la curva de clasificación acumulativa (en inglés, SUCRA) 96%; pruebas de calidad moderada), seguido de la mitoxantrona (CR 0,47; IC del 95%: 0,27 a 0,81; SUCRA 92%; pruebas de calidad muy baja), el natalizumab (CR 0,56; IC del 95%: 0,47 a 0,66; SUCRA 88%; pruebas de alta calidad) y el fingolimod (CR 0,72; IC del 95%: 0,64 a 0,81; SUCRA 71%; pruebas de calidad moderada).
El empeoramiento de la discapacidad se basó en un marcador alternativo, definido como el empeoramiento irreversible confirmado a los tres meses de seguimiento, medido durante los primeros 24 meses en la mayoría de los estudios incluidos. Las comparaciones directas e indirectas revelaron que los tratamientos más efectivos fueron la mitoxantrona (CR versus placebo 0,20; IC del 95%: 0,05 a 0,84; SUCRA 96%; pruebas de calidad baja), el alemtuzumab (CR 0,35; IC del 95%: 0,26 a 0,48; SUCRA 94%; pruebas de calidad baja) y el natalizumab (CR 0,64; IC del 95%: 0,49 a 0,85; SUCRA 74%; pruebas de calidad moderada).
Casi todos los agentes incluidos en esta revisión se asociaron con una mayor proporción de participantes que se retiraron debido a cualquier evento adverso en comparación con placebo. Según la metodología del metanálisis de redes, las estimaciones del CR correspondiente versus placebo después de los primeros 24 meses de seguimiento fueron: mitoxantrona 9,92 (IC del 95%: 0,54 a 168,84), fingolimod 1,69 (IC del 95%: 1,32 a 2,17), natalizumab 1,53 (IC del 95%: 0,93 a 2,53) y alemtuzumab 0,72 (IC del 95%: 0,32 a 1,61).
La información sobre los eventos adversos graves (EAG) no fue suficiente, se caracterizó por resultados heterogéneos y se basó en un número muy bajo de eventos observados durante la duración a corto plazo de los ensayos incluidos en esta revisión.
Conclusiones de los autores
Se justifica la interpretación conservadora de estos resultados, ya que la mayoría de los tratamientos incluidos se ha evaluado en pocos ensayos. El enfoque GRADE recomienda proporcionar implicaciones para la práctica basadas en pruebas de calidad moderada a alta. Esta revisión indica que alemtuzumab, natalizumab y fingolimod son las mejores elecciones para la prevención de las recurrencias clínicas en los pacientes con EMRR, pero estas pruebas están limitadas a los primeros 24 meses de seguimiento. Para la prevención del empeoramiento de la discapacidad a corto plazo (24 meses), solamente natalizumab muestra un efecto beneficioso sobre la base de pruebas de calidad moderada (todas las otras estimaciones se basaron en pruebas de calidad baja a muy baja). Por lo tanto, actualmente no hay pruebas suficientes disponibles para evaluar los tratamientos para la prevención del empeoramiento irreversible de la discapacidad.
Hay dos motivos de preocupación importantes adicionales que se tienen que considerar. Primero, el efecto beneficioso de todos estos tratamientos más allá de los dos años es incierto y este es un aspecto relevante en una enfermedad con una duración de 30 a 40 años. Segundo, los ensayos a corto plazo proporcionan datos de seguridad escasos y con un informe deficiente y no proporcionan pruebas útiles para obtener un perfil de riesgos confiable de los tratamientos. Para proporcionar información a largo plazo sobre la seguridad de los tratamientos incluidos en esta revisión será necesario también evaluar estudios no aleatorios e informes posteriores a la comercialización publicados por los organismos reguladores. Finalmente, más del 70% de los estudios incluidos en esta revisión fue patrocinado por compañías farmacéuticas, lo que puede haber influido en los resultados.
Hay tres necesidades que se deben tratar entre los temas de investigaciones. Primero, serían útiles ensayos aleatorios de comparaciones directas entre agentes activos, y evitar los estudios controlados con placebo adicionales. Segundo, debe ser obligatorio el seguimiento de las cohortes originales del ensayo. Tercero, se necesitan más estudios para evaluar el efecto beneficioso y la seguridad a medio y a largo plazo de las inmunoterapias, así como la seguridad comparativa de diferentes agentes.
PICO
Resumen en términos sencillos
Inmunomoduladores e inmunosupresores para la esclerosis múltiple recurrente remitente: un metanálisis de redes
Antecedentes
Para el tratamiento de los pacientes con esclerosis múltiple recurrente remitente (EMRR) están disponibles diferentes estrategias terapéuticas que incluyen inmunomoduladores, inmunosupresores y productos biológicos. Aunque hay consenso con respecto a que estos tratamientos pueden reducir la frecuencia de las recurrencias, su efecto beneficioso relativo (efectividad comparados entre sí) para retrasar las nuevas recurrencias o el empeoramiento de la discapacidad todavía no está claro debido al número limitado de estudios de comparación directa (es decir, estudios que comparan dos o más agentes activos entre sí).
Objetivos
Se intentó evaluar y clasificar el efecto beneficioso y el grado de los eventos adversos asociados con 15 fármacos, es decir interferón beta‐1b, interferón beta‐1a (Avonex, Rebif), acetato de glatiramero, natalizumab, mitoxantrona, fingolimod, teriflunomida, dimetilfumarato, alemtuzumab, interferón pegilado beta‐1a, daclizumab, laquinimod, azatioprina e inmunoglobulinas.
Características de los estudios
En esta revisión, hasta septiembre de 2014, se incluyeron 39 estudios con 25 113 participantes que presentaban EMRR. En su mayoría los estudios incluidos fueron a corto plazo, con una duración mediana de 24 meses.
Resultados clave y calidad de las pruebas
Para prevenir las recurrencias, alemtuzumab, natalizumab y fingolimod son más eficaces que los otros fármacos, según pruebas de calidad moderada a alta.
Actualmente no hay pruebas suficientes disponibles con respecto a la prevención del empeoramiento irreversible de la discapacidad.
Casi todos los agentes incluidos en esta revisión se asociaron con una mayor proporción de participantes que se retiraron debido a cualquier evento adverso en comparación con placebo.
Vale la pena señalar lo siguiente:
‐ El efecto beneficioso de todos estos tratamientos más allá de los dos años es incierto y este es un aspecto muy relevante para los pacientes con una enfermedad vitalicia como la esclerosis múltiple, que posiblemente necesitará tratamientos a largo plazo.
‐ Los datos de seguridad de estos estudios a corto plazo son escasos, con un informe deficiente y no pueden proporcionar pruebas suficientes para obtener un perfil de riesgos confiable de los tratamientos incluidos en esta revisión.
‐ En su mayoría los estudios incluidos fueron patrocinados por compañías farmacéuticas, lo que constituye una fuente posible conocida de sesgo.
Conclusiones de los autores
Summary of findings
| Patient or population: patients with relapsing‐remitting multiple sclerosis (RRMS) Settings: secondary healthcare centres Intervention: any immunomodulators or immunosuppressants used for RRMS Comparison: placebo | |||||||
| Intervention | Illustrative comparative risks* | Relative effect | SUCRA | No of participants | Confidence in the evidence | Reasons for downgrading | |
| Assumed risk with placebo | Corresponding risk with intervention | ||||||
| CHANCE OF EXPERIENCING ONE OR MORE RELAPSES OVER 12 MONTHS | |||||||
| Alemtuzumab | Low | RR 0.40 (0.31 to 0.51) | 97% | — | Moderate | Downgraded one level due to risk of bias ‐ the majority of studies at high or unclear risk of bias in allocation concealment and/or blinding of outcome assessor domains | |
| 41 per 100 | 16 per 100 | ||||||
| High | |||||||
| 89 per 100 | 36 per 100 | ||||||
| Mitoxantrone | Low | RR 0.40 (0.20 to 0.76) | 93% | 51 | Low | Downgraded two levels due to risk of bias ‐ the singular study contributing to this estimate at high risk of bias in blinding of outcome assessor domain | |
| 41 per 100 | 16 per 100 | ||||||
| High | |||||||
| 89 per 100 | 36 per 100 | ||||||
| Natalizumab | Low | RR 0.56 (0.43 to 0.73) | 85% | 942 | High | — | |
| 41 per 100 | 23 per 100 | ||||||
| High | |||||||
| 89 per 100 | 50 per 100 | ||||||
| Fingolimod | Low | RR 0.63 (0.53 to 0.74) | 80% | 2355 | Low | Downgraded one level due to risk of bias and one level due to inconsistency ‐ the majority of studies at high or unclear risk of bias in allocation concealment and/or blinding of outcome assessor domains; I2 = 82% (P value = 0.02) | |
| 41 per 100 | 26 per 100 | ||||||
| High | |||||||
| 89 per 100 | 56 per 100 | ||||||
| Dimethyl fumarate | Low | RR 0.78 (0.65 to 0.93) | 55% | 2307 | Moderate | Downgraded one level due to inconsistency ‐ wide predictive interval | |
| 41 per 100 | 32 per 100 | ||||||
| High | |||||||
| 89 per 100 | 69 per 100 | ||||||
| Immunoglobulins | Low | RR 0.78 (0.61 to 1.00) | 53% | 219 | Very low | Downgraded one level due to risk of bias, two levels due to inconsistency, and one level due to imprecision ‐ the majority of studies at unclear risk of bias in allocation concealment and/or blinding of outcome assessor domains; I2 = 83% (P value = 0.003) and differences between pairwise and common τ2 (0.18 versus 0.01); wide CIs | |
| 41 per 100 | 32 per 100 | ||||||
| High | |||||||
| 89 per 100 | 69 per 100 | ||||||
| Glatiramer acetate | Low | RR 0.80 (0.68 to 0.93) | 52% | 2416 | Moderate | Downgraded one level due to inconsistency ‐ wide predictive interval | |
| 41 per 100 | 33 per 100 | ||||||
| High | |||||||
| 89 per 100 | 71 per 100 | ||||||
| Daclizumab | Low | RR 0.79 (0.61 to 1.02) | 52% | 621 | Moderate | Downgraded one level due to imprecision ‐ wide CIs | |
| 41 per 100 | 32 per 100 | ||||||
| High | |||||||
| 89 per 100 | 70 per 100 | ||||||
| Teriflunomide | Low | RR 0.84 (0.72 to 0.99) | 42% | 2257 | Low | Downgraded one level due to risk of bias and one level due to inconsistency ‐ the majority of studies at unclear risk of bias in allocation concealment and/or blinding of outcome assessor domains; wide predictive interval | |
| 41 per 100 | 34 per 100 | ||||||
| High | |||||||
| 89 per 100 | 75 per 100 | ||||||
| Azathioprine | Low | RR 0.87 (0.58 to 1.31) | 39% | 59 | Very low | Downgraded one level due to risk of bias, one level due to indirectness, and two levels due to imprecision ‐ the singular study contributing to this estimate at unclear risk of bias in allocation concealment domain; indirectness of population (one monocentric study); wide CIs | |
| 41 per 100 | 36 per 100 | ||||||
| High | |||||||
| 89 per 100 | 77 per 100 | ||||||
| Interferon beta‐1a (Rebif) | Low | RR 0.87 (0.76 to 1.01) | 36% | 853 | Low | Downgraded one level due to risk of bias and one level due to inconsistency ‐ the majority of studies at high or unclear risk of bias in allocation concealment and/or blinding of outcome assessor domains; I2 = 88% (P value = 0.004) | |
| 41 per 100 | 36 per 100 | ||||||
| High | |||||||
| 89 per 100 | 77 per 100 | ||||||
| Pegylated interferon beta‐1a | Low | RR 0.89 (0.70 to 1.13) | 33% | 1512 | Low | Downgraded one level due to risk of bias and one level due to imprecision ‐ the singular study contributing to this estimate at unclear risk of bias in blinding of outcome assessor domain; wide CIs | |
| 41 per 100 | 36 per 100 | ||||||
| High | |||||||
| 89 per 100 | 79 per 100 | ||||||
| Interferon beta‐1b (Betaseron) | Low | RR 0.98 (0.54 to 1.75) | 27% | — | Very low | Downgraded one level due to risk of bias and two levels due to imprecision ‐ the majority of studies at unclear risk of bias in allocation concealment and/or blinding of outcome assessor domains; wide CIs | |
| 41 per 100 | 40 per 100 | ||||||
| High | |||||||
| 89 per 100 | 87 per 100 | ||||||
| Interferon beta‐1a (Avonex) | Low | RR 0.93 (0.78 to 1.10) | 25% | 301 | Moderate | Downgraded one level due to risk of bias ‐ the majority of studies at high or unclear risk of bias in allocation concealment and/or blinding of outcome assessor domains | |
| 41 per 100 | 38 per 100 | ||||||
| High | |||||||
| 89 per 100 | 83 per 100 | ||||||
| Interferons beta (Avonex, Rebif or Betaseron) | Low | RR 1.05 (0.61 to 1.79) | 20% | — | Very low | Downgraded one level due to risk of bias, one level due to indirectness, and two levels due to imprecision ‐ the majority of studies at high or unclear risk of bias in allocation concealment and/or blinding of outcome assessor domains; indirectness of population (one monocentric study contributing 50% to this estimate); wide CIs | |
| 41 per 100 | 43 per 100 | ||||||
| High | |||||||
| 89 per 100 | 93 per 100 | ||||||
| CHANCE OF EXPERIENCING ONE OR MORE RELAPSES OVER 24 MONTHS | |||||||
| Alemtuzumab | Low | RR 0.46 (0.38 to 0.55) | 96% | — | Moderate | Downgraded one level due to risk of bias ‐ the majority of studies at high or unclear risk of bias in allocation concealment and/or blinding of outcome assessor domains | |
| 57 per 100 | 26 per 100 | ||||||
| High | |||||||
| 85 per 100 | 39 per 100 | ||||||
| Mitoxantrone | Low | RR 0.47 (0.27 to 0.81) | 92% | 51 | Very low | Downgraded two levels due to risk of bias and one level due to inconsistency ‐ the singular study contributing to this estimate at high risk of bias in blinding of outcome assessor domain; wide predictive interval | |
| 57 per 100 | 27 per 100 | ||||||
| High | |||||||
| 85 per 100 | 40 per 100 | ||||||
| Natalizumab | Low | RR 0.56 (0.47 to 0.66) | 88% | 942 | High | — | |
| 57 per 100 | 32 per 100 | ||||||
| High | |||||||
| 85 per 100 | 48 per 100 | ||||||
| Fingolimod | Low | RR 0.72 (0.64 to 0.81) | 71% | 2355 | Moderate | Downgraded one level due to risk of bias ‐ studies at unclear risk of bias in allocation concealment domain | |
| 57 per 100 | 41 per 100 | ||||||
| High | |||||||
| 85 per 100 | 61 per 100 | ||||||
| Immunoglobulins | Low | RR 0.74 (0.60 to 0.91) | 66% | 190 | Moderate | Downgraded one level due to inconsistency ‐ wide predictive interval | |
| 57 per 100 | 42 per 100 | ||||||
| High | |||||||
| 85 per 100 | 63 per 100 | ||||||
| Azathioprine | Low | RR 0.77 (0.55 to 1.07) | 57% | 59 | Very low | Downgraded one level due to risk of bias, one level due to indirectness, and one level due to imprecision ‐ the singular study contributing to this estimate at unclear risk of bias in allocation concealment domain; indirectness of population (one monocentric study); wide CIs | |
| 57 per 100 | 44 per 100 | ||||||
| High | |||||||
| 85 per 100 | 65 per 100 | ||||||
| Glatiramer acetate | Low | RR 0.83 (0.75 to 0.91) | 48% | 1024 | Moderate | Downgraded one level due to inconsistency ‐ wide predictive interval | |
| 57 per 100 | 47 per 100 | ||||||
| High | |||||||
| 85 per 100 | 71 per 100 | ||||||
| Interferon beta‐1b (Betaseron) | Low | RR 0.85 (0.77 to 0.94) | 42% | 372 | Very low | Downgraded one level due to risk of bias and two levels due to inconsistency ‐ the majority of studies at high or unclear risk of bias in allocation concealment and/or blinding of outcome assessor domains; wide predictive interval and inconsistent loops of evidence | |
| 57 per 100 | 48 per 100 | ||||||
| High | |||||||
| 85 per 100 | 72 per 100 | ||||||
| Interferon beta‐1a (Rebif) | Low | RR 0.86 (0.77 to 0.95) | 39% | 560 | Low | Downgraded one level due to risk of bias and one level due to inconsistency ‐ the majority of studies at high or unclear risk of bias in allocation concealment and/or blinding of outcome assessor domains; wide predictive interval | |
| 57 per 100 | 49 per 100 | ||||||
| High | |||||||
| 85 per 100 | 73 per 100 | ||||||
| Interferons beta (Avonex, Rebif or Betaseron) | Low | RR 0.89 (0.56 to 1.42) | 33% | — | Very low | Downgraded one level due to risk of bias, one level due to indirectness, and one level due to imprecision ‐ the majority of studies at high or unclear risk of bias in allocation concealment and/or blinding of outcome assessor domains; indirectness of population (one monocentric study contributing for 50% to this estimate); wide CIs | |
| 57 per 100 | 51 per 100 | ||||||
| High | |||||||
| 85 per 100 | 76 per 100 | ||||||
| Teriflunomide | Low | RR 0.88 (0.75 to 1.03) | 32% | 1088 | Very low | Downgraded two levels due to risk of bias and one level due to imprecision ‐ the singular study contributing to this estimate at high risk of bias in blinding of outcome assessor domain; wide CIs | |
| 57 per 100 | 50 per 100 | ||||||
| High | |||||||
| 85 per 100 | 75 per 100 | ||||||
| Laquinimod | Low | RR 0.88 (0.79 to 0.99) | 31% | 1990 | Very low | Downgraded one level due to risk of bias and two levels due to inconsistency ‐ the majority of studies at high or unclear risk of bias in allocation concealment and/or blinding of outcome assessor domains; I2 = 66% (P value = 0.09), wide predictive interval and inconsistent loops of evidence | |
| 57 per 100 | 50 per 100 | ||||||
| High | |||||||
| 85 per 100 | 75 per 100 | ||||||
| Dimethyl fumarate | Low | RR 0.89 (0.81 to 0.98) | 30% | 2307 | Moderate | Downgraded one level due to inconsistency ‐ wide predictive interval | |
| 57 per 100 | 51 per 100 | ||||||
| High | |||||||
| 85 per 100 | 76 per 100 | ||||||
| Interferon beta‐1a (Avonex) | Low | RR 0.91 (0.82 to 1.02) | 22% | 1198 | Low | Downgraded one level due to risk of bias and one level due to inconsistency ‐ the majority of studies at high or unclear risk of bias in allocation concealment and/or blinding of outcome assessor domains; inconsistent loops of evidence | |
| 57 per 100 | 52 per 100 | ||||||
| High | |||||||
| 85 per 100 | 77 per 100 | ||||||
| CHANCE OF DISABILITY GETTING WORSE OVER 24 MONTHS | |||||||
| Mitoxantrone | Low | RR 0.20 (0.05 to 0.84) | 96% | 51 | Low | Downgraded one level due to indirectness and one level due to inconsistency ‐ surrogate outcome unclear; wide predictive interval | |
| 25 per 100 | 5 per 100 | ||||||
| High | |||||||
| 52 per 100 | 10 per 100 | ||||||
| Alemtuzumab | Low | RR 0.35 (0.26 to 0.48) | 94% | — | Low | Downgraded one level due to risk of bias and one level due to indirectness ‐ the majority of studies at high or unclear risk of bias in allocation concealment and/or blinding of outcome assessor domains; surrogate outcome in the majority of studies contributing to this estimate | |
| 25 per 100 | 9 per 100 | ||||||
| High | |||||||
| 52 per 100 | 18 per 100 | ||||||
| Natalizumab | Low | RR 0.64 (0.49 to 0.85) | 74% | 942 | Moderate | Downgraded one level due to indirectness ‐ surrogate outcome | |
| 25 per 100 | 16 per 100 | ||||||
| High | |||||||
| 52 per 100 | 33 per 100 | ||||||
| Azathioprine | Low | RR 0.64 (0.30 to 1.37) | 64% | 59 | Very low | Downgraded one level due to risk of bias, two levels due to indirectness, and two levels due to imprecision ‐ the singular study contributing to this estimate at unclear risk of bias in allocation concealment domain; indirectness of population (one monocentric study) and surrogate outcome unclear; wide CIs | |
| 25 per 100 | 16 per 100 | ||||||
| High | |||||||
| 52 per 100 | 33 per 100 | ||||||
| Glatiramer acetate | Low | RR 0.77 (0.64 to 0.92) | 58% | 1024 | Very low | Downgraded one level due to indirectness and two levels due to inconsistency ‐ surrogate outcome in the majority of studies contributing to this estimate; wide predictive interval and inconsistent loops of evidence | |
| 25 per 100 | 19 per 100 | ||||||
| High | |||||||
| 52 per 100 | 40 per 100 | ||||||
| Immunoglobulins | Low | RR 0.70 (0.39 to 1.27) | 56% | 190 | Very low | Downgraded one level due to indirectness, one level due to inconsistency, and two levels due to imprecision ‐ surrogate outcome in the majority of studies contributing to this estimate; wide predictive interval; wide CIs | |
| 25 per 100 | 18 per 100 | ||||||
| High | |||||||
| 52 per 100 | 36 per 100 | ||||||
| Interferon beta‐1b (Betaseron) | Low | RR 0.79 (0.65 to 0.97) | 51% | 372 | Very low | Downgraded one level due to risk of bias, one level due to indirectness, and two levels due to inconsistency ‐ the majority of studies at high or unclear risk of bias in allocation concealment and/or blinding of outcome assessor domains; surrogate outcome in the majority of studies contributing to this estimate; wide predictive interval and inconsistent loops of evidence | |
| 25 per 100 | 20 per 100 | ||||||
| High | |||||||
| 52 per 100 | 41 per 100 | ||||||
| Dimethyl fumarate | Low | RR 0.80 (0.67 to 0.94) | 50% | 2307 | Low | Downgraded one level due to indirectness and one level due to inconsistency ‐ surrogate outcome in the majority of studies contributing to this estimate; wide predictive interval | |
| 25 per 100 | 20 per 100 | ||||||
| High | |||||||
| 52 per 100 | 42 per 100 | ||||||
| Interferons beta (Avonex, Rebif or Betaseron) | Low | RR 0.83 (0.34 to 2.07) | 40% | — | Very low | Downgraded one level due to indirectness, one level due to inconsistency, and two levels due to imprecision ‐ indirectness of population and surrogate outcome unclear (one study contributing for 50% to this estimate); wide predictive interval; wide CIs | |
| 25 per 100 | 21 per 100 | ||||||
| High | |||||||
| 52 per 100 | 43 per 100 | ||||||
| Interferon beta‐1a (Rebif) | Low | RR 0.86 (0.69 to 1.06) | 36% | 560 | Very low | Downgraded one level due to risk of bias, one level due to indirectness, one level due to inconsistency, and one level due to imprecision ‐ the majority of studies at high or unclear risk of bias in allocation concealment and/or blinding of outcome assessor domains; surrogate outcome in the majority of studies contributing to this estimate; inconsistent loops of evidence; wide CIs | |
| 25 per 100 | 22 per 100 | ||||||
| High | |||||||
| 52 per 100 | 45 per 100 | ||||||
| Fingolimod | Low | RR 0.86 (0.73 to 1.03) | 34% | 2355 | Very low | Downgraded one level due to risk of bias, one level due to indirectness, and one level due to imprecision ‐ studies at unclear risk of bias in allocation concealment domain; surrogate outcome; wide CIs | |
| 25 per 100 | 22 per 100 | ||||||
| High | |||||||
| 52 per 100 | 45 per 100 | ||||||
| Laquinimod | Low | RR 0.87 (0.72 to 1.04) | 34% | 1990 | Low | Downgraded one level due to indirectness and one level due to imprecision ‐ surrogate outcome in the majority of studies contributing to this estimate; wide CIs | |
| 25 per 100 | 22 per 100 | ||||||
| High | |||||||
| 52 per 100 | 45 per 100 | ||||||
| Teriflunomide | Low | RR 0.87 (0.69 to 1.10) | 34% | 1088 | Low | Downgraded one level due to indirectness and one level due to imprecision ‐ surrogate outcome; wide CIs | |
| 25 per 100 | 22 per 100 | ||||||
| High | |||||||
| 52 per 100 | 45 per 100 | ||||||
| Interferon beta‐1a (Avonex) | Low | RR 0.93 (0.77 to 1.13) | 21% | 1198 | Very low | Downgraded one level due to risk of bias, one level due to indirectness, and two levels due to inconsistency ‐ the majority of studies at high or unclear risk of bias in allocation concealment and/or blinding of outcome assessor domains; surrogate outcome in the majority of studies contributing to this estimate; I2 = 57% (P value = 0.13), and inconsistent loops of evidence | |
| 25 per 100 | 23 per 100 | ||||||
| High | |||||||
| 52 per 100 | 48 per 100 | ||||||
| *The corresponding risk with intervention (and its 95% confidence interval) is based on the assumed risk with placebo and the relative effect of the intervention (and its 95% CI). Two values were chosen for the assumed risk with placebo, i.e. the second highest and second lowest placebo group risks in the included studies, defined as low and high assumed risk. #No of Participants (studies) is not available when the nature of the evidence is indirect. °We did not downgrade for reasons of reporting bias as insufficient studies contributed to network treatment estimates to draw meaningful conclusions. | |||||||
| GRADE Working Group grades of evidence | |||||||
Antecedentes
Descripción de la afección
La esclerosis múltiple (EM) es una enfermedad inflamatoria del cerebro y la médula espinal como resultado de la interacción entre factores ambientales no identificados y genes de susceptibilidad. En la EM ocurren varios procesos patológicos que incluyen el sistema inmunitario, mecanismos mediados por los linfocitos T y los linfocitos B, la desmielinización, la remielinización, la activación microglial y la neurodegeneración crónica (Bennett 2009; Compston 2008). La relación secuencial de estos procesos influye en el curso clínico, que se caracteriza por ataques de disfunción neurológica con recuperación, ataques que dejan déficits persistentes y progresión que causa discapacidad física y cognitiva permanentes. La EM se encuentra entre las causas más frecuentes de discapacidad neurológica en los jóvenes, con una incidencia anual que varía de dos a diez casos por 100 000 personas por año y un gradiente norte‐sur, con una menor incidencia más cercana a la línea ecuatorial. Sus manifestaciones clínicas ocurren habitualmente entre los 20 y los 40 años de edad, con síntomas y signos que incluyen diferentes regiones del sistema nervioso central: el nervio óptico, el tallo cerebral, el cerebelo, los hemisferios cerebrales y la médula espinal.
La EM tiene un curso crónico que evoluciona durante 30 a 40 años. Los fenotipos clínicos incluyen EM recurrente remitente (EMRR), EM secundaria progresiva (EMSP), EM primaria progresiva (EMPP) y EM progresiva recurrente (EMPR) (Lublin 1996). El desarrollo de progresión después de un curso recurrente remitente causa discapacidad permanente a largo plazo; sobreviene en cerca del 80% de los pacientes con EMRR con 20 a 25 años desde la aparición de la enfermedad (Kremenchutzky 2006). Los períodos hasta necesitar ayuda para caminar, estar limitado a la cama o morir tuvieron una mediana de 14, 24 y 45 años desde la aparición de la enfermedad y una mediana de tres, 12 y 30 años desde la aparición de la progresión secundaria, respectivamente (Scalfari 2014).
El sexo masculino, la mayor edad a la aparición y la alta frecuencia de recurrencia temprana (más de tres ataques durante los tres primeros años) predicen un riesgo mayor de empeoramiento continuado de la discapacidad (Scalfari 2014). En los pacientes con EMRR, el inicio de la progresión secundaria es el determinante del pronóstico a largo plazo, y su prevención es el objetivo terapéutico clave.
Según los antiguos criterios de Poser (Poser 1983), la EM se puede diagnosticar clínicamente al demostrar dos ataques clínicos separados (diseminación en tiempo) que incluyen al menos dos áreas diferentes del sistema nervioso central (diseminación en espacio). Los criterios de McDonald de 2001 y sus revisiones de 2005 y 2010 incorporan criterios por imaginología de resonancia magnética (IRM) para la diseminación en espacio y tiempo, lo que permite un diagnóstico de EM en el momento de los primeros síntomas (McDonald 2001; Polman 2005; Polman 2011). La diseminación en espacio se demuestra por una lesión por IRM mayor o igual en al menos dos regiones del sistema nervioso central (periventricular, yuxtacortical, infratentorial, médula espinal) características de EM. La diseminación en tiempo se demuestra por: (i) lesiones simultáneas asintomáticas por IRM resaltadas y no resaltadas por contraste en cualquier momento; o (ii) una lesión nueva o lesiones resaltadas por contraste en la IRM de seguimiento, independientemente del momento. Los criterios de diagnóstico incluyen la exclusión de otros posibles diagnósticos.
Se ha observado una tendencia decreciente en la tasa de recurrencia durante el estudio (uno de los resultados primarios habitualmente más utilizados en los ensayos de EM) en los participantes de los grupos placebo en los ensayos (Inusah 2010; Nicholas 2012; Steinvorth 2013; Stellmann 2012). Se considera que esta disminución se debe a la reducción en las tasas de recurrencia previas al ensayo y a un período de tiempo más corto a partir del cual se calcularon las tasas de recurrencia previas al ensayo en los ensayos recientes (Steinvorth 2013; Stellmann 2012). Se encontró que la tasa de recurrencia previa al estudio fue la mejor variable predictiva para la tasa de recurrencia durante el estudio. Otras características de los participantes han cambiado en los ensayos más recientes. Los participantes tenían más edad y tenían una duración más prolongada de la enfermedad, mientras que sus puntuaciones iniciales en la Expanded Disability Status Scale (EDSS) fueron similares a las informadas en los ensayos más antiguos. En los ensayos más recientes la introducción de los nuevos criterios de diagnóstico de McDonald dieron lugar a la inclusión de participantes que habían tenido un diagnóstico anterior y estaban en un estadio más tardío del curso de la enfermedad, que fue menos grave en comparación con los pacientes de los estudios más antiguos (Steinvorth 2013). Estos cambios pueden explicar la disminución en la tasa de recurrencia previa al ensayo y la disminución asociada en la tasa de recurrencia durante el ensayo. Las consecuencias no convenientes de la esperada disminución en la tasa de recurrencia fueron que se ha exagerado el tamaño de la muestra de los ensayos más recientes y se acortaron los períodos de seguimiento.
Otra diferencia entre los estudios más antiguos y más recientes es que los últimos pueden haber incluido participantes que habían utilizado previamente inmunomoduladores o inmunosupresores.
Descripción de la intervención
Para los pacientes con EMRR están disponibles varios tratamientos. En esta revisión se consideraron todos los inmunomoduladores e inmunosupresores que, desde 1966 hasta septiembre de 2014, se han estudiado en los pacientes con EMRR en ensayos clínicos aleatorios (ECA) con un seguimiento de más de seis meses.
Interferón beta‐1b(EMEA 2002; FDA 1993), interferón beta‐1a (Rebif) (EMEA 1998; FDA 2002), interferón beta‐1a (Avonex) (EMEA 1997; FDA 2003), y acetato de glatiramero (FDA 1996) fueron los primeros agentes aprobados por los organismos reguladores nacionales. El interferón beta‐1b, el interferón beta‐1a (Rebif) y el acetato de glatiramero se administran por inyección subcutánea, y el interferón beta‐1a (Avonex) por inyección intramuscular. Los principales efectos adversos de los interferones beta son las reacciones locales en los sitios de inyección y los síntomas similares a los de la influenza con hipertermia.
El natalizumab fue aprobado inicialmente por la Food and Drug Administration (FDA) de los EE.UU. en noviembre de 2004 (FDA 2004), pero fue retirado por el fabricante en febrero de 2005, después que tres participantes desarrollaron leucoencefalopatía multifocal progresiva (LMP) en ensayos clínicos del fármaco, una infección viral poco frecuente y grave del cerebro. Dos de los participantes fallecieron. Después de una reevaluación de los participantes de los ensayos clínicos anteriores, la FDA permitió realizar un ensayo clínico de natalizumab en febrero de 2006. No se informaron casos adicionales de LMP y continuó la comercialización del fármaco para la EMRR grave (EMA 2006; FDA 2006; Yousry 2006). El natalizumab se administra por infusión intravenosa, a una dosis de 300 mg cada cuatro semanas.
La mitoxantrona se aprobó en 2000 bajo la indicación "para la reducción de la discapacidad neurológica o la frecuencia de las recurrencias clínicas en los pacientes con empeoramiento de la EMRR, EMSP o EMPR"(FDA 2000). Los aspectos de seguridad de interés para los pacientes tratados con mitoxantrona son la cardiotoxicidad y la leucemia aguda.
El fingolimod fue el primer tratamiento oral aprobado para los pacientes con EMRR para reducir la frecuencia de las recurrencias y retrasar la acumulación de la discapacidad física(EMA 2011; FDA 2010). Incluso a la dosis baja recomendada de 0,5 mg una vez al día, la FDA y el European Medicines Agency (EMA) advirtieron acerca de la disminución en la frecuencia cardíaca posterior al inicio del tratamiento con fingolimod, y recomiendan que a todos los pacientes se les monitoricen por al menos seis horas los signos y síntomas de bradicardia, al considerar que en algunos pacientes el nadir de la frecuencia cardíaca se puede observar hasta 24 horas después de la primera dosis.
La teriflunomida fue el segundo agente oral aprobado para los pacientes con EMRR (EMA 2013a; FDA 2012). Se administra por vía oral como comprimidos de 7 mg o 14 mg una vez al día. Las advertencias proporcionadas con este fármaco fueron la hepatotoxicidad y el riesgo de teratogenicidad.
El dimetilfumarato se ha aprobado como el tratamiento oral de primera línea para los pacientes con EMRR(EMA 2014a; FDA 2013). La dosis recomendada es de 240 mg dos veces al día. Los eventos adversos informados con más frecuencia que provocan la interrupción en los ensayos clínicos fueron el rubor y los eventos gastrointestinales.
Alemtuzumab se ha aprobado para el tratamiento de los pacientes con EMRR que han tenido una respuesta inadecuada a dos o más fármacos indicados para el tratamiento de la EM(EMA 2013b; FDA 2014a). El fármaco se administra por infusión intravenosa, a una dosis de 12 mg/día durante cinco días consecutivos (dosis total de 60 mg), seguida de 12 mg/día durante tres días consecutivos (dosis total de 36 mg) administrados 12 meses después del ciclo de tratamiento inicial. Para el tratamiento con alemtuzumab deben tenerse en cuenta advertencias y precauciones particulares, ya que se observaron afecciones autoinmunitarias graves y a veces mortales, reacciones a la infusión potencialmente mortales y un aumento en el riesgo de neoplasias malignas en los pacientes tratados con alemtuzumab.
El interferón pegilado beta‐1a, diseñado para mantener los efectos del interferón beta en el cuerpo durante un período más prolongado, fue aprobado por la FDA y el EMA para los pacientes con EMRR (EMA 2014b; FDA 2014b). Se administra por inyección subcutánea a una dosis de 125 µg cada 14 días. Las reacciones adversas más frecuentes son el eritema del sitio de inyección, la enfermedad similar a la influenza, la pirexia, la cefalea, la mialgia, los escalofríos, el dolor en el sitio de inyección, la astenia, el prurito en el sitio de inyección y la artralgia.
El daclizumab actualmente se investiga en ensayos clínicos de EMRR, pero todavía no se ha aprobado para la EM por los organismos reguladores. Se administra por inyecciones subcutáneas o intravenosas. El daclizumab aumenta los riesgos de infecciones graves y enfermedades autoinmunitarias.
Ocrelizumab está en desarrollo para el tratamiento de la EMRR, con dos ensayos clínicos de fase activa en curso. Se administra por inyecciones intravenosas.
Laquinimod es un inmunomodulador que actualmente está en evaluación para el tratamiento de la EMRR. Se administra vía oral como un comprimido de 0,6 mg una vez al día. El EMA recomendó negar la autorización de comercialización para laquinimod como tratamiento para la EMRR debido a inquietudes por el posible aumento de los riesgos de cáncer y teratogenicidad en los seres humanos, especialmente debido a que el mecanismo de acción del fármaco no está claro (EMA 2014c). Están en curso estudios adicionales de laquinimod como monoterapia y tratamiento complementario en pacientes con EMRR.
La azatioprina se ha administrado para el tratamiento de la EM en muchos países sobre la base de ECA controlados con placebo publicados hace más de dos décadas. Sin embargo, desde la aprobación de los interferones beta, la azatioprina ya no se recomienda como tratamiento de primera línea (Goodin 2002). Se administra por vía oral como comprimidos de 2 mg/kg o 3 mg/kg diariamente. Se informó que la inmunosupresión crónica con azatioprina aumenta el riesgo de neoplasia maligna en los seres humanos (FDA 2014c).
Las inmunoglobulinas intravenosas pueden tener una función en los pacientes con recurrencias graves y frecuentes en los que están contraindicados otros tratamientos (Association of British Neurologists 2005). Se observaron eventos adversos graves, que incluyen trombosis de la vena yugular y reacción alérgica que provocó la interrupción del tratamiento, en el 4% de los 84 ciclos de tratamiento con un total de 341 infusiones en condiciones clínicas habituales (Elovaara 2008).
De qué manera podría funcionar la intervención
Los efectos inmunosupresores o inmunomoduladores son frecuentes en todos los tratamientos incluidos en la revisión.
El mecanismo de acción de los interferones beta en la EM no se comprende completamente. Los interferones beta son citoquinas que aparecen naturalmente y que poseen actividad antiviral y una variedad amplia de propiedades antiinflamatorias. Se cree que las formas recombinantes de los interferones beta aumentan directamente la expresión y concentración de los agentes antiinflamatorios, a la vez que disminuyen los receptores para la expresión de las citoquinas proinflamatorias(Kieseier 2011).
El acetato de glatiramero tiene una acción inmunomoduladora por la inducción de tolerancia o anergia de los linfocitos reactivos a la mielina (Schmied 2003). Además se cree que promueve los procesos de reparación neuroprotectora (Aharoni 2014).
El natalizumab es un anticuerpo monoclonal contra la integrina alfa4 en la superficie de los linfocitos. Esta integrina es fundamental en el proceso mediante el cual los linfocitos logran el acceso al cerebro al permitir a las células penetrar la barrera hematoencefálica. El natalizumab bloquea la acción de la integrina alfa4 para que los linfocitos no se puedan introducir en el cerebro y atacar la proteína de mielina (Yednock 1992).
La mitoxantrona es un fármaco citotóxico que se intercala con el ADN e inhibe la síntesis de ADN y ARN, por lo que reduce el número de linfocitos (Fox 2004).
El fingolimod actúa como un antagonista funcional del receptor de esfingosina‐1‐fosfato (E1F) en los linfocitos, debido a una reducción en la salida de los linfocitos de los ganglios linfáticos. En particular, impide que los linfocitos T autoagresivos recirculen hacia el sistema nervioso central (Mandala 2002).
La teriflunomida es un inhibidor de la dihidroorotato deshidrogenasa (DHODH), una enzima mitocondrial involucrada en la síntesis de nueva pirimidina para la replicación del ADN. Por lo tanto, el fármaco reduce la activación, la proliferación y la función de los linfocitos T y B en respuesta a los autoantígenos. El mecanismo de acción exacto en la EM no se comprende completamente. Se considera que el fármaco reduce el número de linfocitos activados, que causarían inflamación y daño de la mielina en el sistema nervioso central(Claussen 2012).
El dimetilfumarato es un derivado del ácido fumárico. Actúa principalmente al desencadenar la activación de una vía transcripcional de un factor nuclear (Nrf2), la defensa celular primaria contra los efectos citotóxicos del estrés oxidativo. Estimula la actividad antiinflamatoria y puede inhibir la expresión de las citoquinas proinflamatorias y las moléculas de adhesión (Wilms 2010).
El alemtuzumab es un anticuerpo monoclonal contra el antígeno CD52 expresado en los linfocitos y los monocitos. Se considera que sus efectos en la EM están mediados por una depleción prolongada de los linfocitos y un cambio en la composición de los linfocitos que acompaña la reconstitución de los linfocitos (Hill‐Cawthorne 2012).
El interferón pegilado beta‐1a tiene un grupo polietilenglicol unido al grupo α‐amino del terminal N del interferón beta‐1a (Avonex). La pegilación del interferón beta‐1a puede mejorar sus propiedades farmacocinéticas y farmacodinámicas, lo que permite reducir la frecuencia de la dosis mientras se mantiene la efectividad clínica y la seguridad del interferón beta‐1a intramuscular (Hu 2012).
El daclizumab es un anticuerpo monoclonal contra el antígeno CD25 (receptor de interleucina 2) expresado en las células inmunitarias. Los mecanismos por los cuales el fármaco ejerce los efectos en la EM no están claros. Daclizumab provoca la expansión de las células asesinas linfocitos T reguladores de CD56, que puede ser un mecanismo de acción importante en la EM. Además, daclizumab modula la función de las células dendríticas, lo que reduce la activación de los linfocitos T (Wuest 2011).
El ocrelizumab es un anticuerpo monoclonal contra el antígeno CD20 expresado en los linfocitos B. El anticuerpo reduce los linfocitos B circulantes principalmente a través de la citotoxicidad mediada por anticuerpo (Oh 2013).
Se desconoce cómo funciona exactamente el laquinimod, pero se cree que posee un efecto inmunomodulador sobre los sistemas nerviosos centrales y periféricos. Datos de estudios en animales indican que el laquinimod tiene un efecto primario sobre la inmunidad innata. El fármaco modula la función de diversas poblaciones de células mieloides que presentan antígeno, que luego disminuye los receptores a las respuestas proinflamatorias de los linfocitos T. Además, los datos indican que el laquinimod actúa directamente en las células residentes dentro del sistema nervioso central para reducir la desmielinización y el daño axonal (Varrin‐Doyer 2014).
La azatioprina es un fármaco inmunosupresor citotóxico clásico que actúa como un profármaco para la mercaptopurina e inhibe una enzima que se requiere para la síntesis de ADN. Por lo tanto, afecta con más fuerza las células en proliferación como los linfocitos T y los linfocitos B del sistema inmunológico (Tiede 2003).
El mecanismo de acción de las inmunoglobulinas intravenosas en la EM todavía no está claro, aunque la remielinización de los axones desmielinizados puede ocurrir a través de la mediación de los efectos de las citoquinas (Stangel 1999).
Por qué es importante realizar esta revisión
Aunque hay consenso en que las inmunoterapias reducen la frecuencia de las recurrencias en la EM, su efecto beneficioso relativo al retardar las nuevas recurrencias o el empeoramiento de la discapacidad todavía no está claro. Esta incertidumbre se debe al número limitado de ensayos de comparación directa que aportan las pruebas de investigación más rigurosas y válidas sobre el efecto beneficioso relativo y la seguridad de diferentes tratamientos en competencia. Un resumen de los resultados, que incluya comparaciones directas e indirectas, puede ayudar a aclarar las dudas mencionadas anteriormente (Caldwell 2005; Glenny 2005).
Objetivos
Comparar el efecto beneficioso y la aceptabilidad del interferón beta‐1b, el interferón beta‐1a (Avonex, Rebif), el acetato de glatiramero, el natalizumab, la mitoxantrona, el fingolimod, la teriflunomida, el dimetilfumarato, el alemtuzumab, el interferón pegilado beta‐1a, el daclizumab, el laquinimod, la azatioprina y las inmunoglobulinas para el tratamiento de los pacientes con EMRR y proporcionar una clasificación de estos tratamientos según su efecto beneficioso y aceptabilidad, definida como la proporción de participantes que se retiraron debido a cualquier evento adverso.
Métodos
Criterios de inclusión de estudios para esta revisión
Tipos de estudios
Se incluyeron todos los ECA que estudiaron uno o más de los agentes utilizados en la EMRR y los compararon con placebo u otro agente activo. También se incluyeron los ensayos en los cuales no estaba claro si el método de ocultación de la asignación proporcionó una asignación al azar adecuada o los estudios abiertos, pero se tuvo en cuenta la calidad de estos estudios. Se excluyeron los ECA con un seguimiento menor o igual a seis meses porque estos ensayos midieron los resultados en un plazo demasiado corto que no es clínicamente relevante para los pacientes con EM. Se excluyeron los estudios no aleatorios.
Tipos de participantes
Se incluyeron participantes con 18 años de edad o más con un diagnóstico de EMRR según los criterios de diagnóstico de Poser(Poser 1983) o McDonald (McDonald 2001; Polman 2005; Polman 2011). Se incluyeron todos los participantes independientemente del sexo, el grado de discapacidad y la duración de la enfermedad.
Tipos de intervenciones
Se incluyeron todos los inmunomoduladores o inmunosupresores (aunque no estuvieran autorizados en algún país). Se excluyeron: (i) los tratamientos combinados; (ii) los ensayos en los que un régimen farmacológico se comparó con un régimen diferente del mismo fármaco sin otro agente activo o placebo como un brazo control; (iii) todos los tratamientos no farmacológicos; y (iv) las intervenciones con fármacos sin prescripción.
Se incluyeron los ECA que evaluaron una o más de las siguiente intervenciones farmacológicas como monoterapia, en comparación con placebo u otro agente activo:
-
interferón beta‐1b
-
interferón beta‐1a (Avonex, Rebif)
-
acetato de glatiramero
-
natalizumab
-
mitoxantrona
-
fingolimod
-
teriflunomida
-
dimetilfumarato
-
alemtuzumab
-
interferón pegilado beta‐1a
-
daclizumab
-
ocrelizumab
-
laquinimod
-
azatioprina
-
inmunoglobulinas
Se incluyeron los regímenes como se definieron en los estudios primarios, independientemente de la dosis.
Se supuso que cualquier paciente que cumpliera con los criterios de inclusión tenía, en principio, iguales probabilidades de ser asignado de forma aleatoria a cualquiera de las intervenciones elegibles.
Tipos de medida de resultado
Resultados primarios
Se calcularon los efectos relativos de las intervenciones en competencia según los siguientes resultados primarios:
Efectos beneficiosos
-
Recurrencias: proporción de participantes que presentaron nuevas recurrencias después de 12, 24 ó 36 meses después de la asignación al azar o al final del estudio. Una recurrencia se define como síntomas recién desarrollados o que empeoraron recientemente de disfunción neurológica que duraron al menos 24 horas, y que ocurrieron sin fiebre u otras enfermedades agudas y separados de cualquier episodio anterior por un período de más de 30 días (McDonald 2001; Polman 2005). En algunos ECA se ha utilizado un criterio más estricto de 48 horas. Una recurrencia que se soluciona parcial o completamente.
-
Empeoramiento de la discapacidad: proporción de participantes que presentaron empeoramiento de la discapacidad después de 24 ó 36 meses posterior a la asignación al azar o al final del estudio. El empeoramiento se define como al menos un aumento de 1 punto en la Expanded Disability Status Scale (EDSS) o un aumento de 0,5 punto si la puntuación inicial en la EDSS fue mayor o igual a 5,5; confirmado durante dos exámenes neurológicos posteriores separados por al menos un intervalo de seis meses sin ataques (Kurtzke 1983). El empeoramiento de la discapacidad confirmado solamente después de tres meses de seguimiento se considera un marcador alternativo para la discapacidad continuada. La EDSS es una medida habitual de discapacidad de la EM (donde 0 es normal, 3 discapacidad leve, 6 necesidad de atención, 7 uso de silla de ruedas y 10 es muerte por EM) y se utiliza para medir el empeoramiento de la discapacidad en los ensayos clínicos de EM.
Aceptabilidad
Se utilizó la interrupción del tratamiento debido a eventos adversos para evaluar la aceptabilidad y se midió por el número de participantes que se retiraron debido a cualquier evento adverso después de 12, 24, o 36 meses luego de la asignación al azar o al final del estudio, del número total de participantes asignado al azar a cada brazo de tratamiento.
Resultados secundarios
El número total de eventos adversos graves (EAG). Si no hubo suficientes estudios que informaran el número total de EAG y pacientes‐años, se planificó utilizar el número de participantes con al menos un EAG como se definió en el estudio.
Results
Description of studies
Results of the search
Figure 1 shows the results of the electronic search. We identified 415 articles through the search strategy (CENTRAL 10, MEDLINE 131, EMBASE 254, CINAHL 2, clinical trials registries 18). We excluded 356 articles on the basis of abstracts that we considered not pertinent.

Study flow diagram.
We provisionally selected a total of 56 articles and three ongoing trials as potentially fulfilling the inclusion criteria. After full‐text review, we included 39 studies and three ongoing trials, and excluded 17 studies.
Included studies
We included 39 studies involving 25,113 participants and published between 1987 and 2014 in this review (Achiron 1998; ADVANCE 2014; AFFIRM 2006; ALLEGRO 2012; BECOME 2009; BEYOND 2009; Bornstein 1987; BRAVO 2014; CAMMS223 2008; CARE‐MS I 2012; CARE‐MS II 2012; CombiRx 2013; Comi 2001; CONFIRM 2012; DEFINE 2012; Etemadifar 2007; EVIDENCE 2007; Fazekas 1997; Fazekas 2008; FREEDOMS 2010; FREEDOMS II 2014; GALA 2013; Goodkin 1991; IFNB MS Group 1993; INCOMIN 2002; Johnson 1995; Koch‐Henriksen 2006; Lewanska 2002; MAIN TRIAL; Millefiorini 1997; MSCRG 1996; OWIMS 1999; PRISMS 1998; REGARD 2008; SELECT 2013; TEMSO 2011; TENERE 2014; TOWER 2014; TRASFORMS 2010). The table 'Characteristics of included studies' provides details of included studies. Median follow‐up was 24 months (12‐month follow‐up from 12 studies, 24‐month follow‐up from 25 studies, and 36‐month follow‐up from two studies). Twenty‐four (60%) were placebo‐controlled and 15 (40%) were head‐to‐head studies.
We identified three ongoing trials (DECIDE; NCT01247324; NCT01412333). We will include these studies in a future update of this review. 'Characteristics of ongoing studies' provides details on the characteristics of these studies.
Excluded studies
After full‐text review we excluded 17 studies (see 'Characteristics of excluded studies'): seven studies for insufficient duration (CHOICE 2010; Kappos 2006; Kappos 2008; Kappos 2011; Knobler 1993; Saida 2012; Sorensen 2014), five studies evaluating combination therapies (ACT 2009; Freedman 2012; Havrdova 2009; Khoury 2010; SENTINEL 2006), two studies evaluating treatments that are not included in this review (Ashtari 2011; ATAMS 2014), two studies that were non‐randomised (Calabrese 2012; Etemadifar 2006), and one dose‐finding study without a control group (FORTE 2011).
Risk of bias in included studies
The risks of bias of the included studies are summarised in Figure 2 and Figure 3. Considering our predefined criteria (allocation concealment, blinding of outcome assessor, and incomplete outcome data) to assess the overall risk of bias of a study, we judged three out of 39 (8%) trials at low risk of bias (AFFIRM 2006; Fazekas 1997; PRISMS 1998), we judged 16 (41%) at moderate risk of bias (Achiron 1998; BECOME 2009; BEYOND 2009; BRAVO 2014; Comi 2001; Etemadifar 2007; EVIDENCE 2007; Fazekas 2008; GALA 2013; Goodkin 1991; IFNB MS Group 1993; Johnson 1995; Lewanska 2002; MSCRG 1996; REGARD 2008; SELECT 2013), and we judged 20 (51%) at high risk of bias (ADVANCE 2014; ALLEGRO 2012; Bornstein 1987; CAMMS223 2008; CARE‐MS I 2012; CARE‐MS II 2012; CombiRx 2013; CONFIRM 2012; DEFINE 2012; FREEDOMS 2010; FREEDOMS II 2014; INCOMIN 2002; Koch‐Henriksen 2006; MAIN TRIAL; Millefiorini 1997; OWIMS 1999; TEMSO 2011; TENERE 2014; TOWER 2014; TRASFORMS 2010).
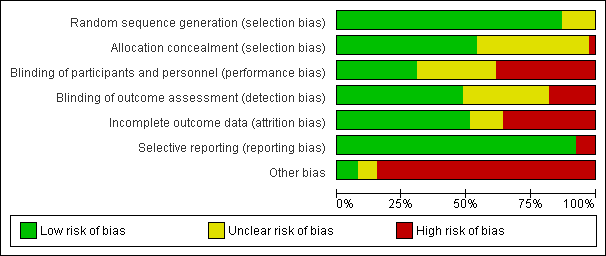
'Risk of bias' graph: review authors' judgements about each risk of bias item presented as percentages across all included studies.

'Risk of bias' summary: review authors' judgements about each risk of bias item for each included study.
Allocation
Five trials (13%) did not provide enough information to assess sequence generation (unclear risk), and 34 (87%) reported adequate methods (low risk).
Of 39 included studies, 21 (54%) reported adequate methods of allocation concealment (low risk), 17 (44%) did not provide sufficient information to enable a risk of bias judgment (unclear risk), and one trial used an unconcealed procedure (high risk) (Bornstein 1987).
Blinding
Twelve studies (31%) reported that participants and investigators were blinded (low risk), 15 studies (38%) reported that they were not blinded (high risk), and the remaining 12 studies (31%) did not provide sufficient information to enable assessment (unclear risk). We suspected that most participants and treating physicians had become aware of the treatment they were receiving during the course of the trial because most of the agents included in this review have well‐documented side effects, for example injection site reactions and influenza‐like symptoms after interferon beta injection.
Nineteen studies (49%) were at low risk of detection bias (i.e. they reported that outcome assessors were blinded), seven studies (18%) were at high risk, and the remaining 13 studies (33%) did not provide sufficient information to enable assessment (unclear risk).
Incomplete outcome data
We judged 20 of 39 (51%) included studies to meet the criteria for low risk of incomplete outcome data (balanced numbers across intervention groups with similar reasons for loss to follow‐up), 14 studies (36%) were at high risk, and the remaining five studies (13%) did not provide sufficient information to assess risk of incomplete outcome data (unclear risk). The percentage of people who were lost‐to follow‐up among the 39 studies varied from 0% to 43%, with an average of 13.5% (standard deviation 9.1%), and a median of 11.9%.
Selective reporting
All the studies reported all pre‐specified primary benefit outcomes, with the exception of three trials (CONFIRM 2012; DEFINE 2012; TEMSO 2011), in which disability worsening confirmed at six months was not reported in the published report, but was reported in the FDA reports, and thus we considered them at high risk of reporting bias.
Other potential sources of bias
Other bias
We judged 33 studies (85%) at high risk of other bias; this includes the role of the sponsor in authorship of the study report or in data management or analysis (27/39), and incomplete or unclear reporting of data on outcomes and/or study discontinuation (27/39), which make it impossible to understand how the corresponding analyses were performed (e.g. annualised relapse rate estimation).
Method of adverse event monitoring
(See Table 1). In 28 trials (72%), adverse events were actively monitored and we judged the risk of bias to be low. Eight trials (21%) reported insufficient information about the method of adverse event monitoring so that it was uncertain whether or not adverse events were monitored appropriately. We judged the risk of bias to be unclear in these studies. Spontaneous reporting of adverse events as they occurred was reported in three studies and thus we judged them at high risk of bias (Bornstein 1987; EVIDENCE 2007; Goodkin 1991).
| Study | Risk of bias | Did the researchers actively monitor for adverse events (AEs) or did they simply provide spontaneous reporting of AEs that arose? | Risk of bias | Did the authors define serious AEs (SAEs) according to an accepted international classification and report the number of SAEs? |
| Unclear | Not reported | High | SAEs not reported | |
| Unclear | Not reported | Low | Categorisation of SAEs conformed to ICH guidelines (International Conference on Harmonisation of Technical Requirements for Registration of Pharmaceuticals for Human Use) | |
| Low | "Treating neurologists were responsible for all aspects of patient care, including the management of adverse events". Participants"visited the clinic every 12 weeks for ... blood chemical and hematologic analyses, evaluation of adverse events..." (Page 901) | Unclear | Insufficient information on SAEs definition | |
| Low | "Safety assessments were performed at screening, at baseline, and every 3 months until month 24" (Page 1002) | Low | Categorisation of SAEs conformed to ICH guidelines (International Conference on Harmonisation of Technical Requirements for Registration of Pharmaceuticals for Human Use) | |
| Low | "After the initial interim analysis failed to raise any safety concerns with the use of monthly triple dose gadolinium, all patients still in the study were offered the option of obtaining additional monthly MRI scans for a second year of treatment" (Page 1977) | High | SAEs not reported | |
| Low | "Clinic visits were scheduled every 3 months to assess ... safety, and tolerability. The occurrence of new neurological symptoms and adverse events was assessed by telephone, 6 weeks after each visit" (Page 891) | Low | Categorisation of SAEs conformed to ICH guidelines (International Conference on Harmonisation of Technical Requirements for Registration of Pharmaceuticals for Human Use) | |
| High | "Self‐evaluation reported to a clinical assistant" (Page 409) | High | SAEs not reported | |
| Low | "Patients were evaluated at 12 scheduled visits: months ‐1 (screening), 0 (baseline), 1, 2, 3, 6, 9, 12, 15, 18, 21, and 24. Safety assessments (laboratory measures, vital signs) were performed at all visits, and electrocardiograms (ECGs) were performed at months ‐1, 0, 1, 2, 3, 6, 12, 18, and 24/early termination" (Page 775) | Unclear | Insufficient information on SAEs definition | |
| Low | "Safety was assessed quarterly by the treating neurologist, who was aware of study‐group assignment" (Page 1787), "Thyroid function and levels of antithyrotropinreceptor antibodies and lymphocyte subpopulations were measured quarterly at a central laboratory", and "All adverse events with an onset up to 36 months are reported. In addition, all serious adverse events and autoimmune‐associated disorders occurring before March 1, 2008, are listed" (Page 1788) | Low | Categorisation of SAEs conformed to ICH guidelines (International Conference on Harmonisation of Technical Requirements for Registration of Pharmaceuticals for Human Use) | |
| Low | "To assess safety, we undertook monthly questionnaire follow‐up of patients, and did complete blood counts, serum creatinine, urinalysis, and microscopy monthly (every three months in patients in the interferon beta 1a group), and thyroid function tests every 3 months", "Circulating lymphocyte subsets were assessed every 3 months in all patients and 1 month after alemtuzumab administration. We screened for antialemtuzumab antibodies with a bridging ELISA before and at 1 month, 3 months, and 12 months after each dosing", and "We measured interferon beta 1a‐neutralising antibodies at baseline and at 24 months with a cytopathic effect inhibition assay" (Page 1821) | Low | Categorisation of SAEs conformed to ICH guidelines (International Conference on Harmonisation of Technical Requirements for Registration of Pharmaceuticals for Human Use). | |
| Low | "To assess safety, we undertook monthly questionnaire follow‐up of patients, and did complete blood counts, serum creatinine, and urinalysis with microscopy monthly (every 3 months in patients in the interferon beta 1a group), and thyroid function tests every 3 months", "We assessed circulating lymphocyte subsets every 3 months in all patients and 1 month after every course of alemtuzumab. We screened for anti‐alemtuzumab antibodies with ELISA before and at 1 month, 3 months and 12 months after each dosing", and "We measured interferon beta 1a‐neutralising antibodies at baseline and at 24 months with a cytopathic effect inhibition assay" (Page 1832) | Low | Categorisation of SAEs conformed to ICH guidelines (International Conference on Harmonisation of Technical Requirements for Registration of Pharmaceuticals for Human Use) | |
| Low | "Safety was assessed by recording all adverse events, serious and nonserious" (Page 329) | Unclear | No information on SAE definition | |
| Unclear | "The treating physician monitored safety..." (Page 291) | Unclear | Insufficient information on SAEs definition | |
| Low | "Throughout the course of the study, every effort was made to remain alert to possible adverse events (AEs)" and "Any AE or SAE experienced by the subject was recorded on the CRF, regardless of the severity of the event or its relationship to study treatment" (Pages 66‐7 of Protocol) | Low | Categorisation of SAEs conformed to ICH guidelines (International Conference on Harmonisation of Technical Requirements for Registration of Pharmaceuticals for Human Use) | |
| Low | "Study visits were scheduled every 4 weeks for safety assessments, including the monitoring of laboratory values" (Page 1100) | Low | Categorisation of SAEs conformed to ICH guidelines (International Conference on Harmonisation of Technical Requirements for Registration of Pharmaceuticals for Human Use) | |
| Low | "Adverse events, vital signs and blood tests were monitored monthly" (Page 1724) | High | SAEs not reported | |
| High | "Adverse events were determined by spontaneous reporting and monthly laboratory testing during the comparative phase" (Page 2031) | Unclear | Insufficient information on SAEs definition | |
| Low | Participants "asked about safety monthly..." (Page 590) | High | SAEs not reported | |
| Unclear | Not reported | Unclear | Insufficient information on SAEs definition | |
| Low | "An independent data and safety monitoring board evaluated the safety" and "Study visits, including safety assessments, were scheduled at 2 weeks and 1, 2, 3, 6, 9, 12, 15, 18, 21, and 24 months after randomization" (Page 389) | Low | Categorisation of SAEs conformed to ICH guidelines (International Conference on Harmonisation of Technical Requirements for Registration of Pharmaceuticals for Human Use) | |
| Low | "...safety assessments, were scheduled at 2 weeks and 1, 2, 3, 6, 9, 12, 15, 18, 21, and 24 months after randomization" (Appendix, Page 2) | Low | Categorisation of SAEs conformed to ICH guidelines (International Conference on Harmonisation of Technical Requirements for Registration of Pharmaceuticals for Human Use) | |
| Low | "Safety assessments included adverse events (AEs), standard clinical laboratory tests, vital signs, and electrocardiographic (ECG) measurements" (Page 707) | Unclear | No information on SAE definition | |
| High | "Side effect were reported to the treating neurologist every 6 months" (Page 21) | High | SAEs not reported | |
| Low | "Treating neurologist reviewed side effects, laboratory findings for toxicity ..." (Page 656) | High | SAEs not reported | |
| Low | "Safety assessments included adverse events, vital signs, physical examination, and concomitant medications. Patients underwent haematology and biochemical tests, including liver‐function tests, every 2 weeks for the first 8 weeks, and then every 3 months" (Page 1455) | High | SAEs not reported | |
| Low | "The evaluating physician monitored safety every 3 month..." (Page 1270) | Unclear | Insufficient information on SAEs definition | |
| Low | "Patients were interviewed about side effects and had routine blood tests including hematology and liver function tests every 3 months and thyroid tests and neutralizing antibodies every 6 months" (Page 1057) | High | SAEs not reported | |
| Unclear | "Laboratory safety examinations were made at the beginning and at the end of the study period" (Page 566) | Unclear | Insufficient information on SAEs definition | |
| Low | "At scheduled (quarterly) and unscheduled (i.e., at the onset of new symptoms or complications) follow‐up visits the treating neurologist recorded symptoms, blood test results, clinical AEs and their management" | Low | Categorisation of SAEs conformed to ICH guidelines (International Conference on Harmonisation of Technical Requirements for Registration of Pharmaceuticals for Human Use) | |
| Low | "The safety of the treatment was assessed on the basis of adverse events volunteered by the patient either spontaneously or on questioning and monitoring of the main laboratory parameters" (Page 155) | Unclear | Insufficient information on SAEs definition | |
| Low | "Study visits were scheduled at baseline and every 6 months. Treating physicians reviewed toxicity test results, examined patients, and made all medical decision" (Page 286) | Unclear | Insufficient information on SAEs definition | |
| Unclear | "The treating physician recorded and treated AEs..." (Page 680) | Unclear | Insufficient information on SAEs definition | |
| Unclear | "A “treating” neurologist was responsible for overall medical management of the patient, including treatment of any side‐effects" (Page 1499) | Unclear | Insufficient information on SAEs definition | |
| Unclear | "Adverse events (including pregnancy), withdrawals owing to adverse events, serious adverse events, and laboratory results were obtained for safety comparisons" (Page 905) | Unclear | Insufficient information on SAEs definition | |
| Low | "Safety parameters were assessed at all visits" (Page 2168) | Unclear | No information on SAE definition | |
| Low | "A treating neurologist at each site was responsible for recording and managing adverse events and monitoring safety assessments" and "Safety was evaluated on the basis of adverse events reported by study participants or investigators. Laboratory tests were performed at the time of screening, at baseline, every 2 weeks for the first 24 weeks, and then every 6 weeks until study completion. Physical and neurologic examinations were performed at week 12 and then every 24 weeks. An abdominal ultrasonographic examination to asses for pancreatic abnormalities was performed before the study and then every 24 weeks, because of previous infrequent reports of pancreatitis associated with leflunomide use" (Pages 1294‐5) | Low | Categorisation of SAEs conformed to ICH guidelines (International Conference on Harmonisation of Technical Requirements for Registration of Pharmaceuticals for Human Use) | |
| Low | "Safety and tolerability were assessed using AE reporting, vital signs and laboratory assessments. Adverse event reports were collected at randomisation, Weeks 2, 6, 12, 18, 24, 36 and every 12 weeks thereafter. Vital signs were documented at screening, randomisation and every 12 weeks thereafter; clinical laboratory results were assessed throughout the study. Adverse events and vital signs were also recorded during unscheduled relapse visits" (Page 707) | Low | Categorisation of SAEs conformed to ICH guidelines (International Conference on Harmonisation of Technical Requirements for Registration of Pharmaceuticals for Human Use) [information provided on request by Genzyme] | |
| Low | "Safety was assessed through adverse event reporting (upon occurrence), clinical laboratory tests (every 2 weeks until week 24, then every 6 weeks while still on treatment), vital signs (at weeks 2 and 6, then every 6 weeks until week 24, then every 12 weeks while still on treatment), abdominal ultrasonography (at week 24, then every 24 weeks), and electrocardiography (at baseline and end of treatment)" (Page 248) | Low | Categorisation of SAEs conformed to ICH guidelines (International Conference on Harmonisation of Technical Requirements for Registration of Pharmaceuticals for Human Use) | |
| Low | "An independent data and safety monitoring board evaluated overall safety in the fingolimod phase 3 program" and "Safety assessments were conducted during screening, at baseline, and at months 1, 2, 3, 6, 9, and 12" (Page 404) | Low | Categorisation of SAEs conformed to ICH guidelines (International Conference on Harmonisation of Technical Requirements for Registration of Pharmaceuticals for Human Use) |
Serious adverse event (SAE) definition and reporting
In nine trials (23%) SAEs were not reported and we judged the risk of bias to be high. In 15 trials (38%) SAEs were reported but insufficient information on their definition was given and we judged the risk of bias to be unclear. Fifteen studies (38%) provided a definition of SAEs and we judged the risk of bias to be low.
Effects of interventions
summary of findings Table for the main comparison provides overall estimates of treatment effects compared with placebo and the quality of the available evidence for the three benefit outcomes (chance of experiencing one or more relapses over 12 months, chance of experiencing one or more relapses over 24 months, chance of disability getting worse over 24 months), obtained through a network meta‐analysis. Figure 4 shows the networks of evidence for the benefit and acceptability of immunomodulators and immunosuppressants included in the review. Each line links the treatments that have been directly compared in studies. The thickness of the line is proportional to the number of participants included in the comparison and the width of each circle is proportional to the number of studies included in the comparison. Figure 5 and Figure 6 show, respectively, the estimates of benefit and acceptability of each treatment against placebo within the networks. Analysis 3.1 provides the summary of treatment safety compared with placebo within pairwise comparisons. Figure 7, Figure 8, Figure 9, Figure 10 and Figure 11 show the network meta‐analysis estimates of primary benefit and acceptability outcomes for each comparison.

Network plots of treatment comparisons for benefit and acceptability outcomes.
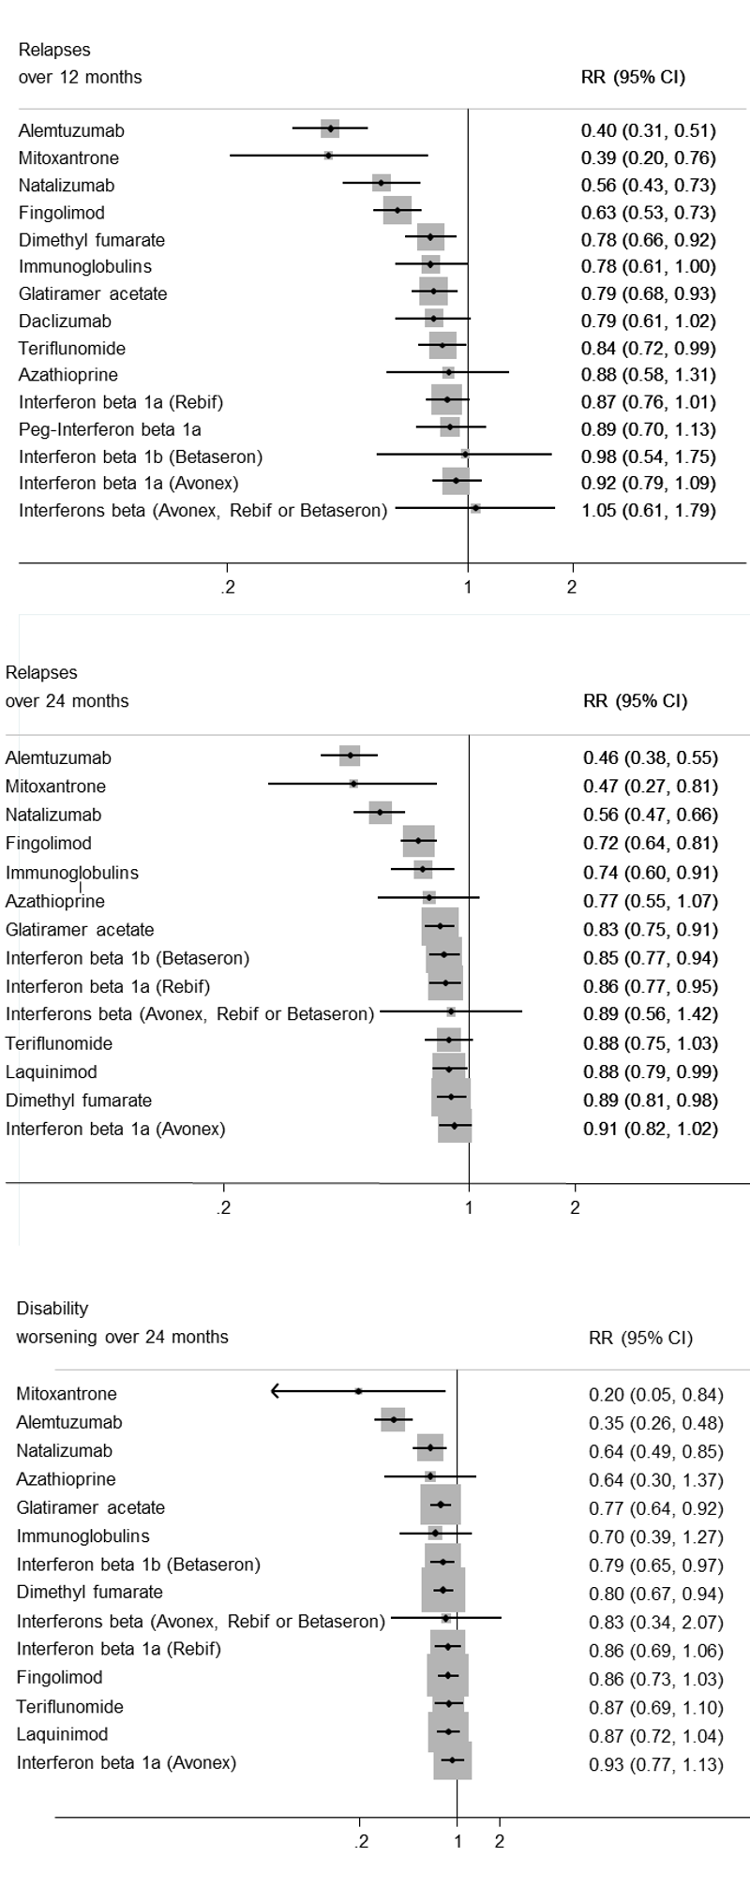
Network meta‐analysis (NMA) estimates of treatment benefit against placebo: relapses over 12 and 24 months, and disability worsening over 24 months.
CI: confidence interval; RR: risk ratio.

Network meta‐analysis (NMA) estimates of treatment acceptability against placebo: treatment discontinuation due to AEs over 12 and 24 months.
AEs: adverse events; CI: confidence interval; RR: risk ratio.
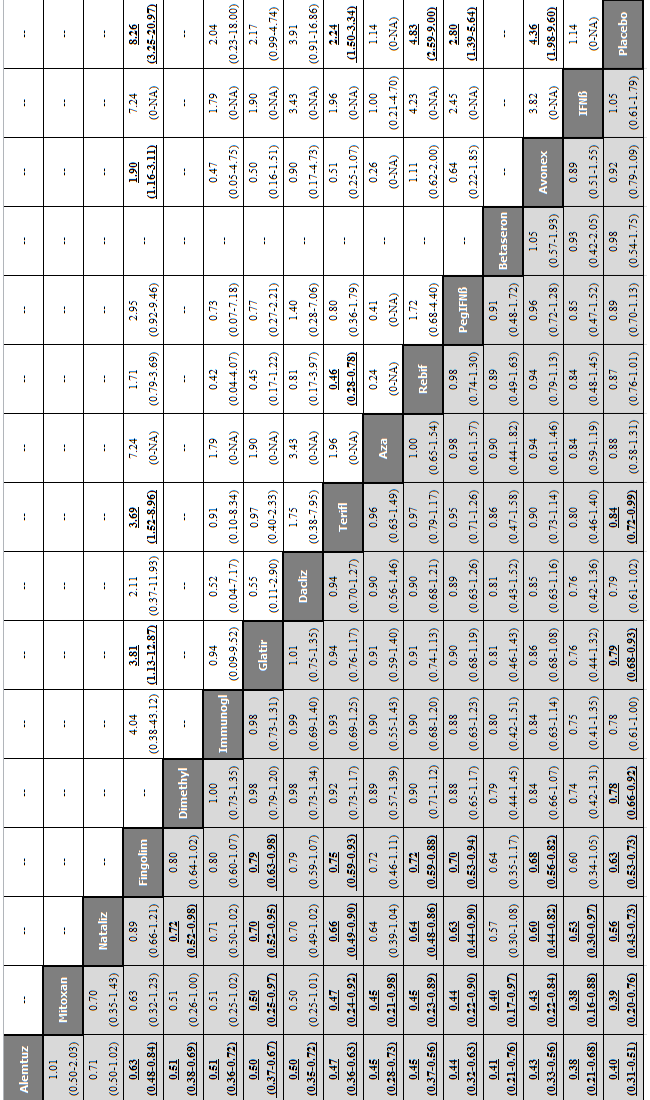
Network meta‐analysis (NMA) estimates of treatment benefit (lower triangle) and acceptability (upper triangle) over 12 months for each comparison: relapses and treatment discontinuation due to adverse events (AEs) over 12 months.
Drugs are reported in order of primary benefit ranking. Comparisons should be read from left to right. The estimate (risk ratio, RR) is located at the intersection of the column‐defining treatment and the row‐defining treatment. A RR value below 1 favours the column‐defining treatment for lower triangle, and the row‐defining treatment for upper triangle. To obtain RRs for comparisons in the opposing direction, reciprocals should be taken. Significant results are bolded and underscored.
Alemtuz: alemtuzumab; Avonex: interferon beta‐1a (Avonex); Aza: azathioprine; Betaseron: interferon beta‐1b (Betaseron); Dacliz: daclizumab; Dimethyl: dimethyl fumarate; Fingolim: fingolimod; Glatir: glatiramer acetate; IFNß: interferons beta; Immunogl: immunoglobulins; Mitoxan: mitoxantrone; Nataliz: natalizumab; PegIFNß: pegylated interferon beta‐1a; Rebif: interferon beta‐1a (Rebif); Terifl: teriflunomide.
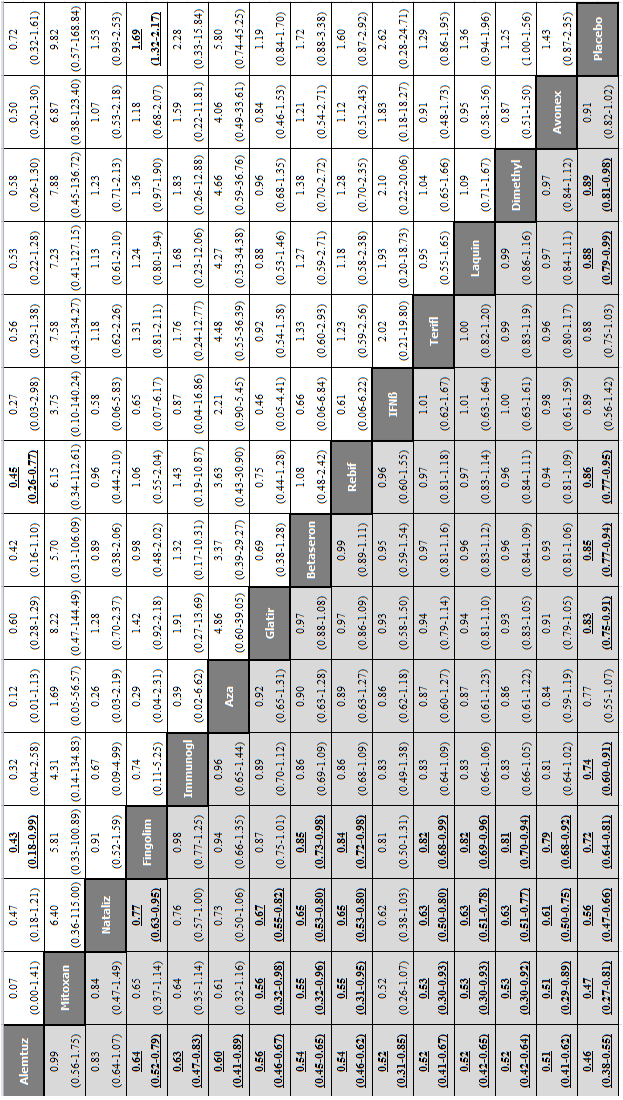
Network meta‐analysis (NMA) estimates of treatment benefit (lower triangle) and acceptability (upper triangle) over 24 months for each comparison: relapses and treatment discontinuation due to adverse events (AEs) over 24 months. Drugs are reported in order of primary benefit ranking. Comparisons should be read from left to right. The estimate (risk ratio, RR) is located at the intersection of the column‐defining treatment and the row‐defining treatment. A RR value below 1 favours the column‐defining treatment for lower triangle, and the row‐defining treatment for upper triangle. To obtain RRs for comparisons in the opposing direction, reciprocals should be taken. Significant results are bolded and underscored.
Alemtuz: alemtuzumab; Avonex: interferon beta‐1a (Avonex); Aza: azathioprine; Betaseron: interferon beta‐1b (Betaseron); Dimethyl: dimethyl fumarate; Fingolim: fingolimod; Glatir: glatiramer acetate; IFNß: interferons beta; Immunogl: immunoglobulins; Laquin: laquinimod; Mitoxan: mitoxantrone; Nataliz: natalizumab; Rebif: interferon beta‐1a (Rebif); Terifl: teriflunomide.
Clustered ranking plot based on cluster analysis of surface under the cumulative ranking curve (SUCRA) values for benefit (relapses) and acceptability (treatment discontinuation due to AEs) over 24 months. Each colour represents a group of treatments that belong to the same cluster. Treatments lying in the upper right corner are more effective and acceptable than the other treatments.

Network meta‐analysis (NMA) estimates of treatment benefit (lower triangle) and acceptability (upper triangle) over 24 months for each comparison: disability worsening and treatment discontinuation due to adverse events (AEs) over 24 months. Drugs are reported in order of primary benefit ranking. Comparisons should be read from left to right. The estimate is located at the intersection of the column‐defining treatment and the row‐defining treatment. A RR value below 1 favours the column‐defining treatment for lower triangle, and the row‐defining treatment for upper triangle. To obtain RRs for comparisons in the opposing direction, reciprocals should be taken. Significant results are bolded and underscored.
Alemtuz: alemtuzumab; Avonex: interferon beta‐1a (Avonex); Aza: azathioprine; Betaseron: interferon beta‐1b (Betaseron); Dimethyl: dimethyl fumarate; Fingolim: fingolimod; Glatir: glatiramer acetate; IFNß: interferons beta; Immunogl: immunoglobulins; Laquin: laquinimod; Mitoxan: mitoxantrone; Nataliz: natalizumab; Rebif: interferon beta‐1a (Rebif); Terifl: teriflunomide.

Clustered ranking plot based on cluster analysis of surface under the cumulative ranking curve (SUCRA) values for benefit (disability worsening) and acceptability (treatment discontinuation due to AEs) over 24 months. Each colour represents a group of treatments that belong to the same cluster. Treatments lying in the upper right corner are more effective and acceptable than the other treatments.
1. Primary outcomes
1.1 Benefit
Relapses over 12 and 24 months and disability worsening over 24 months
Pairwise meta‐analysis (direct comparisons)
Treatment estimates for pairwise meta‐analyses are reported in Analysis 1.1, Analysis 1.2, and Analysis 1.3.
Network meta‐analysis estimates (combination of direct and indirect comparisons) of treatment effects against placebo
We did not find any evidence that important variables varied across comparisons or altered the effectiveness of the treatments. Accordingly, none of the corresponding analyses provided evidence that any potential effect modifiers were possible sources of inconsistency or heterogeneity. However, few studies per comparison were available and the results from sensitivity and subgroup analyses were very uncertain, so no firm conclusion can be drawn about the presence or absence of transitivity and heterogeneity.
See: summary of findings Table for the main comparison, Figure 4, Figure 5, Figure 7, Figure 8, Figure 9, Figure 10 and Figure 11.
a) Relapses over 12 months were provided in 29 studies involving 17,897 participants with relapsing‐remitting multiple sclerosis (RRMS) (71.3% of the participants in this review) (Achiron 1998; ADVANCE 2014; AFFIRM 2006; BECOME 2009; Bornstein 1987; CAMMS223 2008; CARE‐MS I 2012; CARE‐MS II 2012; Comi 2001; CONFIRM 2012; DEFINE 2012; Etemadifar 2007; EVIDENCE 2007; Fazekas 2008; FREEDOMS 2010; FREEDOMS II 2014; GALA 2013; Goodkin 1991; Lewanska 2002; MAIN TRIAL; Millefiorini 1997; MSCRG 1996; OWIMS 1999; PRISMS 1998; SELECT 2013; TEMSO 2011; TENERE 2014; TOWER 2014; TRASFORMS 2010). Nineteen studies of 12 treatments involving 12,100 participants were placebo‐controlled trials, nine studies of 12 treatments involving 4367 participants were head‐to‐head trials directly comparing active treatments, and one study involving 1430 participants had both a placebo and two active treatment arms. Five of 15 treatments (33%) were compared to placebo only. The majority of direct comparisons between active treatments were not assessed in any trial (Figure 4). Alemtuzumab was the best drug (risk ratio (RR) versus placebo 0.40, 95% confidence interval (CI) 0.31 to 0.51; SUCRA = 97%; moderate quality evidence), followed by mitoxantrone (RR versus placebo 0.40, 95% CI 0.20 to 0.76; SUCRA = 93%; low quality evidence), natalizumab (RR versus placebo 0.56, 95% CI 0.43 to 0.73; SUCRA = 85%; high quality evidence), and fingolimod (RR versus placebo 0.63, 95% CI 0.53 to 0.74; SUCRA = 80%; low quality evidence). The heterogeneity τ2 for this network overall was 0.01, which we considered low heterogeneity.
b) Relapses over 24 months were provided in 26 studies and 16,800 participants with RRMS (67% of those included in this review) (Achiron 1998; AFFIRM 2006; ALLEGRO 2012; BECOME 2009; BEYOND 2009; Bornstein 1987; BRAVO 2014; CAMMS223 2008; CARE‐MS I 2012; CARE‐MS II 2012; CONFIRM 2012; DEFINE 2012; Fazekas 1997; FREEDOMS 2010; FREEDOMS II 2014; Goodkin 1991; IFNB MS Group 1993; INCOMIN 2002; Johnson 1995; Koch‐Henriksen 2006; MAIN TRIAL; Millefiorini 1997; MSCRG 1996; PRISMS 1998; REGARD 2008; TEMSO 2011). Fifteen studies of 12 treatments involving 8562 participants were placebo‐controlled trials, nine studies of seven treatments involving 5477 participants were head‐to‐head trials directly comparing active treatments, and two studies involving 2761 participants had both a placebo and two active treatment arms each. Five of 14 treatments (36%) were compared to placebo only. The majority of direct comparisons between active treatments were not assessed in any trial (Figure 4). As for the relapse over 12 months outcome, alemtuzumab was the best drug (RR versus placebo 0.46, 95% CI 0.38 to 0.55; SUCRA = 96%; moderate quality evidence), followed by mitoxantrone (RR versus placebo 0.47, 95% CI 0.27 to 0.81; SUCRA = 92%; very low quality evidence), natalizumab (RR versus placebo 0.56, 95% CI 0.47 to 0.66; SUCRA = 88%; high quality evidence), and fingolimod (RR versus placebo 0.72, 95% CI 0.64 to 0.81; SUCRA = 71%; moderate quality evidence). The heterogeneity τ2 for this network overall was 0.0036, which we considered low heterogeneity.
c) Disability worsening over 24 months was available from 26 studies and 16,800 participants with RRMS (67% of those included in this review) (Achiron 1998; AFFIRM 2006; ALLEGRO 2012; BECOME 2009; BEYOND 2009; Bornstein 1987; BRAVO 2014; CAMMS223 2008; CARE‐MS I 2012; CARE‐MS II 2012; CONFIRM 2012; DEFINE 2012; Fazekas 1997; FREEDOMS 2010; FREEDOMS II 2014; Goodkin 1991; IFNB MS Group 1993; INCOMIN 2002; Johnson 1995; Koch‐Henriksen 2006; MAIN TRIAL; Millefiorini 1997; MSCRG 1996; PRISMS 1998; REGARD 2008; TEMSO 2011). The network geometry for disability worsening over 24 months was as for relapses over 24 months (Figure 4). Mitoxantrone was the best drug (RR versus placebo 0.20, 95% CI 0.05 to 0.84; SUCRA = 96%; low quality evidence), followed by alemtuzumab (RR versus placebo 0.35, 95% CI 0.26 to 0.48; SUCRA = 94%; low quality evidence), and natalizumab (RR versus placebo 0.64, 95% CI 0.49 to 0.85; SUCRA = 74%; moderate quality evidence). The heterogeneity τ2 for this network overall was 0.0081, which we considered low heterogeneity.
Relapses and disability worsening over 36 months
Relapses and disability worsening over 36 months were available from two studies only: one on glatiramer acetate versus interferon beta‐1a (Avonex), with a RR of 0.71 (95% CI 0.57 to 0.88) for relapses, and a RR of 0.91 (95% CI 0.75 to 1.10) for disability worsening (CombiRx 2013); one on alemtuzumab versus interferon beta‐1a (Rebif), with a RR of 0.48 (95% CI 0.33 to 0.68) for relapses, and a RR of 0.42 (95% CI 0.30 to 0.57) for disability worsening (CAMMS223 2008). We judged both studies at high risk of bias (Figure 3).
1.2 Acceptability
Treatment discontinuation due to adverse events over 12 and 24 months
Pairwise meta‐analysis (direct comparisons)
Treatment estimates for pairwise meta‐analyses are reported in Analysis 2.1 and Analysis 2.2.
Network meta‐analysis estimates (combination of direct and indirect comparisons) of treatment effects against placebo
See: Figure 4, Figure 6, Figure 7, Figure 8, Figure 9, Figure 10 and Figure 11.
Acceptability over 12 months was reported in 13 studies on 10 treatments involving 8105 participants: nine studies of seven treatments involving 5718 participants were placebo‐controlled trials, and four studies of six treatments involving 2387 participants were head‐to‐head trials directly comparing active treatments. Four of 10 treatments (40%) were compared to placebo only. The majority of direct comparisons between active treatments were not assessed in any trial (Figure 4). The network geometry for acceptability over 24 months was as for relapses and disability worsening over 24 months (Figure 4). The network meta‐analysis showed that over 12 months, compared to placebo, several treatments had a significantly higher proportion of participants who withdrew due to any adverse event, such as teriflunomide (RR versus placebo 2.24, 95% CI 1.50 to 3.34), peg‐interferon beta (RR versus placebo 2.80, 95% CI 1.39 to 5.64), interferon beta‐1a (Avonex) (RR versus placebo 4.36, 95% CI 1.98 to 9.60), interferon beta‐1a (Rebif) (RR versus placebo 4.83, 95% CI 2.59 to 9.00), and fingolimod (RR versus placebo 8.26, 95% CI 3.25 to 20.97). Over 24 months, the network meta‐analysis showed that, compared to placebo, only fingolimod had a significantly higher proportion of participants who withdrew due to any adverse event (RR versus placebo 1.69, 95% CI 1.32 to 2.17). The heterogeneity τ2 for these networks overall was < 0.0001, which we considered low heterogeneity.
1.3 Relationship between benefit and acceptability outcomes for each comparison (network meta‐analysis estimates)
See: Figure 7, Figure 8, Figure 9, Figure 10 and Figure 11.
a) Relapses and acceptability over 12 months (Figure 7). Compared to placebo and all other active agents, excluding mitoxantrone and natalizumab, alemtuzumab showed a significantly lower proportion of participants who experienced new relapses over 12 months, but no data were available on the acceptability of alemtuzumab over 12 months. Compared to placebo and several other active agents, mitoxantrone, natalizumab, and fingolimod showed a significantly lower proportion of participants who experienced new relapses over 12 months. However, data on the acceptability of these treatments over 12 months were available for fingolimod only, showing a significantly higher proportion of participants who withdrew due to any adverse event over 12 months with fingolimod compared to glatiramer acetate, teriflunomide, interferon beta‐1a (Avonex), and placebo.
b) Relapses and acceptability over 24 months (Figure 8 and Figure 9). Compared to placebo and all other active agents, excluding mitoxantrone and natalizumab, alemtuzumab showed a significantly lower proportion of participants who experienced new relapses over 24 months, and did not show a significantly higher proportion of participants who withdrew due to any adverse event over 24 months. Compared to placebo and several other active agents, mitoxantrone, natalizumab, and fingolimod showed a significantly lower proportion of participants who experienced new relapses over 24 months, and did not show a significantly higher proportion of participants who withdrew due to any adverse event over 24 months, with the exception of fingolimod versus placebo (RR 1.69, 95% CI 1.32 to 2.17). Similar results are shown in the plot representing the groups of treatments obtained from the cluster analysis according to the SUCRA values for both benefit and acceptability.
c) Disability worsening and acceptability over 24 months (Figure 10 and Figure 11). Compared to placebo and all other active agents, excluding mitoxantrone, alemtuzumab showed a significantly lower proportion of participants who experienced disability worsening over 24 months, and did not show a significantly higher proportion of participants who withdrew due to any adverse event over 24 months. Compared to placebo and a few other active agents, mitoxantrone showed a significantly lower proportion of participants who experienced disability worsening over 24 months, and did not show a significantly higher proportion of participants who withdrew due to any adverse event over 24 months. Similar results are shown in the plot representing the groups of treatments obtained from the cluster analysis according to the SUCRA values for both benefit and acceptability.
2. Secondary outcomes
2.1 Safety
Serious adverse events (SAEs)
Pairwise meta‐analysis (direct comparisons)
Compared to the placebo group there was not a significant difference in the proportion of participants with serious adverse events. Nevertheless, information on serious adverse events was scanty, based on a very low number of events, poorly reported and characterised by heterogeneous results (Analysis 3.1).
3. Assessment of heterogeneity and inconsistency within the network analyses
We performed an assessment of heterogeneity and inconsistency within the network analyses for relapses over 12 and 24 months, for disability worsening over 24 months and for acceptability at 12 and 24 months.
We observed evidence of local statistical inconsistency, estimated as a difference between direct and indirect treatment estimates in networks, for two loops for relapses over 24 months and for three for disability worsening over 24 months, and none for relapses over 12 months and acceptability at 12 and 24 months (Figure 12 and Figure 13). However, due to the presence of imprecise direct and network estimates, the absence of statistically significant inconsistency is not evidence against the presence of inconsistency. The values for common heterogeneity (τ2) for the network for each outcome seem to show no evidence of heterogeneity. When evaluating the inconsistency in the networks as a whole, there is no indication of global inconsistency within any network (global test for inconsistency: P value = 0.99 for relapses over 12 months; P value = 0.97 for relapses over 24 months; P value = 0.08 for disability worsening over 24 months), but we expected the power to be low with few studies per comparison and few closed loops. Hence, we decided to downgrade the quality of the evidence for inconsistency in most comparisons.
Inconsistency plots for relapses over 12 and 24 months and disability worsening over 24 months assuming loop‐specific heterogeneity estimates. RRR is calculated as the risk ratio for direct evidence over the risk ratio for indirect evidence in the loop and it is reported together with its 95% confidence interval (CI). RRR values close to one indicate the absence of evidence for disagreement between direct and indirect evidence.

Inconsistency plots for acceptability over 12 and 24 months assuming loop‐specific heterogeneity estimates. RRR is calculated as the risk ratio for direct evidence over the risk ratio for indirect evidence in the loop and it is reported together with its 95% confidence interval (CI). RRR values close to one indicate the absence of evidence for disagreement between direct and indirect evidence.
4. Subgroup and sensitivity analyses
None of the pre‐defined subgroup analyses (i.e. by diagnostic criteria, previous treatments, definition of relapse and pre‐trial relapse rate) and sensitivity analyses (i.e. including only trials at low risk of bias, excluding studies that did not provide complete and clear reporting of dropout data, and excluding trials with a total sample size of fewer than 50 randomised participants) that we performed provided any significantly different results, compared to the overall analyses (see Table 2 and Table 3 for the corresponding network meta‐analysis estimates for relapse outcome over 24 months for the three best drugs, based on moderate to high quality evidence, i.e. alemtuzumab, natalizumab, and fingolimod). However, few studies per comparison were available and limitations in study reporting cannot exclude differences between subgroups.
| Intervention | Subgroup analysis by | |||||||
| Diagnostic criteria | Previous treatments RR (95% CI) | Definition of relapse RR (95% CI) | Pre‐trial relapse rate RR (95% CI) | |||||
| Poser criteria | McDonald criteria | No | Yes | 24‐hour definition | 48‐hour definition | ≥ 1 during the year before randomisation | ≥ 2 during the 2/3 years before randomisation | |
| Alemtuzumab | — | 0.48 (0.33 to 0.68) | 0.46 (0.28 to 0.76) | 0.47 (0.27 to 0.79) | — | 0.46 (0.27 to 0.78) | 0.63 (0.48 to 0.81) | 0.28 (0.16 to 0.49) |
| Natalizumab | — | 0.56 (0.45 to 0.69) | — | 0.70 (0.56 to 0.88) | 0.63 (0.52 to 0.77) | — | 0.68 (0.54 to 0.85) | — |
| Fingolimod | — | 0.72 (0.63 to 0.83) | — | 0.72 (0.65 to 0.80) | 0.81 (0.67 to 0.97) | — | — | 0.72 (0.60 to 0.87) |
CI: confidence interval; NMA: network meta‐analysis; RR: risk ratio.
| Intervention | Sensitivity analysis | ||
| Including only trials of low risk of bias | Excluding studies that did not provide complete and clear reporting of dropout data RR (95% CI) | Excluding trials with a total sample size of fewer than 50 randomised participants RR (95% CI) | |
| Alemtuzumab | — | 0.47 (0.35 to 0.63) | 0.46 (0.39 to 0.56) |
| Natalizumab | 0.66 (0.54 to 0.81) | — | 0.56 (0.47 to 0.66) |
| Fingolimod | — | 0.72 (0.65 to 0.80) | 0.72 (0.64 to 0.81) |
CI: confidence interval; NMA: network meta‐analysis; RR: risk ratio.
5. Reporting bias
We did not produce a contour‐enhanced funnel plot for each pairwise comparison due to the low number of studies. We employed a comparison‐adjusted funnel plot for all placebo‐controlled trials for relapses over 12 and 24 months and disability worsening over 24 months. Small study effects (not necessarily due to reporting bias) appeared to be present for relapses over 12 and 24 months, but not for disability worsening over 24 months (data not shown).
6. Grading of the evidence
We graded the evidence for relapses over 12 and 24 months and for disability worsening over 24 months for each network estimate of an immunomodulator or immunosuppressant used for RRMS versus placebo (summary of findings Table for the main comparison) according to the approach proposed by Salanti 2014. We considered the following domains: study limitations, indirectness, inconsistency, imprecision of effect estimates, and risk of reporting bias.
We assessed the study limitations for each network estimate by first evaluating the risk of bias for each direct estimate and then by integrating these judgements with the contribution of each direct estimate to the network estimates (Figure 14). The percentage contribution of each direct estimate to the network estimates for any considered outcome are reported in Figure 15, Figure 16 and Figure 17. We also took these percentages into account for the evaluation of the other domains, and determined the confidence in an overall treatment ranking from each network meta‐analysis.
Study limitations distribution for each network estimate for pairwise comparisons versus placebo on relapses over 12 and 24 months and disability worsening over 24 months outcomes. Calculations are based on the contributions of direct evidence to the network estimates and the overall risks of bias considering our predefined criteria (allocation concealment, blinding of outcome assessor, and incomplete outcome data) within studies contributing to the direct evidence. The colours represent risk (green, low; yellow, moderate; red, high). The direct comparisons against placebo are described in the vertical axis.
Contribution matrix: percentage contribution of each direct estimate to the NMA estimates versus placebo for relapses over 12 months outcome. Rows correspond to NMA risk ratios of each treatment versus placebo (separated for mixed and indirect evidence) and the columns correspond to direct meta‐analysis risk ratios. The last row shows the number of included direct comparisons. The names of the treatment comparisons are shown in the first column. For example, for relapses over 12 months, information for the network estimate of interferon beta 1a (Avonex) versus placebo is derived from both direct and indirect evidence (generating a mixed estimate). Of this mixed network estimate, trials directly comparing interferon beta 1a (Avonex) versus placebo contribute 31.2% of the information to the network estimate of effect and trials directly comparing interferon beta 1a (Rebif) versus interferon beta 1a (Avonex) contribute 18.8% of the network estimated effect, etc. The contribution matrix shows how much each direct comparison in the network contributes to each network (mixed or indirect) estimate and to the entire network.
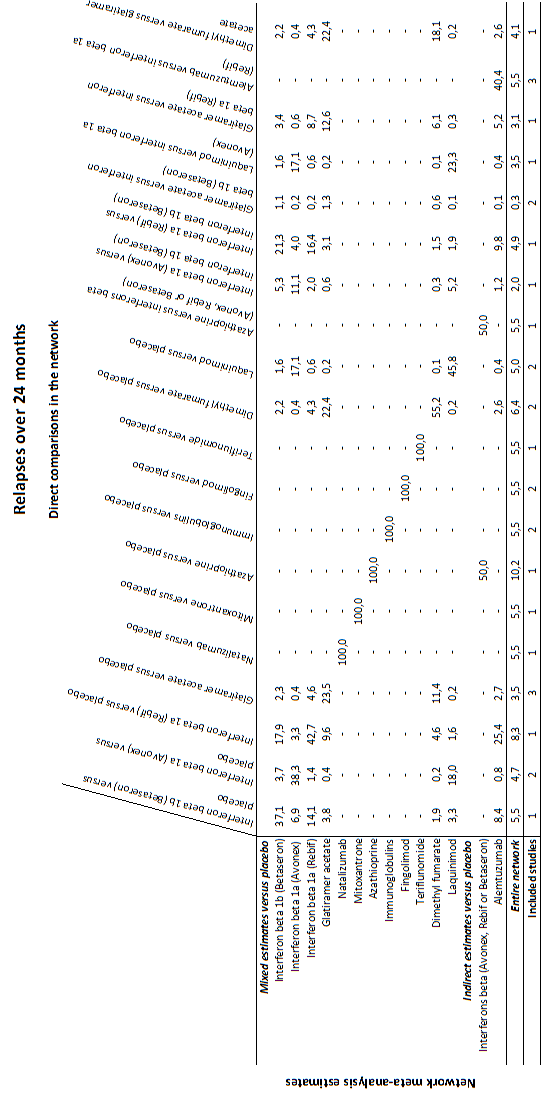
Contribution matrix: percentage contribution of each direct estimate to the NMA estimates versus placebo for relapses over 24 months outcome.
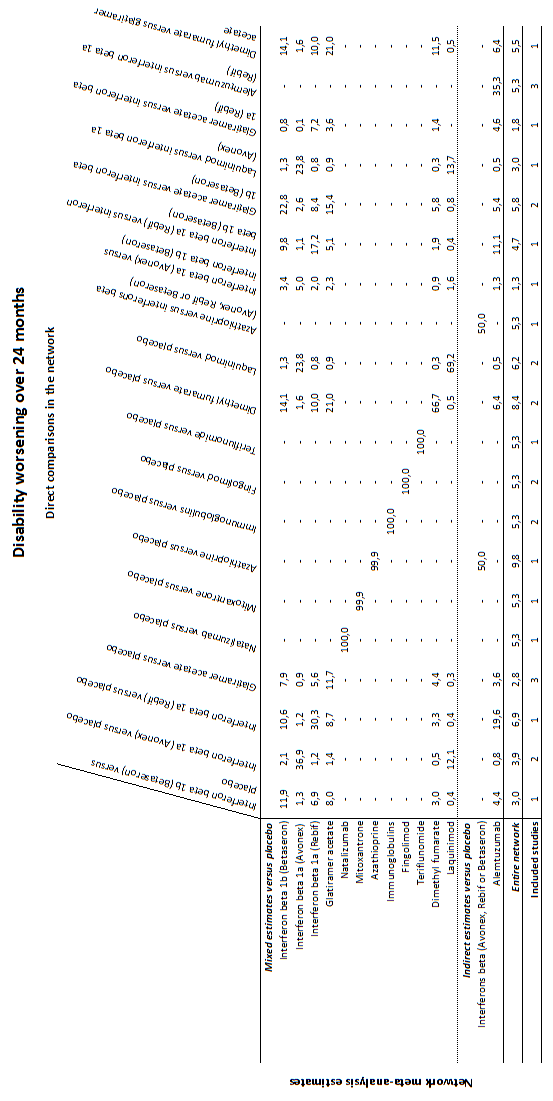
Contribution matrix: percentage contribution of each direct estimate to the NMA estimates versus placebo for disability worsening over 24 months outcome.
We assessed indirectness by evaluating both indirectness of populations, interventions, and outcomes as in standard GRADE, and transitivity by comparing the distribution of known effect modifiers across comparisons that contribute evidence to estimation of the network meta‐analysis treatment effect, and across networks that contribute evidence to estimation of the overall treatment ranking from each network meta‐analysis.
We assessed inconsistency by judging the extent of heterogeneity (i.e. considering the comparison‐specific heterogeneity variance with other relevant metrics such as the I2 statistic, the network meta‐analysis estimate of variance and a prediction interval), and by evaluating the extent to which the comparison under evaluation was involved in inconsistent loops of evidence, and the overall inconsistency in the networks using global tests of inconsistency.
Evaluation of imprecision was focused on width of the CIs of the network meta‐analysis treatment effect estimates, and visually examining ranking probabilities (i.e. rankograms) for overlap to assess the precision of treatment rankings.
Due to the low number of studies for each comparison, we assessed reporting bias through a comparison‐adjusted funnel plot for the treatment ranking estimates only.
For relapses at 24 months we judged the confidence in the treatment estimate to be high for natalizumab only, moderate for alemtuzumab, fingolimod, dimethyl fumarate, glatiramer acetate, daclizumab, and interferon beta‐1a (Avonex), and low or very low for all the other treatment estimates. For disability worsening at 24 months the confidence in almost all of the treatment estimates varied from low to very low, except for natalizumab, which we evaluated as moderate quality.
In the ranking of the treatments we judged our confidence as low for relapses over 12 and 24 months due to study limitations and reporting bias, and low for disability worsening at 24 months due to indirectness and imprecision.
Discusión
Resumen de los resultados principales
Esta revisión de los efectos de los tratamientos para la esclerosis múltiple recurrente remitente (EMRR) incluyó 39 estudios con 25 113 participantes adultos asignados al azar. En su mayoría los estudios fueron ensayos a corto plazo, con una duración mediana del ensayo controlado aleatorio (ECA) de 24 meses. Solamente dos estudios informaron un seguimiento de 36 meses, por lo que los efectos de estos tratamientos después de dos años todavía no están claros.
1. Reincidencia de las recurrencias
Alemtuzumab, mitoxantrona, natalizumab y fingolimod sobresalieron por encima de otros fármacos, fueron significativamente más eficaces desde el punto de vista estadístico que placebo y la mayoría de los otros fármacos, con cocientes de riesgos (CR) versus placebo que variaron entre 0,40 y 0,72 en ambos a los 12 y 24 meses. Comparaciones directas que contribuyeron a estas estimaciones de red: 40% para el alemtuzumab (tres ensayos versus interferón beta‐1a [Rebif] con 1582 participantes) y 100% para el fingolimod (dos ensayos versus placebo con 2355 participantes), para el natalizumab (un estudio versus placebo con 942 participantes) y para la mitoxantrona (un estudio versus placebo con 51 participantes). Además, según el enfoque GRADE para el metanálisis de redes, la confianza en las pruebas para los efectos beneficiosos se evaluó como alta para el natalizumab, moderada para el alemtuzumab, moderada a baja para el fingolimod y baja a muy baja para la mitoxantrona.
1. Empeoramiento de la discapacidad
La medición de este resultado se basó en un marcador alternativo en la mayoría de los estudios incluidos, ya que utilizaron el empeoramiento de la discapacidad confirmado solamente a los tres meses de seguimiento, lo que refleja un efecto sobre la discapacidad relacionada con la recurrencia. Las comparaciones directas e indirectas revelaron que casi ninguno de los tratamientos incluidos en esta revisión fue eficaz para prevenir el empeoramiento de la discapacidad después de dos años, con la excepción de la mitoxantrona, el alemtuzumab y el natalizumab. No obstante, la confianza en los efectos beneficiosos fue moderada para el natalizumab y baja para la mitoxantrona y el alemtuzumab.
3. Aceptabilidad y seguridad
Casi todos los agentes incluidos en esta revisión se asociaron con una proporción mayor de participantes que se retiraron debido a cualquier evento adverso en comparación con placebo a los 12 y 24 meses. Todos los tratamientos con información disponible sobre los eventos adversos graves se asociaron con una proporción mayor no significativa de pacientes con al menos un EAG en comparación con placebo durante un período mediano de seguimiento de dos años. Fue probable que la falta de significación estadística en los análisis fuera causada por un número escaso de eventos y ensayos a corto plazo. Además, la información sobre los eventos adversos graves fue escasa, se informó de manera deficiente y se caracterizó por resultados heterogéneos.
Compleción y aplicabilidad general de las pruebas
Muchos de los ensayos incluidos en esta revisión aportaron pruebas sobre la proporción de participantes que presentaron nuevas recurrencias, empeoramiento de la discapacidad y eventos adversos después de 12 ó 24 meses de seguimiento, pero solamente dos estudios informaron datos sobre estos resultados después de 36 meses. Este es un resultado no conveniente si se considera que la esclerosis múltiple (EM) es una enfermedad de 30 a 40 años de duración. Además, los datos de seguridad escasos y con un informe deficiente no proporcionaron pruebas completas, lo que provoca incertidumbre acerca del perfil de riesgos de los tratamientos incluidos en la revisión.
Las pruebas sobre 15 tratamientos incluidos en esta revisión se derivaron de 39 ensayos (buscados hasta septiembre de 2014), que es un número pequeño de estudios con respecto al número de tratamientos. Además, las pruebas se derivaron principalmente de 16 ensayos (16 162 pacientes; el 64,4% de los incluidos en esta revisión) sobre fármacos nuevos principalmente comparados con placebo (60% de los ensayos incluidos en esta revisión). Por lo tanto, no hay certeza de que los resultados de la revisión se ajusten al contexto de la práctica actual porque cerca del 50% de los pacientes son tratados con al menos uno de estos tratamientos(Carroll 2014).
Las razones por las que hay pocos estudios aleatorios de EMRR y éstos son principalmente controlados con placebo, probablemente se deben a: i) la aprobación de tratamientos para la EMRR por muchos organismos reguladores nacionales basados en resultados tan escasos como los de un ensayo controlado con placebo; ii) la falta consiguiente de interés de las compañías farmacéuticas en realizar estudios costosos adicionales; iii) la ventaja poco probable de las compañías farmacéuticas de realizar ensayos de comparación directa que comparen tratamientos activos.
No se pretendió que esta revisión fuera una revisión integral de todos los efectos de los tratamientos para la EMRR. Se centró en tres resultados clínicos importantes (recurrencias, empeoramiento de la discapacidad y aceptabilidad del tratamiento) que se consideraron significativos para los pacientes y los médicos. No se incluyeron resultados informados por el paciente como las funciones conductuales o la calidad de vida. Son, sin duda, resultados importantes para los participantes pero rara vez se informan en los ensayos clínicos, a menudo sin la monitorización y la disponibilidad adecuadas de resultados apropiados publicados. Las diferentes escalas utilizadas y los diferentes puntos temporales de evaluación no permiten hacer comparaciones. Además, estas medidas pueden ser susceptibles al sesgo en ensayos en los que muchos, si no la mayoría, de los participantes tratados conocen el tratamiento que reciben debido a los efectos secundarios bien documentados de los tratamientos incluidos en la revisión.
Aunque las medidas de imaginología de resonancia magnética (IRM) se utilizan ampliamente en los ensayos de EM, en esta revisión se decidió incluir solamente resultados clínicos.
Calidad de la evidencia
Con frecuencia se disminuyó la calidad de las pruebas para las recurrencias a los 12 y 24 meses de alta calidad debido a las limitaciones de los estudios y luego debido a la inconsistencia o la imprecisión, lo que dio lugar a pruebas de calidad moderada o baja para la mayoría de las comparaciones. Solamente tres de 39 ensayos incluidos (8%) se consideraron con bajo riesgo de sesgo, en los que se cumplieron los criterios para la ocultación de la asignación, el cegamiento de los evaluadores de resultado y hubo datos completos de los resultados. La frecuencia de la disminución de la calidad de las pruebas con respecto al efecto beneficioso para prevenir las recurrencias a los 12 y 24 meses fue del 40% y el 57% de las estimaciones del tratamiento respectivamente por la inconsistencia, y del 40% y el 21% respectivamente por la imprecisión.
Las razones de la disminución de la calidad de las pruebas con respecto al efecto beneficioso para prevenir el empeoramiento de la discapacidad fueron similares a las informadas para las recurrencias. Además, la mayoría de los ensayos incluidos requirió solamente de tres meses de seguimiento para confirmar el empeoramiento mantenido de la discapacidad. Aunque se tuvo que aceptar la definición proporcionada en los artículos originales, se consideró que el criterio de tres meses tenía alto riesgo de sesgo porque esta definición significó que los participantes que se recuperaron lentamente de las recurrencias se consideraron con empeoramiento continuado de la discapacidad(Ebers 2008). Por lo tanto, para el empeoramiento de la discapacidad a los 24 meses la confianza en casi todas las estimaciones del tratamiento varió de baja a muy baja, excepto para natalizumab, que se evaluó de calidad moderada.
Sesgos potenciales en el proceso de revisión
1. Presuposición de transitividad
Se supuso que cualquier paciente que cumpliera con los criterios de inclusión tenía, en principio, iguales probabilidades de ser asignado de forma aleatoria a cualquiera de las intervenciones elegibles. Sin embargo, como se analizó en la sección Antecedentes, varias características de los participantes han cambiado en los ensayos más recientes y, por lo tanto, una hipótesis de transitividad puede no haber sido un presuposición razonable de hacer debido a las diferencias en las características de los pacientes o los ensayos. Por lo tanto, se evaluó la presuposición de transitividad al evaluar las diferencias en las características de los pacientes como la edad, la duración de la enfermedad, y las puntuaciones iniciales en la Expanded Disability Status Scale (EDSS) entre los ensayos y al comparar los modificadores potenciales del efecto predefinidos entre las diferentes comparaciones en las redes. No se encontraron pruebas de que las variables importantes variaran en las comparaciones o alteraran la efectividad de los tratamientos; aunque algunos factores de confusión pueden estar ocultos y no haberse medido, quizás sea razonable analizar la red en su totalidad. Por lo tanto, se supuso que la transitividad se mantuvo y que un enfoque metaanalítico de la red fue razonable. Sin embargo, hubo pocos estudios disponibles por comparación y las limitaciones en el informe de los estudios no pueden excluir la posibilidad de falta de transitividad.
2. Heterogeneidad e inconsistencia
No se encontraron pruebas sólidas de la presencia de heterogeneidad en las comparaciones por pares directas o en todas las redes. De manera similar, el enfoque específico de iteración y el modelo "diseño por tratamiento" no proporcionaron una indicación clara de la presencia de inconsistencia localmente o en todas las redes. Por lo tanto, se considera que la presuposición de consistencia es razonable para este tipo de datos. Sin embargo, el poder estadístico de estas pruebas y los enfoques para detectar inconsistencia es bajo, en particular para las redes con un número pequeño de estudios por comparación incluidos. Por lo tanto, en muchas ocasiones se decidió disminuir las pruebas por inconsistencia.
3. Análisis de subgrupos y de sensibilidad
Ninguno de los análisis realizados sobre cualquiera de los modificadores hipotéticos del efecto como los diferentes criterios de diagnóstico, la prevalencia en los ensayos incluidos de participantes que hubieran recibido tratamientos de primera o segunda línea, y las definiciones de recurrencia y las tasas de recurrencia previas al ensayo, proporcionaron resultados significativamente diferentes en comparación con los análisis generales. Este resultado inesperado probablemente se debió al hecho de que, aunque hay diferencias en las características de los participantes incluidos en los estudios más antiguos y más recientes, los efectos relativos de los tratamientos no se afectaron por cualquiera de los modificadores del efecto hipotéticos.
4. Sesgo de notificación
No fue posible excluir completamente la posible presencia de sesgo de notificación, parcialmente apoyado por el gráfico en embudo (funnel plot) de contorno mejorado para las recurrencias a los 12 y 24 meses.
Acuerdos y desacuerdos con otros estudios o revisiones
En esta revisión que incluyó ECA de 15 tratamientos farmacológicos para los pacientes con EMRR se encontró que los pacientes que recibieron natalizumab o alemtuzumab tuvieron un riesgo significativamente menor de presentar nuevas recurrencias después de 12 ó 24 meses en comparación con placebo, según pruebas de calidad alta o moderada respectivamente. Actualmente no hay pruebas suficientes con respecto a la superioridad de cualquier tratamiento incluido en la prevención del empeoramiento irreversible de la discapacidad después de 24 meses en comparación con placebo; dichas pruebas son de calidad baja para todos los tratamientos incluidos, con la excepción de pruebas de calidad moderada para natalizumab.
En la revisión Cochrane anterior de ECA, que incluyó solamente ensayos de los nueve fármacos aprobados en primer lugar para la EMRR, se evaluó la calidad de las pruebas para el efecto beneficioso derivado de las comparaciones por pares porque el enfoque GRADE estuvo disponible solamente para el metanálisis tradicional (Filippini 2013). En ese revisión se encontraron pruebas de alta calidad de que el natalizumab y el interferón beta‐1a (Rebif) fueron superiores a todos los otros tratamientos para prevenir nuevas recurrencias en la EMRR después de 12 y 24 meses en comparación con placebo. Pruebas de calidad moderada también apoyaron un efecto protector del natalizumab y el interferón beta‐1a (Rebif) contra el empeoramiento de la discapacidad en la EMRR después de 24 meses en comparación con placebo. En esta nueva revisión fue posible evaluar la calidad de las pruebas mediante una adaptación del enfoque GRADE estándar a los resultados del metanálisis de redes, que actualmente está disponible (Salanti 2014). Mediante este método fue posible confirmar la superioridad de natalizumab para la prevención de las nuevas recurrencias después de 12 y 24 meses (pruebas de alta calidad) y del empeoramiento de la discapacidad después de 24 meses (pruebas de calidad moderada). No fue posible confirmar el resultado anterior para el interferón beta‐1a (Rebif), ya que ahora las pruebas se consideraron de calidad baja o muy baja. En consecuencia, para las recurrencias después de 12 meses el interferón beta‐1a (Rebif) se ha comparado en ensayos con placebo, interferón beta‐1a (Avonex), teriflunomida y alemtuzumab. Las pruebas del interferón beta‐1a (Rebif) versus placebo se consideraron de calidad baja debido a las limitaciones de los estudios incluidos en las iteraciones en los que se incluyó el interferón beta‐1a (Rebif). La heterogeneidad también estuvo presente dentro de las iteraciones. Se encontró un escenario similar para las recurrencias y el empeoramiento de la discapacidad después de 24 meses.
Un metanálisis de redes examinó 48 ECA (20 455 participantes), publicados antes del 12 de noviembre de 2012, de los interferones beta, el acetato de glatiramero, el natalizumab, el fingolimod, la teriflunomida, y la mitoxantrona en pacientes con EMRR, EM secundaria progresiva (EMSP) con recurrencias y EM progresiva recurrente (EMPR) o combinaciones de los tipos anteriores de EM (Hadjigeorgiou 2013). El análisis directo mostró que el fingolimod tuvo un efecto más beneficioso que el interferón beta‐1a (Avonex) (odds ratio [OR] 2,02; intervalo de confianza [IC] del 95%: 1,46 a 2,79) para prevenir nuevas recurrencias y el interferón beta‐1b tuvo un efecto más beneficioso que el interferón beta‐1a (Avonex) (OR 2,77; IC del 95%: 1,33 a 5,88) para prevenir el empeoramiento de la discapacidad. El análisis indirecto indicó que natalizumab puede tener un mejor efecto beneficioso relativo en comparación con los otros tratamientos para la prevención de nuevas recurrencias. Los autores informaron que no hubo datos disponibles para cualquier comparación con respecto a los eventos adversos con dichos tratamientos. La mayoría de los resultados no se pueden comparar con el metanálisis de redes de Hadjigeorgiou ya que éste se centró en diferentes tipos de participantes y no incluye todos los tratamientos que actualmente están disponibles para la EMRR, que se han incluido en esta revisión. Además, los autores no evaluaron la calidad de las pruebas para los resultados que surgieron del metanálisis de redes.
El metanálisis de redes publicado por Zintzaras 2012 es una versión anterior del artículo publicado por Hadjigeorgiou 2013. En Zintzaras 2012, también se incluyeron los tratamientos sin licencia de comercialización, lo que dio lugar a 109 estudios que compararon diferentes tratamientos habitualmente utilizados para la EM, pero también a muchos agentes que actualmente no son de uso clínico como la mielina bovina, o que fueron rechazados por la Food and Drug Administration (FDA) de los EE.UU. y el European Medicines Agency (EMA) porque se encontró que provocan toxicidad, como la cladribina. El metanálisis consideró 145 brazos como tratamientos diferentes (es decir, uno para cada dosis de cada tratamiento) en comparación con interferón beta‐1b (250 µg) (que es la dosis de referencia elegida para análisis) y proporcionó cerca de 90 estimaciones basadas en ocho comparaciones directas con interferón beta‐1b. Por lo tanto, las estimaciones restantes se obtuvieron mediante el análisis indirecto. Los autores informaron que los resultados se deben interpretar con cuidado porque la red fue dominada por las comparaciones indirectas, pero señalaron que los tratamientos combinados podrían ser más alentadores que las monoterapias. Hechos importantes invalidan esta conclusión, según la opinión de los autores de la presente revisión. Primero, esta afirmación provino solamente de comparaciones indirectas. Segundo, los tratamientos combinados no fueron superiores a un único tratamiento comparado ni dieron lugar a un peor resultado. Por ejemplo, la metilprednisolona combinada con interferón beta‐1a no mejoró el empeoramiento de la discapacidad más que el interferón beta‐1a solo (Ravnborg 2010), ni la atorvastatina combinada con interferón beta‐1a dio lugar a un aumento en la actividad de la enfermedad clínica y por IRM (Birnbaum 2008). Tercero, algunos de los estudios primarios incluidos en el análisis indirecto fueron ensayos pequeños de fase dos (Birnbaum 2008; Goodman 2009; Weiner 1993), o utilizaron resultados clínicos no validados para evaluar los efectos del tratamiento (Khoury 2010). Cuarto, los tratamientos combinados aumentaron la frecuencia de eventos adversos graves.
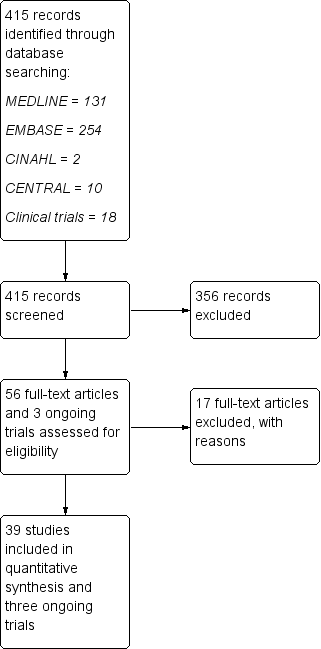
Study flow diagram.

'Risk of bias' graph: review authors' judgements about each risk of bias item presented as percentages across all included studies.
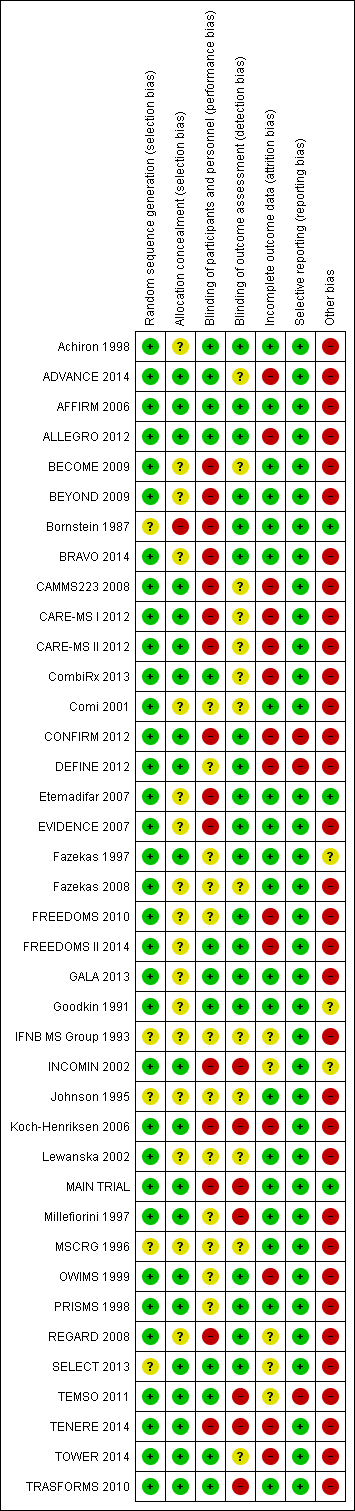
'Risk of bias' summary: review authors' judgements about each risk of bias item for each included study.
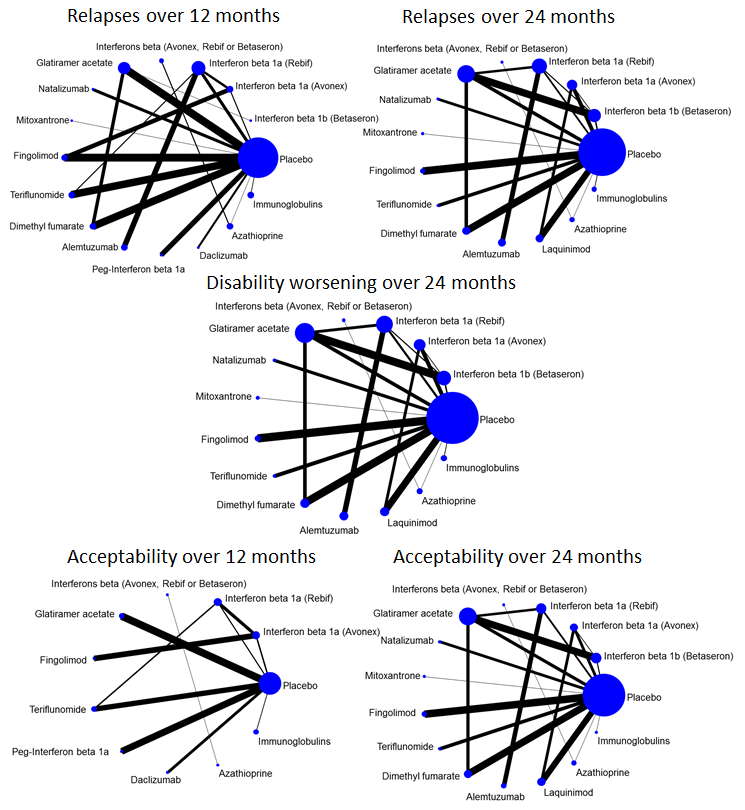
Network plots of treatment comparisons for benefit and acceptability outcomes.

Network meta‐analysis (NMA) estimates of treatment benefit against placebo: relapses over 12 and 24 months, and disability worsening over 24 months.
CI: confidence interval; RR: risk ratio.

Network meta‐analysis (NMA) estimates of treatment acceptability against placebo: treatment discontinuation due to AEs over 12 and 24 months.
AEs: adverse events; CI: confidence interval; RR: risk ratio.

Network meta‐analysis (NMA) estimates of treatment benefit (lower triangle) and acceptability (upper triangle) over 12 months for each comparison: relapses and treatment discontinuation due to adverse events (AEs) over 12 months.
Drugs are reported in order of primary benefit ranking. Comparisons should be read from left to right. The estimate (risk ratio, RR) is located at the intersection of the column‐defining treatment and the row‐defining treatment. A RR value below 1 favours the column‐defining treatment for lower triangle, and the row‐defining treatment for upper triangle. To obtain RRs for comparisons in the opposing direction, reciprocals should be taken. Significant results are bolded and underscored.
Alemtuz: alemtuzumab; Avonex: interferon beta‐1a (Avonex); Aza: azathioprine; Betaseron: interferon beta‐1b (Betaseron); Dacliz: daclizumab; Dimethyl: dimethyl fumarate; Fingolim: fingolimod; Glatir: glatiramer acetate; IFNß: interferons beta; Immunogl: immunoglobulins; Mitoxan: mitoxantrone; Nataliz: natalizumab; PegIFNß: pegylated interferon beta‐1a; Rebif: interferon beta‐1a (Rebif); Terifl: teriflunomide.

Network meta‐analysis (NMA) estimates of treatment benefit (lower triangle) and acceptability (upper triangle) over 24 months for each comparison: relapses and treatment discontinuation due to adverse events (AEs) over 24 months. Drugs are reported in order of primary benefit ranking. Comparisons should be read from left to right. The estimate (risk ratio, RR) is located at the intersection of the column‐defining treatment and the row‐defining treatment. A RR value below 1 favours the column‐defining treatment for lower triangle, and the row‐defining treatment for upper triangle. To obtain RRs for comparisons in the opposing direction, reciprocals should be taken. Significant results are bolded and underscored.
Alemtuz: alemtuzumab; Avonex: interferon beta‐1a (Avonex); Aza: azathioprine; Betaseron: interferon beta‐1b (Betaseron); Dimethyl: dimethyl fumarate; Fingolim: fingolimod; Glatir: glatiramer acetate; IFNß: interferons beta; Immunogl: immunoglobulins; Laquin: laquinimod; Mitoxan: mitoxantrone; Nataliz: natalizumab; Rebif: interferon beta‐1a (Rebif); Terifl: teriflunomide.

Clustered ranking plot based on cluster analysis of surface under the cumulative ranking curve (SUCRA) values for benefit (relapses) and acceptability (treatment discontinuation due to AEs) over 24 months. Each colour represents a group of treatments that belong to the same cluster. Treatments lying in the upper right corner are more effective and acceptable than the other treatments.
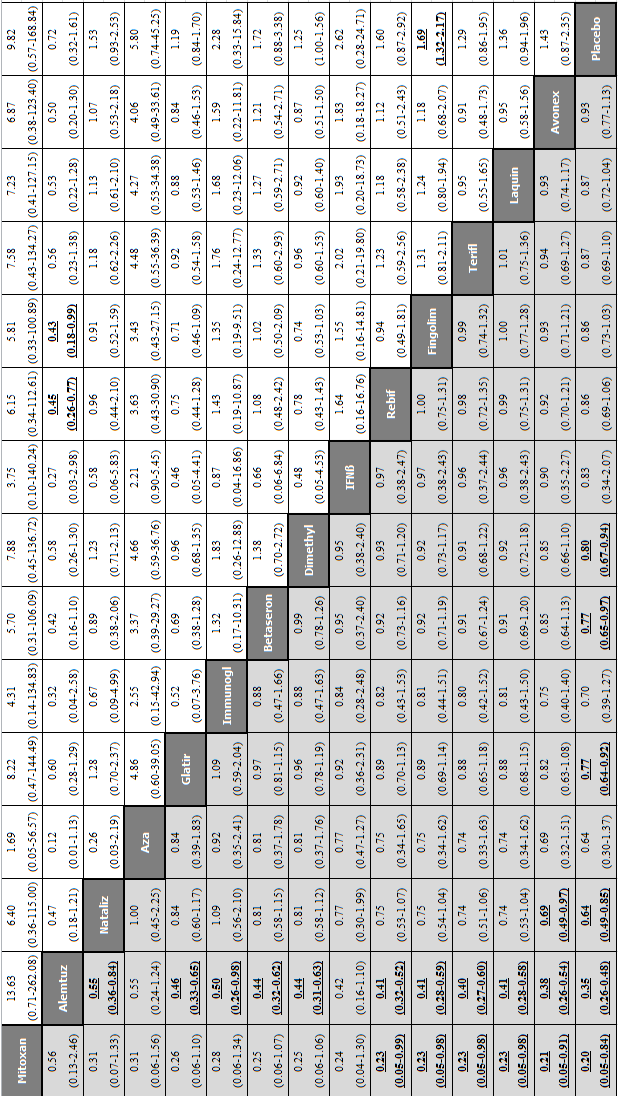
Network meta‐analysis (NMA) estimates of treatment benefit (lower triangle) and acceptability (upper triangle) over 24 months for each comparison: disability worsening and treatment discontinuation due to adverse events (AEs) over 24 months. Drugs are reported in order of primary benefit ranking. Comparisons should be read from left to right. The estimate is located at the intersection of the column‐defining treatment and the row‐defining treatment. A RR value below 1 favours the column‐defining treatment for lower triangle, and the row‐defining treatment for upper triangle. To obtain RRs for comparisons in the opposing direction, reciprocals should be taken. Significant results are bolded and underscored.
Alemtuz: alemtuzumab; Avonex: interferon beta‐1a (Avonex); Aza: azathioprine; Betaseron: interferon beta‐1b (Betaseron); Dimethyl: dimethyl fumarate; Fingolim: fingolimod; Glatir: glatiramer acetate; IFNß: interferons beta; Immunogl: immunoglobulins; Laquin: laquinimod; Mitoxan: mitoxantrone; Nataliz: natalizumab; Rebif: interferon beta‐1a (Rebif); Terifl: teriflunomide.
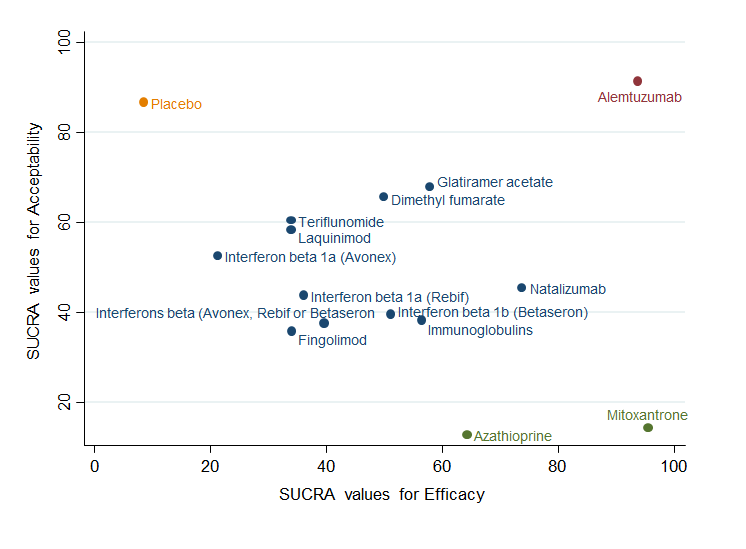
Clustered ranking plot based on cluster analysis of surface under the cumulative ranking curve (SUCRA) values for benefit (disability worsening) and acceptability (treatment discontinuation due to AEs) over 24 months. Each colour represents a group of treatments that belong to the same cluster. Treatments lying in the upper right corner are more effective and acceptable than the other treatments.

Inconsistency plots for relapses over 12 and 24 months and disability worsening over 24 months assuming loop‐specific heterogeneity estimates. RRR is calculated as the risk ratio for direct evidence over the risk ratio for indirect evidence in the loop and it is reported together with its 95% confidence interval (CI). RRR values close to one indicate the absence of evidence for disagreement between direct and indirect evidence.

Inconsistency plots for acceptability over 12 and 24 months assuming loop‐specific heterogeneity estimates. RRR is calculated as the risk ratio for direct evidence over the risk ratio for indirect evidence in the loop and it is reported together with its 95% confidence interval (CI). RRR values close to one indicate the absence of evidence for disagreement between direct and indirect evidence.

Study limitations distribution for each network estimate for pairwise comparisons versus placebo on relapses over 12 and 24 months and disability worsening over 24 months outcomes. Calculations are based on the contributions of direct evidence to the network estimates and the overall risks of bias considering our predefined criteria (allocation concealment, blinding of outcome assessor, and incomplete outcome data) within studies contributing to the direct evidence. The colours represent risk (green, low; yellow, moderate; red, high). The direct comparisons against placebo are described in the vertical axis.

Contribution matrix: percentage contribution of each direct estimate to the NMA estimates versus placebo for relapses over 12 months outcome. Rows correspond to NMA risk ratios of each treatment versus placebo (separated for mixed and indirect evidence) and the columns correspond to direct meta‐analysis risk ratios. The last row shows the number of included direct comparisons. The names of the treatment comparisons are shown in the first column. For example, for relapses over 12 months, information for the network estimate of interferon beta 1a (Avonex) versus placebo is derived from both direct and indirect evidence (generating a mixed estimate). Of this mixed network estimate, trials directly comparing interferon beta 1a (Avonex) versus placebo contribute 31.2% of the information to the network estimate of effect and trials directly comparing interferon beta 1a (Rebif) versus interferon beta 1a (Avonex) contribute 18.8% of the network estimated effect, etc. The contribution matrix shows how much each direct comparison in the network contributes to each network (mixed or indirect) estimate and to the entire network.

Contribution matrix: percentage contribution of each direct estimate to the NMA estimates versus placebo for relapses over 24 months outcome.

Contribution matrix: percentage contribution of each direct estimate to the NMA estimates versus placebo for disability worsening over 24 months outcome.

Comparison 1 Treatment benefit within pairwise comparisons, Outcome 1 Comparisons for relapses over 12 months.
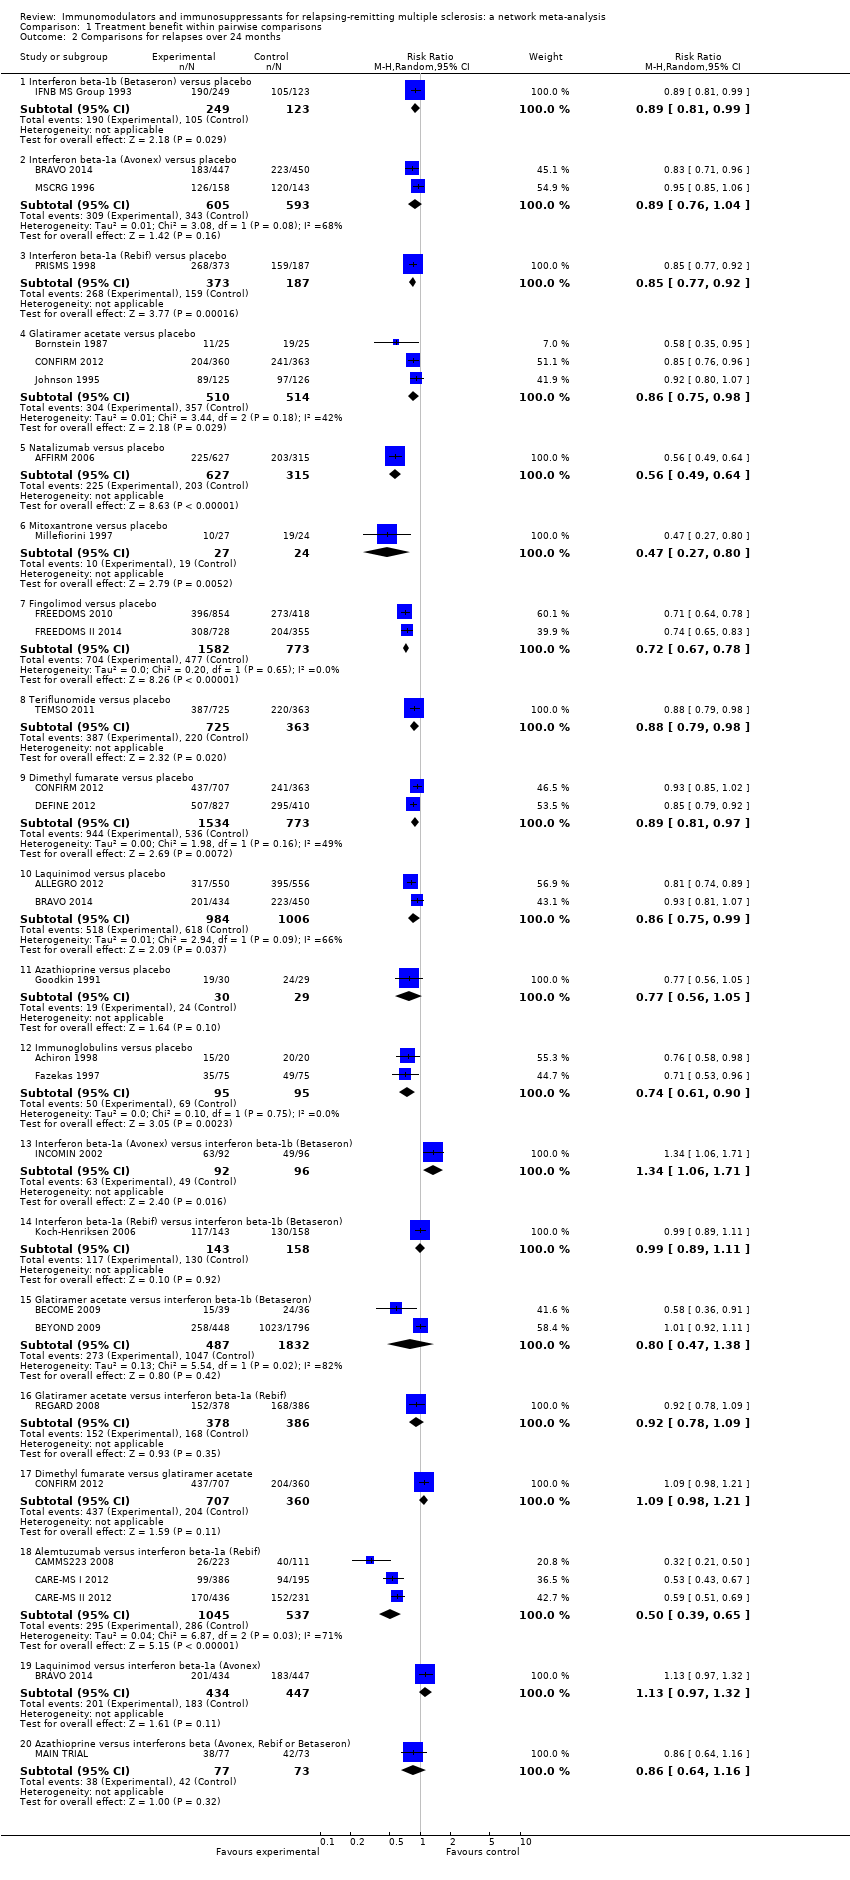
Comparison 1 Treatment benefit within pairwise comparisons, Outcome 2 Comparisons for relapses over 24 months.
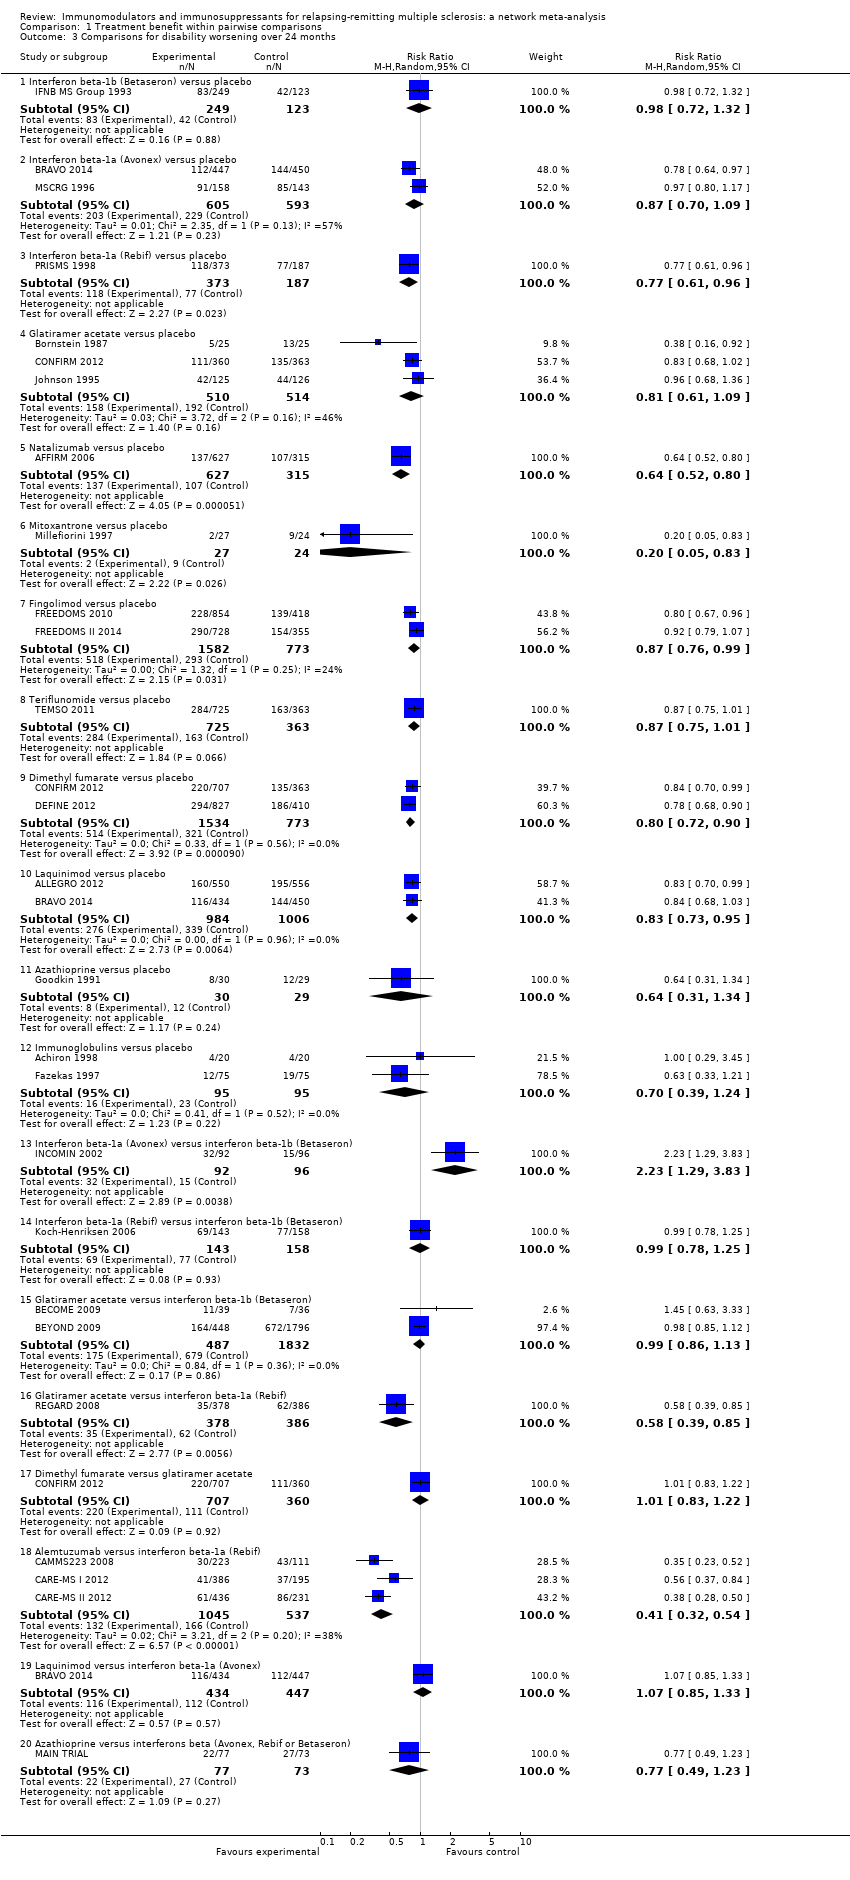
Comparison 1 Treatment benefit within pairwise comparisons, Outcome 3 Comparisons for disability worsening over 24 months.

Comparison 2 Treatment acceptability within pairwise comparisons, Outcome 1 Comparisons for treatment discontinuation due to AEs over 12 months.

Comparison 2 Treatment acceptability within pairwise comparisons, Outcome 2 Comparisons for treatment discontinuation due to AEs over 24 months.

Comparison 3 Treatment safety against placebo within pairwise comparisons, Outcome 1 Serious adverse events.
| Patient or population: patients with relapsing‐remitting multiple sclerosis (RRMS) Settings: secondary healthcare centres Intervention: any immunomodulators or immunosuppressants used for RRMS Comparison: placebo | |||||||
| Intervention | Illustrative comparative risks* | Relative effect | SUCRA | No of participants | Confidence in the evidence | Reasons for downgrading | |
| Assumed risk with placebo | Corresponding risk with intervention | ||||||
| CHANCE OF EXPERIENCING ONE OR MORE RELAPSES OVER 12 MONTHS | |||||||
| Alemtuzumab | Low | RR 0.40 (0.31 to 0.51) | 97% | — | Moderate | Downgraded one level due to risk of bias ‐ the majority of studies at high or unclear risk of bias in allocation concealment and/or blinding of outcome assessor domains | |
| 41 per 100 | 16 per 100 | ||||||
| High | |||||||
| 89 per 100 | 36 per 100 | ||||||
| Mitoxantrone | Low | RR 0.40 (0.20 to 0.76) | 93% | 51 | Low | Downgraded two levels due to risk of bias ‐ the singular study contributing to this estimate at high risk of bias in blinding of outcome assessor domain | |
| 41 per 100 | 16 per 100 | ||||||
| High | |||||||
| 89 per 100 | 36 per 100 | ||||||
| Natalizumab | Low | RR 0.56 (0.43 to 0.73) | 85% | 942 | High | — | |
| 41 per 100 | 23 per 100 | ||||||
| High | |||||||
| 89 per 100 | 50 per 100 | ||||||
| Fingolimod | Low | RR 0.63 (0.53 to 0.74) | 80% | 2355 | Low | Downgraded one level due to risk of bias and one level due to inconsistency ‐ the majority of studies at high or unclear risk of bias in allocation concealment and/or blinding of outcome assessor domains; I2 = 82% (P value = 0.02) | |
| 41 per 100 | 26 per 100 | ||||||
| High | |||||||
| 89 per 100 | 56 per 100 | ||||||
| Dimethyl fumarate | Low | RR 0.78 (0.65 to 0.93) | 55% | 2307 | Moderate | Downgraded one level due to inconsistency ‐ wide predictive interval | |
| 41 per 100 | 32 per 100 | ||||||
| High | |||||||
| 89 per 100 | 69 per 100 | ||||||
| Immunoglobulins | Low | RR 0.78 (0.61 to 1.00) | 53% | 219 | Very low | Downgraded one level due to risk of bias, two levels due to inconsistency, and one level due to imprecision ‐ the majority of studies at unclear risk of bias in allocation concealment and/or blinding of outcome assessor domains; I2 = 83% (P value = 0.003) and differences between pairwise and common τ2 (0.18 versus 0.01); wide CIs | |
| 41 per 100 | 32 per 100 | ||||||
| High | |||||||
| 89 per 100 | 69 per 100 | ||||||
| Glatiramer acetate | Low | RR 0.80 (0.68 to 0.93) | 52% | 2416 | Moderate | Downgraded one level due to inconsistency ‐ wide predictive interval | |
| 41 per 100 | 33 per 100 | ||||||
| High | |||||||
| 89 per 100 | 71 per 100 | ||||||
| Daclizumab | Low | RR 0.79 (0.61 to 1.02) | 52% | 621 | Moderate | Downgraded one level due to imprecision ‐ wide CIs | |
| 41 per 100 | 32 per 100 | ||||||
| High | |||||||
| 89 per 100 | 70 per 100 | ||||||
| Teriflunomide | Low | RR 0.84 (0.72 to 0.99) | 42% | 2257 | Low | Downgraded one level due to risk of bias and one level due to inconsistency ‐ the majority of studies at unclear risk of bias in allocation concealment and/or blinding of outcome assessor domains; wide predictive interval | |
| 41 per 100 | 34 per 100 | ||||||
| High | |||||||
| 89 per 100 | 75 per 100 | ||||||
| Azathioprine | Low | RR 0.87 (0.58 to 1.31) | 39% | 59 | Very low | Downgraded one level due to risk of bias, one level due to indirectness, and two levels due to imprecision ‐ the singular study contributing to this estimate at unclear risk of bias in allocation concealment domain; indirectness of population (one monocentric study); wide CIs | |
| 41 per 100 | 36 per 100 | ||||||
| High | |||||||
| 89 per 100 | 77 per 100 | ||||||
| Interferon beta‐1a (Rebif) | Low | RR 0.87 (0.76 to 1.01) | 36% | 853 | Low | Downgraded one level due to risk of bias and one level due to inconsistency ‐ the majority of studies at high or unclear risk of bias in allocation concealment and/or blinding of outcome assessor domains; I2 = 88% (P value = 0.004) | |
| 41 per 100 | 36 per 100 | ||||||
| High | |||||||
| 89 per 100 | 77 per 100 | ||||||
| Pegylated interferon beta‐1a | Low | RR 0.89 (0.70 to 1.13) | 33% | 1512 | Low | Downgraded one level due to risk of bias and one level due to imprecision ‐ the singular study contributing to this estimate at unclear risk of bias in blinding of outcome assessor domain; wide CIs | |
| 41 per 100 | 36 per 100 | ||||||
| High | |||||||
| 89 per 100 | 79 per 100 | ||||||
| Interferon beta‐1b (Betaseron) | Low | RR 0.98 (0.54 to 1.75) | 27% | — | Very low | Downgraded one level due to risk of bias and two levels due to imprecision ‐ the majority of studies at unclear risk of bias in allocation concealment and/or blinding of outcome assessor domains; wide CIs | |
| 41 per 100 | 40 per 100 | ||||||
| High | |||||||
| 89 per 100 | 87 per 100 | ||||||
| Interferon beta‐1a (Avonex) | Low | RR 0.93 (0.78 to 1.10) | 25% | 301 | Moderate | Downgraded one level due to risk of bias ‐ the majority of studies at high or unclear risk of bias in allocation concealment and/or blinding of outcome assessor domains | |
| 41 per 100 | 38 per 100 | ||||||
| High | |||||||
| 89 per 100 | 83 per 100 | ||||||
| Interferons beta (Avonex, Rebif or Betaseron) | Low | RR 1.05 (0.61 to 1.79) | 20% | — | Very low | Downgraded one level due to risk of bias, one level due to indirectness, and two levels due to imprecision ‐ the majority of studies at high or unclear risk of bias in allocation concealment and/or blinding of outcome assessor domains; indirectness of population (one monocentric study contributing 50% to this estimate); wide CIs | |
| 41 per 100 | 43 per 100 | ||||||
| High | |||||||
| 89 per 100 | 93 per 100 | ||||||
| CHANCE OF EXPERIENCING ONE OR MORE RELAPSES OVER 24 MONTHS | |||||||
| Alemtuzumab | Low | RR 0.46 (0.38 to 0.55) | 96% | — | Moderate | Downgraded one level due to risk of bias ‐ the majority of studies at high or unclear risk of bias in allocation concealment and/or blinding of outcome assessor domains | |
| 57 per 100 | 26 per 100 | ||||||
| High | |||||||
| 85 per 100 | 39 per 100 | ||||||
| Mitoxantrone | Low | RR 0.47 (0.27 to 0.81) | 92% | 51 | Very low | Downgraded two levels due to risk of bias and one level due to inconsistency ‐ the singular study contributing to this estimate at high risk of bias in blinding of outcome assessor domain; wide predictive interval | |
| 57 per 100 | 27 per 100 | ||||||
| High | |||||||
| 85 per 100 | 40 per 100 | ||||||
| Natalizumab | Low | RR 0.56 (0.47 to 0.66) | 88% | 942 | High | — | |
| 57 per 100 | 32 per 100 | ||||||
| High | |||||||
| 85 per 100 | 48 per 100 | ||||||
| Fingolimod | Low | RR 0.72 (0.64 to 0.81) | 71% | 2355 | Moderate | Downgraded one level due to risk of bias ‐ studies at unclear risk of bias in allocation concealment domain | |
| 57 per 100 | 41 per 100 | ||||||
| High | |||||||
| 85 per 100 | 61 per 100 | ||||||
| Immunoglobulins | Low | RR 0.74 (0.60 to 0.91) | 66% | 190 | Moderate | Downgraded one level due to inconsistency ‐ wide predictive interval | |
| 57 per 100 | 42 per 100 | ||||||
| High | |||||||
| 85 per 100 | 63 per 100 | ||||||
| Azathioprine | Low | RR 0.77 (0.55 to 1.07) | 57% | 59 | Very low | Downgraded one level due to risk of bias, one level due to indirectness, and one level due to imprecision ‐ the singular study contributing to this estimate at unclear risk of bias in allocation concealment domain; indirectness of population (one monocentric study); wide CIs | |
| 57 per 100 | 44 per 100 | ||||||
| High | |||||||
| 85 per 100 | 65 per 100 | ||||||
| Glatiramer acetate | Low | RR 0.83 (0.75 to 0.91) | 48% | 1024 | Moderate | Downgraded one level due to inconsistency ‐ wide predictive interval | |
| 57 per 100 | 47 per 100 | ||||||
| High | |||||||
| 85 per 100 | 71 per 100 | ||||||
| Interferon beta‐1b (Betaseron) | Low | RR 0.85 (0.77 to 0.94) | 42% | 372 | Very low | Downgraded one level due to risk of bias and two levels due to inconsistency ‐ the majority of studies at high or unclear risk of bias in allocation concealment and/or blinding of outcome assessor domains; wide predictive interval and inconsistent loops of evidence | |
| 57 per 100 | 48 per 100 | ||||||
| High | |||||||
| 85 per 100 | 72 per 100 | ||||||
| Interferon beta‐1a (Rebif) | Low | RR 0.86 (0.77 to 0.95) | 39% | 560 | Low | Downgraded one level due to risk of bias and one level due to inconsistency ‐ the majority of studies at high or unclear risk of bias in allocation concealment and/or blinding of outcome assessor domains; wide predictive interval | |
| 57 per 100 | 49 per 100 | ||||||
| High | |||||||
| 85 per 100 | 73 per 100 | ||||||
| Interferons beta (Avonex, Rebif or Betaseron) | Low | RR 0.89 (0.56 to 1.42) | 33% | — | Very low | Downgraded one level due to risk of bias, one level due to indirectness, and one level due to imprecision ‐ the majority of studies at high or unclear risk of bias in allocation concealment and/or blinding of outcome assessor domains; indirectness of population (one monocentric study contributing for 50% to this estimate); wide CIs | |
| 57 per 100 | 51 per 100 | ||||||
| High | |||||||
| 85 per 100 | 76 per 100 | ||||||
| Teriflunomide | Low | RR 0.88 (0.75 to 1.03) | 32% | 1088 | Very low | Downgraded two levels due to risk of bias and one level due to imprecision ‐ the singular study contributing to this estimate at high risk of bias in blinding of outcome assessor domain; wide CIs | |
| 57 per 100 | 50 per 100 | ||||||
| High | |||||||
| 85 per 100 | 75 per 100 | ||||||
| Laquinimod | Low | RR 0.88 (0.79 to 0.99) | 31% | 1990 | Very low | Downgraded one level due to risk of bias and two levels due to inconsistency ‐ the majority of studies at high or unclear risk of bias in allocation concealment and/or blinding of outcome assessor domains; I2 = 66% (P value = 0.09), wide predictive interval and inconsistent loops of evidence | |
| 57 per 100 | 50 per 100 | ||||||
| High | |||||||
| 85 per 100 | 75 per 100 | ||||||
| Dimethyl fumarate | Low | RR 0.89 (0.81 to 0.98) | 30% | 2307 | Moderate | Downgraded one level due to inconsistency ‐ wide predictive interval | |
| 57 per 100 | 51 per 100 | ||||||
| High | |||||||
| 85 per 100 | 76 per 100 | ||||||
| Interferon beta‐1a (Avonex) | Low | RR 0.91 (0.82 to 1.02) | 22% | 1198 | Low | Downgraded one level due to risk of bias and one level due to inconsistency ‐ the majority of studies at high or unclear risk of bias in allocation concealment and/or blinding of outcome assessor domains; inconsistent loops of evidence | |
| 57 per 100 | 52 per 100 | ||||||
| High | |||||||
| 85 per 100 | 77 per 100 | ||||||
| CHANCE OF DISABILITY GETTING WORSE OVER 24 MONTHS | |||||||
| Mitoxantrone | Low | RR 0.20 (0.05 to 0.84) | 96% | 51 | Low | Downgraded one level due to indirectness and one level due to inconsistency ‐ surrogate outcome unclear; wide predictive interval | |
| 25 per 100 | 5 per 100 | ||||||
| High | |||||||
| 52 per 100 | 10 per 100 | ||||||
| Alemtuzumab | Low | RR 0.35 (0.26 to 0.48) | 94% | — | Low | Downgraded one level due to risk of bias and one level due to indirectness ‐ the majority of studies at high or unclear risk of bias in allocation concealment and/or blinding of outcome assessor domains; surrogate outcome in the majority of studies contributing to this estimate | |
| 25 per 100 | 9 per 100 | ||||||
| High | |||||||
| 52 per 100 | 18 per 100 | ||||||
| Natalizumab | Low | RR 0.64 (0.49 to 0.85) | 74% | 942 | Moderate | Downgraded one level due to indirectness ‐ surrogate outcome | |
| 25 per 100 | 16 per 100 | ||||||
| High | |||||||
| 52 per 100 | 33 per 100 | ||||||
| Azathioprine | Low | RR 0.64 (0.30 to 1.37) | 64% | 59 | Very low | Downgraded one level due to risk of bias, two levels due to indirectness, and two levels due to imprecision ‐ the singular study contributing to this estimate at unclear risk of bias in allocation concealment domain; indirectness of population (one monocentric study) and surrogate outcome unclear; wide CIs | |
| 25 per 100 | 16 per 100 | ||||||
| High | |||||||
| 52 per 100 | 33 per 100 | ||||||
| Glatiramer acetate | Low | RR 0.77 (0.64 to 0.92) | 58% | 1024 | Very low | Downgraded one level due to indirectness and two levels due to inconsistency ‐ surrogate outcome in the majority of studies contributing to this estimate; wide predictive interval and inconsistent loops of evidence | |
| 25 per 100 | 19 per 100 | ||||||
| High | |||||||
| 52 per 100 | 40 per 100 | ||||||
| Immunoglobulins | Low | RR 0.70 (0.39 to 1.27) | 56% | 190 | Very low | Downgraded one level due to indirectness, one level due to inconsistency, and two levels due to imprecision ‐ surrogate outcome in the majority of studies contributing to this estimate; wide predictive interval; wide CIs | |
| 25 per 100 | 18 per 100 | ||||||
| High | |||||||
| 52 per 100 | 36 per 100 | ||||||
| Interferon beta‐1b (Betaseron) | Low | RR 0.79 (0.65 to 0.97) | 51% | 372 | Very low | Downgraded one level due to risk of bias, one level due to indirectness, and two levels due to inconsistency ‐ the majority of studies at high or unclear risk of bias in allocation concealment and/or blinding of outcome assessor domains; surrogate outcome in the majority of studies contributing to this estimate; wide predictive interval and inconsistent loops of evidence | |
| 25 per 100 | 20 per 100 | ||||||
| High | |||||||
| 52 per 100 | 41 per 100 | ||||||
| Dimethyl fumarate | Low | RR 0.80 (0.67 to 0.94) | 50% | 2307 | Low | Downgraded one level due to indirectness and one level due to inconsistency ‐ surrogate outcome in the majority of studies contributing to this estimate; wide predictive interval | |
| 25 per 100 | 20 per 100 | ||||||
| High | |||||||
| 52 per 100 | 42 per 100 | ||||||
| Interferons beta (Avonex, Rebif or Betaseron) | Low | RR 0.83 (0.34 to 2.07) | 40% | — | Very low | Downgraded one level due to indirectness, one level due to inconsistency, and two levels due to imprecision ‐ indirectness of population and surrogate outcome unclear (one study contributing for 50% to this estimate); wide predictive interval; wide CIs | |
| 25 per 100 | 21 per 100 | ||||||
| High | |||||||
| 52 per 100 | 43 per 100 | ||||||
| Interferon beta‐1a (Rebif) | Low | RR 0.86 (0.69 to 1.06) | 36% | 560 | Very low | Downgraded one level due to risk of bias, one level due to indirectness, one level due to inconsistency, and one level due to imprecision ‐ the majority of studies at high or unclear risk of bias in allocation concealment and/or blinding of outcome assessor domains; surrogate outcome in the majority of studies contributing to this estimate; inconsistent loops of evidence; wide CIs | |
| 25 per 100 | 22 per 100 | ||||||
| High | |||||||
| 52 per 100 | 45 per 100 | ||||||
| Fingolimod | Low | RR 0.86 (0.73 to 1.03) | 34% | 2355 | Very low | Downgraded one level due to risk of bias, one level due to indirectness, and one level due to imprecision ‐ studies at unclear risk of bias in allocation concealment domain; surrogate outcome; wide CIs | |
| 25 per 100 | 22 per 100 | ||||||
| High | |||||||
| 52 per 100 | 45 per 100 | ||||||
| Laquinimod | Low | RR 0.87 (0.72 to 1.04) | 34% | 1990 | Low | Downgraded one level due to indirectness and one level due to imprecision ‐ surrogate outcome in the majority of studies contributing to this estimate; wide CIs | |
| 25 per 100 | 22 per 100 | ||||||
| High | |||||||
| 52 per 100 | 45 per 100 | ||||||
| Teriflunomide | Low | RR 0.87 (0.69 to 1.10) | 34% | 1088 | Low | Downgraded one level due to indirectness and one level due to imprecision ‐ surrogate outcome; wide CIs | |
| 25 per 100 | 22 per 100 | ||||||
| High | |||||||
| 52 per 100 | 45 per 100 | ||||||
| Interferon beta‐1a (Avonex) | Low | RR 0.93 (0.77 to 1.13) | 21% | 1198 | Very low | Downgraded one level due to risk of bias, one level due to indirectness, and two levels due to inconsistency ‐ the majority of studies at high or unclear risk of bias in allocation concealment and/or blinding of outcome assessor domains; surrogate outcome in the majority of studies contributing to this estimate; I2 = 57% (P value = 0.13), and inconsistent loops of evidence | |
| 25 per 100 | 23 per 100 | ||||||
| High | |||||||
| 52 per 100 | 48 per 100 | ||||||
| *The corresponding risk with intervention (and its 95% confidence interval) is based on the assumed risk with placebo and the relative effect of the intervention (and its 95% CI). Two values were chosen for the assumed risk with placebo, i.e. the second highest and second lowest placebo group risks in the included studies, defined as low and high assumed risk. #No of Participants (studies) is not available when the nature of the evidence is indirect. °We did not downgrade for reasons of reporting bias as insufficient studies contributed to network treatment estimates to draw meaningful conclusions. | |||||||
| GRADE Working Group grades of evidence | |||||||
| Study | Risk of bias | Did the researchers actively monitor for adverse events (AEs) or did they simply provide spontaneous reporting of AEs that arose? | Risk of bias | Did the authors define serious AEs (SAEs) according to an accepted international classification and report the number of SAEs? |
| Unclear | Not reported | High | SAEs not reported | |
| Unclear | Not reported | Low | Categorisation of SAEs conformed to ICH guidelines (International Conference on Harmonisation of Technical Requirements for Registration of Pharmaceuticals for Human Use) | |
| Low | "Treating neurologists were responsible for all aspects of patient care, including the management of adverse events". Participants"visited the clinic every 12 weeks for ... blood chemical and hematologic analyses, evaluation of adverse events..." (Page 901) | Unclear | Insufficient information on SAEs definition | |
| Low | "Safety assessments were performed at screening, at baseline, and every 3 months until month 24" (Page 1002) | Low | Categorisation of SAEs conformed to ICH guidelines (International Conference on Harmonisation of Technical Requirements for Registration of Pharmaceuticals for Human Use) | |
| Low | "After the initial interim analysis failed to raise any safety concerns with the use of monthly triple dose gadolinium, all patients still in the study were offered the option of obtaining additional monthly MRI scans for a second year of treatment" (Page 1977) | High | SAEs not reported | |
| Low | "Clinic visits were scheduled every 3 months to assess ... safety, and tolerability. The occurrence of new neurological symptoms and adverse events was assessed by telephone, 6 weeks after each visit" (Page 891) | Low | Categorisation of SAEs conformed to ICH guidelines (International Conference on Harmonisation of Technical Requirements for Registration of Pharmaceuticals for Human Use) | |
| High | "Self‐evaluation reported to a clinical assistant" (Page 409) | High | SAEs not reported | |
| Low | "Patients were evaluated at 12 scheduled visits: months ‐1 (screening), 0 (baseline), 1, 2, 3, 6, 9, 12, 15, 18, 21, and 24. Safety assessments (laboratory measures, vital signs) were performed at all visits, and electrocardiograms (ECGs) were performed at months ‐1, 0, 1, 2, 3, 6, 12, 18, and 24/early termination" (Page 775) | Unclear | Insufficient information on SAEs definition | |
| Low | "Safety was assessed quarterly by the treating neurologist, who was aware of study‐group assignment" (Page 1787), "Thyroid function and levels of antithyrotropinreceptor antibodies and lymphocyte subpopulations were measured quarterly at a central laboratory", and "All adverse events with an onset up to 36 months are reported. In addition, all serious adverse events and autoimmune‐associated disorders occurring before March 1, 2008, are listed" (Page 1788) | Low | Categorisation of SAEs conformed to ICH guidelines (International Conference on Harmonisation of Technical Requirements for Registration of Pharmaceuticals for Human Use) | |
| Low | "To assess safety, we undertook monthly questionnaire follow‐up of patients, and did complete blood counts, serum creatinine, urinalysis, and microscopy monthly (every three months in patients in the interferon beta 1a group), and thyroid function tests every 3 months", "Circulating lymphocyte subsets were assessed every 3 months in all patients and 1 month after alemtuzumab administration. We screened for antialemtuzumab antibodies with a bridging ELISA before and at 1 month, 3 months, and 12 months after each dosing", and "We measured interferon beta 1a‐neutralising antibodies at baseline and at 24 months with a cytopathic effect inhibition assay" (Page 1821) | Low | Categorisation of SAEs conformed to ICH guidelines (International Conference on Harmonisation of Technical Requirements for Registration of Pharmaceuticals for Human Use). | |
| Low | "To assess safety, we undertook monthly questionnaire follow‐up of patients, and did complete blood counts, serum creatinine, and urinalysis with microscopy monthly (every 3 months in patients in the interferon beta 1a group), and thyroid function tests every 3 months", "We assessed circulating lymphocyte subsets every 3 months in all patients and 1 month after every course of alemtuzumab. We screened for anti‐alemtuzumab antibodies with ELISA before and at 1 month, 3 months and 12 months after each dosing", and "We measured interferon beta 1a‐neutralising antibodies at baseline and at 24 months with a cytopathic effect inhibition assay" (Page 1832) | Low | Categorisation of SAEs conformed to ICH guidelines (International Conference on Harmonisation of Technical Requirements for Registration of Pharmaceuticals for Human Use) | |
| Low | "Safety was assessed by recording all adverse events, serious and nonserious" (Page 329) | Unclear | No information on SAE definition | |
| Unclear | "The treating physician monitored safety..." (Page 291) | Unclear | Insufficient information on SAEs definition | |
| Low | "Throughout the course of the study, every effort was made to remain alert to possible adverse events (AEs)" and "Any AE or SAE experienced by the subject was recorded on the CRF, regardless of the severity of the event or its relationship to study treatment" (Pages 66‐7 of Protocol) | Low | Categorisation of SAEs conformed to ICH guidelines (International Conference on Harmonisation of Technical Requirements for Registration of Pharmaceuticals for Human Use) | |
| Low | "Study visits were scheduled every 4 weeks for safety assessments, including the monitoring of laboratory values" (Page 1100) | Low | Categorisation of SAEs conformed to ICH guidelines (International Conference on Harmonisation of Technical Requirements for Registration of Pharmaceuticals for Human Use) | |
| Low | "Adverse events, vital signs and blood tests were monitored monthly" (Page 1724) | High | SAEs not reported | |
| High | "Adverse events were determined by spontaneous reporting and monthly laboratory testing during the comparative phase" (Page 2031) | Unclear | Insufficient information on SAEs definition | |
| Low | Participants "asked about safety monthly..." (Page 590) | High | SAEs not reported | |
| Unclear | Not reported | Unclear | Insufficient information on SAEs definition | |
| Low | "An independent data and safety monitoring board evaluated the safety" and "Study visits, including safety assessments, were scheduled at 2 weeks and 1, 2, 3, 6, 9, 12, 15, 18, 21, and 24 months after randomization" (Page 389) | Low | Categorisation of SAEs conformed to ICH guidelines (International Conference on Harmonisation of Technical Requirements for Registration of Pharmaceuticals for Human Use) | |
| Low | "...safety assessments, were scheduled at 2 weeks and 1, 2, 3, 6, 9, 12, 15, 18, 21, and 24 months after randomization" (Appendix, Page 2) | Low | Categorisation of SAEs conformed to ICH guidelines (International Conference on Harmonisation of Technical Requirements for Registration of Pharmaceuticals for Human Use) | |
| Low | "Safety assessments included adverse events (AEs), standard clinical laboratory tests, vital signs, and electrocardiographic (ECG) measurements" (Page 707) | Unclear | No information on SAE definition | |
| High | "Side effect were reported to the treating neurologist every 6 months" (Page 21) | High | SAEs not reported | |
| Low | "Treating neurologist reviewed side effects, laboratory findings for toxicity ..." (Page 656) | High | SAEs not reported | |
| Low | "Safety assessments included adverse events, vital signs, physical examination, and concomitant medications. Patients underwent haematology and biochemical tests, including liver‐function tests, every 2 weeks for the first 8 weeks, and then every 3 months" (Page 1455) | High | SAEs not reported | |
| Low | "The evaluating physician monitored safety every 3 month..." (Page 1270) | Unclear | Insufficient information on SAEs definition | |
| Low | "Patients were interviewed about side effects and had routine blood tests including hematology and liver function tests every 3 months and thyroid tests and neutralizing antibodies every 6 months" (Page 1057) | High | SAEs not reported | |
| Unclear | "Laboratory safety examinations were made at the beginning and at the end of the study period" (Page 566) | Unclear | Insufficient information on SAEs definition | |
| Low | "At scheduled (quarterly) and unscheduled (i.e., at the onset of new symptoms or complications) follow‐up visits the treating neurologist recorded symptoms, blood test results, clinical AEs and their management" | Low | Categorisation of SAEs conformed to ICH guidelines (International Conference on Harmonisation of Technical Requirements for Registration of Pharmaceuticals for Human Use) | |
| Low | "The safety of the treatment was assessed on the basis of adverse events volunteered by the patient either spontaneously or on questioning and monitoring of the main laboratory parameters" (Page 155) | Unclear | Insufficient information on SAEs definition | |
| Low | "Study visits were scheduled at baseline and every 6 months. Treating physicians reviewed toxicity test results, examined patients, and made all medical decision" (Page 286) | Unclear | Insufficient information on SAEs definition | |
| Unclear | "The treating physician recorded and treated AEs..." (Page 680) | Unclear | Insufficient information on SAEs definition | |
| Unclear | "A “treating” neurologist was responsible for overall medical management of the patient, including treatment of any side‐effects" (Page 1499) | Unclear | Insufficient information on SAEs definition | |
| Unclear | "Adverse events (including pregnancy), withdrawals owing to adverse events, serious adverse events, and laboratory results were obtained for safety comparisons" (Page 905) | Unclear | Insufficient information on SAEs definition | |
| Low | "Safety parameters were assessed at all visits" (Page 2168) | Unclear | No information on SAE definition | |
| Low | "A treating neurologist at each site was responsible for recording and managing adverse events and monitoring safety assessments" and "Safety was evaluated on the basis of adverse events reported by study participants or investigators. Laboratory tests were performed at the time of screening, at baseline, every 2 weeks for the first 24 weeks, and then every 6 weeks until study completion. Physical and neurologic examinations were performed at week 12 and then every 24 weeks. An abdominal ultrasonographic examination to asses for pancreatic abnormalities was performed before the study and then every 24 weeks, because of previous infrequent reports of pancreatitis associated with leflunomide use" (Pages 1294‐5) | Low | Categorisation of SAEs conformed to ICH guidelines (International Conference on Harmonisation of Technical Requirements for Registration of Pharmaceuticals for Human Use) | |
| Low | "Safety and tolerability were assessed using AE reporting, vital signs and laboratory assessments. Adverse event reports were collected at randomisation, Weeks 2, 6, 12, 18, 24, 36 and every 12 weeks thereafter. Vital signs were documented at screening, randomisation and every 12 weeks thereafter; clinical laboratory results were assessed throughout the study. Adverse events and vital signs were also recorded during unscheduled relapse visits" (Page 707) | Low | Categorisation of SAEs conformed to ICH guidelines (International Conference on Harmonisation of Technical Requirements for Registration of Pharmaceuticals for Human Use) [information provided on request by Genzyme] | |
| Low | "Safety was assessed through adverse event reporting (upon occurrence), clinical laboratory tests (every 2 weeks until week 24, then every 6 weeks while still on treatment), vital signs (at weeks 2 and 6, then every 6 weeks until week 24, then every 12 weeks while still on treatment), abdominal ultrasonography (at week 24, then every 24 weeks), and electrocardiography (at baseline and end of treatment)" (Page 248) | Low | Categorisation of SAEs conformed to ICH guidelines (International Conference on Harmonisation of Technical Requirements for Registration of Pharmaceuticals for Human Use) | |
| Low | "An independent data and safety monitoring board evaluated overall safety in the fingolimod phase 3 program" and "Safety assessments were conducted during screening, at baseline, and at months 1, 2, 3, 6, 9, and 12" (Page 404) | Low | Categorisation of SAEs conformed to ICH guidelines (International Conference on Harmonisation of Technical Requirements for Registration of Pharmaceuticals for Human Use) |
| Intervention | Subgroup analysis by | |||||||
| Diagnostic criteria | Previous treatments RR (95% CI) | Definition of relapse RR (95% CI) | Pre‐trial relapse rate RR (95% CI) | |||||
| Poser criteria | McDonald criteria | No | Yes | 24‐hour definition | 48‐hour definition | ≥ 1 during the year before randomisation | ≥ 2 during the 2/3 years before randomisation | |
| Alemtuzumab | — | 0.48 (0.33 to 0.68) | 0.46 (0.28 to 0.76) | 0.47 (0.27 to 0.79) | — | 0.46 (0.27 to 0.78) | 0.63 (0.48 to 0.81) | 0.28 (0.16 to 0.49) |
| Natalizumab | — | 0.56 (0.45 to 0.69) | — | 0.70 (0.56 to 0.88) | 0.63 (0.52 to 0.77) | — | 0.68 (0.54 to 0.85) | — |
| Fingolimod | — | 0.72 (0.63 to 0.83) | — | 0.72 (0.65 to 0.80) | 0.81 (0.67 to 0.97) | — | — | 0.72 (0.60 to 0.87) |
| CI: confidence interval; NMA: network meta‐analysis; RR: risk ratio. | ||||||||
| Intervention | Sensitivity analysis | ||
| Including only trials of low risk of bias | Excluding studies that did not provide complete and clear reporting of dropout data RR (95% CI) | Excluding trials with a total sample size of fewer than 50 randomised participants RR (95% CI) | |
| Alemtuzumab | — | 0.47 (0.35 to 0.63) | 0.46 (0.39 to 0.56) |
| Natalizumab | 0.66 (0.54 to 0.81) | — | 0.56 (0.47 to 0.66) |
| Fingolimod | — | 0.72 (0.65 to 0.80) | 0.72 (0.64 to 0.81) |
| CI: confidence interval; NMA: network meta‐analysis; RR: risk ratio. | |||
| Outcome or subgroup title | No. of studies | No. of participants | Statistical method | Effect size |
| 1 Comparisons for relapses over 12 months Show forest plot | 29 | Risk Ratio (M‐H, Random, 95% CI) | Subtotals only | |
| 1.1 Interferon beta‐1a (Avonex) versus placebo | 1 | 301 | Risk Ratio (M‐H, Random, 95% CI) | 0.88 [0.73, 1.05] |
| 1.2 Interferon beta‐1a (Rebif) versus placebo | 2 | 853 | Risk Ratio (M‐H, Random, 95% CI) | 0.89 [0.66, 1.19] |
| 1.3 Glatiramer acetate versus placebo | 4 | 2416 | Risk Ratio (M‐H, Random, 95% CI) | 0.79 [0.66, 0.95] |
| 1.4 Natalizumab versus placebo | 1 | 942 | Risk Ratio (M‐H, Random, 95% CI) | 0.56 [0.47, 0.66] |
| 1.5 Mitoxantrone versus placebo | 1 | 51 | Risk Ratio (M‐H, Random, 95% CI) | 0.40 [0.21, 0.74] |
| 1.6 Fingolimod versus placebo | 2 | 2355 | Risk Ratio (M‐H, Random, 95% CI) | 0.63 [0.48, 0.82] |
| 1.7 Teriflunomide versus placebo | 2 | 2257 | Risk Ratio (M‐H, Random, 95% CI) | 0.86 [0.78, 0.95] |
| 1.8 Dimethyl fumarate versus placebo | 2 | 2307 | Risk Ratio (M‐H, Random, 95% CI) | 0.79 [0.71, 0.88] |
| 1.9 Pegylated interferon beta‐1a versus placebo | 1 | 1512 | Risk Ratio (M‐H, Random, 95% CI) | 0.89 [0.78, 1.01] |
| 1.10 Daclizumab versus placebo | 1 | 621 | Risk Ratio (M‐H, Random, 95% CI) | 0.79 [0.68, 0.92] |
| 1.11 Azathioprine versus placebo | 1 | 59 | Risk Ratio (M‐H, Random, 95% CI) | 0.87 [0.61, 1.24] |
| 1.12 Immunoglobulins versus placebo | 3 | 219 | Risk Ratio (M‐H, Random, 95% CI) | 0.80 [0.47, 1.36] |
| 1.13 Interferon beta‐1a (Rebif) versus interferon beta‐1a (Avonex) | 1 | 677 | Risk Ratio (M‐H, Random, 95% CI) | 0.91 [0.80, 1.03] |
| 1.14 Glatiramer acetate versus interferon beta‐1b (Betaseron) | 1 | 75 | Risk Ratio (M‐H, Random, 95% CI) | 0.81 [0.48, 1.38] |
| 1.15 Azathioprine versus interferons beta (Avonex, Rebif or Betaseron) | 2 | 244 | Risk Ratio (M‐H, Random, 95% CI) | 0.81 [0.49, 1.33] |
| 1.16 Fingolimod versus interferon beta‐1a (Avonex) | 1 | 1292 | Risk Ratio (M‐H, Random, 95% CI) | 0.67 [0.57, 0.79] |
| 1.17 Teriflunomide versus interferon beta‐1a (Rebif) | 1 | 324 | Risk Ratio (M‐H, Random, 95% CI) | 0.91 [0.69, 1.18] |
| 1.18 Dimethyl fumarate versus glatiramer acetate | 1 | 1067 | Risk Ratio (M‐H, Random, 95% CI) | 0.96 [0.80, 1.14] |
| 1.19 Alemtuzumab versus interferon beta‐1a (Rebif) | 3 | 1582 | Risk Ratio (M‐H, Random, 95% CI) | 0.46 [0.39, 0.55] |
| 2 Comparisons for relapses over 24 months Show forest plot | 26 | Risk Ratio (M‐H, Random, 95% CI) | Subtotals only | |
| 2.1 Interferon beta‐1b (Betaseron) versus placebo | 1 | 372 | Risk Ratio (M‐H, Random, 95% CI) | 0.89 [0.81, 0.99] |
| 2.2 Interferon beta‐1a (Avonex) versus placebo | 2 | 1198 | Risk Ratio (M‐H, Random, 95% CI) | 0.89 [0.76, 1.04] |
| 2.3 Interferon beta‐1a (Rebif) versus placebo | 1 | 560 | Risk Ratio (M‐H, Random, 95% CI) | 0.85 [0.77, 0.92] |
| 2.4 Glatiramer acetate versus placebo | 3 | 1024 | Risk Ratio (M‐H, Random, 95% CI) | 0.86 [0.75, 0.98] |
| 2.5 Natalizumab versus placebo | 1 | 942 | Risk Ratio (M‐H, Random, 95% CI) | 0.56 [0.49, 0.64] |
| 2.6 Mitoxantrone versus placebo | 1 | 51 | Risk Ratio (M‐H, Random, 95% CI) | 0.47 [0.27, 0.80] |
| 2.7 Fingolimod versus placebo | 2 | 2355 | Risk Ratio (M‐H, Random, 95% CI) | 0.72 [0.67, 0.78] |
| 2.8 Teriflunomide versus placebo | 1 | 1088 | Risk Ratio (M‐H, Random, 95% CI) | 0.88 [0.79, 0.98] |
| 2.9 Dimethyl fumarate versus placebo | 2 | 2307 | Risk Ratio (M‐H, Random, 95% CI) | 0.89 [0.81, 0.97] |
| 2.10 Laquinimod versus placebo | 2 | 1990 | Risk Ratio (M‐H, Random, 95% CI) | 0.86 [0.75, 0.99] |
| 2.11 Azathioprine versus placebo | 1 | 59 | Risk Ratio (M‐H, Random, 95% CI) | 0.77 [0.56, 1.05] |
| 2.12 Immunoglobulins versus placebo | 2 | 190 | Risk Ratio (M‐H, Random, 95% CI) | 0.74 [0.61, 0.90] |
| 2.13 Interferon beta‐1a (Avonex) versus interferon beta‐1b (Betaseron) | 1 | 188 | Risk Ratio (M‐H, Random, 95% CI) | 1.34 [1.06, 1.71] |
| 2.14 Interferon beta‐1a (Rebif) versus interferon beta‐1b (Betaseron) | 1 | 301 | Risk Ratio (M‐H, Random, 95% CI) | 0.99 [0.89, 1.11] |
| 2.15 Glatiramer acetate versus interferon beta‐1b (Betaseron) | 2 | 2319 | Risk Ratio (M‐H, Random, 95% CI) | 0.80 [0.47, 1.38] |
| 2.16 Glatiramer acetate versus interferon beta‐1a (Rebif) | 1 | 764 | Risk Ratio (M‐H, Random, 95% CI) | 0.92 [0.78, 1.09] |
| 2.17 Dimethyl fumarate versus glatiramer acetate | 1 | 1067 | Risk Ratio (M‐H, Random, 95% CI) | 1.09 [0.98, 1.21] |
| 2.18 Alemtuzumab versus interferon beta‐1a (Rebif) | 3 | 1582 | Risk Ratio (M‐H, Random, 95% CI) | 0.50 [0.39, 0.65] |
| 2.19 Laquinimod versus interferon beta‐1a (Avonex) | 1 | 881 | Risk Ratio (M‐H, Random, 95% CI) | 1.13 [0.97, 1.32] |
| 2.20 Azathioprine versus interferons beta (Avonex, Rebif or Betaseron) | 1 | 150 | Risk Ratio (M‐H, Random, 95% CI) | 0.86 [0.64, 1.16] |
| 3 Comparisons for disability worsening over 24 months Show forest plot | 26 | Risk Ratio (M‐H, Random, 95% CI) | Subtotals only | |
| 3.1 Interferon beta‐1b (Betaseron) versus placebo | 1 | 372 | Risk Ratio (M‐H, Random, 95% CI) | 0.98 [0.72, 1.32] |
| 3.2 Interferon beta‐1a (Avonex) versus placebo | 2 | 1198 | Risk Ratio (M‐H, Random, 95% CI) | 0.87 [0.70, 1.09] |
| 3.3 Interferon beta‐1a (Rebif) versus placebo | 1 | 560 | Risk Ratio (M‐H, Random, 95% CI) | 0.77 [0.61, 0.96] |
| 3.4 Glatiramer acetate versus placebo | 3 | 1024 | Risk Ratio (M‐H, Random, 95% CI) | 0.81 [0.61, 1.09] |
| 3.5 Natalizumab versus placebo | 1 | 942 | Risk Ratio (M‐H, Random, 95% CI) | 0.64 [0.52, 0.80] |
| 3.6 Mitoxantrone versus placebo | 1 | 51 | Risk Ratio (M‐H, Random, 95% CI) | 0.20 [0.05, 0.83] |
| 3.7 Fingolimod versus placebo | 2 | 2355 | Risk Ratio (M‐H, Random, 95% CI) | 0.87 [0.76, 0.99] |
| 3.8 Teriflunomide versus placebo | 1 | 1088 | Risk Ratio (M‐H, Random, 95% CI) | 0.87 [0.75, 1.01] |
| 3.9 Dimethyl fumarate versus placebo | 2 | 2307 | Risk Ratio (M‐H, Random, 95% CI) | 0.80 [0.72, 0.90] |
| 3.10 Laquinimod versus placebo | 2 | 1990 | Risk Ratio (M‐H, Random, 95% CI) | 0.83 [0.73, 0.95] |
| 3.11 Azathioprine versus placebo | 1 | 59 | Risk Ratio (M‐H, Random, 95% CI) | 0.64 [0.31, 1.34] |
| 3.12 Immunoglobulins versus placebo | 2 | 190 | Risk Ratio (M‐H, Random, 95% CI) | 0.70 [0.39, 1.24] |
| 3.13 Interferon beta‐1a (Avonex) versus interferon beta‐1b (Betaseron) | 1 | 188 | Risk Ratio (M‐H, Random, 95% CI) | 2.23 [1.29, 3.83] |
| 3.14 Interferon beta‐1a (Rebif) versus interferon beta‐1b (Betaseron) | 1 | 301 | Risk Ratio (M‐H, Random, 95% CI) | 0.99 [0.78, 1.25] |
| 3.15 Glatiramer acetate versus interferon beta‐1b (Betaseron) | 2 | 2319 | Risk Ratio (M‐H, Random, 95% CI) | 0.99 [0.86, 1.13] |
| 3.16 Glatiramer acetate versus interferon beta‐1a (Rebif) | 1 | 764 | Risk Ratio (M‐H, Random, 95% CI) | 0.58 [0.39, 0.85] |
| 3.17 Dimethyl fumarate versus glatiramer acetate | 1 | 1067 | Risk Ratio (M‐H, Random, 95% CI) | 1.01 [0.83, 1.22] |
| 3.18 Alemtuzumab versus interferon beta‐1a (Rebif) | 3 | 1582 | Risk Ratio (M‐H, Random, 95% CI) | 0.41 [0.32, 0.54] |
| 3.19 Laquinimod versus interferon beta‐1a (Avonex) | 1 | 881 | Risk Ratio (M‐H, Random, 95% CI) | 1.07 [0.85, 1.33] |
| 3.20 Azathioprine versus interferons beta (Avonex, Rebif or Betaseron) | 1 | 150 | Risk Ratio (M‐H, Random, 95% CI) | 0.77 [0.49, 1.23] |
| Outcome or subgroup title | No. of studies | No. of participants | Statistical method | Effect size |
| 1 Comparisons for treatment discontinuation due to AEs over 12 months Show forest plot | 13 | Risk Ratio (M‐H, Random, 95% CI) | Subtotals only | |
| 1.1 Interferon beta‐1a (Avonex) 30 µg versus placebo | 1 | 301 | Risk Ratio (M‐H, Random, 95% CI) | 3.17 [0.67, 15.00] |
| 1.2 Interferon beta‐1a (Rebif) 22 µg versus placebo | 1 | 195 | Risk Ratio (M‐H, Random, 95% CI) | 3.16 [0.13, 76.54] |
| 1.3 Interferon beta‐1a (Rebif) 44 µg versus placebo | 1 | 198 | Risk Ratio (M‐H, Random, 95% CI) | 11.22 [0.63, 200.27] |
| 1.4 Glatiramer acetate 20 mg daily versus placebo | 1 | 239 | Risk Ratio (M‐H, Random, 95% CI) | 1.51 [0.26, 8.89] |
| 1.5 Glatiramer 40 mg three times per week versus placebo | 1 | 1404 | Risk Ratio (M‐H, Random, 95% CI) | 2.36 [0.99, 5.65] |
| 1.6 Teriflunomide 7 mg versus placebo | 1 | 797 | Risk Ratio (M‐H, Random, 95% CI) | 2.06 [1.31, 3.24] |
| 1.7 Teriflunomide 14 mg versus placebo | 1 | 761 | Risk Ratio (M‐H, Random, 95% CI) | 2.51 [1.61, 3.91] |
| 1.8 Pegylated interferon beta‐1a every 4 weeks versus placebo | 1 | 1000 | Risk Ratio (M‐H, Random, 95% CI) | 2.78 [1.31, 5.89] |
| 1.9 Pegylated interferon beta‐1a every 2 weeks versus placebo | 1 | 1012 | Risk Ratio (M‐H, Random, 95% CI) | 2.82 [1.34, 5.96] |
| 1.10 Daclizumab 150 mg versus placebo | 1 | 412 | Risk Ratio (M‐H, Random, 95% CI) | 3.43 [0.72, 16.33] |
| 1.11 Daclizumab 300 mg versus placebo | 1 | 413 | Risk Ratio (M‐H, Random, 95% CI) | 4.39 [0.96, 20.08] |
| 1.12 Immunoglobulins 0.2 g versus placebo | 2 | 163 | Risk Ratio (M‐H, Random, 95% CI) | 2.14 [0.23, 19.96] |
| 1.13 Immunoglobulins 0.4 g versus placebo | 1 | 34 | Risk Ratio (M‐H, Random, 95% CI) | 3.35 [0.15, 76.93] |
| 1.14 Interferon beta‐1a (Rebif) 44 µg versus interferon beta‐1a (Avonex) 30 µg | 1 | 677 | Risk Ratio (M‐H, Random, 95% CI) | 1.05 [0.56, 1.97] |
| 1.15 Fingolimod 0.5 mg versus interferon beta‐1a (Avonex) 30 µg | 1 | 866 | Risk Ratio (M‐H, Random, 95% CI) | 1.43 [0.81, 2.54] |
| 1.16 Fingolimod 1.25 mg versus interferon beta‐1a (Avonex) 30 µg | 1 | 861 | Risk Ratio (M‐H, Random, 95% CI) | 2.36 [1.40, 3.98] |
| 1.17 Teriflunomide 7 mg versus interferon beta‐1a (Rebif) 44 µg | 1 | 213 | Risk Ratio (M‐H, Random, 95% CI) | 0.39 [0.19, 0.81] |
| 1.18 Teriflunomide 14 mg versus interferon beta‐1a (Rebif) 44 µg | 1 | 215 | Risk Ratio (M‐H, Random, 95% CI) | 0.51 [0.27, 0.98] |
| 1.19 Azathioprine versus interferons beta (Avonex, Rebif or Betaseron) | 1 | 94 | Risk Ratio (M‐H, Random, 95% CI) | 1.0 [0.21, 4.70] |
| 2 Comparisons for treatment discontinuation due to AEs over 24 months Show forest plot | 23 | Risk Ratio (M‐H, Random, 95% CI) | Subtotals only | |
| 2.1 Interferon beta‐1b (Betaseron) 50 µg versus placebo | 1 | 248 | Risk Ratio (M‐H, Random, 95% CI) | 4.92 [0.58, 41.51] |
| 2.2 Interferon beta‐1b (Betaseron) 250 µg versus placebo | 1 | 247 | Risk Ratio (M‐H, Random, 95% CI) | 9.92 [1.29, 76.32] |
| 2.3 Interferon beta‐1a (Avonex) 30 µg versus placebo | 1 | 897 | Risk Ratio (M‐H, Random, 95% CI) | 1.43 [0.81, 2.54] |
| 2.4 Interferon beta‐1a (Rebif) 22 µg versus placebo | 1 | 376 | Risk Ratio (M‐H, Random, 95% CI) | 2.31 [0.61, 8.79] |
| 2.5 Interferon beta‐1a (Rebif) 44 µg versus placebo | 1 | 371 | Risk Ratio (M‐H, Random, 95% CI) | 3.05 [0.84, 11.08] |
| 2.6 Glatiramer acetate 20 mg daily versus placebo | 3 | 1024 | Risk Ratio (M‐H, Random, 95% CI) | 1.74 [0.49, 6.13] |
| 2.7 Natalizumab versus placebo | 1 | 942 | Risk Ratio (M‐H, Random, 95% CI) | 1.53 [0.93, 2.53] |
| 2.8 Mitoxantrone versus placebo | 1 | 51 | Risk Ratio (M‐H, Random, 95% CI) | 9.82 [0.57, 168.84] |
| 2.9 Fingolimod 0.5 mg versus placebo | 2 | 1556 | Risk Ratio (M‐H, Random, 95% CI) | 1.42 [0.89, 2.25] |
| 2.10 Fingolimod 1.25 mg versus placebo | 2 | 1572 | Risk Ratio (M‐H, Random, 95% CI) | 1.93 [1.48, 2.52] |
| 2.11 Teriflunomide 7 mg versus placebo | 1 | 729 | Risk Ratio (M‐H, Random, 95% CI) | 1.23 [0.77, 1.96] |
| 2.12 Teriflunomide 14 mg versus placebo | 1 | 722 | Risk Ratio (M‐H, Random, 95% CI) | 1.36 [0.86, 2.15] |
| 2.13 Dimethyl fumarate 480 mg versus placebo | 2 | 1546 | Risk Ratio (M‐H, Random, 95% CI) | 1.17 [0.91, 1.51] |
| 2.14 Dimethyl fumarate 720 mg versus placebo | 2 | 1534 | Risk Ratio (M‐H, Random, 95% CI) | 1.20 [0.93, 1.54] |
| 2.15 Laquinimod versus placebo | 2 | 1990 | Risk Ratio (M‐H, Random, 95% CI) | 1.39 [0.96, 2.00] |
| 2.16 Azathioprine versus placebo | 1 | 59 | Risk Ratio (M‐H, Random, 95% CI) | 5.8 [0.74, 45.26] |
| 2.17 Immunoglobulins 0.15 to 0.20 g versus placebo | 1 | 150 | Risk Ratio (M‐H, Random, 95% CI) | 3.0 [0.32, 28.19] |
| 2.18 Interferon beta‐1a (Avonex) 30 µg versus interferon beta‐1b (Betaseron) 250 µg | 1 | 188 | Risk Ratio (M‐H, Random, 95% CI) | 0.21 [0.02, 1.75] |
| 2.19 Glatiramer acetate 20 mg daily versus interferon beta‐1b (Betaseron) 250 μg | 2 | 1420 | Risk Ratio (M‐H, Random, 95% CI) | 1.19 [0.56, 2.53] |
| 2.20 Glatiramer acetate 20 mg daily versus interferon beta‐1b (Betaseron) 500 μg | 1 | 1347 | Risk Ratio (M‐H, Random, 95% CI) | 0.79 [0.37, 1.68] |
| 2.21 Glatiramer acetate 20 mg daily versus interferon beta‐1a (Rebif) 44 µg | 1 | 764 | Risk Ratio (M‐H, Random, 95% CI) | 0.84 [0.47, 1.52] |
| 2.22 Dimethyl fumarate 480 mg versus glatiramer acetate 20 mg daily | 1 | 722 | Risk Ratio (M‐H, Random, 95% CI) | 1.22 [0.80, 1.84] |
| 2.23 Dimethyl fumarate 720 mg versus glatiramer acetate 20 mg daily | 1 | 705 | Risk Ratio (M‐H, Random, 95% CI) | 1.22 [0.80, 1.85] |
| 2.24 Alemtuzumab 12 mg versus interferon beta‐1a (Rebif) 44 µg | 3 | 1472 | Risk Ratio (M‐H, Random, 95% CI) | 0.38 [0.22, 0.68] |
| 2.25 Alemtuzumab 24 mg versus interferon beta‐1a (Rebif) 44 µg | 2 | 625 | Risk Ratio (M‐H, Random, 95% CI) | 0.33 [0.10, 1.09] |
| 2.26 Laquinimod versus interferon beta‐1a (Avonex) 30 µg | 1 | 881 | Risk Ratio (M‐H, Random, 95% CI) | 0.84 [0.49, 1.45] |
| 2.27 Azathioprine versus interferons beta (Avonex, Rebif or Betaseron) | 1 | 150 | Risk Ratio (M‐H, Random, 95% CI) | 2.21 [0.90, 5.45] |
| Outcome or subgroup title | No. of studies | No. of participants | Statistical method | Effect size |
| 1 Serious adverse events Show forest plot | 16 | Risk Ratio (M‐H, Random, 95% CI) | Subtotals only | |
| 1.1 Interferons beta (Avonex, Rebif or Betaseron) versus placebo | 3 | 870 | Risk Ratio (M‐H, Random, 95% CI) | 1.26 [0.67, 2.37] |
| 1.2 Glatiramer acetate versus placebo | 2 | 490 | Risk Ratio (M‐H, Random, 95% CI) | 1.87 [0.73, 4.74] |
| 1.3 Natalizumab versus placebo | 1 | 939 | Risk Ratio (M‐H, Random, 95% CI) | 1.19 [0.81, 1.73] |
| 1.4 Fingolimod versus placebo | 2 | 1572 | Risk Ratio (M‐H, Random, 95% CI) | 0.97 [0.72, 1.30] |
| 1.5 Teriflunomide versus placebo | 1 | 718 | Risk Ratio (M‐H, Random, 95% CI) | 1.26 [0.87, 1.83] |
| 1.6 Dimethyl fumarate versus placebo | 2 | 1531 | Risk Ratio (M‐H, Random, 95% CI) | 1.09 [0.76, 1.55] |
| 1.7 Pegylated interferon beta‐1a versus placebo | 1 | 1012 | Risk Ratio (M‐H, Random, 95% CI) | 0.98 [0.57, 1.68] |
| 1.8 Daclizumab versus placebo | 1 | 413 | Risk Ratio (M‐H, Random, 95% CI) | 1.55 [0.77, 3.10] |
| 1.9 Laquinimod versus placebo | 2 | 1988 | Risk Ratio (M‐H, Random, 95% CI) | 0.97 [0.67, 1.41] |
| 1.10 Immunoglobulins versus placebo | 1 | 83 | Risk Ratio (M‐H, Random, 95% CI) | 0.65 [0.11, 3.70] |