直接口服抗凝剂与华法林在慢性肾病房颤患者中预防卒中和全身性栓塞事件的比较
Appendices
Appendix 1. Electronic search strategies
| Database | Search terms |
| CENTRAL |
|
| MEDLINE |
|
| EMBASE |
|
Appendix 2. Risk of bias assessment tool
| Potential source of bias | Assessment criteria |
| Random sequence generation Selection bias (biased allocation to interventions) due to inadequate generation of a randomised sequence | Low risk of bias: Random number table; computer random number generator; coin tossing; shuffling cards or envelopes; throwing dice; drawing of lots; minimization (minimization may be implemented without a random element, and this is considered to be equivalent to being random). |
| High risk of bias: Sequence generated by odd or even date of birth; date (or day) of admission; sequence generated by hospital or clinic record number; allocation by judgement of the clinician; by preference of the participant; based on the results of a laboratory test or a series of tests; by availability of the intervention. | |
| Unclear: Insufficient information about the sequence generation process to permit judgement. | |
| Allocation concealment Selection bias (biased allocation to interventions) due to inadequate concealment of allocations prior to assignment | Low risk of bias: Randomisation method described that would not allow investigator/participant to know or influence intervention group before eligible participant entered in the study (e.g. central allocation, including telephone, web‐based, and pharmacy‐controlled, randomisation; sequentially numbered drug containers of identical appearance; sequentially numbered, opaque, sealed envelopes). |
| High risk of bias: Using an open random allocation schedule (e.g. a list of random numbers); assignment envelopes were used without appropriate safeguards (e.g. if envelopes were unsealed or non‐opaque or not sequentially numbered); alternation or rotation; date of birth; case record number; any other explicitly unconcealed procedure. | |
| Unclear: Randomisation stated but no information on method used is available. | |
| Blinding of participants and personnel Performance bias due to knowledge of the allocated interventions by participants and personnel during the study | Low risk of bias: No blinding or incomplete blinding, but the review authors judge that the outcome is not likely to be influenced by lack of blinding; blinding of participants and key study personnel ensured, and unlikely that the blinding could have been broken. |
| High risk of bias: No blinding or incomplete blinding, and the outcome is likely to be influenced by lack of blinding; blinding of key study participants and personnel attempted, but likely that the blinding could have been broken, and the outcome is likely to be influenced by lack of blinding. | |
| Unclear: Insufficient information to permit judgement | |
| Blinding of outcome assessment Detection bias due to knowledge of the allocated interventions by outcome assessors. | Low risk of bias: No blinding of outcome assessment, but the review authors judge that the outcome measurement is not likely to be influenced by lack of blinding; blinding of outcome assessment ensured, and unlikely that the blinding could have been broken. |
| High risk of bias: No blinding of outcome assessment, and the outcome measurement is likely to be influenced by lack of blinding; blinding of outcome assessment, but likely that the blinding could have been broken, and the outcome measurement is likely to be influenced by lack of blinding. | |
| Unclear: Insufficient information to permit judgement | |
| Incomplete outcome data Attrition bias due to amount, nature or handling of incomplete outcome data. | Low risk of bias: No missing outcome data; reasons for missing outcome data unlikely to be related to true outcome (for survival data, censoring unlikely to be introducing bias); missing outcome data balanced in numbers across intervention groups, with similar reasons for missing data across groups; for dichotomous outcome data, the proportion of missing outcomes compared with observed event risk not enough to have a clinically relevant impact on the intervention effect estimate; for continuous outcome data, plausible effect size (difference in means or standardized difference in means) among missing outcomes not enough to have a clinically relevant impact on observed effect size; missing data have been imputed using appropriate methods. |
| High risk of bias: Reason for missing outcome data likely to be related to true outcome, with either imbalance in numbers or reasons for missing data across intervention groups; for dichotomous outcome data, the proportion of missing outcomes compared with observed event risk enough to induce clinically relevant bias in intervention effect estimate; for continuous outcome data, plausible effect size (difference in means or standardized difference in means) among missing outcomes enough to induce clinically relevant bias in observed effect size; ‘as‐treated’ analysis done with substantial departure of the intervention received from that assigned at randomisation; potentially inappropriate application of simple imputation. | |
| Unclear: Insufficient information to permit judgement | |
| Selective reporting Reporting bias due to selective outcome reporting | Low risk of bias: The study protocol is available and all of the study’s pre‐specified (primary and secondary) outcomes that are of interest in the review have been reported in the pre‐specified way; the study protocol is not available but it is clear that the published reports include all expected outcomes, including those that were pre‐specified (convincing text of this nature may be uncommon). |
| High risk of bias: Not all of the study’s pre‐specified primary outcomes have been reported; one or more primary outcomes is reported using measurements, analysis methods or subsets of the data (e.g. subscales) that were not pre‐specified; one or more reported primary outcomes were not pre‐specified (unless clear justification for their reporting is provided, such as an unexpected adverse effect); one or more outcomes of interest in the review are reported incompletely so that they cannot be entered in a meta‐analysis; the study report fails to include results for a key outcome that would be expected to have been reported for such a study. | |
| Unclear: Insufficient information to permit judgement | |
| Other bias ‐Funding bias | Low risk of bias: The trial was independently funded by a government organization or universities etc. |
| High risk of bias: The trial was funded by the commercial support and we are sure that there is an important risk of bias. | |
| Unclear: The trial did not declare its funding source, or the trial was funded by the commercial support and we are not sure whether there is an important risk of bias. |

Study flow diagram.

Risk of bias graph: review authors' judgements about each risk of bias item presented as percentages across all included studies.
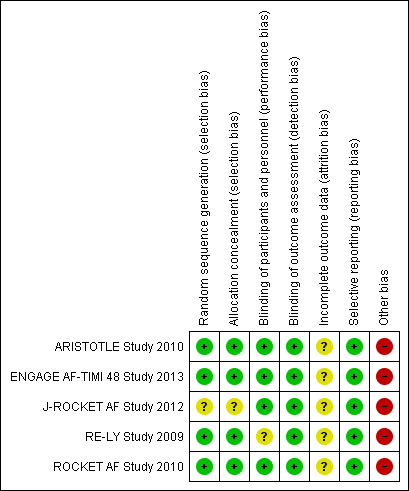
Risk of bias summary: review authors' judgements about each risk of bias item for each included study.

Comparison 1 Direct oral anticoagulants versus warfarin, Outcome 1 All strokes and systemic embolic events.
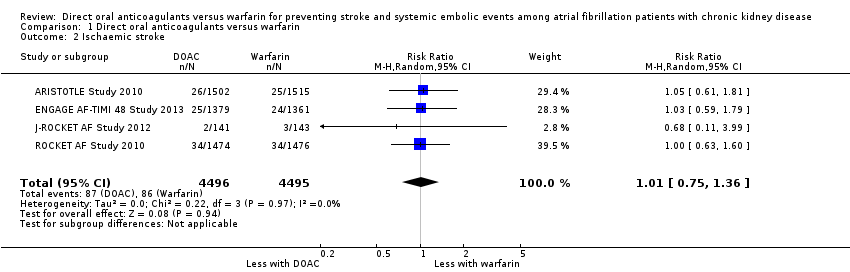
Comparison 1 Direct oral anticoagulants versus warfarin, Outcome 2 Ischaemic stroke.

Comparison 1 Direct oral anticoagulants versus warfarin, Outcome 3 Haemorrhagic stroke.

Comparison 1 Direct oral anticoagulants versus warfarin, Outcome 4 Major bleeding.
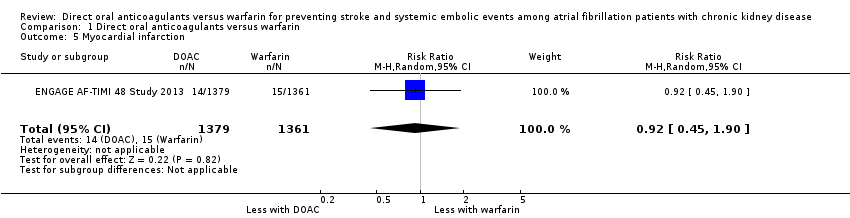
Comparison 1 Direct oral anticoagulants versus warfarin, Outcome 5 Myocardial infarction.

Comparison 1 Direct oral anticoagulants versus warfarin, Outcome 6 Minor bleeding.
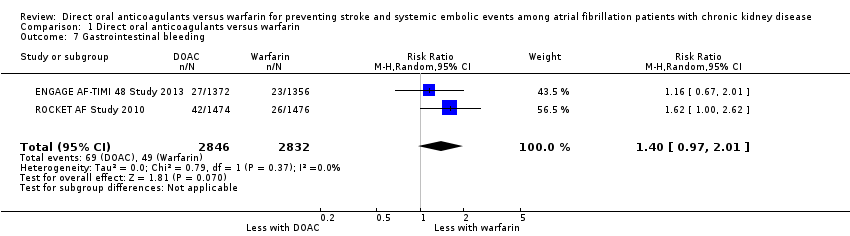
Comparison 1 Direct oral anticoagulants versus warfarin, Outcome 7 Gastrointestinal bleeding.

Comparison 1 Direct oral anticoagulants versus warfarin, Outcome 8 Intracranial haemorrhage.

Comparison 1 Direct oral anticoagulants versus warfarin, Outcome 9 All‐cause mortality.

Comparison 2 Direct oral anticoagulants versus warfarin: subgroup analysis for participants with CrCl 30 to 50 mL/min, Outcome 1 All strokes and systemic embolic events.
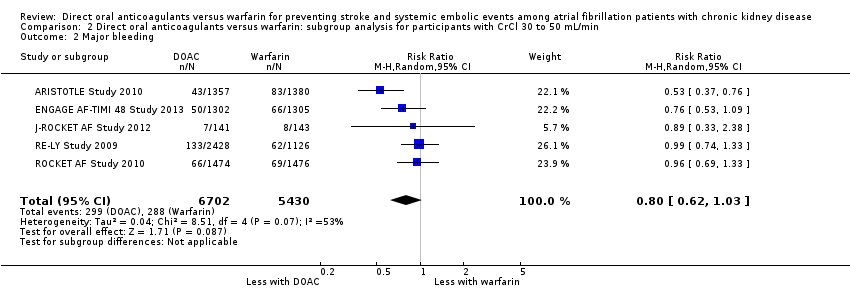
Comparison 2 Direct oral anticoagulants versus warfarin: subgroup analysis for participants with CrCl 30 to 50 mL/min, Outcome 2 Major bleeding.
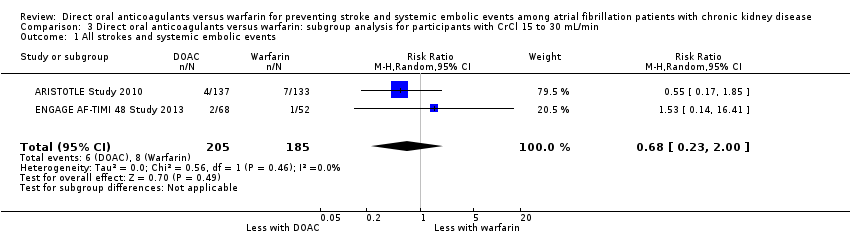
Comparison 3 Direct oral anticoagulants versus warfarin: subgroup analysis for participants with CrCl 15 to 30 mL/min, Outcome 1 All strokes and systemic embolic events.
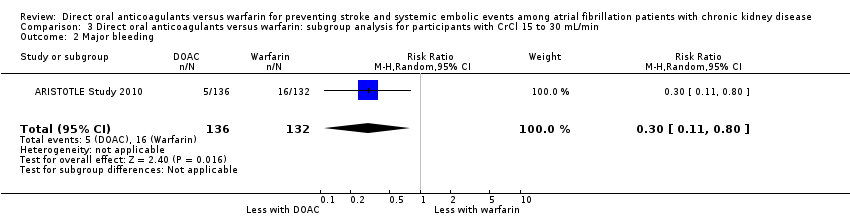
Comparison 3 Direct oral anticoagulants versus warfarin: subgroup analysis for participants with CrCl 15 to 30 mL/min, Outcome 2 Major bleeding.
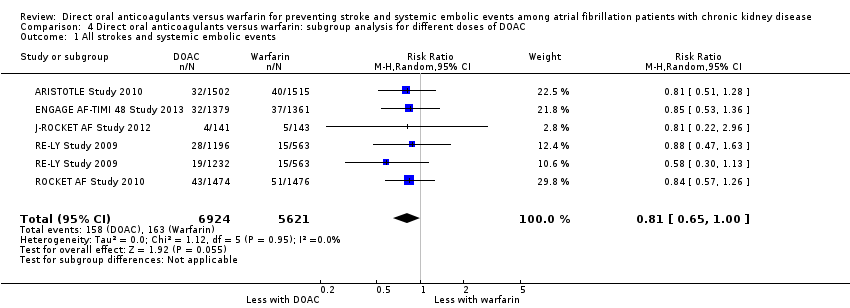
Comparison 4 Direct oral anticoagulants versus warfarin: subgroup analysis for different doses of DOAC, Outcome 1 All strokes and systemic embolic events.

Comparison 4 Direct oral anticoagulants versus warfarin: subgroup analysis for different doses of DOAC, Outcome 2 Major bleeding.

Comparison 4 Direct oral anticoagulants versus warfarin: subgroup analysis for different doses of DOAC, Outcome 3 All‐cause mortality.
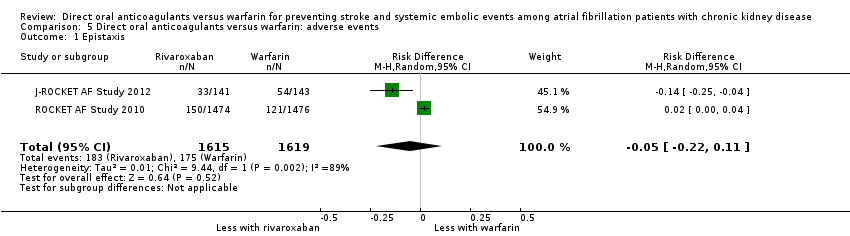
Comparison 5 Direct oral anticoagulants versus warfarin: adverse events, Outcome 1 Epistaxis.
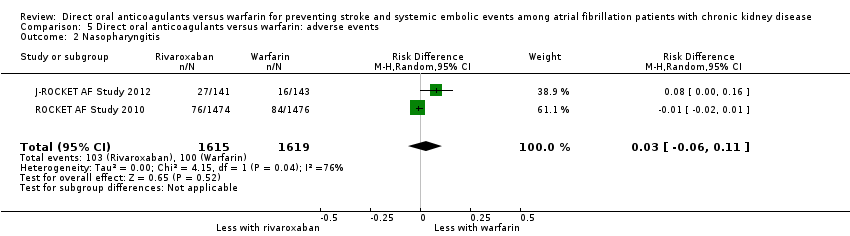
Comparison 5 Direct oral anticoagulants versus warfarin: adverse events, Outcome 2 Nasopharyngitis.
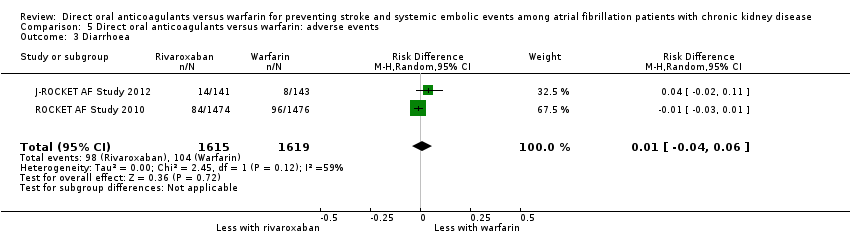
Comparison 5 Direct oral anticoagulants versus warfarin: adverse events, Outcome 3 Diarrhoea.

Comparison 5 Direct oral anticoagulants versus warfarin: adverse events, Outcome 4 Upper respiratory tract inflammation.

Comparison 5 Direct oral anticoagulants versus warfarin: adverse events, Outcome 5 Back pain.

Comparison 5 Direct oral anticoagulants versus warfarin: adverse events, Outcome 6 Cardiac failure.

Comparison 6 Direct oral anticoagulants versus warfarin: fixed‐effect model, Outcome 1 All strokes and systemic embolic events.
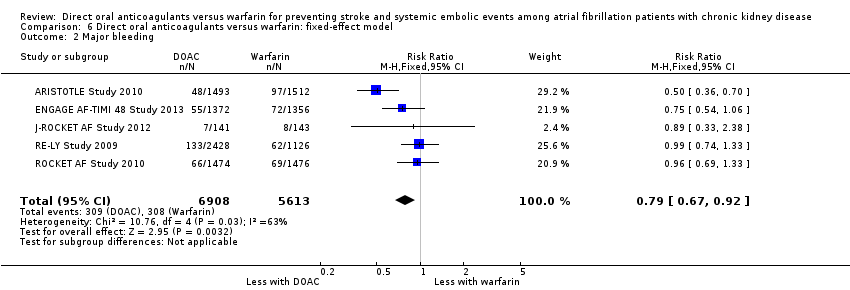
Comparison 6 Direct oral anticoagulants versus warfarin: fixed‐effect model, Outcome 2 Major bleeding.
| DOAC versus warfarin for preventing stroke and systemic embolic events among atrial fibrillation patients with CKD | |||||
| Patient or population: atrial fibrillation patients with CKD Setting: Hospital‐based setting Intervention: DOAC Comparison: Dose‐adjusted warfarin | |||||
| Outcomes | Illustrative comparative risks* (95% CI) | Relative effect | No. of participants | Quality of the evidence | |
| Assumed risk | Corresponding risk | ||||
| Warfarin | DOAC | ||||
| All strokes and systemic embolic events Follow up: 1.8 years to 2.8 years | 29 per 1,000 | 23 per 1,000 | RR 0.81 (0.65 to 1.00) | 12,545 (5) | ⊕⊕⊕⊝¹ |
| Major bleeding Follow up: 1.8 years to 2.8 years | 55 per 1,000 | 43 per 1,000 | RR 0.79 (0.59 to 1.04) | 12,521 (5) | ⊕⊕⊝⊝¹ ² |
| Myocardial infarction Follow up: 2.8 years | 11 per 1,000 | 10 per 1,000 (5 to 21) | RR 0.92 (0.45 to 1.90) | 2,740 (1) | ‐ |
| Minor bleeding Follow up: 2.5 years to 2.8 years | 74 per 1,000 | 72 per 1,000 (43 to 119) | RR 0.97 (0.58 to 1.61) | 3,012 (2) | ⊕⊕⊝⊝¹ ² |
| Gastrointestinal bleeding Follow up: 1.9 years to 2.8 years | 17 per 1,000 | 24 per 1,000 (17 to 35) | RR 1.40 (0.97 to 2.01) | 5,678 (2) | ⊕⊕⊕⊝¹ |
| Intracranial haemorrhage Follow up: 1.8 years to 2.8 years | 14 per 1,000 | 6 per 1,000 | RR 0.43 (0.27 to 0.69) | 12,521 (5) | ⊕⊕⊕⊝¹ |
| All‐cause mortality Follow up: 1.8 years to 2.8 years | 78 per 1,000 | 71 per 1,000 | RR 0.91 (0.78 to 1.05) | 9,595 (4) | ⊕⊕⊕⊝¹ |
| *The risk in the intervention group (and its 95% CI) is based on the assumed risk in the comparison group and the relative effect of the intervention (and its 95% CI). AF: atrial fibrillation; CI: confidence interval; DOAC: direct oral anticoagulants; RR: risk ratio | |||||
| GRADE Working Group grades of evidence | |||||
| 1 Some concerns with imprecision because of the uncertain effect estimate 2 Some concerns with inconsistency because of medium heterogeneity | |||||
| Dabigatran | Apixaban | Rivaroxaban | Edoxaban | |
| 150 mg twice daily for CKD stage G3 (CrCl 30 to 50 mL/min) No recommendation for CKD stage G4 | 2.5 mg twice daily in patients with at least two of the following characteristics: ‐ age ≥ 80 years ‐ body weight ≤ 60 kg ‐ SCr > 1.5 mg/dL | 15 mg daily for CKD stage G3 and G4 (CrCl 15 to 50 mL/min) | 30 mg once daily for CKD stage G3 and G4 (CrCl 15 to 50 mL/min) | |
| 150 mg twice daily for CKD stage G3 (CrCl > 30 mL/min) 75 mg twice daily for CKD stage G4 (CrCl 15 to 30 mL/min) | 2.5 mg twice daily in patients with at least two of the following characteristics: ‐ age ≥ 80 years ‐ body weight ≤ 60 kg ‐ SCr > 1.5 mg/dL | 15 mg daily for CKD stage G3 and G4 (CrCl 15 to 50 mL/min) | 30 mg once daily for CKD stage G3 and G4 (CrCl 15 to 50 mL/min) | |
| 110 or 150 mg twice daily for CKD stage G3 (CrCl 30 to 50 mL/min) No recommendation for CKD stage G4 | 2.5 mg twice daily in patients with at least two of the following characteristics: ‐ age ≥ 80 years ‐ body weight ≤ 60 kg ‐ SCr > 1.5 mg/dL | 15 mg daily for CKD stage G3 (CrCl 30 to 50 mL/min) No recommendation for CKD stage G4 | 30 mg once daily for CKD stage G3 (CrCl 30 to 50 mL/min) | |
| CKD ‐ chronic kidney disease; CrCl ‐ creatinine clearance; SCr ‐ serum creatinine | ||||
| Outcome or subgroup title | No. of studies | No. of participants | Statistical method | Effect size |
| 1 All strokes and systemic embolic events Show forest plot | 5 | 12545 | Risk Ratio (M‐H, Random, 95% CI) | 0.81 [0.65, 1.00] |
| 2 Ischaemic stroke Show forest plot | 4 | 8991 | Risk Ratio (M‐H, Random, 95% CI) | 1.01 [0.75, 1.36] |
| 3 Haemorrhagic stroke Show forest plot | 4 | 8991 | Risk Ratio (M‐H, Random, 95% CI) | 0.52 [0.28, 0.97] |
| 4 Major bleeding Show forest plot | 5 | 12521 | Risk Ratio (M‐H, Random, 95% CI) | 0.79 [0.59, 1.04] |
| 5 Myocardial infarction Show forest plot | 1 | 2740 | Risk Ratio (M‐H, Random, 95% CI) | 0.92 [0.45, 1.90] |
| 6 Minor bleeding Show forest plot | 2 | 3012 | Risk Ratio (M‐H, Random, 95% CI) | 0.97 [0.58, 1.61] |
| 7 Gastrointestinal bleeding Show forest plot | 2 | 5678 | Risk Ratio (M‐H, Random, 95% CI) | 1.40 [0.97, 2.01] |
| 8 Intracranial haemorrhage Show forest plot | 5 | 12521 | Risk Ratio (M‐H, Random, 95% CI) | 0.43 [0.27, 0.69] |
| 9 All‐cause mortality Show forest plot | 4 | 9595 | Risk Ratio (M‐H, Random, 95% CI) | 0.91 [0.78, 1.05] |
| Outcome or subgroup title | No. of studies | No. of participants | Statistical method | Effect size |
| 1 All strokes and systemic embolic events Show forest plot | 5 | 12155 | Risk Ratio (M‐H, Random, 95% CI) | 0.82 [0.66, 1.02] |
| 2 Major bleeding Show forest plot | 5 | 12132 | Risk Ratio (M‐H, Random, 95% CI) | 0.80 [0.62, 1.03] |
| Outcome or subgroup title | No. of studies | No. of participants | Statistical method | Effect size |
| 1 All strokes and systemic embolic events Show forest plot | 2 | 390 | Risk Ratio (M‐H, Random, 95% CI) | 0.68 [0.23, 2.00] |
| 2 Major bleeding Show forest plot | 1 | 268 | Risk Ratio (M‐H, Random, 95% CI) | 0.30 [0.11, 0.80] |
| Outcome or subgroup title | No. of studies | No. of participants | Statistical method | Effect size |
| 1 All strokes and systemic embolic events Show forest plot | 5 | 12545 | Risk Ratio (M‐H, Random, 95% CI) | 0.81 [0.65, 1.00] |
| 2 Major bleeding Show forest plot | 5 | 12521 | Risk Ratio (M‐H, Random, 95% CI) | 0.81 [0.63, 1.03] |
| 3 All‐cause mortality Show forest plot | 4 | 9595 | Risk Ratio (M‐H, Random, 95% CI) | 0.91 [0.78, 1.05] |
| Outcome or subgroup title | No. of studies | No. of participants | Statistical method | Effect size |
| 1 Epistaxis Show forest plot | 2 | 3234 | Risk Difference (M‐H, Random, 95% CI) | ‐0.05 [‐0.22, 0.11] |
| 2 Nasopharyngitis Show forest plot | 2 | 3234 | Risk Difference (M‐H, Random, 95% CI) | 0.03 [‐0.06, 0.11] |
| 3 Diarrhoea Show forest plot | 2 | 3234 | Risk Difference (M‐H, Random, 95% CI) | 0.01 [‐0.04, 0.06] |
| 4 Upper respiratory tract inflammation Show forest plot | 2 | 3234 | Risk Difference (M‐H, Random, 95% CI) | ‐0.01 [‐0.02, 0.01] |
| 5 Back pain Show forest plot | 2 | 3234 | Risk Difference (M‐H, Random, 95% CI) | ‐0.02 [‐0.05, 0.01] |
| 6 Cardiac failure Show forest plot | 2 | 3234 | Risk Difference (M‐H, Random, 95% CI) | ‐0.01 [‐0.03, 0.01] |
| Outcome or subgroup title | No. of studies | No. of participants | Statistical method | Effect size |
| 1 All strokes and systemic embolic events Show forest plot | 5 | 12545 | Risk Ratio (M‐H, Fixed, 95% CI) | 0.81 [0.65, 1.01] |
| 2 Major bleeding Show forest plot | 5 | 12521 | Risk Ratio (M‐H, Fixed, 95% CI) | 0.79 [0.67, 0.92] |