Regimens of ultrasound surveillance for twin pregnancies for improving outcomes
Referencias
References to studies included in this review
References to studies excluded from this review
Additional references
References to other published versions of this review
Characteristics of studies
Characteristics of included studies [ordered by study ID]
Ir a:
| Methods | RCT | |
| Participants | 539 women were randomised (271 to the standard care group and 268 to the intervention group) in a twin pregnancy with two viable, apparently normally formed twins on ultrasound, at 25 weeks' gestation. The trial recruited women from March 1993 through until March 1997. DC and MC twin pregnancies were not differentiated when including women in the study. | |
| Interventions | Doppler and biometry (intervention) versus biometry (growth) alone (standard care). Women were randomised to receive Doppler and biometry (growth) at 25, 30 and 35 weeks' gestation or to receive biometry only at the same time points. | |
| Outcomes | Primary was perinatal mortality, secondary were maternal and fetal ‐ birthweight, Apgar scores, admission to neonatal intensive care unit, admission to special care unit, requirement for ventilation and neonatal death up to 28 days of life. | |
| Notes | Setting: the study was conducted in tertiary level referral hospitals in Australia, New Zealand and South West Asia. Sources of trial funding and information relating to declarations of interest were not reported. | |
| Risk of bias | ||
| Bias | Authors' judgement | Support for judgement |
| Random sequence generation (selection bias) | Low risk | Randomisation code in blocks of 20 |
| Allocation concealment (selection bias) | Low risk | Opaque, sealed envelope, opened by personnel remote from participant's care |
| Blinding of participants and personnel (performance bias) | Unclear risk | Not stated |
| Blinding of outcome assessment (detection bias) | Unclear risk | Not stated |
| Incomplete outcome data (attrition bias) | Low risk | 13 out of 539 lost to follow‐up and not included in results. 7/271 women were lost in the no Doppler group (standard care) (2.58%) and 6/268 were lost in the Doppler (intervention) group (2.24%) |
| Selective reporting (reporting bias) | Low risk | No apparent reporting bias |
| Other bias | Low risk | None evident |
DC: dichorionic
MC: monochorionic
RCT: randomised controlled trial
Characteristics of excluded studies [ordered by study ID]
Ir a:
| Study | Reason for exclusion |
| No data available, trial abandoned. Was planning to assess continuous wave Doppler in twin pregnancies but was discontinued before reaching the stage of being a RCT |
RCT: randomised controlled trial
Data and analyses
| Outcome or subgroup title | No. of studies | No. of participants | Statistical method | Effect size |
| 1 Perinatal mortality (post randomisation) Show forest plot | 1 | 1052 | Risk Ratio (M‐H, Fixed, 95% CI) | 0.88 [0.32, 2.41] |
| Analysis 1.1 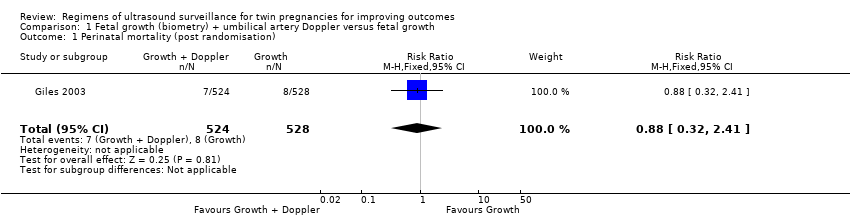 Comparison 1 Fetal growth (biometry) + umbilical artery Doppler versus fetal growth, Outcome 1 Perinatal mortality (post randomisation). | ||||
| 2 Stillbirth Show forest plot | 1 | 526 | Risk Ratio (M‐H, Fixed, 95% CI) | 0.67 [0.11, 3.99] |
| Analysis 1.2  Comparison 1 Fetal growth (biometry) + umbilical artery Doppler versus fetal growth, Outcome 2 Stillbirth. | ||||
| 3 Neonatal death Show forest plot | 1 | 1052 | Risk Ratio (M‐H, Fixed, 95% CI) | 1.01 [0.29, 3.46] |
| Analysis 1.3  Comparison 1 Fetal growth (biometry) + umbilical artery Doppler versus fetal growth, Outcome 3 Neonatal death. | ||||
| 4 Gestational age at birth Show forest plot | 1 | 526 | Mean Difference (IV, Fixed, 95% CI) | 0.10 [‐0.39, 0.59] |
| Analysis 1.4  Comparison 1 Fetal growth (biometry) + umbilical artery Doppler versus fetal growth, Outcome 4 Gestational age at birth. | ||||
| 5 Infant requiring ventilation Show forest plot | 1 | 1052 | Risk Ratio (M‐H, Fixed, 95% CI) | 0.86 [0.59, 1.25] |
| Analysis 1.5  Comparison 1 Fetal growth (biometry) + umbilical artery Doppler versus fetal growth, Outcome 5 Infant requiring ventilation. | ||||
| 6 Admission to special care or intensive care units Show forest plot | 1 | 1052 | Risk Ratio (M‐H, Fixed, 95% CI) | 0.96 [0.88, 1.05] |
| Analysis 1.6  Comparison 1 Fetal growth (biometry) + umbilical artery Doppler versus fetal growth, Outcome 6 Admission to special care or intensive care units. | ||||
| 7 Caesarean section any Show forest plot | 1 | 526 | Risk Ratio (M‐H, Fixed, 95% CI) | 1.00 [0.81, 1.23] |
| Analysis 1.7 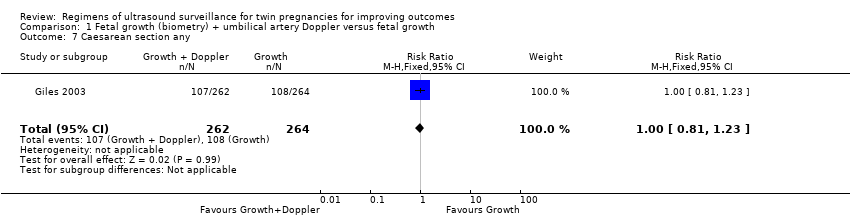 Comparison 1 Fetal growth (biometry) + umbilical artery Doppler versus fetal growth, Outcome 7 Caesarean section any. | ||||
| 8 Elective caesarean section Show forest plot | 1 | 526 | Risk Ratio (M‐H, Fixed, 95% CI) | 1.06 [0.77, 1.47] |
| Analysis 1.8  Comparison 1 Fetal growth (biometry) + umbilical artery Doppler versus fetal growth, Outcome 8 Elective caesarean section. | ||||
| 9 Emergency caesarean section Show forest plot | 1 | 526 | Risk Ratio (M‐H, Fixed, 95% CI) | 0.93 [0.66, 1.32] |
| Analysis 1.9  Comparison 1 Fetal growth (biometry) + umbilical artery Doppler versus fetal growth, Outcome 9 Emergency caesarean section. | ||||
| 10 Induction of labour Show forest plot | 1 | 526 | Risk Ratio (M‐H, Fixed, 95% CI) | 1.10 [0.80, 1.50] |
| Analysis 1.10  Comparison 1 Fetal growth (biometry) + umbilical artery Doppler versus fetal growth, Outcome 10 Induction of labour. | ||||
| 11 Antenatal admission to hospital Show forest plot | 1 | 526 | Risk Ratio (M‐H, Fixed, 95% CI) | 0.96 [0.80, 1.15] |
| Analysis 1.11  Comparison 1 Fetal growth (biometry) + umbilical artery Doppler versus fetal growth, Outcome 11 Antenatal admission to hospital. | ||||
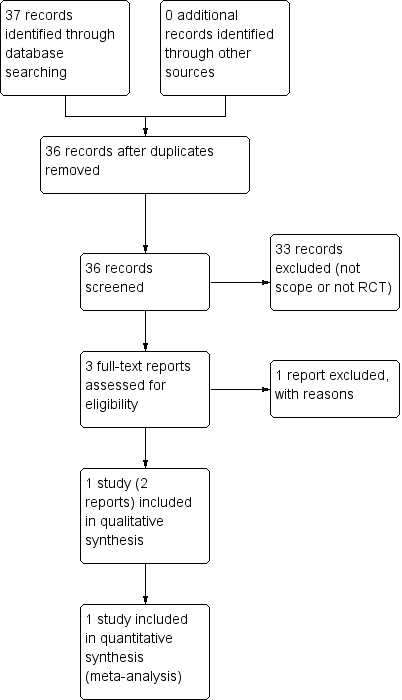
Study flow diagram
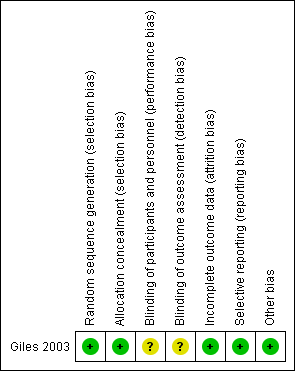
Risk of bias summary: review authors' judgements about each risk of bias item for each included study.

Comparison 1 Fetal growth (biometry) + umbilical artery Doppler versus fetal growth, Outcome 1 Perinatal mortality (post randomisation).

Comparison 1 Fetal growth (biometry) + umbilical artery Doppler versus fetal growth, Outcome 2 Stillbirth.

Comparison 1 Fetal growth (biometry) + umbilical artery Doppler versus fetal growth, Outcome 3 Neonatal death.

Comparison 1 Fetal growth (biometry) + umbilical artery Doppler versus fetal growth, Outcome 4 Gestational age at birth.

Comparison 1 Fetal growth (biometry) + umbilical artery Doppler versus fetal growth, Outcome 5 Infant requiring ventilation.

Comparison 1 Fetal growth (biometry) + umbilical artery Doppler versus fetal growth, Outcome 6 Admission to special care or intensive care units.

Comparison 1 Fetal growth (biometry) + umbilical artery Doppler versus fetal growth, Outcome 7 Caesarean section any.

Comparison 1 Fetal growth (biometry) + umbilical artery Doppler versus fetal growth, Outcome 8 Elective caesarean section.

Comparison 1 Fetal growth (biometry) + umbilical artery Doppler versus fetal growth, Outcome 9 Emergency caesarean section.
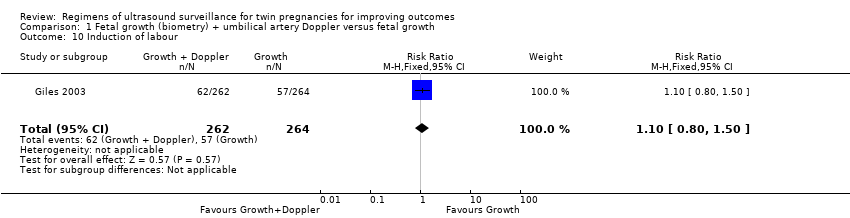
Comparison 1 Fetal growth (biometry) + umbilical artery Doppler versus fetal growth, Outcome 10 Induction of labour.

Comparison 1 Fetal growth (biometry) + umbilical artery Doppler versus fetal growth, Outcome 11 Antenatal admission to hospital.
| Fetal growth + umbilical artery Doppler versus fetal growth for twin pregnancies for improving outcomes | ||||||
| Patient or population: women with twin pregnancies were randomised from 25 weeks | ||||||
| Outcomes | Anticipated absolute effects* (95% CI) | Relative effect | № of participants | Quality of the evidence | Comments | |
| Risk with fetal growth + umbilical artery Doppler | Risk with fetal growth | |||||
| Perinatal mortality (after randomisation) | Study population | RR 0.88 | 1052 | ⊕⊕⊝⊝ | ||
| 15 per 1000 | 13 per 1000 | |||||
| Neonatal death | Study population | RR 1.01 | 1052 | ⊕⊕⊝⊝ | ||
| 9 per 1000 | 10 per 1000 | |||||
| Birth less than 28 weeks | ‐ | ‐ | ‐ | ‐ | ‐ | The trial included in this review did not report this outcome. |
| Gestational age at birth (weeks) | The mean gestational age at birth was 35.8 weeks | The mean gestational age at birth was 35.7 weeks | MD 0.10 weeks longer with growth plus Doppler | 526 | ⊕⊕⊕⊝ | |
| Caesarean section (any) | Study population | RR 1.00 | 526 | ⊕⊕⊕⊕ | ||
| 409 per 1000 | 409 per 1000 | |||||
| Induction of labour | Study population | RR 1.10 | 526 | ⊕⊕⊕⊝ | ||
| 216 per 1000 | 238 per 1000 | |||||
| Antenatal admission to hospital | Study population | RR 0.96 | 526 | ⊕⊕⊕⊕ | ||
| 477 per 1000 | 458 per 1000 | |||||
| *The risk in the intervention group (and its 95% confidence interval) is based on the assumed risk in the comparison group and the relative effect of the intervention (and its 95% CI). | ||||||
| GRADE Working Group grades of evidence | ||||||
| 1 Events are rare and wide confidence intervals cross line of no effect (‐2). | ||||||
| Outcome or subgroup title | No. of studies | No. of participants | Statistical method | Effect size |
| 1 Perinatal mortality (post randomisation) Show forest plot | 1 | 1052 | Risk Ratio (M‐H, Fixed, 95% CI) | 0.88 [0.32, 2.41] |
| 2 Stillbirth Show forest plot | 1 | 526 | Risk Ratio (M‐H, Fixed, 95% CI) | 0.67 [0.11, 3.99] |
| 3 Neonatal death Show forest plot | 1 | 1052 | Risk Ratio (M‐H, Fixed, 95% CI) | 1.01 [0.29, 3.46] |
| 4 Gestational age at birth Show forest plot | 1 | 526 | Mean Difference (IV, Fixed, 95% CI) | 0.10 [‐0.39, 0.59] |
| 5 Infant requiring ventilation Show forest plot | 1 | 1052 | Risk Ratio (M‐H, Fixed, 95% CI) | 0.86 [0.59, 1.25] |
| 6 Admission to special care or intensive care units Show forest plot | 1 | 1052 | Risk Ratio (M‐H, Fixed, 95% CI) | 0.96 [0.88, 1.05] |
| 7 Caesarean section any Show forest plot | 1 | 526 | Risk Ratio (M‐H, Fixed, 95% CI) | 1.00 [0.81, 1.23] |
| 8 Elective caesarean section Show forest plot | 1 | 526 | Risk Ratio (M‐H, Fixed, 95% CI) | 1.06 [0.77, 1.47] |
| 9 Emergency caesarean section Show forest plot | 1 | 526 | Risk Ratio (M‐H, Fixed, 95% CI) | 0.93 [0.66, 1.32] |
| 10 Induction of labour Show forest plot | 1 | 526 | Risk Ratio (M‐H, Fixed, 95% CI) | 1.10 [0.80, 1.50] |
| 11 Antenatal admission to hospital Show forest plot | 1 | 526 | Risk Ratio (M‐H, Fixed, 95% CI) | 0.96 [0.80, 1.15] |