Regímenes de vigilancia ecográfica en embarazos gemelares para mejorar los resultados
Información
- DOI:
- https://doi.org/10.1002/14651858.CD011371.pub2Copiar DOI

- Base de datos:
-
- Cochrane Database of Systematic Reviews
- Versión publicada:
-
- 07 noviembre 2017see what's new
- Tipo:
-
- Intervention
- Etapa:
-
- Review
- Grupo Editorial Cochrane:
-
Grupo Cochrane de Embarazo y parto
- Copyright:
-
- Copyright © 2017 The Cochrane Collaboration. Published by John Wiley & Sons, Ltd.
Cifras del artículo
Altmetric:
Citado por:
Autores
Contributions of authors
J Woolcock (JW) is the contact person and guarantor for the review. J Woolcock developed and wrote the background and methods of the protocol and co‐ordinated the protocol development.
R Grivell provided advice from a clinical and methodological perspective. R Grivell and J Woolcock checked the studies for inclusion and independently extracted data from the included study.
J Dodd provided advice from a clinical and methodological perspective.
Declarations of interest
J Woolcock : none known.
R Grivell : none known.
J Dodd : none known.
Acknowledgements
As part of the pre‐publication editorial process, four peers (an editor and three referees who are external to the editorial team), a member of Cochrane Pregnancy and Childbirth's international panel of consumers and the Group's Statistical Adviser commented on this review.
This project was supported by the National Institute for Health Research, via Cochrane Infrastructure funding to Cochrane Pregnancy and Childbirth. The views and opinions expressed therein are those of the authors and do not necessarily reflect those of the Systematic Reviews Programme, NIHR, NHS or the Department of Health.
Version history
| Published | Title | Stage | Authors | Version |
| 2017 Nov 07 | Regimens of ultrasound surveillance for twin pregnancies for improving outcomes | Review | Jane G Woolcock, Rosalie M Grivell, Jodie M Dodd | |
| 2014 Nov 12 | Regimens of ultrasound surveillance for twin pregnancies for improving outcomes | Protocol | Jane G Woolcock, Rosalie M Grivell, Jodie M Dodd | |
Differences between protocol and review
There are some differences between our published protocol (Woolcock 2014) and the full review ‐ these are listed below.
We added an additional search of ClinicalTrials.gov and the WHO International Clinical Trials Registry Platform (ICTRP).
We have updated our methods in line with the standard methods of Cochrane Pregnancy and Childbirth, this includes methods for dealing with outcome data from multiple pregnancies, the use of GRADE and inclusion of summary of findings Table for the main comparison.
Keywords
MeSH
Medical Subject Headings (MeSH) Keywords
Medical Subject Headings Check Words
Female; Humans; Infant, Newborn; Pregnancy;
PICO
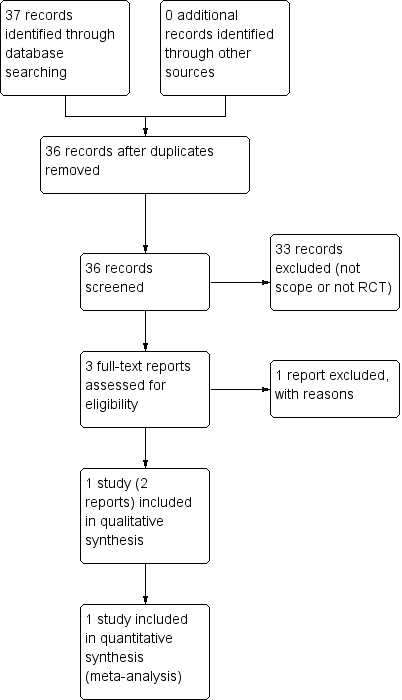
Study flow diagram
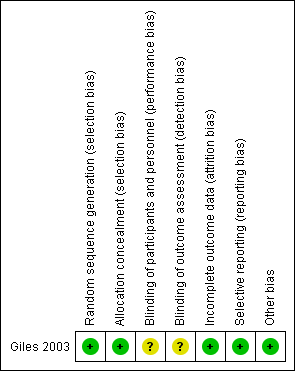
Risk of bias summary: review authors' judgements about each risk of bias item for each included study.

Comparison 1 Fetal growth (biometry) + umbilical artery Doppler versus fetal growth, Outcome 1 Perinatal mortality (post randomisation).

Comparison 1 Fetal growth (biometry) + umbilical artery Doppler versus fetal growth, Outcome 2 Stillbirth.

Comparison 1 Fetal growth (biometry) + umbilical artery Doppler versus fetal growth, Outcome 3 Neonatal death.

Comparison 1 Fetal growth (biometry) + umbilical artery Doppler versus fetal growth, Outcome 4 Gestational age at birth.

Comparison 1 Fetal growth (biometry) + umbilical artery Doppler versus fetal growth, Outcome 5 Infant requiring ventilation.

Comparison 1 Fetal growth (biometry) + umbilical artery Doppler versus fetal growth, Outcome 6 Admission to special care or intensive care units.

Comparison 1 Fetal growth (biometry) + umbilical artery Doppler versus fetal growth, Outcome 7 Caesarean section any.

Comparison 1 Fetal growth (biometry) + umbilical artery Doppler versus fetal growth, Outcome 8 Elective caesarean section.
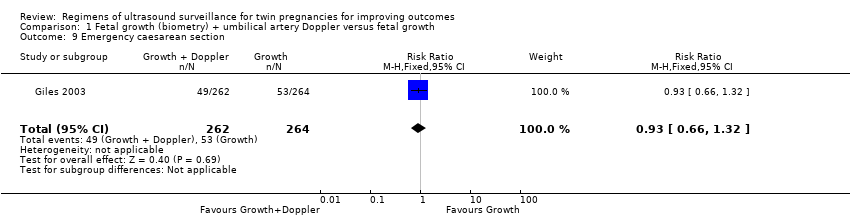
Comparison 1 Fetal growth (biometry) + umbilical artery Doppler versus fetal growth, Outcome 9 Emergency caesarean section.
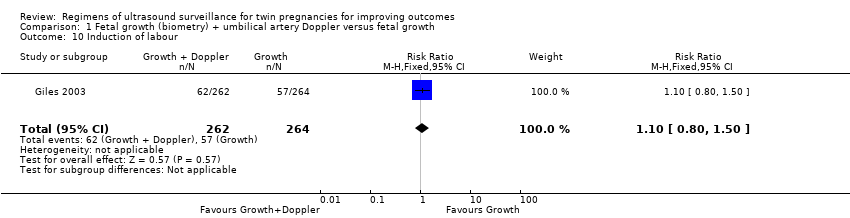
Comparison 1 Fetal growth (biometry) + umbilical artery Doppler versus fetal growth, Outcome 10 Induction of labour.

Comparison 1 Fetal growth (biometry) + umbilical artery Doppler versus fetal growth, Outcome 11 Antenatal admission to hospital.
| Fetal growth + umbilical artery Doppler versus fetal growth for twin pregnancies for improving outcomes | ||||||
| Patient or population: women with twin pregnancies were randomised from 25 weeks | ||||||
| Outcomes | Anticipated absolute effects* (95% CI) | Relative effect | № of participants | Quality of the evidence | Comments | |
| Risk with fetal growth + umbilical artery Doppler | Risk with fetal growth | |||||
| Perinatal mortality (after randomisation) | Study population | RR 0.88 | 1052 | ⊕⊕⊝⊝ | ||
| 15 per 1000 | 13 per 1000 | |||||
| Neonatal death | Study population | RR 1.01 | 1052 | ⊕⊕⊝⊝ | ||
| 9 per 1000 | 10 per 1000 | |||||
| Birth less than 28 weeks | ‐ | ‐ | ‐ | ‐ | ‐ | The trial included in this review did not report this outcome. |
| Gestational age at birth (weeks) | The mean gestational age at birth was 35.8 weeks | The mean gestational age at birth was 35.7 weeks | MD 0.10 weeks longer with growth plus Doppler | 526 | ⊕⊕⊕⊝ | |
| Caesarean section (any) | Study population | RR 1.00 | 526 | ⊕⊕⊕⊕ | ||
| 409 per 1000 | 409 per 1000 | |||||
| Induction of labour | Study population | RR 1.10 | 526 | ⊕⊕⊕⊝ | ||
| 216 per 1000 | 238 per 1000 | |||||
| Antenatal admission to hospital | Study population | RR 0.96 | 526 | ⊕⊕⊕⊕ | ||
| 477 per 1000 | 458 per 1000 | |||||
| *The risk in the intervention group (and its 95% confidence interval) is based on the assumed risk in the comparison group and the relative effect of the intervention (and its 95% CI). | ||||||
| GRADE Working Group grades of evidence | ||||||
| 1 Events are rare and wide confidence intervals cross line of no effect (‐2). | ||||||
| Outcome or subgroup title | No. of studies | No. of participants | Statistical method | Effect size |
| 1 Perinatal mortality (post randomisation) Show forest plot | 1 | 1052 | Risk Ratio (M‐H, Fixed, 95% CI) | 0.88 [0.32, 2.41] |
| 2 Stillbirth Show forest plot | 1 | 526 | Risk Ratio (M‐H, Fixed, 95% CI) | 0.67 [0.11, 3.99] |
| 3 Neonatal death Show forest plot | 1 | 1052 | Risk Ratio (M‐H, Fixed, 95% CI) | 1.01 [0.29, 3.46] |
| 4 Gestational age at birth Show forest plot | 1 | 526 | Mean Difference (IV, Fixed, 95% CI) | 0.10 [‐0.39, 0.59] |
| 5 Infant requiring ventilation Show forest plot | 1 | 1052 | Risk Ratio (M‐H, Fixed, 95% CI) | 0.86 [0.59, 1.25] |
| 6 Admission to special care or intensive care units Show forest plot | 1 | 1052 | Risk Ratio (M‐H, Fixed, 95% CI) | 0.96 [0.88, 1.05] |
| 7 Caesarean section any Show forest plot | 1 | 526 | Risk Ratio (M‐H, Fixed, 95% CI) | 1.00 [0.81, 1.23] |
| 8 Elective caesarean section Show forest plot | 1 | 526 | Risk Ratio (M‐H, Fixed, 95% CI) | 1.06 [0.77, 1.47] |
| 9 Emergency caesarean section Show forest plot | 1 | 526 | Risk Ratio (M‐H, Fixed, 95% CI) | 0.93 [0.66, 1.32] |
| 10 Induction of labour Show forest plot | 1 | 526 | Risk Ratio (M‐H, Fixed, 95% CI) | 1.10 [0.80, 1.50] |
| 11 Antenatal admission to hospital Show forest plot | 1 | 526 | Risk Ratio (M‐H, Fixed, 95% CI) | 0.96 [0.80, 1.15] |