改善双胎妊娠结局的超声监测方案
摘要
研究背景
由于并发症的风险较高,增加对双胎妊娠的超声监测已成为公认的做法。然而,关于超声监测最佳照护的方法和频率目前尚无共识。
研究目的
系统地评价不同类型和频率的超声监测对双胎妊娠孕妇的新生儿、胎儿和孕产妇结局的影响。
检索策略
我们检索了Cochrane妊娠和分娩试验注册库(Cochrane Pregnancy and Childbirth’s Trials Register),美国临床试验注册平台(ClinicalTrials.gov)和世界卫生组织国际临床试验注册平台(WHO ICTRP)(所有检索截至2017年8月11日)以及相关研究的参考文献列表。
纳入排除标准
随机和半随机试验(包括那些以摘要形式发表的试验)比较所述产前超声监测方案在双胎妊娠中的效果。采用集群随机设计的试验符合本系统综述的纳入条件,但未发现任何试验。使用交叉设计的试验不符合本系统综述的纳入标准。
比较不同类型和频率的超声检测(用于胎儿监测和特定问题的检测),或将其与不检测比较。例如,干预可能包括一种特定的超声检查方法,使用专用组件检测双胞胎特异性病状。不同的干预措施还可以包括不同时间段的特定类型的监测或相同时间段的不同组合。
在本系统综述中,我们仅发现一项研究在妊娠25、30和35周时对比胎儿生长检查(生物测定)和多普勒超声与单独胎儿生长检查。
资料收集与分析
两名综述作者独立评价纳入的试验和质量,并提取资料。我们核对资料以确保准确性。
主要结果
在本系统综述中,我们纳入了一项526名双胎妊娠妇女的试验,其中有两个存活的双胞胎,没有已知的形态学异常。该试验将妊娠25、30和35周时接受胎儿生长检查和多普勒超声检查的女性与仅接受胎儿生长检查的女性进行了比较。我们判断纳入研究的偏倚风险为低,但实施和检测偏倚的风险为不明确。
主要结局是围产期死亡率(随机分组后),没有证据表明胎儿生长检查+多普勒组和单独胎儿生长检查组之间的围产期死亡率存在明显差异(风险比(risk ratio, RR)=0.88,95% 置信区间(confidence interval, CI) [0.32, 2.41],低质量证据),两组围产期死亡率接近(多普勒+胎儿生长检查组发生7例,单独胎儿生长检查组出现8例)。本系统篇综述中两种方案的其他结局没有明显差异:死产(RR=0.67,95% CI [0.11, 3.99]),新生儿死亡(RR=1.01,95% CI [0.29, 3.46],低质量证据),胎龄(周)(均差=0.10,95% CI [‐0.39, 0.59],中等质量证据),需要呼吸机的婴儿(RR=0.86,95% CI [0.59, 1.25]),入住特殊护理或重症监护室(RR=0.96, 95% CI [0.88, 1.05]),剖腹产(任何情况)(RR=1.00,95% CI [0.81, 1.23],高质量证据),择期剖宫产(RR=1.06,95% CI [0.77, 1.47]),紧急剖腹产(RR=0.93,95% CI [0.66, 1.32]),引产(RR=1.10,95% CI [0.80, 1.50],中等质量证据)或产前住院(RR=0.96,95% CI [0.80, 1.15],高质量证据)。纳入的研究未报告妊娠28周前早产的数量。就死亡率相关结局而言,事件数量较小。
纳入的研究没有报告孕产妇和婴儿的大多数次要结局。未报告的婴儿结局包括胎儿酸中毒、5分钟Apgar评分低于7分以及37周和34周之前早产。未报告孕产妇的结局:产前住院时间、重大并发症的及时诊断、早产率、胎膜早破率及孕产妇对照护的满意度。该研究没有根据绒毛膜性对双胞胎妊娠进行分类。绒毛膜性意识可提高该资料集的适用性。
由于效果评估的不精确性,我们对使用GRADE评价的结局质量进行了降级。
作者结论
本系统综述基于一项小型研究,该研究在检测围产期死亡率、死产和新生儿死亡等罕见结局方面的把握度不足。
随机对照试验的证据不足,无法为照护双胎妊娠妇女的胎儿超声监测方案的最佳实践提供信息。需要更多的研究来评价目前使用的超声监测方案对双胎妊娠的影响。未来的研究可以报告本系统综述中所列的重要母婴结局。
PICO
简语概要
双胎妊娠妇女的超声检查
本系统综述探讨的问题是什么?
多胎妊娠是导致不良分娩结局的重要原因。
双胎妊娠通常比单胎妊娠更复杂。一个或两个婴儿的生长受限、分娩前胎膜早破以及37周前早产风险增加都可能导致婴儿死亡和健康状况不佳。
怀双胞胎的女性通常会定期进行超声波扫描,以检查正在发育的婴儿的健康状况。可以进行不同类型的扫描检查。定期超声波扫描可用于检查婴儿的大小和生长情况。还可以估计每个婴儿周围的液体量,并且可以使用多普勒超声测量通过脐带的血流和婴儿体内的血流质量。我们不知道妇女及其婴儿的最佳安排表,也不知道它是否对妊娠的管理和结局有任何影响。
本系统综述为什么如此重要?
目前我们不知道不同的扫描时间和方式如何使双胎妊娠的孕妇在改善出生结局方面受益。查明这一点意味着可以有效监测双胎妊娠的孕妇,并且可以在对胎儿和产妇最安全的时候进行分娩。
我们找到哪些证据?
我们在2017年8月检索了随机对照试验。我们发现了一项低偏倚风险的多中心研究。这项研究涉及526名健康双胎妊娠的孕妇,这些双胞胎在超声波检查中似乎形态正常。这些女性在怀孕25周、30周和35周时接受扫描检查,随机分为测量婴儿的生长情况和婴儿的生长加血流情况。不同测试的结果相似。研究发现单独生长检查和生长检查加血流检查,在晚期妊娠、出生时或出生后28天内死亡的婴儿数量上没有明显差异。入住特殊护理病房或需要辅助呼吸(呼吸机)的婴儿数量也没有明显差异。我们发现,接受选择性剖腹产或紧急剖腹产的产妇人数以及怀孕期间入院的孕产妇人数没有差异(均为高质量证据)。不同类型的扫描对女性是否早产或是否必须引产没有影响(中等质量证据)。没有关于妊娠期间重大并发症的诊断、怀孕28周前的早产或妊娠对照护满意度的信息。
该研究没有根据双胞胎是否共享围绕它们的最外层膜(他们的绒毛膜性)对怀孕进行分组。如果双胞胎共享最外层膜,那这两个婴儿也共用同一个胎盘且血液流通交融,这增加了双胞胎相关并发症的可能性。
这意味着什么?
从这项研究中,我们仍然不知道不同的扫描测试以及它们的进行频率是否可以改善双胎妊娠孕妇的结局。未来的研究可能会发现不同扫描方式在婴儿死亡人数上存在差异。需要进行更多的研究以确定扫描的频率和检查细节,以便了解双胞胎是否正常生长并快速发现任何问题。
Authors' conclusions
Summary of findings
| Fetal growth + umbilical artery Doppler versus fetal growth for twin pregnancies for improving outcomes | ||||||
| Patient or population: women with twin pregnancies were randomised from 25 weeks | ||||||
| Outcomes | Anticipated absolute effects* (95% CI) | Relative effect | № of participants | Quality of the evidence | Comments | |
| Risk with fetal growth + umbilical artery Doppler | Risk with fetal growth | |||||
| Perinatal mortality (after randomisation) | Study population | RR 0.88 | 1052 | ⊕⊕⊝⊝ | ||
| 15 per 1000 | 13 per 1000 | |||||
| Neonatal death | Study population | RR 1.01 | 1052 | ⊕⊕⊝⊝ | ||
| 9 per 1000 | 10 per 1000 | |||||
| Birth less than 28 weeks | ‐ | ‐ | ‐ | ‐ | ‐ | The trial included in this review did not report this outcome. |
| Gestational age at birth (weeks) | The mean gestational age at birth was 35.8 weeks | The mean gestational age at birth was 35.7 weeks | MD 0.10 weeks longer with growth plus Doppler | 526 | ⊕⊕⊕⊝ | |
| Caesarean section (any) | Study population | RR 1.00 | 526 | ⊕⊕⊕⊕ | ||
| 409 per 1000 | 409 per 1000 | |||||
| Induction of labour | Study population | RR 1.10 | 526 | ⊕⊕⊕⊝ | ||
| 216 per 1000 | 238 per 1000 | |||||
| Antenatal admission to hospital | Study population | RR 0.96 | 526 | ⊕⊕⊕⊕ | ||
| 477 per 1000 | 458 per 1000 | |||||
| *The risk in the intervention group (and its 95% confidence interval) is based on the assumed risk in the comparison group and the relative effect of the intervention (and its 95% CI). | ||||||
| GRADE Working Group grades of evidence | ||||||
| 1 Events are rare and wide confidence intervals cross line of no effect (‐2). | ||||||
Background
Description of the condition
The incidence of twin pregnancies has been increasing over the last 30 years due to the use of fertility treatments and older maternal age at conception (Russell 2003). Twin pregnancies arise from either the fertilisation of two separate eggs (dizygotic twins), or from fertilisation of a single egg with subsequent division (monozygotic twins). Monozygotic twin births occur all over the world at a constant rate of 3.5 per 1000 births however, dizygotic twin births range from 6.7 per 1000 births in Japan to a high of 40 per 1000 births in Nigeria (Dodd 2010).
Multiple pregnancies are an important contributor to poor perinatal and neonatal outcomes (Chauhan 2010), however, there is minimal guidance from good‐quality studies as to the best form of surveillance (Dodd 2005). Many factors contribute to poor outcomes in twin pregnancies. The risk of preterm birth (birth before 37 weeks duration of pregnancy) in a twin pregnancy is at least five times higher than a singleton pregnancy (Blondel 2002). In addition, higher rates of fetal growth restriction and preterm prelabour rupture of membranes increase perinatal mortality as well as short‐term and long‐term morbidity for women and their infants.
Monochorionic twins (a subset of monozygotic twin pregnancies) share the same placental mass and fetoplacental circulation, as a result they are particularly prone to developing specific twin‐related complications (Dube 2002; Hack 2008). Monochorionic twins can be MCDA (monochorionic diamniotic) or MCMA (monochorionic monoamniotic). MCDA pregnancies are at risk of a range of complications due to unequal placental sharing. Twin‐to‐twin transfusion syndrome (TTTS) results from the shunting of blood from one twin to another across vascular anastomoses (blood vessel connections) in a shared placenta resulting in one twin having insufficient blood and the other having too much blood. It is characterised by oligohydramnios and polyhydramnios (too little fluid around one twin and too much fluid around the other) and can result in severe complications for both twins, especially if the diagnosis is missed or delayed (Baud 2014). Selective growth restriction can also arise from unequal placental sharing and therefore unequal blood distribution. Monoamniotic twins (another subset of monozygotic twins) share the same placenta and the same gestational sac, therefore they are at risk of cord entanglement which can result in fetal loss and neurologic morbidity in surviving infants due to acute hypotension, anaemia and ischaemia (Su 2002).
Description of the intervention
Increased ultrasound surveillance of twin pregnancies due to the higher risk of complications is accepted practice (NICE 2011). There is no current consensus however, as to what methods and frequency of monitoring constitutes optimal care. Ultrasound methods used to monitor twin pregnancies include measuring and documenting/charting fetal growth (biometry), amniotic fluid deepest pools, the presence or absence of the fetal bladder(s), Doppler ultrasound of the umbilical artery and the middle cerebral artery and the biophysical profile (a score out of 8 for fetal well‐being which includes fetal movement, fetal breathing, fetal tone, amniotic fluid volume and fetal heart rate). Regimens that have been recommended include monthly growth ultrasounds for dichorionic twins (with separate placentas) and two‐weekly ultrasound from 16 to 24 weeks for monochorionic twins (with a shared placental mass) to monitor for TTTS (ACOG Practice Bulletin 2004; NICE 2011).
Multiple pregnancies have a significant impact on the psychosocial heath of women. Women's needs and preferences should be taken into consideration. Satisfaction with pregnancy care including clear explanations of any problems that arise can assist in alleviating maternal anxiety.
How the intervention might work
Increased ultrasound surveillance of twin pregnancies due to the higher risk of complications is accepted practice. There is no current consensus however, as to what methods and frequency of monitoring constitutes optimal care. At minimum, ultrasound and fetal growth measurements should be used in the diagnosis of intrauterine growth restriction. The National Institute for Health and Care Excellence (NICE) guidelines published by the Royal College of Obstetricians and Gynaecologists (NICE 2011) highlight that there are no available evidence‐based growth charts specific to twin and triplet pregnancies for use in the diagnosis of intrauterine growth restriction, limiting the accuracy of diagnosis. Both growth restriction and growth discordance in fetuses of multiple pregnancies however, increase the risk of neonatal mortality (Branum 2003).
The aim and intended outcome of any ultrasound surveillance regimen is to identify complications in a timely manner, and plan subsequent surveillance, which then guides timing and type of treatment. There are very limited data however evaluating the usefulness of ultrasound surveillance in a twin pregnancy. In uncomplicated twin pregnancies, routine Doppler ultrasound of the umbilical artery has not been shown to alter neonatal outcome (Giles 2003). In twin pregnancies with growth discordance of at least 15%, ultrasound evaluation in the third trimester to estimate fetal weight (using the biparietal diameter, abdominal circumference and femur length) and to assess umbilical artery velocimetry have assisted in the detection of growth discordance, however it has not been established if this alters neonatal outcome (Chittacharoen 2000). The usefulness of amniotic fluid volumes or biophysical profile similarly have not been validated. For the detection of TTTS however, frequent monitoring of amniotic fluid discordance, the presence or absence of a fetal bladder and Doppler velocimetry are all important tools in the diagnosis and prognosis of TTTS. The starting gestation and frequency of this monitoring however has not been established (Taylor 2002).
Why it is important to do this review
The type and frequency of surveillance recommended in different guidelines is not consistent and often a broad range of possibilities is provided. This review aims to assess the effects of different ultrasound surveillance regimens for women with twin pregnancies and their effect on perinatal and neonatal outcomes.
Objectives
To systematically review the effects of different types and frequency of ultrasound surveillance for women with a twin pregnancy on neonatal, fetal and maternal outcomes.
Methods
Criteria for considering studies for this review
Types of studies
We included randomised controlled trials and quasi‐randomised studies. Trials using a cluster‐randomised design were eligible for inclusion. Trials using a cross‐over design were not included. We included studies published in abstract form.
Types of participants
Women who were pregnant with twins with no specific diagnosis of a pregnancy‐related twin‐specific complication (i.e. not already diagnosed with any of the problems the intervention would be looking or screening for).
Types of interventions
Different types and frequencies of ultrasound testing (for fetal surveillance and detection of specific problems) compared with each other and also compared with no testing. For example, an intervention might comprise a specific approach to ultrasound examination with dedicated components to detect twin‐specific pathology. Different interventions could also include a specific type of surveillance at different intervals or different combinations at the same intervals.
Types of outcome measures
Primary outcomes
The primary outcome was perinatal mortality (after randomisation).
Secondary outcomes
Infant/fetal outcomes
-
Stillbirth
-
Neonatal death
-
Serious neonatal morbidity ‐ composite outcome including hypoxic ischaemic encephalopathy, intraventricular haemorrhage, bronchopulmonary dysplasia, necrotising enterocolitis
-
Fetal acidosis
-
Apgar score less than 7 at five minutes
-
Preterm birth less than 37 weeks
-
Preterm birth less than 34 weeks
-
Preterm birth less than 28 weeks
-
Gestational age at birth (weeks)
-
Admission to neonatal special care or intensive care unit, or both
-
Length of stay in neonatal special care or intensive care unit
-
Neonatal seizures (seizures in the neonatal period, either apparent clinically or detected by electro‐encephalographic recordings)
-
Interventricular haemorrhage
-
Hypoxic ischaemic encephalopathy, as defined by trialists
-
Infant requiring intubation or ventilation
-
Infant respiratory distress syndrome
-
Neurodevelopmental disability at more than 12 months (assessed by a validated tool, e.g. Bayley Scale)
-
Other long‐term infant/child neurodevelopmental outcome
Maternal outcomes
-
Caesarean section (any)
-
Elective caesarean section
-
Emergency caesarean section
-
Induction of labour
-
Antenatal hospital admission
-
Length of antenatal hospital stay
-
Preterm prelabour ruptured membranes
-
Timely diagnosis of significant complications (as defined by trialists)
-
Women's satisfaction with care
-
Women's views of their care
-
Emotional distress/depression/anxiety for the woman
Search methods for identification of studies
The following methods section of this review is based on a standard template used by Cochrane Pregnancy and Childbirth.
Electronic searches
We searched Cochrane Pregnancy and Childbirth’s Trials Register by contacting their Information Specialist (11 August 2017).
The Register is a database containing over 23,000 reports of controlled trials in the field of pregnancy and childbirth. For full search methods used to populate Pregnancy and Childbirth’s Trials Register including the detailed search strategies for CENTRAL, MEDLINE, Embase and CINAHL; the list of handsearched journals and conference proceedings, and the list of journals reviewed via the current awareness service, please follow this link to the editorial information about the Cochrane Pregnancy and Childbirth in the Cochrane Library and select the ‘Specialized Register’ section from the options on the left side of the screen.
Briefly, Cochrane Pregnancy and Childbirth’s Trials Register is maintained by their Information Specialist and contains trials identified from:
-
monthly searches of the Cochrane Central Register of Controlled Trials (CENTRAL);
-
weekly searches of MEDLINE (Ovid);
-
weekly searches of Embase (Ovid);
-
monthly searches of CINAHL (EBSCO);
-
handsearches of 30 journals and the proceedings of major conferences;
-
weekly current awareness alerts for a further 44 journals plus monthly BioMed Central email alerts.
Search results are screened by two people and the full text of all relevant trial reports identified through the searching activities described above is reviewed. Based on the intervention described, each trial report is assigned a number that corresponds to a specific Pregnancy and Childbirth review topic (or topics), and is then added to the Register. The Information Specialist searches the Register for each review using this topic number rather than keywords. This results in a more specific search set that has been fully accounted for in the relevant review sections (Included studies; Excluded studies).
In addition, we searched ClinicalTrials.gov and the WHO International Clinical Trials Registry Platform (ICTRP) (11 August 2017) for unpublished, planned and ongoing trial reports using the terms given in Appendix 1.
Searching other resources
We searched the reference lists of retrieved studies.
We did not apply any language or date restrictions.
Data collection and analysis
The following methods section of this review is based on a standard template used by Cochrane Pregnancy and Childbirth.
Selection of studies
Two review authors independently assessed for inclusion all the potential studies identified as a result of the search strategy. We resolved any disagreement through discussion, we did not need to consult a third person.
Data extraction and management
We designed a form to extract data. For eligible studies, two review authors extracted the data using the agreed form. We resolved discrepancies through discussion or, if required, we planned to consult a third author. We entered data into Review Manager 5 (RevMan 5) software (RevMan 2014) and checked for accuracy.
When information regarding any of the above was unclear, we attempted to contact authors of the original reports to provide further details.
Assessment of risk of bias in included studies
Two review authors independently assessed risk of bias for each study using the criteria outlined in the Cochrane Handbook for Systematic Reviews of Interventions (Higgins 2011a). We resolved any disagreement by discussion or by involving a third assessor.
(1) Random sequence generation (checking for possible selection bias)
We described for each included study the method used to generate the allocation sequence in sufficient detail to allow an assessment of whether it should produce comparable groups.
We assessed the method as:
-
low risk of bias (any truly random process, e.g. random number table; computer random number generator);
-
high risk of bias (any non‐random process, e.g. odd or even date of birth; hospital or clinic record number);
-
unclear risk of bias.
(2) Allocation concealment (checking for possible selection bias)
We described for each included study the method used to conceal allocation to interventions prior to assignment and assessed whether intervention allocation could have been foreseen in advance of, or during recruitment, or changed after assignment.
We assessed the methods as:
-
low risk of bias (e.g. telephone or central randomisation; consecutively numbered, sealed opaque envelopes);
-
high risk of bias (open, random allocation; unsealed or non‐opaque envelopes, alternation; date of birth);
-
unclear risk of bias.
(3.1) Blinding of participants and personnel (checking for possible performance bias)
We described for each included study the methods used, if any, to blind study participants and personnel from knowledge of which intervention a participant received. We considered studies at low risk of bias if they were blinded, or if we judged that the lack of blinding would have been unlikely to affect results. We assessed blinding separately for different outcomes or classes of outcomes.
We assessed the methods as:
-
low, high or unclear risk of bias for participants;
-
low, high or unclear risk of bias for personnel.
(3.2) Blinding of outcome assessment (checking for possible detection bias)
We described for each included study the methods used, if any, to blind outcome assessors from knowledge of which intervention a participant received. We assessed blinding separately for different outcomes or classes of outcomes.
We assessed methods used to blind outcome assessment as:
-
low, high or unclear risk of bias.
(4) Incomplete outcome data (checking for possible attrition bias due to the amount, nature and handling of incomplete outcome data)
We described for each included study, and for each outcome or class of outcomes, the completeness of data including attrition and exclusions from the analysis. We stated whether attrition and exclusions were reported and the numbers included in the analysis at each stage (compared with the total randomised participants), reasons for attrition or exclusion where reported, and whether missing data were balanced across groups or were related to outcomes. Where sufficient information was reported, or could be supplied by the trial authors, we re‐included missing data in the analyses that we undertook.
We assessed methods as:
-
low risk of bias (e.g. no missing outcome data; missing outcome data balanced across groups);
-
high risk of bias (we planned to use a level of 20% of missing data to classify a study as low risk of bias due to incomplete outcome data) (e.g. numbers or reasons for missing data imbalanced across groups; ‘as‐treated’ analysis done with substantial departure of intervention received from that assigned at randomisation);
-
unclear risk of bias.
(5) Selective reporting (checking for reporting bias)
We described for each included study how we investigated the possibility of selective outcome reporting bias and what we found.
We assessed the methods as:
-
low risk of bias (where it was clear that all of the study’s pre‐specified outcomes and all expected outcomes of interest to the review had been reported);
-
high risk of bias (where not all the study’s pre‐specified outcomes had been reported; one or more reported primary outcomes were not pre‐specified; outcomes of interest were reported incompletely and so could not be used; study failed to include results of a key outcome that would have been expected to have been reported);
-
unclear risk of bias.
(6) Other bias (checking for bias due to problems not covered by (1) to (5) above)
We described for each included study any important concerns we had about other possible sources of bias.
We assessed whether each study was free of other problems that could put it at risk of bias:
-
low risk of other bias;
-
high risk of other bias;
-
unclear whether there is risk of other bias.
(7) Overall risk of bias
We made explicit judgements about whether studies were at high risk of bias, according to the criteria given in the Cochrane Handbook for Systematic Reviews of Interventions (Higgins 2011a). With reference to (1) to (6) above, we assessed the likely magnitude and direction of the bias and whether we considered it was likely to impact on the findings. We explored the impact of the level of bias through undertaking sensitivity analyses ‐ see Sensitivity analysis.
Assessing the quality of the body of evidence using the GRADE approach
We assessed the quality of the evidence using the GRADE approach as outlined in the GRADE Handbook in order to assess the quality of the body of evidence relating to the following outcomes (Guyatt 2008).
-
Perinatal mortality (after randomisation)
-
Neonatal death
-
Preterm birth less than 28 weeks
-
Gestational age at birth (weeks)
-
Caesarean section (any)
-
Induction of labour
-
Antenatal admission to hospital
The comparison used to assess the quality of evidence was standard growth + umbilical artery Doppler versus standard growth.
We used the GRADEpro Guideline Development Tool (GRADEpro GDT 2015) to import data from Review Manager 5 (RevMan 5) (RevMan 2014) in order to create 'Summary of findings' tables. We produced a summary of the intervention effect and a measure of quality for each of the above outcomes using the GRADE approach. The GRADE approach uses five considerations (study limitations, consistency of effect, imprecision, indirectness and publication bias) to assess the quality of the body of evidence for each outcome. The evidence can be downgraded from 'high quality' by one level for serious (or by two levels for very serious) limitations, depending on assessments for risk of bias, indirectness of evidence, serious inconsistency, imprecision of effect estimates or potential publication bias.
Measures of treatment effect
Dichotomous data
For dichotomous data, we presented results as a summary risk ratio with 95% confidence intervals.
Continuous data
For continuous data, we used the mean difference if outcomes were measured in the same way between trials. We used the standardised mean difference to combine trials that measured the same outcome, but used different methods.
Unit of analysis issues
Cluster‐randomised trials
We did not identify any cluster‐randomised trials in the search. in future updates of this review, should we identify cluster‐randomised trials we will include them in the analyses along with individually‐randomised trials. We will adjust their sample sizes using the methods described in the Cochrane Handbook of Systematic Reviews of Interventions (Section 16.3.4 or 16.3.6; Higgins 2011b), using an estimate of the intracluster correlation co‐efficient (ICC) derived from the trial (if possible), from a similar trial or from a study of a similar population. If we use ICCs from other sources, we will report this and conduct sensitivity analyses to investigate the effect of variation in the ICC. If we identify both cluster‐randomised trials and individually‐randomised trials, we plan to synthesise the relevant information. We consider it reasonable to combine the results from both if there is little heterogeneity between the study designs and the interaction between the effect of intervention and the choice of randomisation unit is considered to be unlikely.
We will acknowledge heterogeneity in the randomisation unit and perform a sensitivity analysis to investigate the effects of the randomisation unit.
Cross‐over trials
Cross‐over trials are not eligible for inclusion in this review.
Other unit of analysis issues
In future review updates, if we identify trials with multiple‐arms, we will attempt to overcome unit of analysis errors by combining groups to create a single pair‐wise comparison or select one pair of interventions and exclude the others.
Multiple pregnancy
Special methods are needed when carrying out analysis of outcomes for babies from multiple pregnancies (Gates 2004). Outcomes in babies from multiple pregnancies are not independent. For many outcomes there will be a higher correlation between babies from the same pregnancy than between babies from different pregnancies. The degree of non‐independence of outcomes for babies from multiple pregnancies will vary considerably depending on the outcome and the type of multiple pregnancy; for some outcomes an adverse event in one twin will almost invariably be associated with the same event in the other (e.g. preterm birth); for other outcomes the degree of correlation will be lower (e.g. fetal death), but still higher than for babies from different pregnancies. In view of this non‐independence, we intended to treat babies from the same pregnancy as clusters and adjust the data using the methods described above for cluster‐randomised trials. We intended to obtain ICCs from the trials, where possible, or use ICCs from similar studies. However, our experience on other reviews suggests that published ICCs for multiple pregnancies are frequently not available. In this case, we planned to estimate ICCs (based on clinical knowledge and data from observational studies) and carry out sensitivity analysis using a range of plausible ICC values. For the sole included study in this review, we noted that the trial authors had already made adjustments for multiple pregnancy so we did not make any further adjustments.
Dealing with missing data
For the one included study, we noted levels of attrition. In future updates, if more studies are identified, we will explore the impact of including studies with high levels of missing data in the overall assessment of treatment effect by using sensitivity analysis.
For all outcomes, we carried out analyses, as far as possible, on an intention‐to‐treat basis, that is, we attempted to include all participants randomised to each group in the analyses, and all participants were analysed in the group to which they had been allocated, regardless of whether or not they received the allocated intervention. The denominator for each outcome in each trial was the number randomised minus any participants whose outcomes were known to be missing.
Assessment of heterogeneity
We included only one study in this review, therefore meta‐analyses were not possible. If there are more studies in future updates of the review we will assess statistical heterogeneity in each meta‐analysis using the Tau², I² (Higgins 2003) and Chi² statistics. We will regard heterogeneity as substantial if an I² statistic is greater than 30% and either a Tau² is greater than zero, or there is a low P value (less than 0.10) in the Chi² test for heterogeneity (Deeks 2011).
Assessment of reporting biases
In future updates if there are 10 or more studies in the meta‐analysis we will investigate reporting biases (such as publication bias) using funnel plots. We will assess funnel plot asymmetry visually. If asymmetry is suggested by a visual assessment, we will perform exploratory analyses to investigate it.
Data synthesis
We carried out statistical analysis using the RevMan 5 software (RevMan 2014). As we only included a single trial in the review we could not perform meta‐analyses. In future updates we will use fixed‐effect meta‐analysis for combining data where it is reasonable to assume that studies are estimating the same underlying treatment effect: that is, where trials are examining the same intervention, and we judge the trials’ populations and methods to be sufficiently similar. If there is clinical heterogeneity sufficient to expect that the underlying treatment effects differ between trials, or if substantial statistical heterogeneity is detected, we will use random‐effects meta‐analysis to produce an overall summary, if an average treatment effect across trials is considered clinically meaningful. The random‐effects summary will be treated as the average range of possible treatment effects and we will discuss the clinical implications of treatment effects differing between trials. If the average treatment effect is not clinically meaningful, we will not combine trials.
If we use random‐effects analyses, the results will be presented as the average treatment effect with 95% confidence intervals, and the estimates of Tau² and I² statistic.
Subgroup analysis and investigation of heterogeneity
As we only included one study, we did not assess heterogeneity. If we identify substantial heterogeneity in future updates, we will investigate it using subgroup analyses and sensitivity analyses. We will consider whether an overall summary is meaningful, and if it is, use random‐effects analysis to produce it.
In future updates we plan to carry out the following subgroup analysis: dichorionic (DCDA) versus monochorionic (MCDA and MCMA) pregnancies. We will use the primary outcome only, perinatal mortality.
We will assess subgroup differences by interaction tests available within RevMan 5 (RevMan 2014). We will report the results of subgroup analyses quoting the Chi2 statistic and P value, and the interaction test I² value.
Sensitivity analysis
We did not carry out planned sensitivity analysis due to insufficient data. In future updates we will carry out planned sensitivity analyses, where appropriate, to explore the effects of trial quality, as assessed by concealment of allocation or missing data for a particular outcome on the summary statistic, and to examine the effect of the 'unit of randomisation' if any cluster‐randomised controlled trials are included. We will exclude studies of poor quality from the analysis in order to assess for any substantive difference to the overall result. We will restrict sensitivity analysis to the primary outcome.
Results
Description of studies
Results of the search
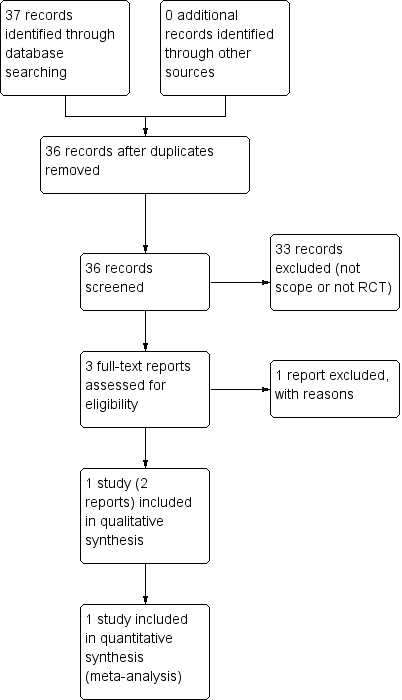
See: Figure 1.

Study flow diagram
The search identified 37 reports. After screening, we found three potentially relevant reports. We excluded one because it did not proceed to a randomised controlled trial (Holohan 1987). We therefore included only one study (two reports) (Giles 2003).
Included studies
The included study by Giles 2003 involved a total of 526 women in a twin pregnancy with two viable, apparently normally formed twins on ultrasound, at 25 weeks' gestation. The study was conducted in tertiary‐level referral hospitals in Australia, New Zealand and South West Asia. Women were randomised to the trial between March 1993 and March 1997. Women were randomised to receive Doppler and fetal growth (biometry) at 25, 30 and 35 weeks' gestation or to receive fetal growth only at the same time points. Outcomes included primary outcome of perinatal mortality (after randomisation), and a range of maternal and fetal/infant secondary outcomes.
The included study did not report any trial funding sources or declarations of interest.
Excluded studies
The excluded study was planning to assess continuous wave Doppler in twin pregnancies but was discontinued before reaching the stage of being a randomised controlled trial (Holohan 1987).
Risk of bias in included studies
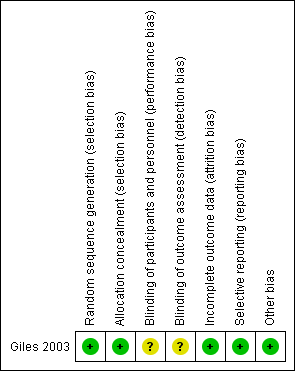
See table of Characteristics of included studies, Figure 2.

Risk of bias summary: review authors' judgements about each risk of bias item for each included study.
Allocation
We judged the included study to be at low risk of bias for both adequate sequence generation and allocation concealment (Giles 2003).
Blinding
We judged the included study (Giles 2003) to be at unclear risk of performance bias and detection bias as the authors did not state whether any blinding or masking occurred.
Incomplete outcome data
We considered the included study (Giles 2003) to be at low risk of bias due to attrition, as the authors reported low rates of loss to follow‐up. Only 13 out of 539 participants were lost to follow‐up and could not, therefore, be included in the analysis. Of the 271 women randomised to the no Doppler group, 264 could be included, that is, seven out of 271 were lost to follow‐up (2.58%). Of the 268 women randomised to the Doppler group, 262 could be included in the analysis, that is, six out of 268 (2.24%) were lost to follow‐up.
Selective reporting
We judged the included study to be at low risk of bias due to selective reporting.
Other potential sources of bias
We considered that the included study (Giles 2003) was at low risk of bias from other sources.
Effects of interventions
Meta‐analysis was not possible in this review because we only identified one published study (Giles 2003) involving 526 women looking at the use of umbilical artery Doppler with fetal growth (biometry) for the surveillance of twins at 25, 30 and 35 weeks' gestation as compared to fetal growth alone.
Fetal growth (biometry) + umbilical artery Doppler versus fetal growth
Primary outcome
Perinatal mortality
The perinatal mortality rate was very similar in fetal growth alone and fetal growth plus Doppler groups (Analysis 1.1) (risk ratio (RR) 0.88, 95% confidence interval (CI) 0.32 to 2.41; 1052 infants, one trial, low‐quality evidence). Perinatal death occurred less than was expected by the trialists (Giles 2003) which affected the precision of the effect estimate.
Secondary outcomes
Infant
Where data were available for secondary outcomes related to infant health, there was no evidence of a difference between the two groups. This included no difference in the rate of stillbirths (Analysis 1.2) (RR 0.67, 95% CI 0.11 to 3.99, 526 women, one trial) or neonatal deaths (Analysis 1.3) (RR 1.01, 95% CI 0.29 to 3.46, 1052 infants, one trial, low‐quality evidence) and no difference in the gestational age at birth (weeks) (Analysis 1.4) (mean difference 0.10, 95% CI ‐0.39 to 0.59, 526 women, one trial, moderate‐quality evidence), requirement for intubation or ventilation (Analysis 1.5) (RR 0.86, 95% CI 0.59 to 1.25, 1052 infants, one trial) or admissions to neonatal special care or intensive care unit (Analysis 1.6) (RR 0.96, 95% CI 0.88 to 1.05, 1052 infants, one trial).
No data were available for some of the outcomes related to serious morbidity including fetal acidosis, Apgar score less than 7 at five minutes, preterm birth (less than 37, 34 and 28 weeks), length of stay in neonatal special care or intensive care unit, neonatal seizures, interventricular haemorrhage, hypoxic ischaemic encephalopathy or infant respiratory distress syndrome. Also, no follow‐up was performed so there were no data on longer‐term neurodevelopmental disability.
Maternal
Similar rates of caesarean sections (elective or emergency) were reported in both allocated groups (Analysis 1.7, Analysis 1.8, Analysis 1.9) (any caesarean section: RR 1.00, 95% CI 0.81 to 1.23, 526 women, one trial, high‐quality evidence; elective caesarean section: RR 1.06, 95% CI 0.77 to 1.47, 526 women, one trial; emergency caesarean section: RR 0.93, 95% CI 0.66 to 1.32, 526 women, one trial). There were also similar rates of inductions of labour (Analysis 1.10) (RR 1.10, 95% CI 0.80 to 1.50, 526 women; one trial; moderate‐quality evidence) and antenatal hospital admissions (Analysis 1.11) (RR 0.96, 95% CI 0.80 to 1.15, 526 women, one trial, high‐quality evidence).
There was no information reported on the length of antenatal hospital stay, timely diagnosis of significant complications or rate of preterm prelabour ruptured membranes. Women's level of satisfaction with their care was also not investigated.
Discussion
Summary of main results
The available data looking at ultrasound regimens (fetal growth + Doppler versus fetal growth only) for monitoring twin pregnancies did not show any difference in perinatal mortality or markers of neonatal and maternal morbidity. The included study (Giles 2003) reported very few of this review's prespecified secondary outcomes . They reported a lower than expected fetal mortality rate, meaning that a much larger study would be required to detect a difference in perinatal mortality.
Overall completeness and applicability of evidence
Twin pregnancies were not classified according to their chorionicity. An awareness of the chorionicity may have improved applicability of this data set.
The available evidence does not describe many of the prespecified outcomes including many markers of neonatal morbidity and women's views of their care and emotional health.
Quality of the evidence
In the one reported study the overall quality of the evidence was reasonable however the study was underpowered for detection of rare outcomes such as perinatal mortality, stillbirth and neonatal death. It was unclear from the trial report if there was an attempt to blind participants or personnel, which may have led to performance bias. The randomisation process, follow‐up of participants and reporting systems appeared to be robust however, leading to an overall reliable data set.
We have assessed the quality of the evidence using the GRADE approach. The review is based on one small study that included 526 women and reported on the following outcomes: perinatal mortality, neonatal death, birth less than 28 weeks, gestational age at birth, caesarean section, induction of labour and antenatal admission to hospital. For caesarean section and antenatal admission to hospital we rated the quality of evidence as high. We rated evidence for gestational age at birth and induction of labour as moderate quality, whilst perinatal mortality and neonatal death were rated as low‐quality evidence (downgraded due to imprecise estimates and low number of events). The trial did not report birth less than 28 weeks.
Potential biases in the review process
Evidence in this review was derived from a study identified in a detailed search process. Trials comparing regimens for ultrasound surveillance of twin pregnancies that have not been published may not have been identified. We attempted to minimise bias in the review process by having two review authors independently extract data.
Agreements and disagreements with other studies or reviews
Twin pregnancies are at an increased risk of complications such as intrauterine growth restriction and twin‐to‐twin transfusion syndrome and therefore it has become accepted practice that there is ultrasound surveillance during the pregnancy from 20 weeks at least every 28 days (NICE 2011). For monochorionic pregnancies clinical guidelines suggest an ultrasound is performed every two weeks from 16 weeks to allow for early detection of twin‐to twin transfusion syndrome, selective fetal growth restriction and twin anaemia polycythaemia sequence (Kilby 2016) . Ultrasound assessment should include assessment of amniotic fluid in each sac and presence of both bladders (Emery 2015). Whilst complications are well reported in cohort studies, other than the one study included in this review, there are no prospective randomised trials addressing the question of optimal surveillance for twins.
Current clinical guidelines suggest that ultrasounds are performed from an earlier gestation (16 weeks rather than 25 weeks), at a greater frequency (maximum of four weeks between scans rather than five) and with more information about the bladder than data from randomised studies provides (Kilby 2016) .
Study flow diagram
Risk of bias summary: review authors' judgements about each risk of bias item for each included study.

Comparison 1 Fetal growth (biometry) + umbilical artery Doppler versus fetal growth, Outcome 1 Perinatal mortality (post randomisation).

Comparison 1 Fetal growth (biometry) + umbilical artery Doppler versus fetal growth, Outcome 2 Stillbirth.

Comparison 1 Fetal growth (biometry) + umbilical artery Doppler versus fetal growth, Outcome 3 Neonatal death.

Comparison 1 Fetal growth (biometry) + umbilical artery Doppler versus fetal growth, Outcome 4 Gestational age at birth.

Comparison 1 Fetal growth (biometry) + umbilical artery Doppler versus fetal growth, Outcome 5 Infant requiring ventilation.

Comparison 1 Fetal growth (biometry) + umbilical artery Doppler versus fetal growth, Outcome 6 Admission to special care or intensive care units.

Comparison 1 Fetal growth (biometry) + umbilical artery Doppler versus fetal growth, Outcome 7 Caesarean section any.

Comparison 1 Fetal growth (biometry) + umbilical artery Doppler versus fetal growth, Outcome 8 Elective caesarean section.
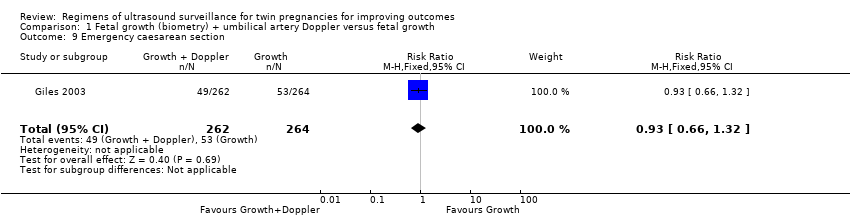
Comparison 1 Fetal growth (biometry) + umbilical artery Doppler versus fetal growth, Outcome 9 Emergency caesarean section.
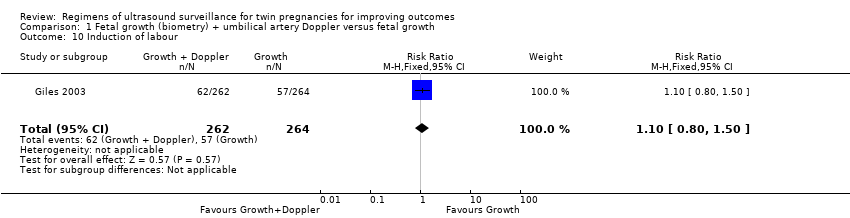
Comparison 1 Fetal growth (biometry) + umbilical artery Doppler versus fetal growth, Outcome 10 Induction of labour.

Comparison 1 Fetal growth (biometry) + umbilical artery Doppler versus fetal growth, Outcome 11 Antenatal admission to hospital.
| Fetal growth + umbilical artery Doppler versus fetal growth for twin pregnancies for improving outcomes | ||||||
| Patient or population: women with twin pregnancies were randomised from 25 weeks | ||||||
| Outcomes | Anticipated absolute effects* (95% CI) | Relative effect | № of participants | Quality of the evidence | Comments | |
| Risk with fetal growth + umbilical artery Doppler | Risk with fetal growth | |||||
| Perinatal mortality (after randomisation) | Study population | RR 0.88 | 1052 | ⊕⊕⊝⊝ | ||
| 15 per 1000 | 13 per 1000 | |||||
| Neonatal death | Study population | RR 1.01 | 1052 | ⊕⊕⊝⊝ | ||
| 9 per 1000 | 10 per 1000 | |||||
| Birth less than 28 weeks | ‐ | ‐ | ‐ | ‐ | ‐ | The trial included in this review did not report this outcome. |
| Gestational age at birth (weeks) | The mean gestational age at birth was 35.8 weeks | The mean gestational age at birth was 35.7 weeks | MD 0.10 weeks longer with growth plus Doppler | 526 | ⊕⊕⊕⊝ | |
| Caesarean section (any) | Study population | RR 1.00 | 526 | ⊕⊕⊕⊕ | ||
| 409 per 1000 | 409 per 1000 | |||||
| Induction of labour | Study population | RR 1.10 | 526 | ⊕⊕⊕⊝ | ||
| 216 per 1000 | 238 per 1000 | |||||
| Antenatal admission to hospital | Study population | RR 0.96 | 526 | ⊕⊕⊕⊕ | ||
| 477 per 1000 | 458 per 1000 | |||||
| *The risk in the intervention group (and its 95% confidence interval) is based on the assumed risk in the comparison group and the relative effect of the intervention (and its 95% CI). | ||||||
| GRADE Working Group grades of evidence | ||||||
| 1 Events are rare and wide confidence intervals cross line of no effect (‐2). | ||||||
| Outcome or subgroup title | No. of studies | No. of participants | Statistical method | Effect size |
| 1 Perinatal mortality (post randomisation) Show forest plot | 1 | 1052 | Risk Ratio (M‐H, Fixed, 95% CI) | 0.88 [0.32, 2.41] |
| 2 Stillbirth Show forest plot | 1 | 526 | Risk Ratio (M‐H, Fixed, 95% CI) | 0.67 [0.11, 3.99] |
| 3 Neonatal death Show forest plot | 1 | 1052 | Risk Ratio (M‐H, Fixed, 95% CI) | 1.01 [0.29, 3.46] |
| 4 Gestational age at birth Show forest plot | 1 | 526 | Mean Difference (IV, Fixed, 95% CI) | 0.10 [‐0.39, 0.59] |
| 5 Infant requiring ventilation Show forest plot | 1 | 1052 | Risk Ratio (M‐H, Fixed, 95% CI) | 0.86 [0.59, 1.25] |
| 6 Admission to special care or intensive care units Show forest plot | 1 | 1052 | Risk Ratio (M‐H, Fixed, 95% CI) | 0.96 [0.88, 1.05] |
| 7 Caesarean section any Show forest plot | 1 | 526 | Risk Ratio (M‐H, Fixed, 95% CI) | 1.00 [0.81, 1.23] |
| 8 Elective caesarean section Show forest plot | 1 | 526 | Risk Ratio (M‐H, Fixed, 95% CI) | 1.06 [0.77, 1.47] |
| 9 Emergency caesarean section Show forest plot | 1 | 526 | Risk Ratio (M‐H, Fixed, 95% CI) | 0.93 [0.66, 1.32] |
| 10 Induction of labour Show forest plot | 1 | 526 | Risk Ratio (M‐H, Fixed, 95% CI) | 1.10 [0.80, 1.50] |
| 11 Antenatal admission to hospital Show forest plot | 1 | 526 | Risk Ratio (M‐H, Fixed, 95% CI) | 0.96 [0.80, 1.15] |