Zautomatyzowany kontrolowany bolus w porównaniu z ciągłym wlewem leku w znieczuleniu zewnątrzoponowym podczas porodu
Referencias
References to studies included in this review
References to studies excluded from this review
Additional references
References to other published versions of this review
Characteristics of studies
Characteristics of included studies [ordered by study ID]
Ir a:
| Methods | Prospective randomized double‐blind controlled study | |
| Participants | Setting: recruited from Citta di Roma Hospital, Roma, Italy Sample size: N = 150 (N completers = 145) Participants: age 27 ± 5 years (BI) and 29 ± 5 years (AMB) Inclusion criteria: healthy, nulliparous, term women with singleton, vertex pregnancies in spontaneous labour if cervical dilation was < 4 cm and if her baseline pain score, assessed at the peak of the contraction, was > 50 mm on a 100 mm visual analogue pain scale (VAPS) 5 women in the continuous epidural infusion group excluded: 4 reported VAPS > 10 mm 30 min after the epidural injection and one unintentional epidural catheter dislodgement during labour | |
| Interventions | AMB (n = 75): 0.0625% levobupivacaine with sufentanil 0.5 µg/mL, 10 mL every hour, beginning 60 min after the administration of the initial epidural loading dose. PCEA pump was programmed to deliver 5 mL patient‐activated boluses of levobupivacaine 0.125% with a lockout interval of 10 min and a per hour maximum volume of 15 mL BI (n = 70): 0.0625% levobupivacaine with sufentanil 0.5 µg/mL, 10 mL/h, beginning immediately after the administration of the initial epidural loading dose. PCEA pump was programmed to deliver 5 mL patient‐activated boluses of levobupivacaine 0.125% with a lockout interval of 10 min, and a per hour maximum volume of 15 mL | |
| Outcomes | Rate of breakthrough pain with need for anaesthetic intervention Rate of caesarean delivery Rate of instrumental delivery Duration of labour Total dose of LA (levobupivacaine) | |
| Notes | Study dates: April 2009 to July 2010 Funding sources not declared No conflict of interests declared References to other studies in this review: Fettes 2006; Leo 2010; Lim 2005 | |
| Risk of bias | ||
| Bias | Authors' judgement | Support for judgement |
| Random sequence generation (selection bias) | Low risk | Computer‐generated random‐number sequence |
| Allocation concealment (selection bias) | Low risk | Sequentially numbered, opaque envelope |
| Blinding of participants and personnel (performance bias) | Low risk | Unblinded researcher set up the 2 epidural pumps according to group allocation. The participants and other study personnel were blinded to group assignment. |
| Blinding of outcome assessment (detection bias) | Low risk | All the observations and assessments were performed by a researcher blinded to the mode of drug administration. The infusion pumps were inserted into an opaque, portable bag. |
| Incomplete outcome data (attrition bias) | Low risk | Attrition and exclusions reported; 5 out of 150 participants dropped out; however, this dropout rate is not significant (3%). |
| Selective reporting (reporting bias) | Low risk | All a priori outcomes reported based on published protocol |
| Other bias | Low risk | Appears to be free of other sources of bias. Sample size calculation: sample |
| Methods | Parallel, randomized controlled trial | |
| Participants | Setting: recruited from Singapore General Hospital, Singapore Sample size: N = 42 Participants: age not provided Inclusion criteria: ASA physical status I nulliparous women in early spontaneous labour pain with at least one contraction every 5 min who had requested neuraxial block | |
| Interventions | AMB (n = 21): ropivacaine 0.1% plus fentanyl 2 µg/mL for maintaining epidural analgesia The initial 5 mL bolus was administered 30 min after time 0, followed by 5 mL boluses every hour thereafter. As the highest rate of delivery afforded by the pump was 100 mL/h, each epidural bolus was delivered over 3 min. BI (n = 21): ropivacaine 0.1% plus fentanyl 2 µg/mL for maintaining epidural analgesia. A rate of 5 mL/h was initiated 1 min after time 0 by using a Terumo syringe pump | |
| Outcomes | Rate of breakthrough pain with need for anaesthetic intervention LA consumption per hour | |
| Notes | Study dates not stated Funding sources not declared No conflict of interests declared References to other studies in this review: none | |
| Risk of bias | ||
| Bias | Authors' judgement | Support for judgement |
| Random sequence generation (selection bias) | Unclear risk | Not stated |
| Allocation concealment (selection bias) | Low risk | Randomly assigned by the blind opaque envelope technique |
| Blinding of participants and personnel (performance bias) | Unclear risk | All blocks performed by the principal investigator |
| Blinding of outcome assessment (detection bias) | Low risk | All data was collected by an anaesthesiologist who was not involved in instituting the block |
| Incomplete outcome data (attrition bias) | Low risk | No dropouts |
| Selective reporting (reporting bias) | Low risk | All a priori outcomes reported based on published protocol |
| Other bias | Low risk | Sample size was computed to detect a 30‐min difference (α = 0.05, ß = 0.2) in the duration of analgesia |
| Methods | Prospective, randomized, controlled, single‐blind, parallel study | |
| Participants | Setting: recruited from Hospital Universitario Fundación Santa Fe de Bogotá (Colombia) Sample size: N = 132 (N completers = 128) Participants: age 32.3 ± 3.8 years (BI) and 31.6 ± 5.1 years (AMB) Inclusion criteria: labouring term women aged between 18 and 45 years requiring epidural analgesia Two women in each group were excluded from analysis as they delivered within 60 min of epidural initiation | |
| Interventions | AMB (n = 64): initial loading dose of 10 mL of 0.1% bupivacaine (2 mL of 0.5% bupivacaine plus 50 μg/mL of fentanyl in 7 mL of 0.9% normal saline), then a 10 mL bolus of a mixture of 0.1% bupivacaine plus 2 μg/mL of fentanyl in 0.9% normal saline every hour starting 1 hour after the initial loading dose BI (n = 64): initial loading dose of 10 mL of 0.1% bupivacaine (2 mL of 0.5% bupivacaine plus 50 μg/mL of fentanyl in 7 mL of 0.9% normal saline) then a 10 mL/hh infusion of a mixture of 0.1% bupivacaine plus 2 μg/mL of fentanyl in 0.9% normal saline every hour starting immediately after the loading dose | |
| Outcomes | Rate of breakthrough pain with need for anaesthetic intervention Rate of caesarean delivery Rate of instrumental delivery Duration of labour analgesia Total LA dose Maternal satisfaction Apgar scores | |
| Notes | Study dates not stated No funding sources No conflict of interests declared References to other studies in this review: Capogna 2011; Chua 2004; Leo 2010; Lim 2005; Salim 2005; Wong 2006 | |
| Risk of bias | ||
| Bias | Authors' judgement | Support for judgement |
| Random sequence generation (selection bias) | Low risk | Computer‐generated sequence |
| Allocation concealment (selection bias) | Unclear risk | Participants, caregivers and outcome assessors were not aware of the next treatment allocation. Under Materials and Methods: Quote: "neither the patient nor the attending anesthesiologist nor the outcome assessor knew the randomization sequence." However, the method of allocation concealment was not described. |
| Blinding of participants and personnel (performance bias) | Low risk | This is a single blind trial. The outcomes are objective and the outcome assessors were blinded. |
| Blinding of outcome assessment (detection bias) | Low risk | Outcome assessor was blinded |
| Incomplete outcome data (attrition bias) | Low risk | Attrition and exclusions reported |
| Selective reporting (reporting bias) | Low risk | All a priori outcomes reported based on published protocol |
| Other bias | Low risk | Appears to be free of other sources of bias. Sample size of 132 participants (66 per group) with 10% attrition would give the study a power of > 0.8 to detect a 10% reduction in the difference of means of breakthrough pain between the 2 groups |
| Methods | Parallel, randomized controlled trial | |
| Participants | Setting: recruited from Ninewells Hospital and Medical School, Dundee, UK Sample size: N = 47 (N completers = 40) Participants: age 25.8 ± 6.3 years (AMB) and 27.1 ± 4.5 years (BI) Inclusion criteria: ASA I–II primigravid participants with uncomplicated, full‐term (> 37 weeks) pregnancy 7 women were excluded after epidural catheter placement: 3 because of inadequate analgesia at 45 min; and 1 each because of patchy block, epidural filter disconnection, catheter occlusion and study protocol violation | |
| Interventions | AMB (n = 20): ropivacaine 2 mg/mL with fentanyl 2 mg/mL. Hourly boluses, delivered at 2 mL/min, were started 30 min after time zero BI (n = 20): ropivacaine 2 mg/mL with fentanyl 2 mg/mL. Infusion was started immediately at a constant rate of 10 mL/h | |
| Outcomes | Rate of breakthrough pain with need for anaesthetic intervention Rate of caesarean delivery Rate of instrumental delivery Duration of labour Total LA dose Apgar scores | |
| Notes | Study dates not stated Funding sources not declared No conflict of interests declared References to other studies in this review: Chua 2004; Lim 2005 | |
| Risk of bias | ||
| Bias | Authors' judgement | Support for judgement |
| Random sequence generation (selection bias) | Low risk | Computer‐generated numbers |
| Allocation concealment (selection bias) | Low risk | Opaque envelopes |
| Blinding of participants and personnel (performance bias) | Low risk | Participants were nursed in the sitting position by staff that were unaware of the treatment used. |
| Blinding of outcome assessment (detection bias) | Low risk | Observations were made by an assessor 'blind' (the pump was covered) to the mode of drug administration |
| Incomplete outcome data (attrition bias) | Low risk | Attrition and exclusions reported; under Results section p. 361, Quote: "dropouts were divided equally into the two groups" |
| Selective reporting (reporting bias) | Low risk | All a priori outcomes reported based on published protocol |
| Other bias | Low risk | Appears to be free of other sources of bias. Sample size of 40 participants (20 per group) would give the study a power of > 0.9 to detect a statistically significant difference in visual analogue pain scores |
| Methods | Randomized controlled trial | |
| Participants | Setting: recruited from KK Women's and Children's Hospital, Singapore Sample size: N = 62 Participants: age not provided Inclusion criteria: healthy ASA I nulliparous parturients with term (> 36 weeks of gestation), singleton fetuses in the vertex presentation, who were in early labour (cervical dilation < 5 cm) and requested labour epidural analgesia | |
| Interventions | AMB (n = 31): 0.1% ropivacaine + fentanyl 2 µg/mL. PCEA algorithm initiated immediately after completion of CSE. Participants in this group received automated mandatory boluses (AMB) of 5 mL every hour instead of a basal infusion. The first AMB dose was delivered 30 min from CSE and epidural catheter placement and every hour subsequently if no PCEA demands were made. If the participant had made a successful PCEA self‐bolus, the next AMB bolus would be delivered 30 min after the last successful PCEA self‐bolus and every hour thereafter. The lockout period for both PCEA and AMB boluses was 10 min. If a PCEA demand was made within 10 min of an AMB dose, no further bolus would be given. This would be recorded as an unsuccessful PCEA attempt. PCEA bolus was set at 5 mL and maximal hourly limit at 20 mL/h (inclusive of basal infusion and automated boluses) BI (n = 31): 0.1% ropivacaine + fentanyl 2 μg/mL. PCEA with basal infusion 5 mL/h initiated immediately after intrathecal drug administration and epidural catheter placement. PCEA bolus was set at 5 mL, lockout interval at 10 min and maximal dose at 20 mL/h | |
| Outcomes | Rate of breakthrough pain with need for anaesthetic intervention Rate of caesarean delivery Rate of instrumental delivery Duration of labour Total LA/hour (time weighted hourly consumption of ropivacaine) Maternal satisfaction Apgar scores | |
| Notes | Study dates not stated Funding sources not declared No conflict of interests declared References to other studies in this review: Chua 2004; Fettes 2006; Lim 2005; Sia 2007; Wong 2006 | |
| Risk of bias | ||
| Bias | Authors' judgement | Support for judgement |
| Random sequence generation (selection bias) | Low risk | Computer‐generated random number tables |
| Allocation concealment (selection bias) | Low risk | Sealed opaque envelopes |
| Blinding of participants and personnel (performance bias) | Low risk | Independent assistant programmed the epidural drug delivery system according to group assignment. Parturients were subsequently monitored by a second anaesthesiologist not involved in performing the block. Neither the parturients nor the anaesthesiologists who monitored and collected post‐block data were aware of group assignments |
| Blinding of outcome assessment (detection bias) | Low risk | Neither the parturients nor the anaesthesiologists who monitored and collected post‐block data were aware of group assignments. |
| Incomplete outcome data (attrition bias) | Low risk | No dropouts |
| Selective reporting (reporting bias) | Low risk | All a priori outcomes reported based on published protocol |
| Other bias | Low risk | Appears to be free of other sources of bias. Sample size calculation: sample size of 30 participants in each group was calculated to detect a 30% reduction in the incidence of breakthrough pain requiring physician top‐up for participants in the PCEA + AMB arm compared with those in the PCEA + BI arm (α = 0.05, ß = 0.2) |
| Methods | Randomized controlled trial | |
| Participants | Setting: recruited from KK Women's and Children's Hospital, Singapore Participants: age 30 ± 6 years (AMB) and 31 ± 5 years (BI) Sample size: N = 60 Inclusion criteria: ASA I nulliparous labouring parturients at term who requested neuraxial analgesia in established labour with cervical dilatation less than or equal to 5 cm and with baseline pain scores more than or equal to 50 (on a 0–100 visual analogue scale (VAS): 0 = no pain, 100 = worst pain imaginable) | |
| Interventions | AMB (n = 30): 5 mL epidural boluses of levobupivacaine 0.1% with fentanyl 2 µg/mL every 30 min. This was initiated 15 min after the intrathecal component was given BI (n = 30): levobupivacaine 0.1% with fentanyl 2 µg/mL at a rate of 10 mL/h as a continuous infusion delivered by a syringe pump. The epidural infusion was initiated in the next minute after the intrathecal component was given | |
| Outcomes | Rate of breakthrough pain with need for anaesthetic intervention Rate of caesarean delivery Rate of instrumental delivery Duration of labour Total LA/hour Maternal satisfaction Apgar scores | |
| Notes | Study dates not stated Funding sources not declared No conflict of interests declared References to other studies in this review: Chua 2004 | |
| Risk of bias | ||
| Bias | Authors' judgement | Support for judgement |
| Random sequence generation (selection bias) | Low risk | Randomized using a computer‐generated table |
| Allocation concealment (selection bias) | Unclear risk | Not mentioned |
| Blinding of participants and personnel (performance bias) | Low risk | Double‐blinded |
| Blinding of outcome assessment (detection bias) | Low risk | An anaesthetist, who was not involved in performing the block and blinded to the mode of drug delivery, collected the data |
| Incomplete outcome data (attrition bias) | Low risk | No dropouts |
| Selective reporting (reporting bias) | Low risk | All a priori outcomes reported based on published protocol |
| Other bias | Low risk | Appears to be free of other sources of bias. Sample size calculation: sample size was computed to detect a 40% reduction of incidence of breakthrough pain |
| Methods | Randomized double‐blinded controlled clinical trial | |
| Participants | Setting: recruited from KK Women's and Children's Hospital, Singapore Sample size: N = 51 (N completers = 50) Participants: age not provided Inclusion criteria: healthy nulliparous parturients with cephalic presentation at > 36 weeks gestation in early, spontaneous labour (cervical dilation < 5 cm) 1 woman from CEI group excluded as epidural catheter was blocked and resited 2 hours after initiation of CSE | |
| Interventions | AMB (n = 25): 2.5 mL epidural boluses of 0.1% ropivacaine with fentanyl 2 µg/mL, infused over a 2‐minute period, every 15 min. The first bolus was given 7.5 min after the intrathecal injection BI (n = 25): 0.1% ropivacaine with fentanyl 2 µg/mL at 10 mL/hour, delivered by syringe pump and initiated immediately after the intrathecal injection | |
| Outcomes | Rate of breakthrough pain with need for anaesthetic intervention Rate of caesarean delivery Rate of instrumental delivery Duration of labour Time‐weighted consumption of LA Maternal satisfaction Apgar scores | |
| Notes | Study dates: 18 February to 19 March 2007 Funding sources not declared No conflict of interests declared References to other studies in this review: Chua 2004; Fettes 2006; Lim 2005; Wong 2006 | |
| Risk of bias | ||
| Bias | Authors' judgement | Support for judgement |
| Random sequence generation (selection bias) | Unclear risk | Not explained |
| Allocation concealment (selection bias) | Low risk | Sealed opaque envelope, which was opened after recruitment by the anaesthetist who was to perform the epidural |
| Blinding of participants and personnel (performance bias) | Low risk | Parturient was blinded to the group allocation. Nurse/midwife was also blinded to participant study group allocation |
| Blinding of outcome assessment (detection bias) | Low risk | Outcome data were gathered by a blinded observer |
| Incomplete outcome data (attrition bias) | Low risk | Attrition and exclusions reported. Intention‐to‐treat analysis conducted |
| Selective reporting (reporting bias) | Low risk | All a priori outcomes reported based on published protocol |
| Other bias | Low risk | Appears to be free of other sources of bias. Sample size calculation: sample size was computed to detect a 30% difference in the incidence of breakthrough pain |
| Methods | Randomized double blinded controlled clinical trial | |
| Participants | Setting: recruited from First Affiliated Hospital of Guangxi Medical University, Nanning, People's Republic of China Sample size: N = 200 (N completers = 197) Participants: age 27.45 ± 4.61 (AMB) and 28.16 ± 4.679 (CI) Inclusion criteria: healthy nulliparous women in early spontaneous labor (> 37 weeks' gestation) having at least one uterine contraction every 5 min and who had requested neuraxial block 3 women were excluded because of unplanned epidural catheter removal | |
| Interventions | AMB (n = 98): test dose of 4 mL of 1% lignocaine then 10 mL of 0.15% ropivacaine loading dose, then maintenance with 0.1% ropivacaine with sufentanil 0.3 µg/mL at 5 mL bolus per hour plus PCEA of 5 mL with 20 min lockout period, maximum 15 mL/h BI (n = 99): test dose of 4 mL of 1% lignocaine then 10 mL of 0.15% ropivacaine loading dose, then maintenance with 0.1% ropivacaine with sufentanil 0.3 µg/mL at 5 mL/h infusion plus PCEA of 5 mL with 20 min lockout period, maximum 15 mL/h | |
| Outcomes | Rate of caesarean delivery Rate of instrumental delivery Duration of labour LA used Apgar scores at 1 and 5 min | |
| Notes | Study dates: not provided Funding sources not declared No conflict of interests declared References to other studies in this review: Capogna 2011; Lim 2005; Wong 2006 | |
| Risk of bias | ||
| Bias | Authors' judgement | Support for judgement |
| Random sequence generation (selection bias) | Unclear risk | Randomization not explained |
| Allocation concealment (selection bias) | Low risk | Sealed opaque envelopes |
| Blinding of participants and personnel (performance bias) | Low risk | Unblinded researcher programmed the epidural drug delivery system according to group assignment. Parturients were subsequently monitored by a second blinded researcher. Neither the parturients nor the researchers who monitored and collected postblock data were aware of group assignments. |
| Blinding of outcome assessment (detection bias) | Low risk | Neither the parturients nor the researchers who monitored and collected postblock data were aware of group assignments. |
| Incomplete outcome data (attrition bias) | Low risk | Attrition and exclusions reported; 3 out of 200 participants were excluded from the analysis; however, this dropout rate is minimal (1.5%). |
| Selective reporting (reporting bias) | Low risk | All a priori outcomes reported based on published protocol |
| Other bias | Low risk | Appears to be free of other sources of bias. Sample size calculation not explained |
| Methods | Parallel 3‐group, randomized controlled trial | |
| Participants | Setting: recruited from Ha'Emek Medical Center, Afula, Israel Sample size: N = 190 Participants: age 25.7 ± 4.2 years (AMB), 25.6 ± 3.8 years (BI) and 23.7 ± 4.4 years (control) Inclusion criteria: all nulliparous women at term (37 weeks or more) who requested epidural analgesia during labour | |
| Interventions | AMB (n = 64): intermittent bolus infusions of 10 mL of 0.25% bupivacaine on demand with minimal intervals of 60 min BI (n = 63): basal continuous infusion of 0.125% bupivacaine with 2 µg/mL fentanyl at a rate of 8 mL/h with patient‐controlled epidural analgesia doses of 3 mL of this solution with a lockout time of 20 min Control (n = 63): control group without epidural who received a mixture of oxygen/nitrous oxide and/or pethidine | |
| Outcomes | Rate of caesarean delivery Rate of instrumental delivery Duration of labour LA used Maternal satisfaction Apgar scores | |
| Notes | Study dates: 6 January to 22 July 2004 Funding sources not declared No conflict of interests declared References to other studies in this review: none | |
| Risk of bias | ||
| Bias | Authors' judgement | Support for judgement |
| Random sequence generation (selection bias) | Low risk | Randomization of group A and B was performed using Microsoft Excel XP Professional (Microsoft, Redmond, WA). The allocation sequence was generated by the primary author Attending physicians enrolled and assigned participants to their groups |
| Allocation concealment (selection bias) | Unclear risk | The sequence was concealed until intervention was assigned however the method of allocation concealment was not described. |
| Blinding of participants and personnel (performance bias) | Unclear risk | Not mentioned |
| Blinding of outcome assessment (detection bias) | Unclear risk | Not mentioned |
| Incomplete outcome data (attrition bias) | Low risk | No dropouts |
| Selective reporting (reporting bias) | Low risk | All a priori outcomes reported based on published protocol |
| Other bias | Low risk | Appears to be free of other sources of bias. Sample size calculation: sample size of 63 subjects in each group was needed to demonstrate a difference of 30 min, considered clinically significant, in duration of the second stage of labor (60 min) between groups A and B with an alpha of 0.05 and power of 80% |
| Methods | Parallel, randomized controlled trial | |
| Participants | Setting: recruited from KK Women's and Children's Hospital, Singapore Sample size: n = 42 Participants: age not provided Inclusion criteria: healthy (ASA I), nulliparous parturients with cephalic presentation at ≥ 36 weeks of gestation who were in early spontaneous labour (cervical dilation ≤ 5 cm) and who had requested neuraxial blocks for analgesia and had a VAPS of > 3 cm | |
| Interventions | AMB (n = 21): 0.1% ropivacaine + fentanyl 2 µg/mL. PCEA + automated mandatory boluses (based on an empirical algorithm, maximal dose per hour = 20 mL), initiated the minute after time 0. In this group, apart from PCEA boluses of 5 mL per demand, the parturients received mandatory boluses of 5 mL/h with the first AMB dose delivered 30 min after the initiation of the pump and every hour after that if no PCEA demands were made. The lockout period for both PCEA and AMB boluses was 10 min. If a PCEA demand was made within 10 min of an AMB dose, no further bolus would be given. This would be recorded as an unsuccessful PCEA attempt. Provided that no further PCEA demands were made, the next AMB bolus would then be delivered 1 h after the last AMB. If there had been a successful PCEA bolus, the next AMB bolus would be delivered one hour after the last successful PCEA bolus BI (n = 21): 0.1% ropivacaine + fentanyl 2 µg/mL. PCEA + basal continuous infusion (BCI 5 mL/h, PCEA bolus of 5 mL, lockout interval = 10 min, maximal dose per hour = 20 mL), initiated the minute after time 0 | |
| Outcomes | Rate of breakthrough pain with need for anaesthetic intervention Rate of caesarean delivery Rate of instrumental delivery Duration of labour Time weighted ropivacaine consumed per hour Maternal satisfaction Apgar scores | |
| Notes | Study dates not stated Funding sources not declared No conflict of interests declared References to other studies in this review: Chua 2004; Lim 2005; Wong 2006 | |
| Risk of bias | ||
| Bias | Authors' judgement | Support for judgement |
| Random sequence generation (selection bias) | Low risk | Computer‐generated number |
| Allocation concealment (selection bias) | Low risk | Sealed opaque envelope |
| Blinding of participants and personnel (performance bias) | Low risk | The assignment of parturients to group was done by another investigator (ATS) not involved in performing the block or subsequent monitoring of the parturients |
| Blinding of outcome assessment (detection bias) | Low risk | Neither the parturients nor the investigators who monitored and collected data were aware of the participant group. |
| Incomplete outcome data (attrition bias) | Low risk | No dropouts |
| Selective reporting (reporting bias) | Low risk | All a priori outcomes reported based on published protocol |
| Other bias | Low risk | Appears to be free of other sources of bias. Sample size calculation: sample size determined (α = 0.05, ß = 0.2) to detect a 20% reduction in the time weighted epidural ropivacaine consumption for PCEA‐AMB compared with PCEA‐BCI |
| Methods | Parallel randomized controlled trial | |
| Participants | Setting: recruited from KK Women's and Children's Hospital, Singapore Sample size: N = 102 Participants: age not provided Inclusion criteria: healthy (ASA 1) nulliparous parturients at term (> 36 weeks gestation) with a singleton fetus, who were in early labour (cervical dilation < 5 cm) and who had requested labour epidural analgesia with VAS > 3 cm | |
| Interventions | AMB (n = 51): 0.1% ropivacaine + fentanyl 2 µg/mL. Automated bolus group: a PCEA algorithm was used, initiated immediately after the completion of CSE. The pump was designed to administer automated boluses of 5 mL in addition to the patient‐controlled boluses. The frequency of such automated boluses was dependent on the history of the participant's analgesic requirement over the past hour. The first automated bolus was programmed to be delivered 60 min from time 0 and every hour thereafter if no PCEA patient‐bolus was made (1 automated bolus of 5 mL every hour). At the first activation of a PCEA patient‐bolus, the timer would be reset with the subsequent automated bolus delivered 30 min following the PCEA patient‐bolus, and every hour thereafter if no further PCEA patient bolus was made (1 automated bolus of 5 mL every hour). If there was a second PCEA patient bolus in that same hour after the initial bolus, the time interval between 2 automated boluses would be shortened to 30 min (2 automated boluses of 5 mL every hour). If there was a third PCEA patient‐bolus within that hour, the automated bolus would be delivered at 20‐min intervals (3 automated boluses of 5 mL every hour). A fourth PCEA patient‐bolus within the same hour would further shorten the time interval between 2 automated boluses to 15 min (4 automated boluses of 5 mL every hour). On the other hand, if there were no patient‐bolus for 60 min, the frequency of automated boluses would step down in the reverse fashion. The lockout period for both PCEA and automated boluses was 10 min. If a PCEA demand was made within 10 min of an automated bolus, no patient bolus would be given and this would be recorded as an unsuccessful PCEA attempt. The PCEA demand bolus was set at 5 mL with a maximum hourly limit of 20 mL/h (inclusive of automated boluses). BI (n = 51): 0.1% ropivacaine + fentanyl 2 µg/mL. Infusion group: PCEA with basal infusion 5 mL/h initiated immediately following intrathecal drug administration (noted as time 0). The PCEA demand bolus was set at 5 mL, lockout interval at 10 min and maximum dose at 20 mL/h (inclusive of background infusion) | |
| Outcomes | Rate of breakthrough pain with need for anaesthetic intervention Rate of caesarean delivery Rate of instrumental delivery Duration of labour Total LA/hour (time‐weighted mean hourly consumption of ropivacaine) Maternal satisfaction Apgar scores | |
| Notes | Study dates not stated Funding sources: no external funding No conflict of interests declared References to other studies in this review: Chua 2004; Fettes 2006; Lim 2005; Sia 2007; Wong 2006 | |
| Risk of bias | ||
| Bias | Authors' judgement | Support for judgement |
| Random sequence generation (selection bias) | Low risk | Computer‐generated random number tables by a different investigator |
| Allocation concealment (selection bias) | Low risk | Sealed opaque envelopes |
| Blinding of participants and personnel (performance bias) | Low risk | The parturients were subsequently monitored by a second anaesthetist who was not involved in performing the block |
| Blinding of outcome assessment (detection bias) | Low risk | Neither the parturient nor the anaesthetist who recorded the post‐block data was aware of the group assignment Post‐block parameters were monitored by a separate blinded anaesthetist after the procedure |
| Incomplete outcome data (attrition bias) | Low risk | No dropouts |
| Selective reporting (reporting bias) | Low risk | All a priori outcomes reported based on published protocol |
| Other bias | Low risk | Appears to be free of other sources of bias. Sample size calculation: sample size of 49 participants in each group was required to detect an 80% reduction in the incidence of breakthrough pain requiring physician top‐up (α = 0.05, ß = 0.2) |
| Methods | Parallel, randomized controlled trial | |
| Participants | Setting: recruited from Northwestern University, Chicago, Ilinois, USA Sample size: N = 158 (N completers = 126) Participants' age not provided Inclusion criteria: healthy, parous (at least one previous vaginal delivery), term women with singleton, vertex pregnancies, scheduled for induction of labour 11 women from the PIEB group and 9 women from the CEI group were excluded for having delivered within 90 min of intrathecal analgesia. 10 women from the PIEB group were excluded for exceeded pump occlusion limits. 2 women were excluded for VAS > 10 mm 10 min after intrathecal injection | |
| Interventions | AMB (n = 63): PIEB pump delivered a 6‐mL bolus at a rate of 400 mL/h every 30 min beginning 45 min after administration of the intrathecal dose The PCEA pump was programmed to deliver 5 mL patient‐activated boluses with a lockout interval of 10 min and a per hour maximum of 15 mL. The participant was instructed on the use of the PCEA pump and was told to push the button whenever she felt uncomfortable. If the parturient felt she had inadequate analgesia after having activated the PCEA bolus twice in a 20‐min period an anaesthesiologist administered manual boluses of bupivacaine 1.25 mg/mL (5 mL to 15 mL) until the VAS was < 10 mm BI (n = 63): the CEI pump delivered a continuous infusion at 12 mL/h beginning 15 min after the intrathecal dose The PCEA pump was programmed to deliver 5 mL patient‐activated boluses with a lockout interval of 10 min and a per hour maximum of 15 mL. The subject was instructed on the use of the PCEA pump and was told to push the button whenever she felt uncomfortable. If the parturient felt she had inadequate analgesia after having activated the PCEA bolus twice in a 20‐min period an anaesthesiologist administered manual boluses of bupivacaine 1.25 mg/mL (5 to 15 mL) until the VAS was < 10 mm | |
| Outcomes | Rate of breakthrough pain with need for anaesthetic intervention Rate of caesarean delivery Rate of instrumental delivery Duration of labour LA per hour Maternal satisfaction | |
| Notes | Study dates: June 2003 to April 2005 Funding sources not declared No conflict of interests declared References to other studies in this review: Chua 2004 | |
| Risk of bias | ||
| Bias | Authors' judgement | Support for judgement |
| Random sequence generation (selection bias) | Low risk | Computer‐generated random number sequence |
| Allocation concealment (selection bias) | Low risk | Sequentially numbered opaque envelopes |
| Blinding of participants and personnel (performance bias) | Low risk | One unblinded anaesthesia researcher who opens the envelope. Subject and other study personnel were blinded as to group assignment. An unblinded researcher set up two epidural pumps for each participant. One pump administered either the PIEB or CEI while the second pump administered PCEA |
| Blinding of outcome assessment (detection bias) | Low risk | Participant and other study personnel were blinded to group assignment |
| Incomplete outcome data (attrition bias) | Low risk | No dropouts |
| Selective reporting (reporting bias) | Low risk | All a priori outcomes reported based on published protocol |
| Other bias | Low risk | Appears to be free of other sources of bias. Sample size calculation: sample size would be required to avoid a type II error at 0.05 and power of 0.80. 30 additional participants were included in the randomization to allow for anticipated exclusion of participants from data analysis |
AMB: automated mandatory bolus; ASA: American Society of Anesthesiologists; BCI: basal continuous infusion; BI: basal infusion; CEI: continuous epidural infusion; CSE: combined spinal‐epidural; LA: local anaesthetic; PCEA: patient controlled epidural analgesia; PIEB: programmed intermittent epidural boluses; VAPS: visual analogue pain scale; VAS: visual analogue scale.
Characteristics of excluded studies [ordered by study ID]
Ir a:
| Study | Reason for exclusion |
| Intervention groups not comparable in study as given different volumes and concentrations of LA | |
| Study did not use automated bolus, instead manual bolus was administered |
LA: local anaesthetic.
Data and analyses
| Outcome or subgroup title | No. of studies | No. of participants | Statistical method | Effect size |
| 1 Breakthrough pain Show forest plot | 10 | 797 | Risk Ratio (M‐H, Random, 95% CI) | 0.60 [0.39, 0.92] |
| Analysis 1.1  Comparison 1 Automated mandatory bolus vs basal infusion, Outcome 1 Breakthrough pain. | ||||
| 2 Breakthrough pain (epidural vs CSE) Show forest plot | 10 | 797 | Risk Ratio (M‐H, Random, 95% CI) | 0.60 [0.39, 0.92] |
| Analysis 1.2  Comparison 1 Automated mandatory bolus vs basal infusion, Outcome 2 Breakthrough pain (epidural vs CSE). | ||||
| 2.1 Epidural | 3 | 313 | Risk Ratio (M‐H, Random, 95% CI) | 0.40 [0.25, 0.64] |
| 2.2 CSE | 7 | 484 | Risk Ratio (M‐H, Random, 95% CI) | 0.71 [0.44, 1.13] |
| 3 Breakthrough pain (PCEA vs no PCEA) Show forest plot | 10 | 797 | Risk Ratio (M‐H, Random, 95% CI) | 0.60 [0.39, 0.92] |
| Analysis 1.3  Comparison 1 Automated mandatory bolus vs basal infusion, Outcome 3 Breakthrough pain (PCEA vs no PCEA). | ||||
| 3.1 PCEA | 5 | 477 | Risk Ratio (M‐H, Random, 95% CI) | 0.61 [0.35, 1.07] |
| 3.2 No PCEA | 5 | 320 | Risk Ratio (M‐H, Random, 95% CI) | 0.58 [0.30, 1.12] |
| 4 Breakthrough pain (nulliparous vs multiparous) Show forest plot | 9 | 669 | Risk Ratio (M‐H, Random, 95% CI) | 0.62 [0.39, 1.00] |
| Analysis 1.4  Comparison 1 Automated mandatory bolus vs basal infusion, Outcome 4 Breakthrough pain (nulliparous vs multiparous). | ||||
| 4.1 Nulliparous | 8 | 543 | Risk Ratio (M‐H, Random, 95% CI) | 0.62 [0.33, 1.15] |
| 4.2 Multiparous | 1 | 126 | Risk Ratio (M‐H, Random, 95% CI) | 0.59 [0.38, 0.90] |
| 5 Caesarean delivery Show forest plot | 11 | 1079 | Risk Ratio (M‐H, Random, 95% CI) | 0.92 [0.70, 1.21] |
| Analysis 1.5  Comparison 1 Automated mandatory bolus vs basal infusion, Outcome 5 Caesarean delivery. | ||||
| 6 Caesarean delivery (LA + opioids vs LA alone) Show forest plot | 11 | 1079 | Risk Ratio (M‐H, Random, 95% CI) | 0.92 [0.70, 1.21] |
| Analysis 1.6  Comparison 1 Automated mandatory bolus vs basal infusion, Outcome 6 Caesarean delivery (LA + opioids vs LA alone). | ||||
| 6.1 LA + opioids | 10 | 952 | Risk Ratio (M‐H, Random, 95% CI) | 0.93 [0.70, 1.24] |
| 6.2 LA alone | 1 | 127 | Risk Ratio (M‐H, Random, 95% CI) | 0.74 [0.27, 2.01] |
| 7 Caesarean delivery (epidural vs CSE) Show forest plot | 11 | 1079 | Risk Ratio (M‐H, Random, 95% CI) | 0.92 [0.70, 1.21] |
| Analysis 1.7 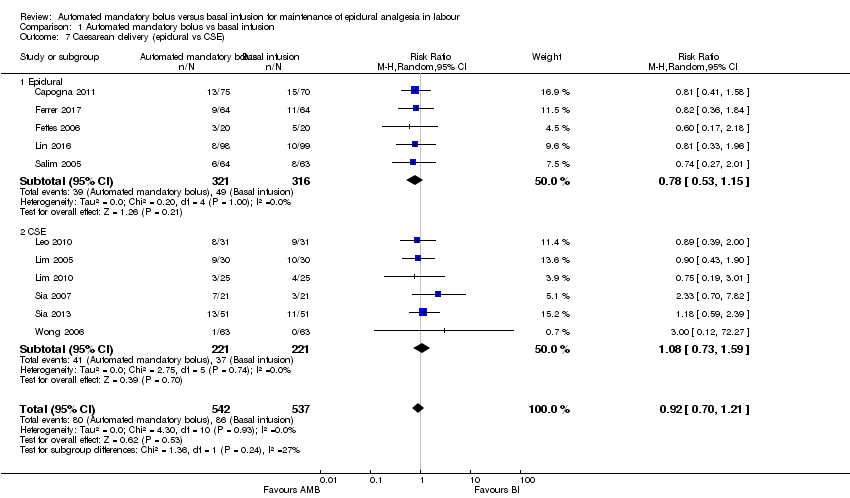 Comparison 1 Automated mandatory bolus vs basal infusion, Outcome 7 Caesarean delivery (epidural vs CSE). | ||||
| 7.1 Epidural | 5 | 637 | Risk Ratio (M‐H, Random, 95% CI) | 0.78 [0.53, 1.15] |
| 7.2 CSE | 6 | 442 | Risk Ratio (M‐H, Random, 95% CI) | 1.08 [0.73, 1.59] |
| 8 Caesarean delivery (PCEA vs no PCEA) Show forest plot | 11 | 1079 | Risk Ratio (M‐H, Random, 95% CI) | 0.92 [0.70, 1.21] |
| Analysis 1.8 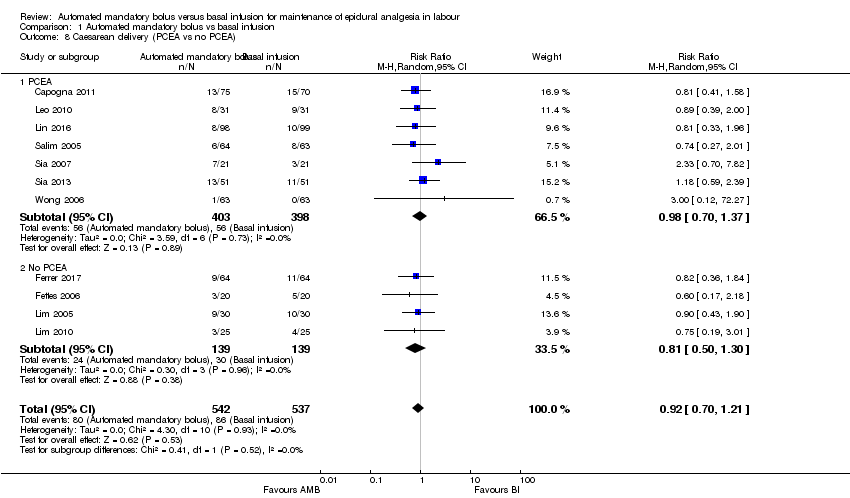 Comparison 1 Automated mandatory bolus vs basal infusion, Outcome 8 Caesarean delivery (PCEA vs no PCEA). | ||||
| 8.1 PCEA | 7 | 801 | Risk Ratio (M‐H, Random, 95% CI) | 0.98 [0.70, 1.37] |
| 8.2 No PCEA | 4 | 278 | Risk Ratio (M‐H, Random, 95% CI) | 0.81 [0.50, 1.30] |
| 9 Caesarean delivery (nulliparous vs multiparous) Show forest plot | 10 | 951 | Risk Ratio (M‐H, Random, 95% CI) | 0.93 [0.70, 1.25] |
| Analysis 1.9 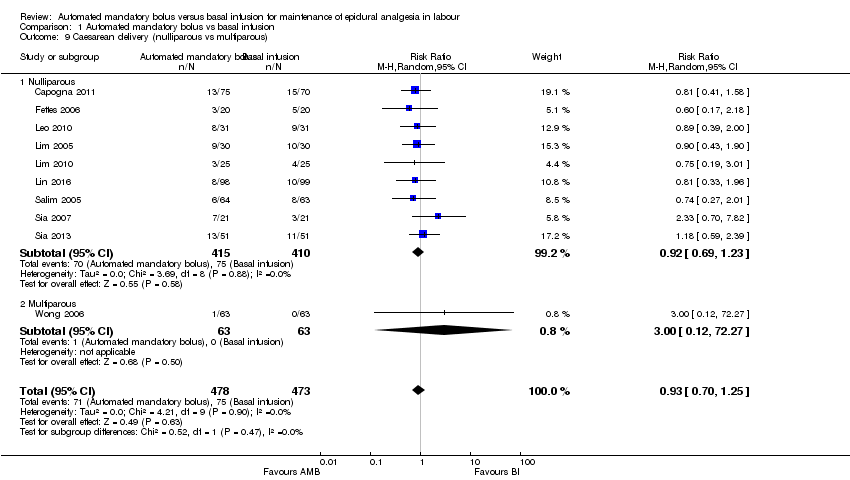 Comparison 1 Automated mandatory bolus vs basal infusion, Outcome 9 Caesarean delivery (nulliparous vs multiparous). | ||||
| 9.1 Nulliparous | 9 | 825 | Risk Ratio (M‐H, Random, 95% CI) | 0.92 [0.69, 1.23] |
| 9.2 Multiparous | 1 | 126 | Risk Ratio (M‐H, Random, 95% CI) | 3.0 [0.12, 72.27] |
| 10 Instrumental delivery Show forest plot | 11 | 1079 | Risk Ratio (M‐H, Random, 95% CI) | 0.75 [0.54, 1.06] |
| Analysis 1.10 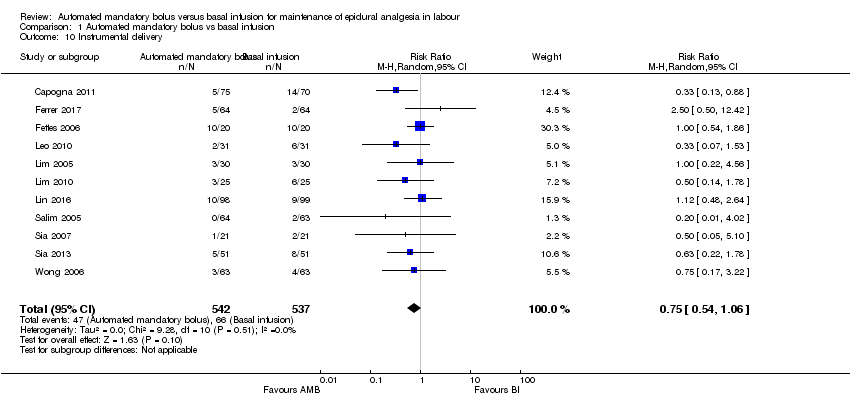 Comparison 1 Automated mandatory bolus vs basal infusion, Outcome 10 Instrumental delivery. | ||||
| 11 Instrumental delivery (LA + opioids vs LA alone) Show forest plot | 11 | 1079 | Risk Ratio (M‐H, Random, 95% CI) | 0.80 [0.57, 1.12] |
| Analysis 1.11 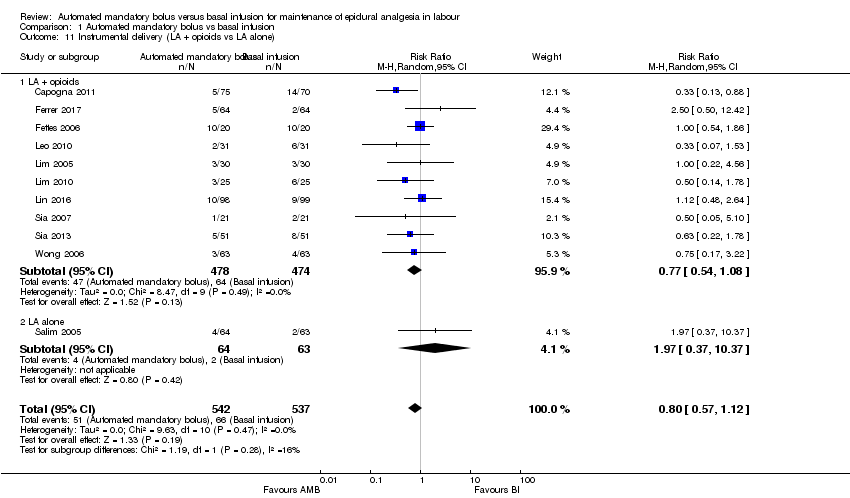 Comparison 1 Automated mandatory bolus vs basal infusion, Outcome 11 Instrumental delivery (LA + opioids vs LA alone). | ||||
| 11.1 LA + opioids | 10 | 952 | Risk Ratio (M‐H, Random, 95% CI) | 0.77 [0.54, 1.08] |
| 11.2 LA alone | 1 | 127 | Risk Ratio (M‐H, Random, 95% CI) | 1.97 [0.37, 10.37] |
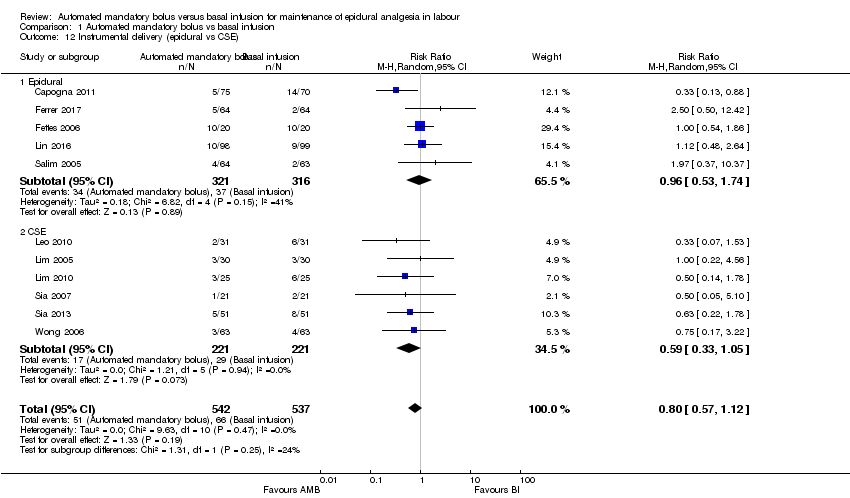
| 12 Instrumental delivery (epidural vs CSE) Show forest plot | 11 | 1079 | Risk Ratio (M‐H, Random, 95% CI) | 0.80 [0.57, 1.12] |
| Analysis 1.12  Comparison 1 Automated mandatory bolus vs basal infusion, Outcome 12 Instrumental delivery (epidural vs CSE). | ||||
| 12.1 Epidural | 5 | 637 | Risk Ratio (M‐H, Random, 95% CI) | 0.96 [0.53, 1.74] |
| 12.2 CSE | 6 | 442 | Risk Ratio (M‐H, Random, 95% CI) | 0.59 [0.33, 1.05] |
| 13 Instrumental delivery (PCEA vs No PCEA) Show forest plot | 11 | 1079 | Risk Ratio (M‐H, Random, 95% CI) | 0.80 [0.57, 1.12] |
| Analysis 1.13 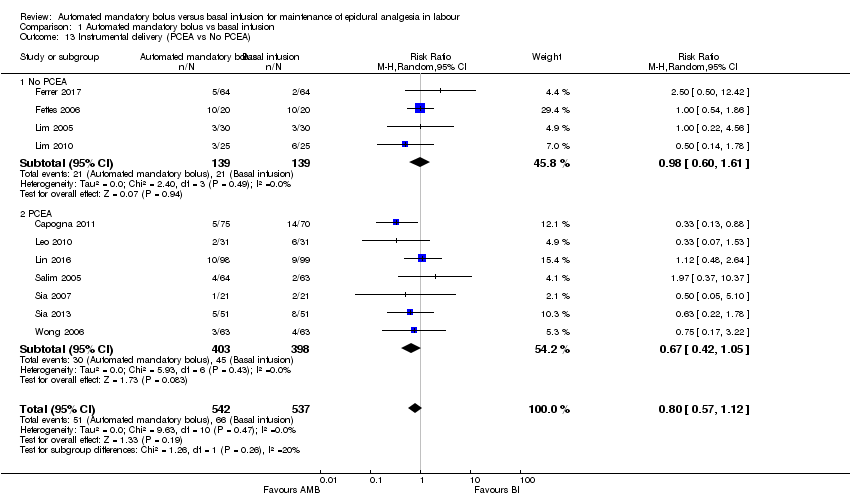 Comparison 1 Automated mandatory bolus vs basal infusion, Outcome 13 Instrumental delivery (PCEA vs No PCEA). | ||||
| 13.1 No PCEA | 4 | 278 | Risk Ratio (M‐H, Random, 95% CI) | 0.98 [0.60, 1.61] |
| 13.2 PCEA | 7 | 801 | Risk Ratio (M‐H, Random, 95% CI) | 0.67 [0.42, 1.05] |
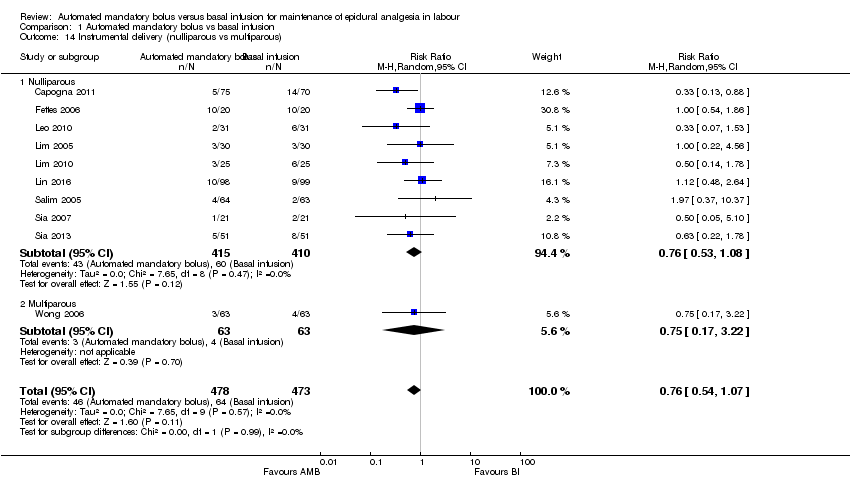
| 14 Instrumental delivery (nulliparous vs multiparous) Show forest plot | 10 | 951 | Risk Ratio (M‐H, Random, 95% CI) | 0.76 [0.54, 1.07] |
| Analysis 1.14  Comparison 1 Automated mandatory bolus vs basal infusion, Outcome 14 Instrumental delivery (nulliparous vs multiparous). | ||||
| 14.1 Nulliparous | 9 | 825 | Risk Ratio (M‐H, Random, 95% CI) | 0.76 [0.53, 1.08] |
| 14.2 Multiparous | 1 | 126 | Risk Ratio (M‐H, Random, 95% CI) | 0.75 [0.17, 3.22] |
| 15 Duration of labour in minutes Show forest plot | 11 | 1079 | Mean Difference (IV, Random, 95% CI) | ‐10.38 [‐26.73, 5.96] |
| Analysis 1.15  Comparison 1 Automated mandatory bolus vs basal infusion, Outcome 15 Duration of labour in minutes. | ||||
| 16 Duration of labour in minutes (LA + opioids vs LA alone) Show forest plot | 11 | 1079 | Mean Difference (IV, Random, 95% CI) | ‐10.38 [‐26.73, 5.96] |
| Analysis 1.16 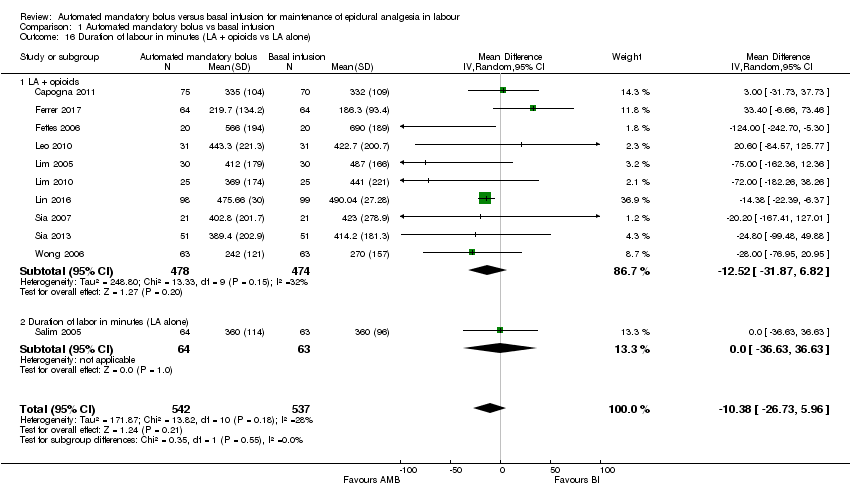 Comparison 1 Automated mandatory bolus vs basal infusion, Outcome 16 Duration of labour in minutes (LA + opioids vs LA alone). | ||||
| 16.1 LA + opioids | 10 | 952 | Mean Difference (IV, Random, 95% CI) | ‐12.52 [‐31.87, 6.82] |
| 16.2 Duration of labor in minutes (LA alone) | 1 | 127 | Mean Difference (IV, Random, 95% CI) | 0.0 [‐36.63, 36.63] |
| 17 Duration of labour in minutes (epidural vs CSE) Show forest plot | 11 | 1079 | Mean Difference (IV, Random, 95% CI) | ‐10.38 [‐26.73, 5.96] |
| Analysis 1.17 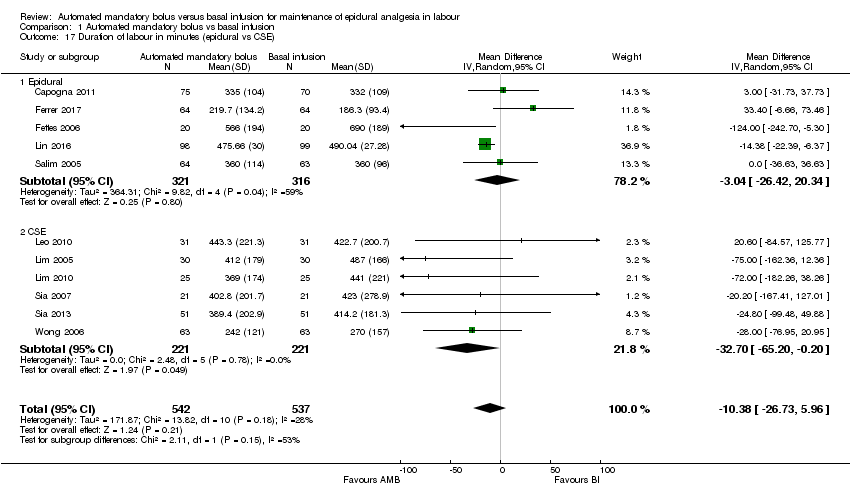 Comparison 1 Automated mandatory bolus vs basal infusion, Outcome 17 Duration of labour in minutes (epidural vs CSE). | ||||
| 17.1 Epidural | 5 | 637 | Mean Difference (IV, Random, 95% CI) | ‐3.04 [‐26.42, 20.34] |
| 17.2 CSE | 6 | 442 | Mean Difference (IV, Random, 95% CI) | ‐32.70 [‐65.20, ‐0.20] |
| 18 Duration of labour in minutes (PCEA vs no PCEA) Show forest plot | 11 | 1079 | Mean Difference (IV, Random, 95% CI) | ‐10.38 [‐26.73, 5.96] |
| Analysis 1.18 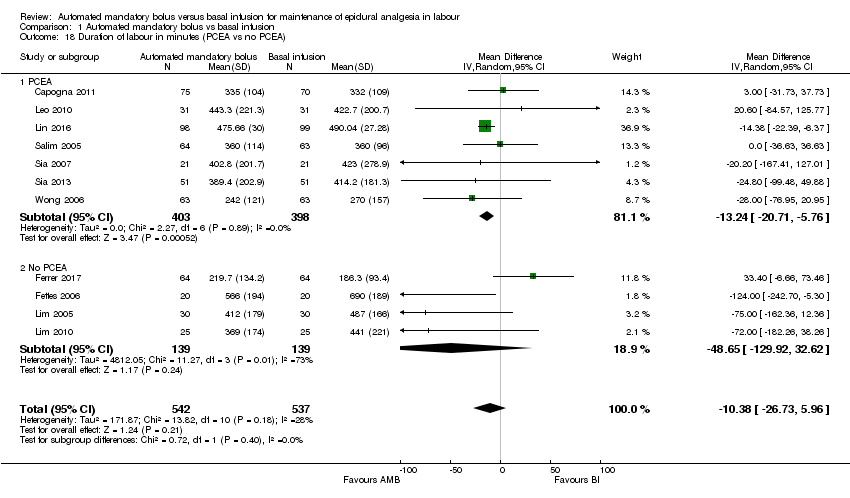 Comparison 1 Automated mandatory bolus vs basal infusion, Outcome 18 Duration of labour in minutes (PCEA vs no PCEA). | ||||
| 18.1 PCEA | 7 | 801 | Mean Difference (IV, Random, 95% CI) | ‐13.24 [‐20.71, ‐5.76] |
| 18.2 No PCEA | 4 | 278 | Mean Difference (IV, Random, 95% CI) | ‐48.65 [‐129.92, 32.62] |
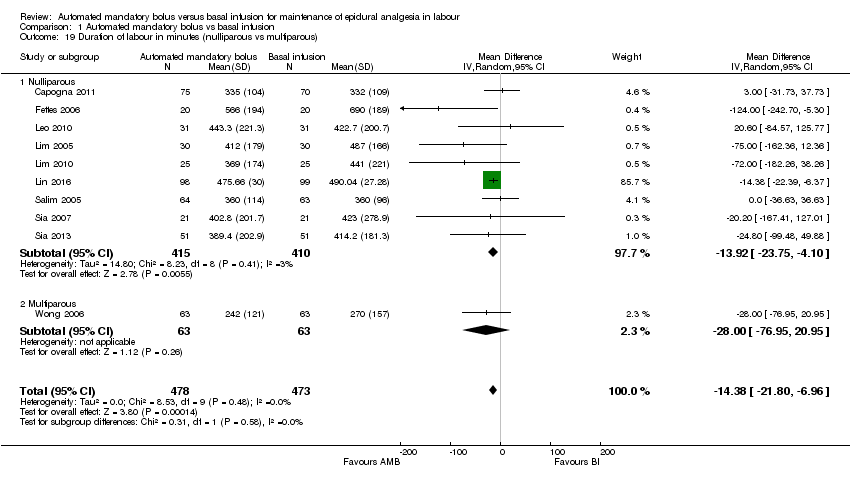
| 19 Duration of labour in minutes (nulliparous vs multiparous) Show forest plot | 10 | 951 | Mean Difference (IV, Random, 95% CI) | ‐14.38 [‐21.80, ‐6.96] |
| Analysis 1.19  Comparison 1 Automated mandatory bolus vs basal infusion, Outcome 19 Duration of labour in minutes (nulliparous vs multiparous). | ||||
| 19.1 Nulliparous | 9 | 825 | Mean Difference (IV, Random, 95% CI) | ‐13.92 [‐23.75, ‐4.10] |
| 19.2 Multiparous | 1 | 126 | Mean Difference (IV, Random, 95% CI) | ‐28.0 [‐76.95, 20.95] |
| 20 LA consumption per hour Show forest plot | 12 | 1121 | Mean Difference (IV, Random, 95% CI) | ‐1.08 [‐1.78, ‐0.38] |
| Analysis 1.20  Comparison 1 Automated mandatory bolus vs basal infusion, Outcome 20 LA consumption per hour. | ||||
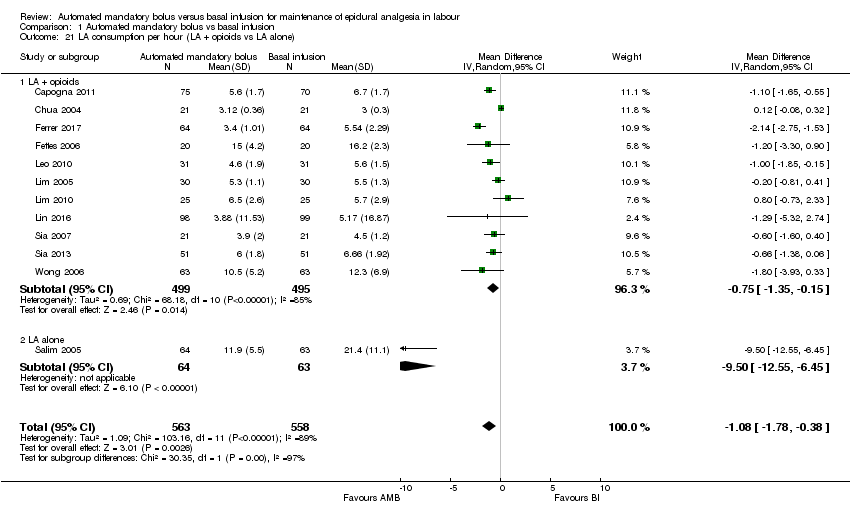
| 21 LA consumption per hour (LA + opioids vs LA alone) Show forest plot | 12 | 1121 | Mean Difference (IV, Random, 95% CI) | ‐1.08 [‐1.78, ‐0.38] |
| Analysis 1.21  Comparison 1 Automated mandatory bolus vs basal infusion, Outcome 21 LA consumption per hour (LA + opioids vs LA alone). | ||||
| 21.1 LA + opioids | 11 | 994 | Mean Difference (IV, Random, 95% CI) | ‐0.75 [‐1.35, ‐0.15] |
| 21.2 LA alone | 1 | 127 | Mean Difference (IV, Random, 95% CI) | ‐9.50 [‐12.55, ‐6.45] |
| 22 LA consumption per hour (epidural vs CSE) Show forest plot | 12 | 1121 | Mean Difference (IV, Random, 95% CI) | ‐1.08 [‐1.78, ‐0.38] |
| Analysis 1.22  Comparison 1 Automated mandatory bolus vs basal infusion, Outcome 22 LA consumption per hour (epidural vs CSE). | ||||
| 22.1 Epidural | 5 | 637 | Mean Difference (IV, Random, 95% CI) | ‐2.59 [‐4.13, ‐1.05] |
| 22.2 CSE | 7 | 484 | Mean Difference (IV, Random, 95% CI) | ‐0.35 [‐0.80, 0.11] |
| 23 LA consumption per hour (PCEA vs no PCEA) Show forest plot | 12 | 1121 | Mean Difference (IV, Random, 95% CI) | ‐1.08 [‐1.78, ‐0.38] |
| Analysis 1.23  Comparison 1 Automated mandatory bolus vs basal infusion, Outcome 23 LA consumption per hour (PCEA vs no PCEA). | ||||
| 23.1 PCEA | 7 | 801 | Mean Difference (IV, Random, 95% CI) | ‐1.59 [‐2.58, ‐0.60] |
| 23.2 No PCEA | 5 | 320 | Mean Difference (IV, Random, 95% CI) | ‐0.53 [‐1.58, 0.52] |
| 24 LA consumption per hour (nulliparous vs multiparous) Show forest plot | 11 | 993 | Mean Difference (IV, Random, 95% CI) | ‐0.89 [‐1.55, ‐0.23] |
| Analysis 1.24 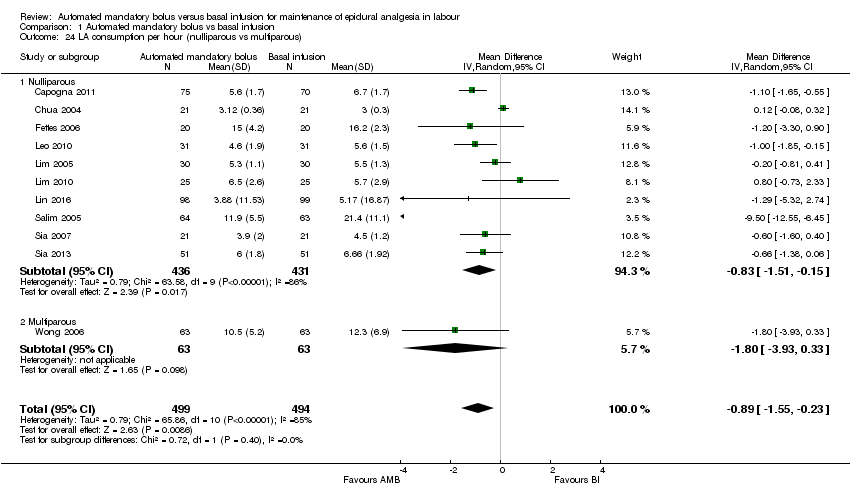 Comparison 1 Automated mandatory bolus vs basal infusion, Outcome 24 LA consumption per hour (nulliparous vs multiparous). | ||||
| 24.1 Nulliparous | 10 | 867 | Mean Difference (IV, Random, 95% CI) | ‐0.83 [‐1.51, ‐0.15] |
| 24.2 Multiparous | 1 | 126 | Mean Difference (IV, Random, 95% CI) | ‐1.80 [‐3.93, 0.33] |
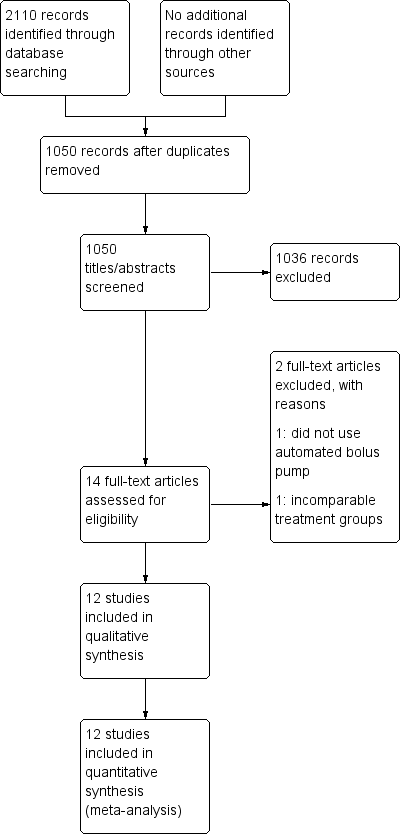
Study flow diagram.
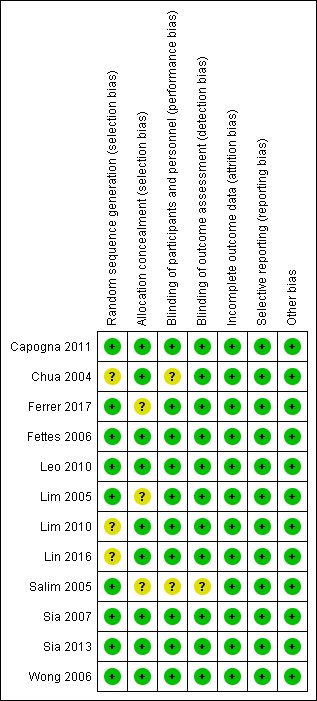
Risk of bias summary: review authors' judgements about each risk of bias item for each included study.

Risk of bias graph: review authors' judgements about each risk of bias item presented as percentages across all included studies.
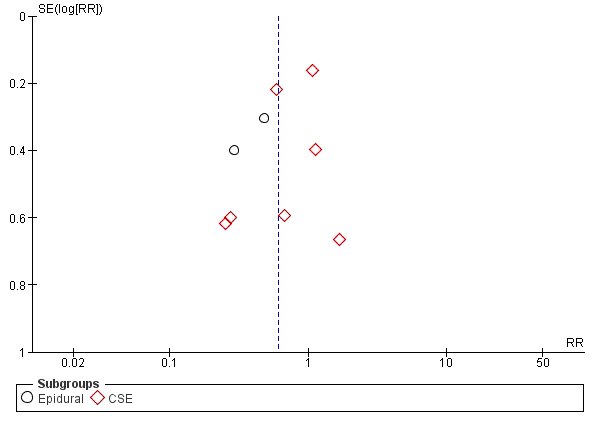
Funnel plot of comparison: 1 Automated mandatory bolus vs basal infusion, outcome: 1.2 Breakthrough pain (epidural vs CSE).
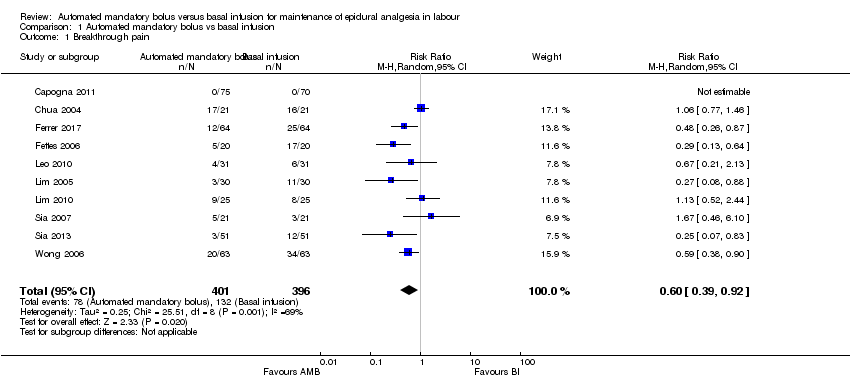
Comparison 1 Automated mandatory bolus vs basal infusion, Outcome 1 Breakthrough pain.

Comparison 1 Automated mandatory bolus vs basal infusion, Outcome 2 Breakthrough pain (epidural vs CSE).

Comparison 1 Automated mandatory bolus vs basal infusion, Outcome 3 Breakthrough pain (PCEA vs no PCEA).
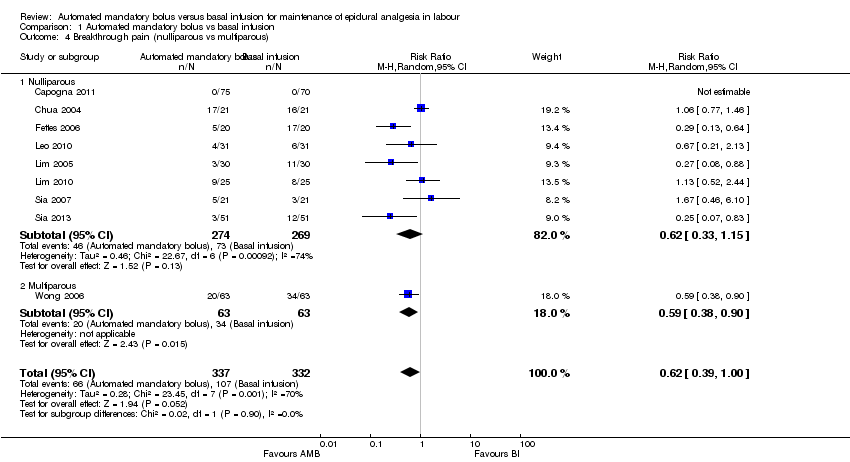
Comparison 1 Automated mandatory bolus vs basal infusion, Outcome 4 Breakthrough pain (nulliparous vs multiparous).
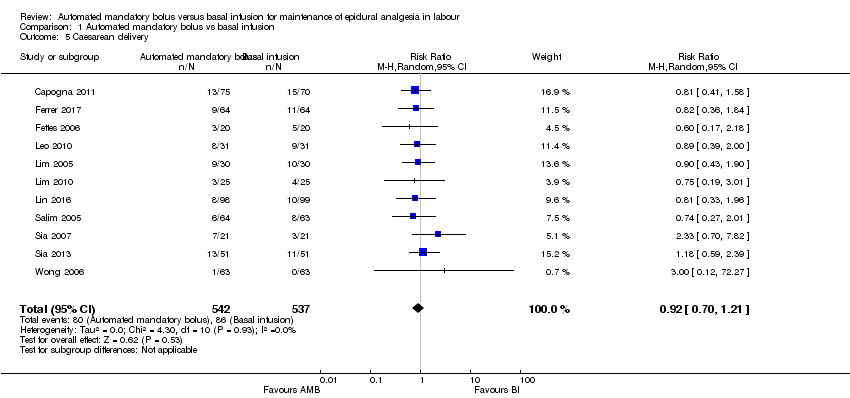
Comparison 1 Automated mandatory bolus vs basal infusion, Outcome 5 Caesarean delivery.

Comparison 1 Automated mandatory bolus vs basal infusion, Outcome 6 Caesarean delivery (LA + opioids vs LA alone).

Comparison 1 Automated mandatory bolus vs basal infusion, Outcome 7 Caesarean delivery (epidural vs CSE).

Comparison 1 Automated mandatory bolus vs basal infusion, Outcome 8 Caesarean delivery (PCEA vs no PCEA).

Comparison 1 Automated mandatory bolus vs basal infusion, Outcome 9 Caesarean delivery (nulliparous vs multiparous).

Comparison 1 Automated mandatory bolus vs basal infusion, Outcome 10 Instrumental delivery.

Comparison 1 Automated mandatory bolus vs basal infusion, Outcome 11 Instrumental delivery (LA + opioids vs LA alone).
Comparison 1 Automated mandatory bolus vs basal infusion, Outcome 12 Instrumental delivery (epidural vs CSE).

Comparison 1 Automated mandatory bolus vs basal infusion, Outcome 13 Instrumental delivery (PCEA vs No PCEA).
Comparison 1 Automated mandatory bolus vs basal infusion, Outcome 14 Instrumental delivery (nulliparous vs multiparous).

Comparison 1 Automated mandatory bolus vs basal infusion, Outcome 15 Duration of labour in minutes.

Comparison 1 Automated mandatory bolus vs basal infusion, Outcome 16 Duration of labour in minutes (LA + opioids vs LA alone).

Comparison 1 Automated mandatory bolus vs basal infusion, Outcome 17 Duration of labour in minutes (epidural vs CSE).

Comparison 1 Automated mandatory bolus vs basal infusion, Outcome 18 Duration of labour in minutes (PCEA vs no PCEA).
Comparison 1 Automated mandatory bolus vs basal infusion, Outcome 19 Duration of labour in minutes (nulliparous vs multiparous).

Comparison 1 Automated mandatory bolus vs basal infusion, Outcome 20 LA consumption per hour.
Comparison 1 Automated mandatory bolus vs basal infusion, Outcome 21 LA consumption per hour (LA + opioids vs LA alone).

Comparison 1 Automated mandatory bolus vs basal infusion, Outcome 22 LA consumption per hour (epidural vs CSE).

Comparison 1 Automated mandatory bolus vs basal infusion, Outcome 23 LA consumption per hour (PCEA vs no PCEA).

Comparison 1 Automated mandatory bolus vs basal infusion, Outcome 24 LA consumption per hour (nulliparous vs multiparous).
| Automated mandatory bolus versus basal infusion for maintenance of epidural analgesia in labour | |||||
| Patient or population: maintenance of epidural analgesia in labour | |||||
| Outcomes | Anticipated absolute effects* (95% CI) | Relative effect | № of participants | Certainty of the evidence | |
| Risk with basal infusion | Risk with automated mandatory bolus | ||||
| Breakthrough pain | Study population | RR 0.60 | 797 | ⊕⊕⊕⊝ | |
| 333 per 1000 | 200 per 1000 | ||||
| Caesarean delivery | Study population | RR 0.92 | 1079 | ⊕⊕⊝⊝ | |
| 160 per 1000 | 147 per 1000 | ||||
| Instrumental delivery | Study population | RR 0.75 | 1079 | ⊕⊕⊝⊝ | |
| 123 per 1000 | 92 per 1000 | ||||
| Duration of labour in min | The mean duration of labour in min ranged from 186.3 to 690.0 min | MD 10.38 min lower | — | 1079 | ⊕⊕⊕⊝ |
| LA consumption per hour | The mean LA consumption per hour ranged from 3 mg to 21.4 mg | MD 1.08 mg/h lower | — | 1121 | ⊕⊕⊕⊝ |
| *The risk in the intervention group (and its 95% confidence interval) is based on the assumed risk in the comparison group and the relative effect of the intervention (and its 95% CI). | |||||
| GRADE Working Group grades of evidence | |||||
| aDowngraded one level due to considerable statistical heterogeneity for this outcome, i.e. I2 = 69%. | |||||
| Outcome or subgroup title | No. of studies | No. of participants | Statistical method | Effect size |
| 1 Breakthrough pain Show forest plot | 10 | 797 | Risk Ratio (M‐H, Random, 95% CI) | 0.60 [0.39, 0.92] |
| 2 Breakthrough pain (epidural vs CSE) Show forest plot | 10 | 797 | Risk Ratio (M‐H, Random, 95% CI) | 0.60 [0.39, 0.92] |
| 2.1 Epidural | 3 | 313 | Risk Ratio (M‐H, Random, 95% CI) | 0.40 [0.25, 0.64] |
| 2.2 CSE | 7 | 484 | Risk Ratio (M‐H, Random, 95% CI) | 0.71 [0.44, 1.13] |
| 3 Breakthrough pain (PCEA vs no PCEA) Show forest plot | 10 | 797 | Risk Ratio (M‐H, Random, 95% CI) | 0.60 [0.39, 0.92] |
| 3.1 PCEA | 5 | 477 | Risk Ratio (M‐H, Random, 95% CI) | 0.61 [0.35, 1.07] |
| 3.2 No PCEA | 5 | 320 | Risk Ratio (M‐H, Random, 95% CI) | 0.58 [0.30, 1.12] |
| 4 Breakthrough pain (nulliparous vs multiparous) Show forest plot | 9 | 669 | Risk Ratio (M‐H, Random, 95% CI) | 0.62 [0.39, 1.00] |
| 4.1 Nulliparous | 8 | 543 | Risk Ratio (M‐H, Random, 95% CI) | 0.62 [0.33, 1.15] |
| 4.2 Multiparous | 1 | 126 | Risk Ratio (M‐H, Random, 95% CI) | 0.59 [0.38, 0.90] |
| 5 Caesarean delivery Show forest plot | 11 | 1079 | Risk Ratio (M‐H, Random, 95% CI) | 0.92 [0.70, 1.21] |
| 6 Caesarean delivery (LA + opioids vs LA alone) Show forest plot | 11 | 1079 | Risk Ratio (M‐H, Random, 95% CI) | 0.92 [0.70, 1.21] |
| 6.1 LA + opioids | 10 | 952 | Risk Ratio (M‐H, Random, 95% CI) | 0.93 [0.70, 1.24] |
| 6.2 LA alone | 1 | 127 | Risk Ratio (M‐H, Random, 95% CI) | 0.74 [0.27, 2.01] |
| 7 Caesarean delivery (epidural vs CSE) Show forest plot | 11 | 1079 | Risk Ratio (M‐H, Random, 95% CI) | 0.92 [0.70, 1.21] |
| 7.1 Epidural | 5 | 637 | Risk Ratio (M‐H, Random, 95% CI) | 0.78 [0.53, 1.15] |
| 7.2 CSE | 6 | 442 | Risk Ratio (M‐H, Random, 95% CI) | 1.08 [0.73, 1.59] |
| 8 Caesarean delivery (PCEA vs no PCEA) Show forest plot | 11 | 1079 | Risk Ratio (M‐H, Random, 95% CI) | 0.92 [0.70, 1.21] |
| 8.1 PCEA | 7 | 801 | Risk Ratio (M‐H, Random, 95% CI) | 0.98 [0.70, 1.37] |
| 8.2 No PCEA | 4 | 278 | Risk Ratio (M‐H, Random, 95% CI) | 0.81 [0.50, 1.30] |
| 9 Caesarean delivery (nulliparous vs multiparous) Show forest plot | 10 | 951 | Risk Ratio (M‐H, Random, 95% CI) | 0.93 [0.70, 1.25] |
| 9.1 Nulliparous | 9 | 825 | Risk Ratio (M‐H, Random, 95% CI) | 0.92 [0.69, 1.23] |
| 9.2 Multiparous | 1 | 126 | Risk Ratio (M‐H, Random, 95% CI) | 3.0 [0.12, 72.27] |
| 10 Instrumental delivery Show forest plot | 11 | 1079 | Risk Ratio (M‐H, Random, 95% CI) | 0.75 [0.54, 1.06] |
| 11 Instrumental delivery (LA + opioids vs LA alone) Show forest plot | 11 | 1079 | Risk Ratio (M‐H, Random, 95% CI) | 0.80 [0.57, 1.12] |
| 11.1 LA + opioids | 10 | 952 | Risk Ratio (M‐H, Random, 95% CI) | 0.77 [0.54, 1.08] |
| 11.2 LA alone | 1 | 127 | Risk Ratio (M‐H, Random, 95% CI) | 1.97 [0.37, 10.37] |
| 12 Instrumental delivery (epidural vs CSE) Show forest plot | 11 | 1079 | Risk Ratio (M‐H, Random, 95% CI) | 0.80 [0.57, 1.12] |
| 12.1 Epidural | 5 | 637 | Risk Ratio (M‐H, Random, 95% CI) | 0.96 [0.53, 1.74] |
| 12.2 CSE | 6 | 442 | Risk Ratio (M‐H, Random, 95% CI) | 0.59 [0.33, 1.05] |
| 13 Instrumental delivery (PCEA vs No PCEA) Show forest plot | 11 | 1079 | Risk Ratio (M‐H, Random, 95% CI) | 0.80 [0.57, 1.12] |
| 13.1 No PCEA | 4 | 278 | Risk Ratio (M‐H, Random, 95% CI) | 0.98 [0.60, 1.61] |
| 13.2 PCEA | 7 | 801 | Risk Ratio (M‐H, Random, 95% CI) | 0.67 [0.42, 1.05] |
| 14 Instrumental delivery (nulliparous vs multiparous) Show forest plot | 10 | 951 | Risk Ratio (M‐H, Random, 95% CI) | 0.76 [0.54, 1.07] |
| 14.1 Nulliparous | 9 | 825 | Risk Ratio (M‐H, Random, 95% CI) | 0.76 [0.53, 1.08] |
| 14.2 Multiparous | 1 | 126 | Risk Ratio (M‐H, Random, 95% CI) | 0.75 [0.17, 3.22] |
| 15 Duration of labour in minutes Show forest plot | 11 | 1079 | Mean Difference (IV, Random, 95% CI) | ‐10.38 [‐26.73, 5.96] |
| 16 Duration of labour in minutes (LA + opioids vs LA alone) Show forest plot | 11 | 1079 | Mean Difference (IV, Random, 95% CI) | ‐10.38 [‐26.73, 5.96] |
| 16.1 LA + opioids | 10 | 952 | Mean Difference (IV, Random, 95% CI) | ‐12.52 [‐31.87, 6.82] |
| 16.2 Duration of labor in minutes (LA alone) | 1 | 127 | Mean Difference (IV, Random, 95% CI) | 0.0 [‐36.63, 36.63] |
| 17 Duration of labour in minutes (epidural vs CSE) Show forest plot | 11 | 1079 | Mean Difference (IV, Random, 95% CI) | ‐10.38 [‐26.73, 5.96] |
| 17.1 Epidural | 5 | 637 | Mean Difference (IV, Random, 95% CI) | ‐3.04 [‐26.42, 20.34] |
| 17.2 CSE | 6 | 442 | Mean Difference (IV, Random, 95% CI) | ‐32.70 [‐65.20, ‐0.20] |
| 18 Duration of labour in minutes (PCEA vs no PCEA) Show forest plot | 11 | 1079 | Mean Difference (IV, Random, 95% CI) | ‐10.38 [‐26.73, 5.96] |
| 18.1 PCEA | 7 | 801 | Mean Difference (IV, Random, 95% CI) | ‐13.24 [‐20.71, ‐5.76] |
| 18.2 No PCEA | 4 | 278 | Mean Difference (IV, Random, 95% CI) | ‐48.65 [‐129.92, 32.62] |
| 19 Duration of labour in minutes (nulliparous vs multiparous) Show forest plot | 10 | 951 | Mean Difference (IV, Random, 95% CI) | ‐14.38 [‐21.80, ‐6.96] |
| 19.1 Nulliparous | 9 | 825 | Mean Difference (IV, Random, 95% CI) | ‐13.92 [‐23.75, ‐4.10] |
| 19.2 Multiparous | 1 | 126 | Mean Difference (IV, Random, 95% CI) | ‐28.0 [‐76.95, 20.95] |
| 20 LA consumption per hour Show forest plot | 12 | 1121 | Mean Difference (IV, Random, 95% CI) | ‐1.08 [‐1.78, ‐0.38] |
| 21 LA consumption per hour (LA + opioids vs LA alone) Show forest plot | 12 | 1121 | Mean Difference (IV, Random, 95% CI) | ‐1.08 [‐1.78, ‐0.38] |
| 21.1 LA + opioids | 11 | 994 | Mean Difference (IV, Random, 95% CI) | ‐0.75 [‐1.35, ‐0.15] |
| 21.2 LA alone | 1 | 127 | Mean Difference (IV, Random, 95% CI) | ‐9.50 [‐12.55, ‐6.45] |
| 22 LA consumption per hour (epidural vs CSE) Show forest plot | 12 | 1121 | Mean Difference (IV, Random, 95% CI) | ‐1.08 [‐1.78, ‐0.38] |
| 22.1 Epidural | 5 | 637 | Mean Difference (IV, Random, 95% CI) | ‐2.59 [‐4.13, ‐1.05] |
| 22.2 CSE | 7 | 484 | Mean Difference (IV, Random, 95% CI) | ‐0.35 [‐0.80, 0.11] |
| 23 LA consumption per hour (PCEA vs no PCEA) Show forest plot | 12 | 1121 | Mean Difference (IV, Random, 95% CI) | ‐1.08 [‐1.78, ‐0.38] |
| 23.1 PCEA | 7 | 801 | Mean Difference (IV, Random, 95% CI) | ‐1.59 [‐2.58, ‐0.60] |
| 23.2 No PCEA | 5 | 320 | Mean Difference (IV, Random, 95% CI) | ‐0.53 [‐1.58, 0.52] |
| 24 LA consumption per hour (nulliparous vs multiparous) Show forest plot | 11 | 993 | Mean Difference (IV, Random, 95% CI) | ‐0.89 [‐1.55, ‐0.23] |
| 24.1 Nulliparous | 10 | 867 | Mean Difference (IV, Random, 95% CI) | ‐0.83 [‐1.51, ‐0.15] |
| 24.2 Multiparous | 1 | 126 | Mean Difference (IV, Random, 95% CI) | ‐1.80 [‐3.93, 0.33] |