| 1 Mortality at maximal follow‐up Show forest plot | 6 | | Odds Ratio (M‐H, Fixed, 95% CI) | Totals not selected |
|
| 1.1 Colchicine vs placebo | 1 | | Odds Ratio (M‐H, Fixed, 95% CI) | 0.0 [0.0, 0.0] |
| 1.2 Penicillamine vs placebo | 1 | | Odds Ratio (M‐H, Fixed, 95% CI) | 0.0 [0.0, 0.0] |
| 1.3 Steroids vs placebo | 1 | | Odds Ratio (M‐H, Fixed, 95% CI) | 0.0 [0.0, 0.0] |
| 1.4 Ursodeoxycholic acid (high) vs placebo | 1 | | Odds Ratio (M‐H, Fixed, 95% CI) | 0.0 [0.0, 0.0] |
| 1.5 Ursodeoxycholic acid (moderate) vs placebo | 1 | | Odds Ratio (M‐H, Fixed, 95% CI) | 0.0 [0.0, 0.0] |
| 1.6 Vancomycin vs placebo | 1 | | Odds Ratio (M‐H, Fixed, 95% CI) | 0.0 [0.0, 0.0] |
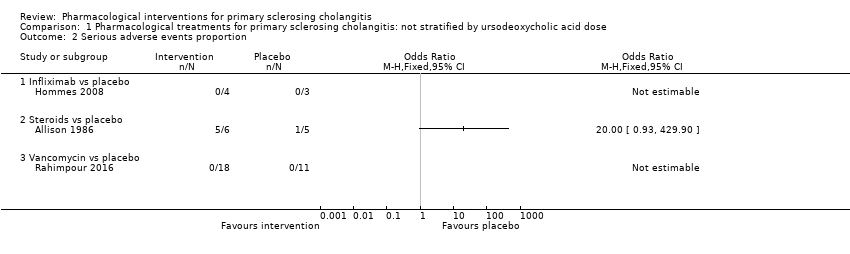
| 2 Serious adverse events proportion Show forest plot | 3 | | Odds Ratio (M‐H, Fixed, 95% CI) | Totals not selected |
|
| 2.1 Infliximab vs placebo | 1 | | Odds Ratio (M‐H, Fixed, 95% CI) | 0.0 [0.0, 0.0] |
| 2.2 Steroids vs placebo | 1 | | Odds Ratio (M‐H, Fixed, 95% CI) | 0.0 [0.0, 0.0] |
| 2.3 Vancomycin vs placebo | 1 | | Odds Ratio (M‐H, Fixed, 95% CI) | 0.0 [0.0, 0.0] |
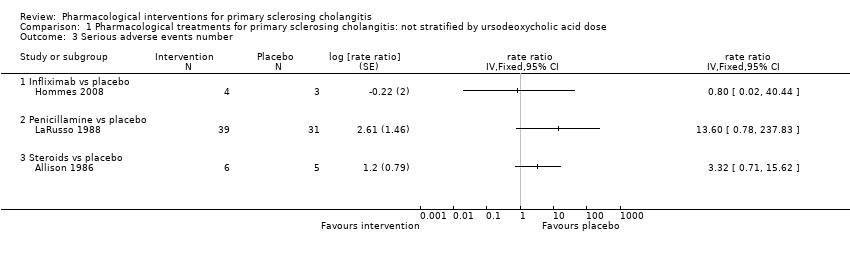
| 3 Serious adverse events number Show forest plot | 4 | | rate ratio (Fixed, 95% CI) | Totals not selected |
|
| 3.1 Infliximab vs placebo | 1 | | rate ratio (Fixed, 95% CI) | 0.0 [0.0, 0.0] |
| 3.2 Penicillamine vs placebo | 1 | | rate ratio (Fixed, 95% CI) | 0.0 [0.0, 0.0] |
| 3.3 Steroids vs placebo | 1 | | rate ratio (Fixed, 95% CI) | 0.0 [0.0, 0.0] |
| 3.4 Ursodeoxycholic acid (high) vs ursodeoxycholic acid (moderate) | 1 | | rate ratio (Fixed, 95% CI) | 0.0 [0.0, 0.0] |
| 3.5 Ursodeoxycholic acid (high) vs ursodeoxycholic acid (low) | 1 | | rate ratio (Fixed, 95% CI) | 0.0 [0.0, 0.0] |
| 3.6 Ursodeoxycholic acid (moderate) vs ursodeoxycholic acid (low) | 1 | | rate ratio (Fixed, 95% CI) | 0.0 [0.0, 0.0] |
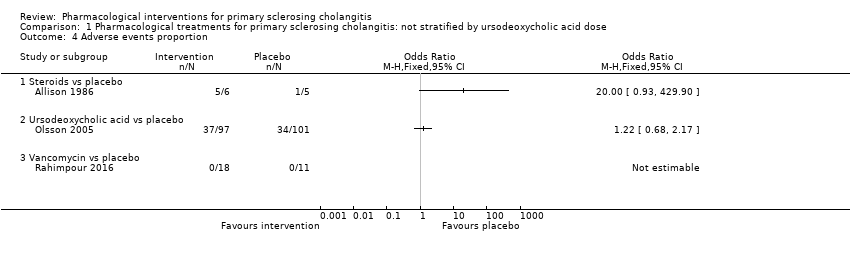
| 4 Adverse events proportion Show forest plot | 3 | | Odds Ratio (M‐H, Fixed, 95% CI) | Totals not selected |
|
| 4.1 Steroids vs placebo | 1 | | Odds Ratio (M‐H, Fixed, 95% CI) | 0.0 [0.0, 0.0] |
| 4.2 Ursodeoxycholic acid (moderate) vs placebo | 1 | | Odds Ratio (M‐H, Fixed, 95% CI) | 0.0 [0.0, 0.0] |
| 4.3 Vancomycin vs placebo | 1 | | Odds Ratio (M‐H, Fixed, 95% CI) | 0.0 [0.0, 0.0] |
| 5 Adverse events number Show forest plot | 6 | | rate ratio (Fixed, 95% CI) | Totals not selected |
|
| 5.1 Cyclosporin vs placebo | 1 | | rate ratio (Fixed, 95% CI) | 0.0 [0.0, 0.0] |
| 5.2 Penicillamine vs placebo | 1 | | rate ratio (Fixed, 95% CI) | 0.0 [0.0, 0.0] |
| 5.3 Steroids vs placebo | 1 | | rate ratio (Fixed, 95% CI) | 0.0 [0.0, 0.0] |
| 5.4 Ursodeoxycholic acid (high) vs ursodeoxycholic acid (low) | 1 | | rate ratio (Fixed, 95% CI) | 0.0 [0.0, 0.0] |
| 5.5 Ursodeoxycholic acid (high) vs ursodeoxycholic acid (moderate) | 1 | | rate ratio (Fixed, 95% CI) | 0.0 [0.0, 0.0] |
| 5.6 Ursodeoxycholic acid (low) plus metronidazole vs ursodeoxycholic acid (low) | 1 | | rate ratio (Fixed, 95% CI) | 0.0 [0.0, 0.0] |
| 5.7 Ursodeoxycholic acid (moderate) vs ursodeoxycholic acid (low) | 1 | | rate ratio (Fixed, 95% CI) | 0.0 [0.0, 0.0] |
| 5.8 Vancomycin vs metronidazole | 1 | | rate ratio (Fixed, 95% CI) | 0.0 [0.0, 0.0] |
| 6 Quality of life Show forest plot | 1 | | Mean Difference (IV, Fixed, 95% CI) | Totals not selected |
|
| 6.1 Ursodeoxycholic acid (moderate) vs placebo | 1 | | Mean Difference (IV, Fixed, 95% CI) | 0.0 [0.0, 0.0] |
| 7 Liver transplantation Show forest plot | 8 | | Odds Ratio (M‐H, Fixed, 95% CI) | Totals not selected |
|
| 7.1 Colchicine vs placebo | 1 | | Odds Ratio (M‐H, Fixed, 95% CI) | 0.0 [0.0, 0.0] |
| 7.2 Penicillamine vs placebo | 1 | | Odds Ratio (M‐H, Fixed, 95% CI) | 0.0 [0.0, 0.0] |
| 7.3 Steroids vs placebo | 1 | | Odds Ratio (M‐H, Fixed, 95% CI) | 0.0 [0.0, 0.0] |
| 7.4 Ursodeoxycholic acid (high) vs placebo | 1 | | Odds Ratio (M‐H, Fixed, 95% CI) | 0.0 [0.0, 0.0] |
| 7.5 Ursodeoxycholic acid (moderate) vs placebo | 1 | | Odds Ratio (M‐H, Fixed, 95% CI) | 0.0 [0.0, 0.0] |
| 7.6 Vancomycin vs placebo | 1 | | Odds Ratio (M‐H, Fixed, 95% CI) | 0.0 [0.0, 0.0] |
| 7.7 Ursodeoxycholic acid (moderate) vs ursodeoxycholic acid (low) | 1 | | Odds Ratio (M‐H, Fixed, 95% CI) | 0.0 [0.0, 0.0] |
| 7.8 Ursodeoxycholic acid (high) vs ursodeoxycholic acid (low) | 1 | | Odds Ratio (M‐H, Fixed, 95% CI) | 0.0 [0.0, 0.0] |
| 7.9 Ursodeoxycholic acid (high) vs ursodeoxycholic acid (moderate) | 1 | | Odds Ratio (M‐H, Fixed, 95% CI) | 0.0 [0.0, 0.0] |
| 7.10 Ursodeoxycholic acid (low) plus metronidazole vs ursodeoxycholic acid (low) | 1 | | Odds Ratio (M‐H, Fixed, 95% CI) | 0.0 [0.0, 0.0] |
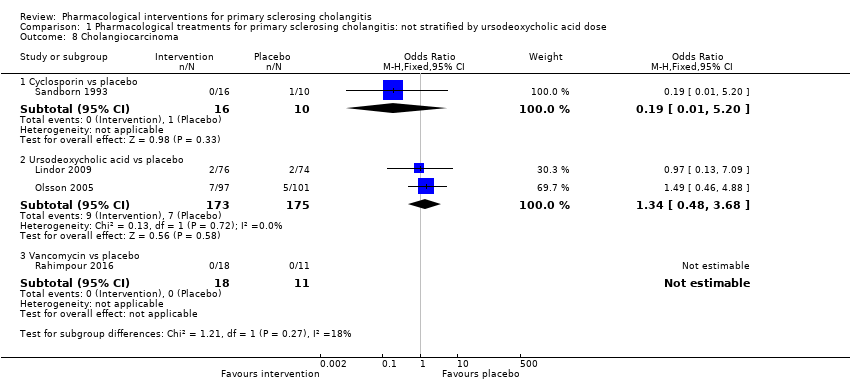
| 8 Cholangiocarcinoma Show forest plot | 4 | | Odds Ratio (M‐H, Fixed, 95% CI) | Totals not selected |
|
| 8.1 Cyclosporin vs placebo | 1 | | Odds Ratio (M‐H, Fixed, 95% CI) | 0.0 [0.0, 0.0] |
| 8.2 Ursodeoxycholic acid (high) vs placebo | 1 | | Odds Ratio (M‐H, Fixed, 95% CI) | 0.0 [0.0, 0.0] |
| 8.3 Ursodeoxycholic acid (moderate) vs placebo | 1 | | Odds Ratio (M‐H, Fixed, 95% CI) | 0.0 [0.0, 0.0] |
| 8.4 Vancomycin vs placebo | 1 | | Odds Ratio (M‐H, Fixed, 95% CI) | 0.0 [0.0, 0.0] |