Intervenciones para mejorar el acceso a los servicios de cirugía de cataratas y la repercusión sobre la igualdad de condiciones en países de ingresos bajos y medios
Referencias
References to studies included in this review
References to studies excluded from this review
Additional references
References to other published versions of this review
Characteristics of studies
Characteristics of included studies [ordered by study ID]
Ir a:
| Methods | Study design: cluster‐RCT Unit of allocation: cluster (screening session) Unit of analysis: individual Intervention period: 10 minutes Sampling: cataract screening was offered by staff from 6 county hospitals travelling to townships and villages within the county. Screening was announced by village officials or local community partners with posters and door‐to‐door notification. Those who attended screening who were ≥ 50 years with vision < 6/18 in either eye suspected from cataract were referred to the county hospital for definitive examination. Information is not provided on how many people were referred. The intervention was randomly allocated to a screening session, and each pair of consecutive screenings consisted of 1 intervention and 1 non‐intervention session. Data collection: at the screening location all participants were administered the same questionnaire in the local dialect. All enrolled participants were given a date for their definitive examination. They were given a referral form with their study identification number to show on presentation. The list of enrolled participants at each hospital was checked against the surgical records (hospitals are required by law to maintain records of all patients undergoing surgery). Loss to follow‐up: 1/6 hospitals failed to follow the intervention protocol and participants enrolled at that centre were excluded from analysis. | |
| Participants | Country, region: Gaungdong Province, China Sample size: 434 adults ≥ 50 years who had visual impairment (categories 1 ‐5 in Table 1) due to cataract in either eye. Participant characteristics: the median age of the intervention group (75 years) was less than that of the control group (76 years; P = 0.01). There was no difference in the proportion of each group that was female (60.4% versus 54.5%) or who had received some formal education (41.4% versus 50.7%). Differences in baseline characteristics: intervention participants were 1 year younger than control 75 vs 76 years P = 0.01 Setting background: all facilities involved in the study were Government‐run, county‐level hospitals, which had a strong working relationship with the Zhongshan Ophthalmic Centre in Guangzhou. In each of the counties the participating facility was the only local provider of cataract surgery. The mean per capita GDP of the six selected counties ranged from USD 4841 to USD 6031, compared to the mean for Guangdong Province of USD 6907 in 2009. | |
| Interventions | All 434 participants attended a screening session, were administered a questionnaire, and a definitive examination at the hospital was scheduled. In addition, intervention participants (n = 212) viewed a 5‐min information video about cataract surgery. The video included an interview with a cataract patient and family members before and after surgery, and followed the process of receiving care from arrival at the hospital, through to the surgery and discharge. Following the video a trained nurse provided groups of 2‐3 participants and their family members with a 5‐min counselling session that followed a script. The counselling consisted of a description of cataract, its impact and its treatment, the out‐of‐pocket cost, and the time and location for an examination at the county hospital; this was followed by the opportunity to ask questions. The control group (n = 222) were given standard care: they were advised they had decreased vision due to cataract and it could be treated, without being shown the video or receiving counselling. | |
| Outcomes | Primary outcome: undergoing cataract surgery in at least one eye Secondary outcome: presenting at the hospital for a definitive exam Length of follow‐up: hospital records were checked > 6 months after the screening (the initial cut‐off period), and again at 11 months (no participants accepted surgery between 6 and 11 months) Outcomes related to harms/unintended effects: not reported | |
| Implementation related factors | Theoretical basis: not reported Process evaluation: not reported Fidelity: not reported (no information on changes to protocol) Who delivered the intervention: reported (no information on how many nurses were used to deliver counselling, though says a script was used) PROGRESS categories assessed at baseline: reported (sex, education, age, floor space of house/resident). PROGRESS categories analysed at outcome: reported but not by intervention arm (same as assessed at baseline). Data were obtained from investigators (see notes below) and subgroup analysis undertaken by place of residence, gender, education, socioeconomic status, and social capital Intervention included strategies to address diversity or disadvantage: undertaken in a rural area Levesque access dimensions included (from Figure 1): providing the information video and counselling contributed to realisation of healthcare needs | |
| Notes | Study period: outreach screening occurred between June and November 2010. Hospital records were checked 6 months after the screening, and again at 11 months. Were trial investigators contacted: yes. We contacted the investigators to request the outcome data disaggregated by the PROGRESS categories used in the logistic regression models reported in the manuscript. These data were provided, and used in the subgroup analysis reported here. Funding source: reported (Helen Keller International, the Starr Foundation, the Swarthmore College Lang Center for Civic and Social Responsibility, and the Chinese government’s Thousand Man Plan program) | |
| Risk of bias | ||
| Bias | Authors' judgement | Support for judgement |
| Random sequence generation (selection bias) | Low risk | Randomisation was carried out by a random number generator (www.random.org) and ensured that each pair of consecutive screenings consisted of one intervention and one non‐intervention session, to minimise any potential confounding effect of season. |
| Allocation concealment (selection bias) | Low risk | Allocation concealment was not clearly specified, however, the unit of allocation was by screening session at the start of the study, as recommended by the EPOC 'Risk of bias' tool (EPOC 2015). |
| Blinding of participants and personnel (performance bias) | Unclear risk | No information was provided on the likelihood of participants in different intervention groups sharing information with one another. |
| Blinding of outcome assessment (detection bias) | Low risk | Obtained from hospital records; review authors do not believe this introduced bias. |
| Incomplete outcome data (attrition bias) | Unclear risk | One of 6 hospitals that began the study failed to follow the intervention protocol and participants enrolled at that centre were excluded from analysis. This loss of clusters was assessed as unclear risk of bias. All remaining participants who did not have surgery or did not attend hospital follow‐up were counted as not attaining these outcomes, so there was no attrition from the remaining 5 centres. |
| Selective reporting (reporting bias) | Unclear risk | No information was provided on whether the reported methods used in the analysis of outcomes were prespecified or not in the manuscript; nor whether there was a difference between the outcomes measured and reported. We obtained the protocol by contacting the study authors. The timeframe of outcome reporting changed from 30 days to 6 months. It was unclear whether this would affect the findings. |
| Recruitment bias (cluster) | Unclear risk | Unclear whether individuals were recruited to the trial after the clusters were randomised |
| Baseline imbalance (cluster) | Unclear risk | The intervention group was slightly younger than the control group, and the logistic regression analysis controls for age, so this was assessed as unclear risk of bias. |
| Methods | Study design: cluster RCT Unit of allocation: cluster (village) Unit of analysis: individual Intervention period: 5 days Sampling: cataract screening took place in 24 towns of Pucheng County. In total 2023 people were screened and 541 were advised to have cataract surgery. Within 3 months 109 of the 541 had presented for surgery. After another 2 months this study commenced, with the 432 who had not sought surgery the target sample recruited by telephone or in person. Of these, 355 (82.2%) were enrolled and were randomly allocated to groups at the village level. Data collection: the 432 participants who had been advised to undergo cataract surgery but had not done so after 5 months were identified by their serial number. They were interviewed by the same person via telephone or in person. The interviews were audiotaped and monitored daily. No information was provided on how data were collected on the outcome of undergoing surgery within 3 months of the interview. Loss to follow‐up: nil | |
| Participants | Country, region: 24 towns in Pucheng County, Shaanxi Province, China Sample size: 355 adults ≥ 50 years who had visual impairment (categories 1‐5 in Table 1) due to cataract in either eye. Participant characteristics: groups did not differ significantly based on age group, sex, education or presenting visual acuity in the worse‐seeing eye Differences in baseline characteristics: the commuting distance to the hospital was shorter for Group 1 compared to the other intervention arms. Setting background: Pucheng County is a moderate income, rural area with a population of 767,678 in 2010. Most people are farmers and the mean per capita income in 2008 was 2355 RMB/person (˜USD 370) (mean in Shaanxi Province was 3136 RMB/person (˜USD 500). The Pucheng County Hospital is Government‐run and the cataract surgical facility is staffed by 2 eye doctors. | |
| Interventions | 1 person (a native Shaanxi speaker) provided the intervention information to all groups. The information was provided 3 times to each group ‐ at the time of screening, then at 2 and 5 days after the screening. Group 1 (n = 86): reminded to use the low‐cost (240 RMB, ˜USD 38) cataract surgery programme at the Pucheng County Hospital; Group 2 (n = 86): offered free cataract surgery at Pucheng County Hospital; Group 3 (n = 90): same as Group 2 plus offered reimbursement of transport costs; Group 4 (n = 93): same as Group 2 plus offered free transport to and from the hospital | |
| Outcomes | Primary outcome: undergoing cataract surgery in at least 1 eye Secondary outcome: ‐ Length of follow‐up: 3 months Outcomes related to harms/unintended effects: not reported | |
| Implementation related factors | Theoretical basis: reported ("the study was designed based on the results of previous studies that evaluated potential barriers to patients undergoing cataract surgery in rural China") Process evaluation: not reported Fidelity: not reported (no information on changes to protocol) Who delivered the intervention: reported (one person, a native Shaanxi speaker, provided the information to all groups) PROGRESS categories assessed at baseline: reported (sex, education, age) PROGRESS categories analysed at outcome: reported but not disaggregated by intervention arm (sex, education, age). Data were requested from study authors but were unavailable (see notes below) Intervention included strategies to address diversity or disadvantage: undertaken in a rural area. Levesque access dimensions included (from Figure 1): providing information of services and reminding participants was contribution to realisation of healthcare needs; providing transport modified ability to reach healthcare resources and providing free surgery modified ability to use healthcare resources. | |
| Notes | Study period: the initial screening took place in November and December 2010. This study commenced 5 months after screening, and the outcome was measured 3 months after the last interview (not stated, possibly June 2011) Were trial investigators contacted: yes. The investigators were contacted to request the outcome data (of accepting surgery) for each intervention arm, disaggregated by the PROGRESS categories assessed at baseline (age, sex, education). They responded to say it was not possible to provide the data. Funding source: reported (Project Vision Charity Foundation, Hong Kong) | |
| Risk of bias | ||
| Bias | Authors' judgement | Support for judgement |
| Random sequence generation (selection bias) | Low risk | Eligible patients were divided randomly into 4 groups at the village level using cluster randomisation. Individuals within the same village were assigned to the same study arm to ensure no interactions with people who were provided a different type of counselling. The randomisation chart was generated using SAS software (SAS Inc, Cary, NC). |
| Allocation concealment (selection bias) | Low risk | Allocation concealment was not clearly specified, however, the unit of allocation was by village and allocation was performed at the start of the study, as recommended by the EPOC 'Risk of bias' tool (EPOC 2015). |
| Blinding of participants and personnel (performance bias) | Unclear risk | No information was provided on the likelihood of participants in different intervention groups sharing information with one another. |
| Blinding of outcome assessment (detection bias) | Low risk | Obtained from hospital records; review authors do not believe this introduced bias. |
| Incomplete outcome data (attrition bias) | Low risk | It appears all enrolled clusters completed the study. All participants who did not have surgery were counted as not having surgery, so there was no attrition. |
| Selective reporting (reporting bias) | Unclear risk | No information was provided on whether the reported methods used in the analysis of outcomes were prespecified or not, nor whether there was a difference between the outcomes measured and reported. |
| Recruitment bias (cluster) | Unclear risk | Unclear whether individuals were recruited to the trial after the clusters were randomised. |
| Baseline imbalance (cluster) | Unclear risk | This was assessed as unclear risk of bias, as 'Group 1' were closer to the Pucheng County Hospital compared to the other 3 groups (P = 0.002 in Table 1 of the study). The study authors state this was unlikely to bias the results. |
EPOC: Cochrane Effective Practice and Organisation of Care
PROGRESS: Place of residence; Race/ethnicity/ culture/ language; Occupation; Gender/sex; Religion; Education; Socio‐economic status; Social capital/networks
RCT: randomised controlled trial
Characteristics of excluded studies [ordered by study ID]
Ir a:
| Study | Reason for exclusion |
| Study design ‐ two cross‐sectional surveys 5 years apart | |
| Study design ‐ interrupted time series but there are only 2 time points (not minimum of 3 required by EPOC) | |
| Study design ‐ interrupted time series but there are only 2 time points (not minimum of 3 required by EPOC) | |
| Outcome of the study was poverty; this study did not measure any of our outcomes of interest | |
| Study design ‐ no measurement taken before the intervention |
EPOC: Cochrane Effective Practice and Organisation of Care

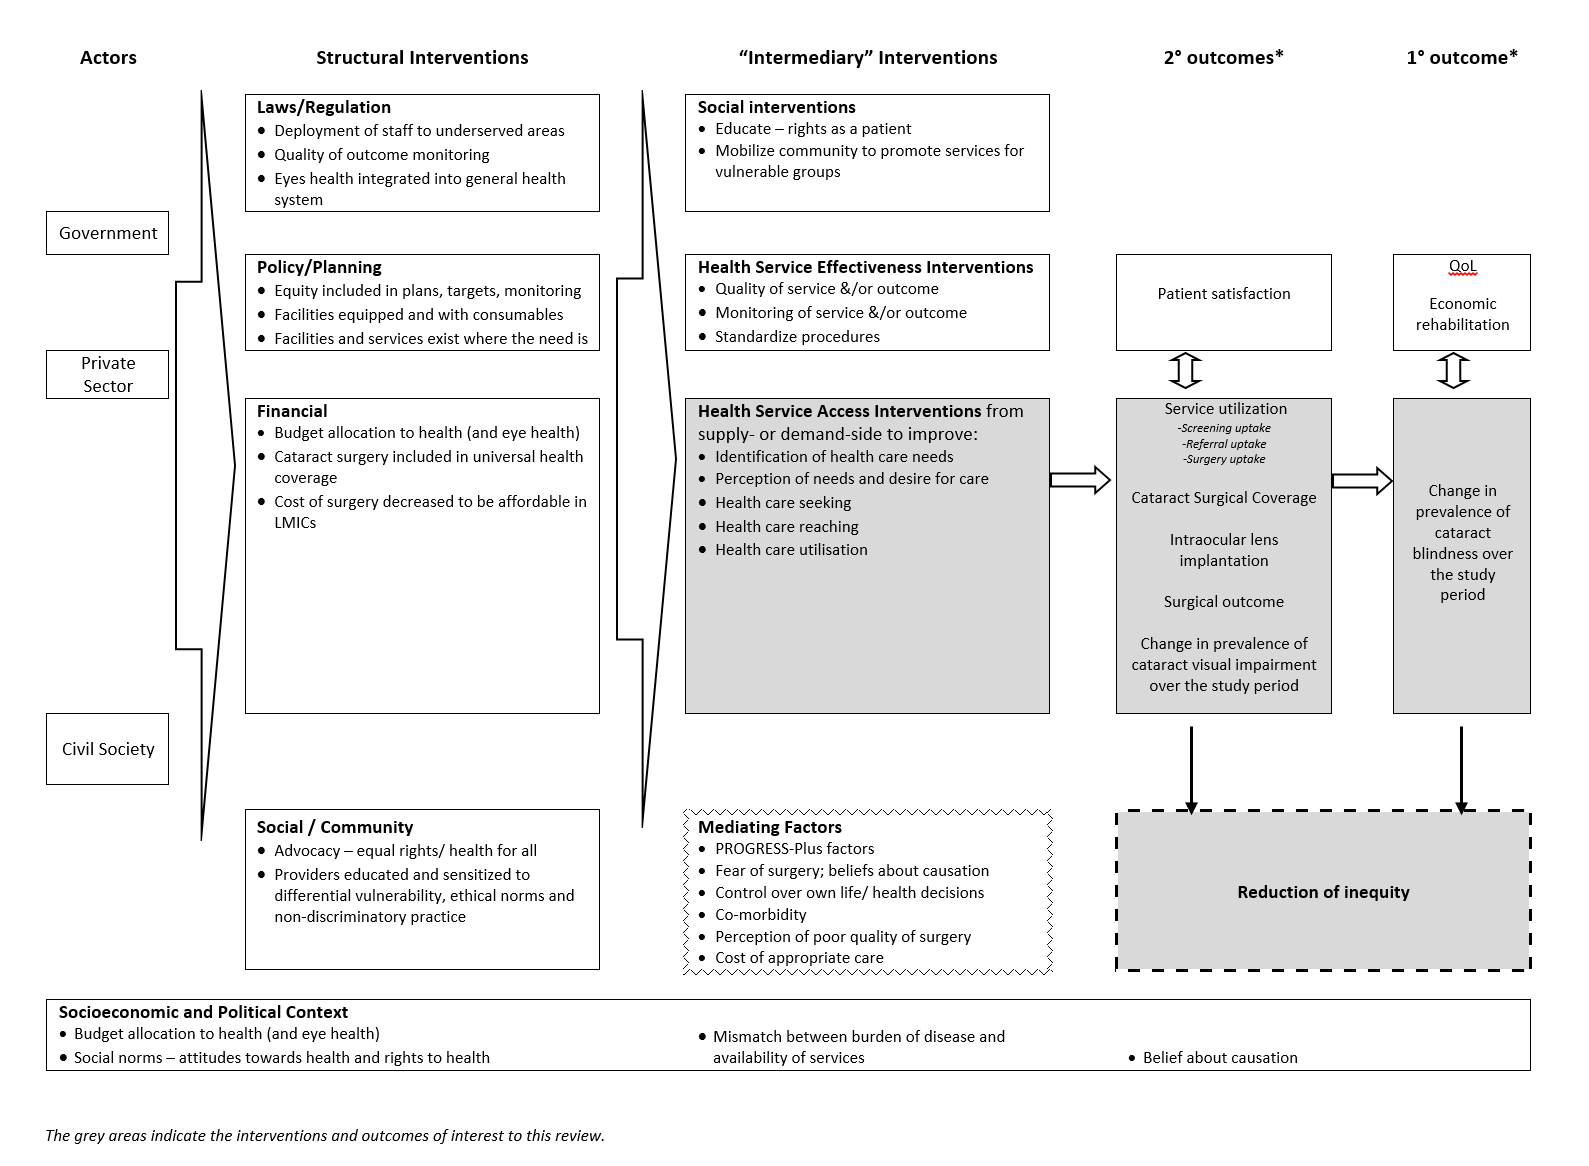
Examples of interventions to improve access to cataract surgical services against Levesque and colleague’s1 conceptual framework of access to health care (Levesque 2013)

Study flow diagram

Risk of bias graph: review authors' judgements about each risk of bias item presented as percentages across all included studies

Risk of bias summary: review authors' judgements about each risk of bias item for each included study
| Information video and counselling to improve access to cataract surgical services compared with standard care for cataract | ||||||
| Patient or population: people with vision impairment caused by cataract Settings: low‐ and middle‐income settings Intervention: information video and counselling* Comparison: standard care | ||||||
| Outcomes | Illustrative comparative risks** (95% CI) | Relative effect | No of participants | Certainty of the evidence | Comments | |
| Assumed risk | Corresponding risk | |||||
| Standard care | Intervention to improve access to cataract surgical services | |||||
| Change in the prevalence of cataract blindness | Not reported | |||||
| Prevalence of visual impairment due to cataract | Not reported | |||||
| Service utilisation: uptake of referral | 400 per 1000 | 407 per 1000 (296 to 527) | OR 1.03 (0.63 to 1.67 | 434 (1) | ⊕⊕⊝⊝ Low1 | |
| Service utilisation: uptake of surgery | 340 per 1000 | 364 per 1000 (257 to 487) | OR 1.11 (0.67 to 1.84 | 434 (1) | ⊕⊕⊝⊝ Low1 | |
| Cataract Surgical Coverage | Not reported | |||||
| Surgical outcome (visual acuity in the operated eye) | Not reported | |||||
| Adverse events | Not reported | |||||
| *In this study, the intervention group (n = 212) watched a five‐minute informational video on cataract and cataract surgery then received a five‐minute counselling session (based on a script) from a trained nurse in groups of two to three, with family members. The control group (n = 222) were given standard care: they were advised they had decreased vision due to cataract and it could be treated, without being shown the video or receiving counselling. **The assumed risk was the risk observed in the control group of this study. The corresponding risk (and its 95% confidence interval) is based on the assumed risk in the comparison group and the relative effect of the intervention (and its 95% CI). | ||||||
| GRADE Working Group grades of evidence | ||||||
| 1We downgraded by one level for imprecision (wide confidence intervals) and one level for indirectness (study was conducted in rural China and may not be applicable to other settings). | ||||||
| Surgery fee waiver with/without transport provision or reimbursement to improve access to cataract surgical services compared with standard care for cataract | ||||||
| Patient or population: people with vision impairment caused by cataract Settings: low‐ and middle‐income settings Intervention: financial incentives and/or reimbursement* Comparison: standard care | ||||||
| Outcomes | Illustrative comparative risks** (95% CI) | Relative effect | No of participants | Certainty of the evidence | Comments | |
| Assumed risk | Corresponding risk | |||||
| Standard care | Intervention to improve access to cataract surgical services | |||||
| Change in the prevalence of cataract blindness | Not reported | |||||
| Prevalence of visual impairment due to cataract | Not reported | |||||
| Service utilisation: uptake of referral | Not reported | |||||
| Service utilisation: uptake of surgery | 150 per 1000 | 291 per 1000 (171 to 497) | RR 1.94 (1.14 to 3.31) | 355 (1) | ⊕⊕⊝⊝ Low1 | |
| Cataract Surgical Coverage | Not reported | |||||
| Surgical outcome (visual acuity in the operated eye) | Not reported | |||||
| Adverse events | ||||||
| * In this study, there were three intervention arms and a comparator arm: we have combined the intervention arms to display the results as there were no differences between them.
**The assumed risk was the risk observed in the control group of this study. The corresponding risk (and its 95% confidence interval) is based on the assumed risk in the comparison group and the relative effect of the intervention (and its 95% CI). | ||||||
| GRADE Working Group grades of evidence | ||||||
| 1We downgraded by one level for imprecision (wide confidence intervals and statistical analysis not adjusted for cluster randomised design) and one level for indirectness (study was conducted in rural China and may not be applicable to other settings). | ||||||
| Category | Presenting distance visual acuity | |
| Worse than: | Equal to or better than: | |
| 0 Mild or no visual impairment | 6/18 | |
| 1 Moderate visual impairment | 6/18 | 6/60 |
| 2 Severe visual impairment | 6/60 | 3/60 |
| 3 Blindness | 3/60 | 1/60* |
| 4 Blindness | 1/60* | light perception |
| 5 Blindness | No light perception | |
| 9 | Undetermined or unspecified | |
| *or counts fingers (CF) at 1 metre | ||
| The term visual impairment comprises categories 1 to 5; blindness comprises categories 3 to 5 (Pascolini 2012). | ||
| Explanatory factors | In which subgroup is the effect hypothesised to be larger |
| Type of intervention | |
| Uni‐faceted versus multi‐faceted | It is hypothesised that multi‐faceted interventions will have a larger effect than uni‐faceted intentions (Chang 2008). |
| Targeted versus universal | It is hypothesised that targeted interventions will produce a larger effect for socially disadvantaged groups than universal interventions; universal interventions may benefit socially advantaged groups more than socially disadvantaged groups, and thereby increase inequity (Lorenc 2013). |
| Supply‐side versus demand‐side | Demand‐side interventions are unlikely to be effective if surgery is not accessible and affordable. Supply‐side interventions might not be effective if there are unaddressed problems with demand. |
| Population characteristics | |
| Gender/sex: | Women have more barriers and less access to cataract surgical services than men (Lewallen 2009). Lack of social support to seek care is a major barrier for women. It is hypothesised that interventions that aim to modify women’s ability to perceive, to seek or to reach care (Figure 1) will produce larger effects for women than men, while universal interventions may produce larger effects for men. |
| SES/education/occupation: | People with low SES/education have more barriers and less access to cataract surgical services than people with higher SES/education (Abubakar 2012; Jadoon 2007; Kuper 2008). It is hypothesised that interventions targeted to low‐SES people (especially in relation to ability to pay in Figure 1) would produce larger effects than for high‐SES people, while universal interventions may produce larger effects for high‐SES. |
| Place of residence: | As services tend to be located in urban areas, rural dwellers tend to have less access to cataract surgical services than urban dwellers (Abubakar 2012; Jadoon 2007). It is hypothesised that interventions that address barriers faced by rural dwellers (such as those relating to availability and accommodation/ability to reach in Figure 1) would produce larger effects for rural dwellers, while other types of interventions may not produce a difference between urban and rural dwellers. |
| SES: socioeconomic status | |
| Number of people | Odds ratio (95% CI) | Test for interaction (P value) | |
| Outcome: uptake of referral | |||
| Place of residence | |||
| < 1 hour from hospital | 225 | 0.86 (0.50 to 1.48) | 0.49 |
| ≥ 1 hour from hospital | 209 | 1.13 (0.65 to 1.95) | |
| Gender | |||
| Men | 185 | 0.77 (0.42 to 1.38) | 0.35 |
| Women | 249 | 1.11 (0.67 to 1.85) | |
| Education | |||
| Received some formal education | 196 | 1.40 (0.80 to 2.47) | 0.09 |
| Received no formal education | 238 | 0.71 (0.42 to 1.21) | |
| Socioeconomic status | |||
| Patient will self‐pay for surgery | 78 | 1.05 (0.42 to 2.62) | 0.81 |
| Patient will not self‐pay for surgery | 356 | 0.93 (0.61 to 1.42) | |
| Higher anticipated loss of income | 246 | 0.89 (0.54 to 1.48) | 0.63 |
| Lower anticipated loss of income | 167 | 1.10 (0.57 to 2.13) | |
| More floor space/resident | 222 | 0.78 (0.45 to 1.33) | 0.28 |
| Less floor space/resident | 212 | 1.19 (0.69 to 2.05) | |
| Social capital | |||
| Family member can accompany to hospital for surgery | 369 | 0.98 (0.65 to 1.49) | 0.66 |
| Family member can not accompany to hospital for surgery | 65 | 0.77 (0.29 to 2.09) | |
| Family member accompanied patient to screening | 188 | 0.95 (0.53 to 1.70) | 0.77 |
| Family member did not accompany patient to screening | 246 | 1.07 (0.63 to 1.82) | |
| Outcome: uptake of surgery | |||
| Place of residence | |||
| < 1 hour from hospital | 225 | 0.63 (0.36 to 1.13) | 0.10 |
| ≥ 1 hour from hospital | 209 | 1.26 (0.71 to 2.22) | |
| Gender | |||
| Men | 185 | 0.88 (0.48 to 1.64) | 0.94 |
| Women | 249 | 0.85 (0.50 to 1.45) | |
| Education | |||
| Received some formal education | 196 | 1.20 (0.67 to 2.15) | 0.17 |
| Received no formal education | 238 | 0.68 (0.39 to 1.19) | |
| Socioeconomic status | |||
| Patient will self‐pay for surgery | 78 | 0.98 (0.37 to 2.59) | 0.80 |
| Patient will not self‐pay for surgery | 356 | 0.85 (0.55 to 1.33) | |
| Higher anticipated loss of income | 246 | 0.85 (0.51 to 1.43) | 0.58 |
| Lower anticipated loss of income | 167 | 1.09 (0.54 to 2.23) | |
| More floor space/resident | 222 | 0.79 (0.44 to 1.40) | 0.57 |
| Less floor space/resident | 212 | 1.00 (0.57 to 1.75) | |
| Social capital | |||
| Family member can accompany to hospital for surgery | 369 | 0.88 (0.57 to 1.36) | 0.86 |
| Family member can not accompany to hospital for surgery | 65 | 0.80 (0.28 to 2.30) | |
| Family member accompanied patient to screening | 188 | 1.05 (0.58 to 1.88) | 0.64 |
| Family member did not accompany patient to screening | 246 | 0.86 (0.48 to 1.53) | |
| Effect measure: odds ratio; analysis model: fixed effects. | |||